

Spatial Distribution and Contamination Level Assessment of Marine Sediment of the Safi Bay (Moroccan Atlantic Coast)


 , ,
, ,
Abstract
:1. Introduction
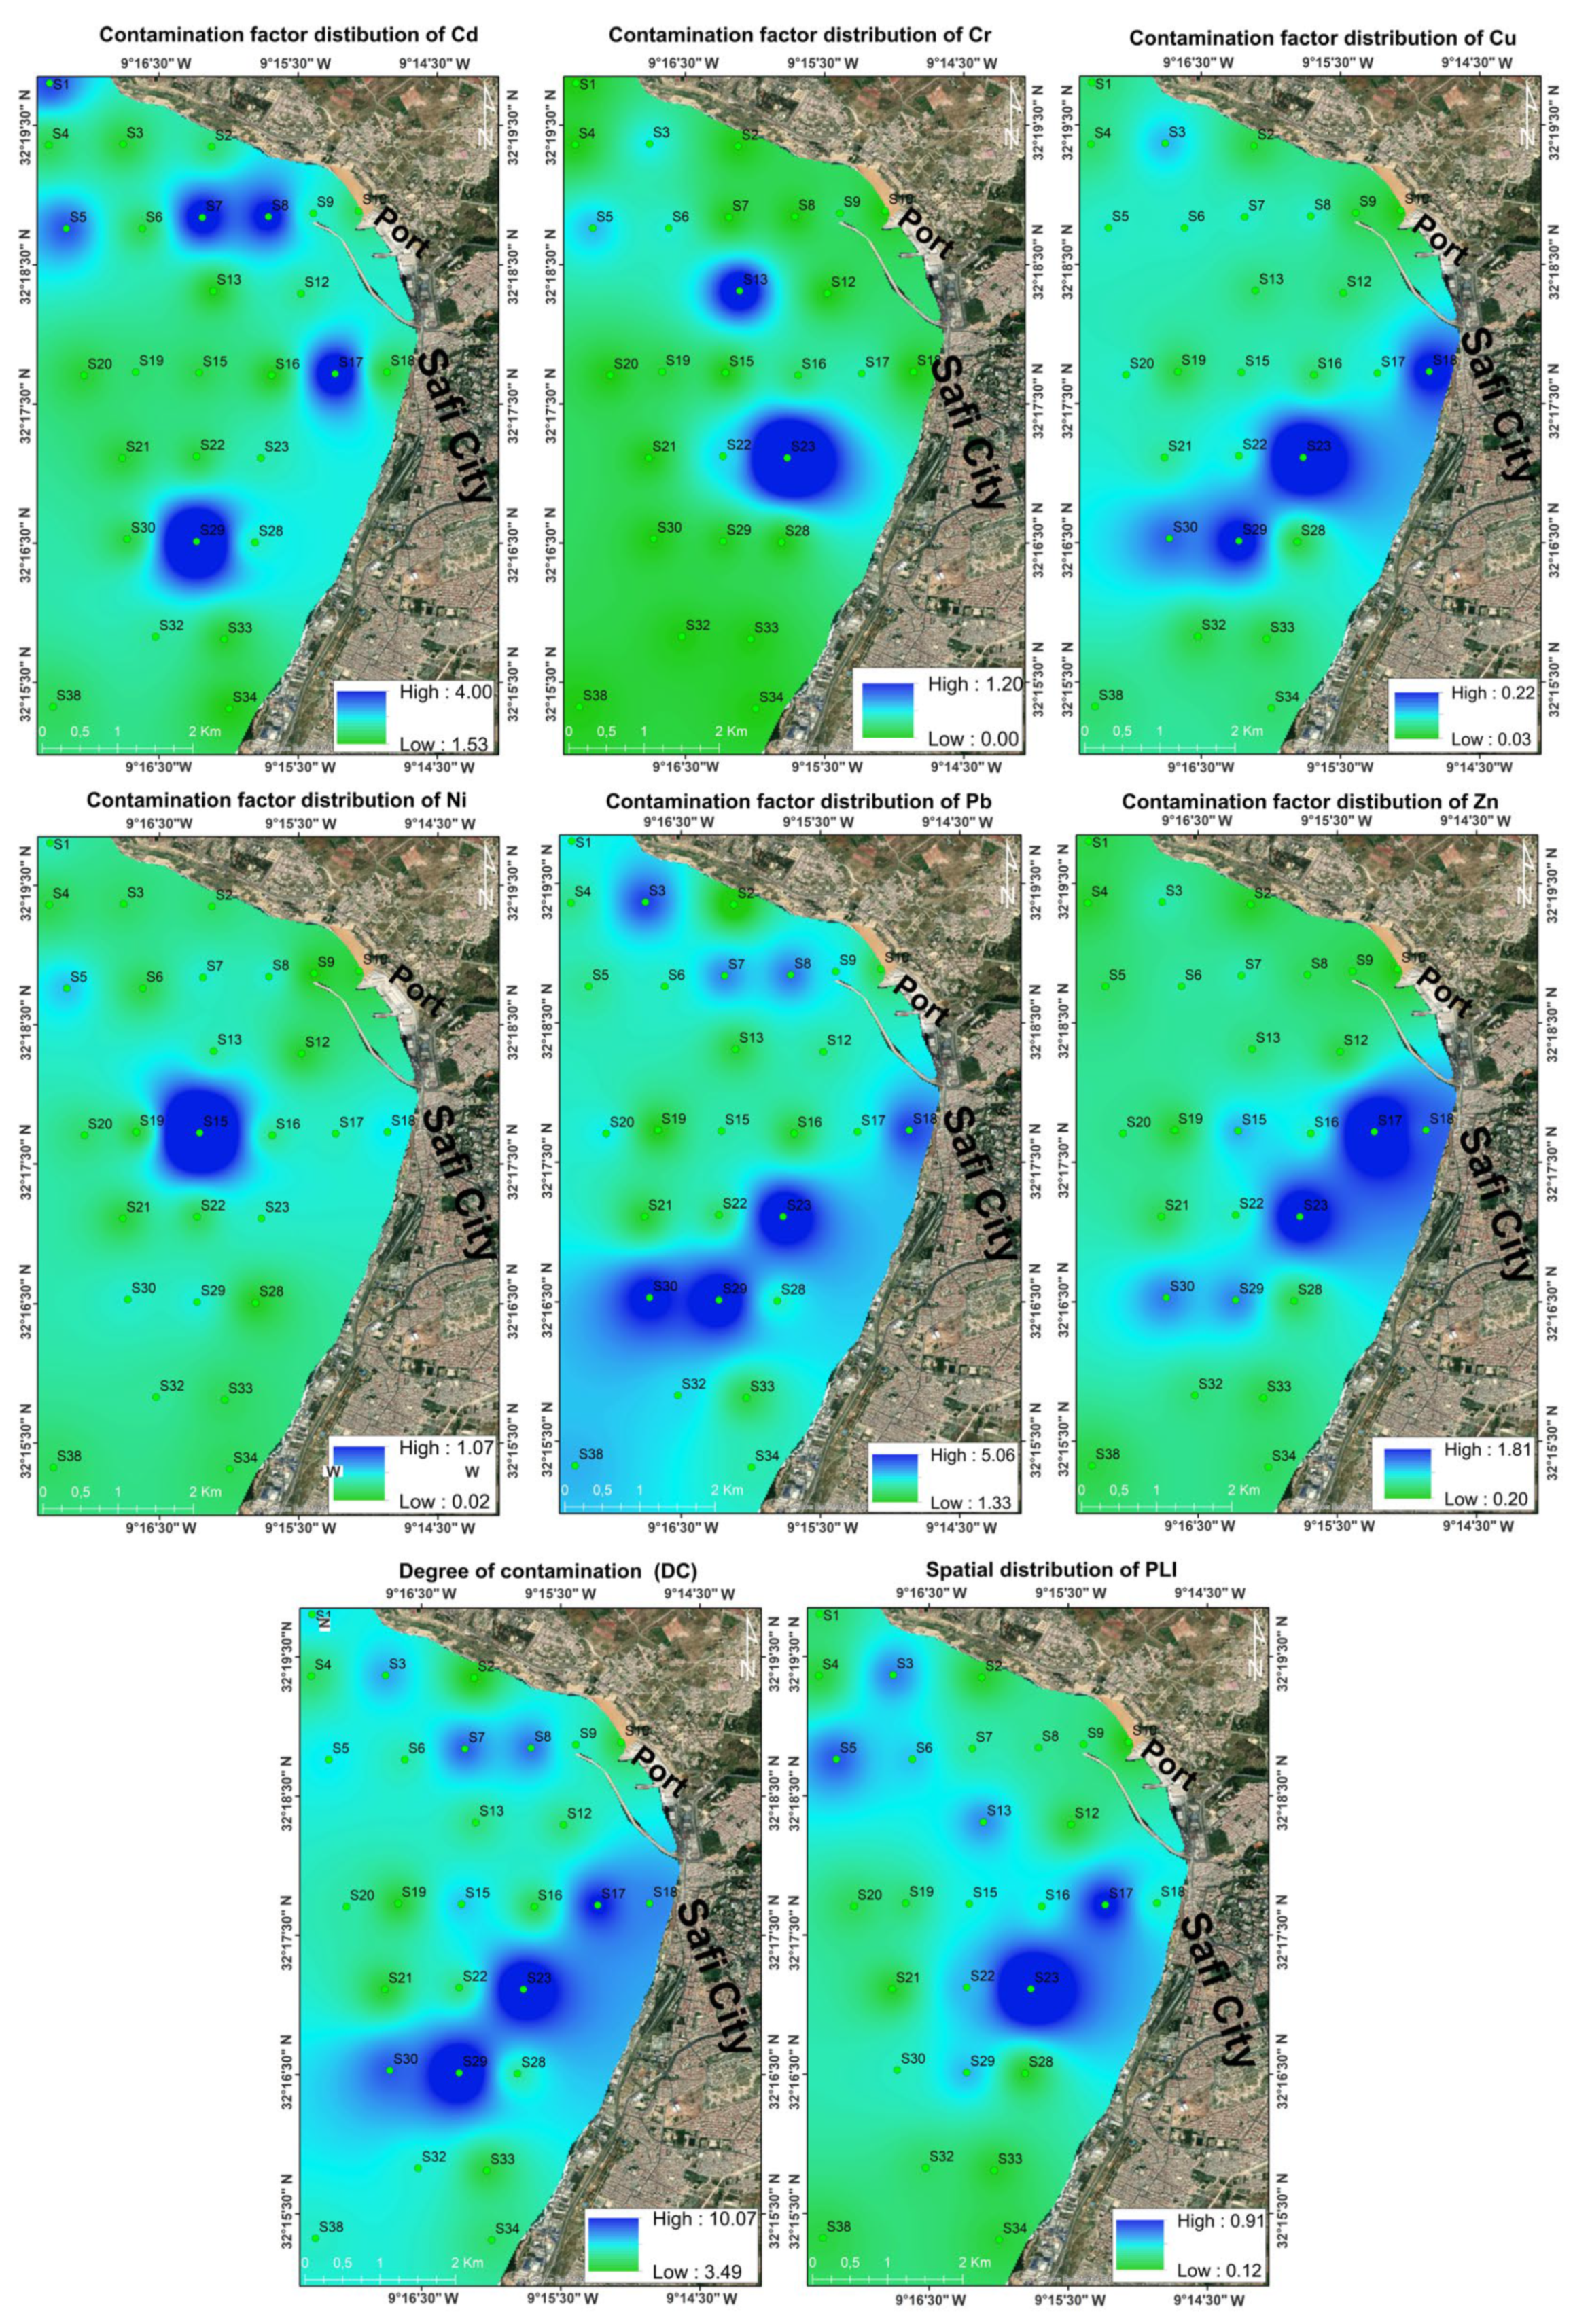
- Analyze and quantify the pollution level by heavy metals in Safi Bay sediment using various environmental indices, including contamination factor (CF), degree of contamination (Cd), index of geo accumulation (Igeo), and pollution load index (PLI).
- Calculate the potential ecological risk of metals detected in the Safi Bay sediment.
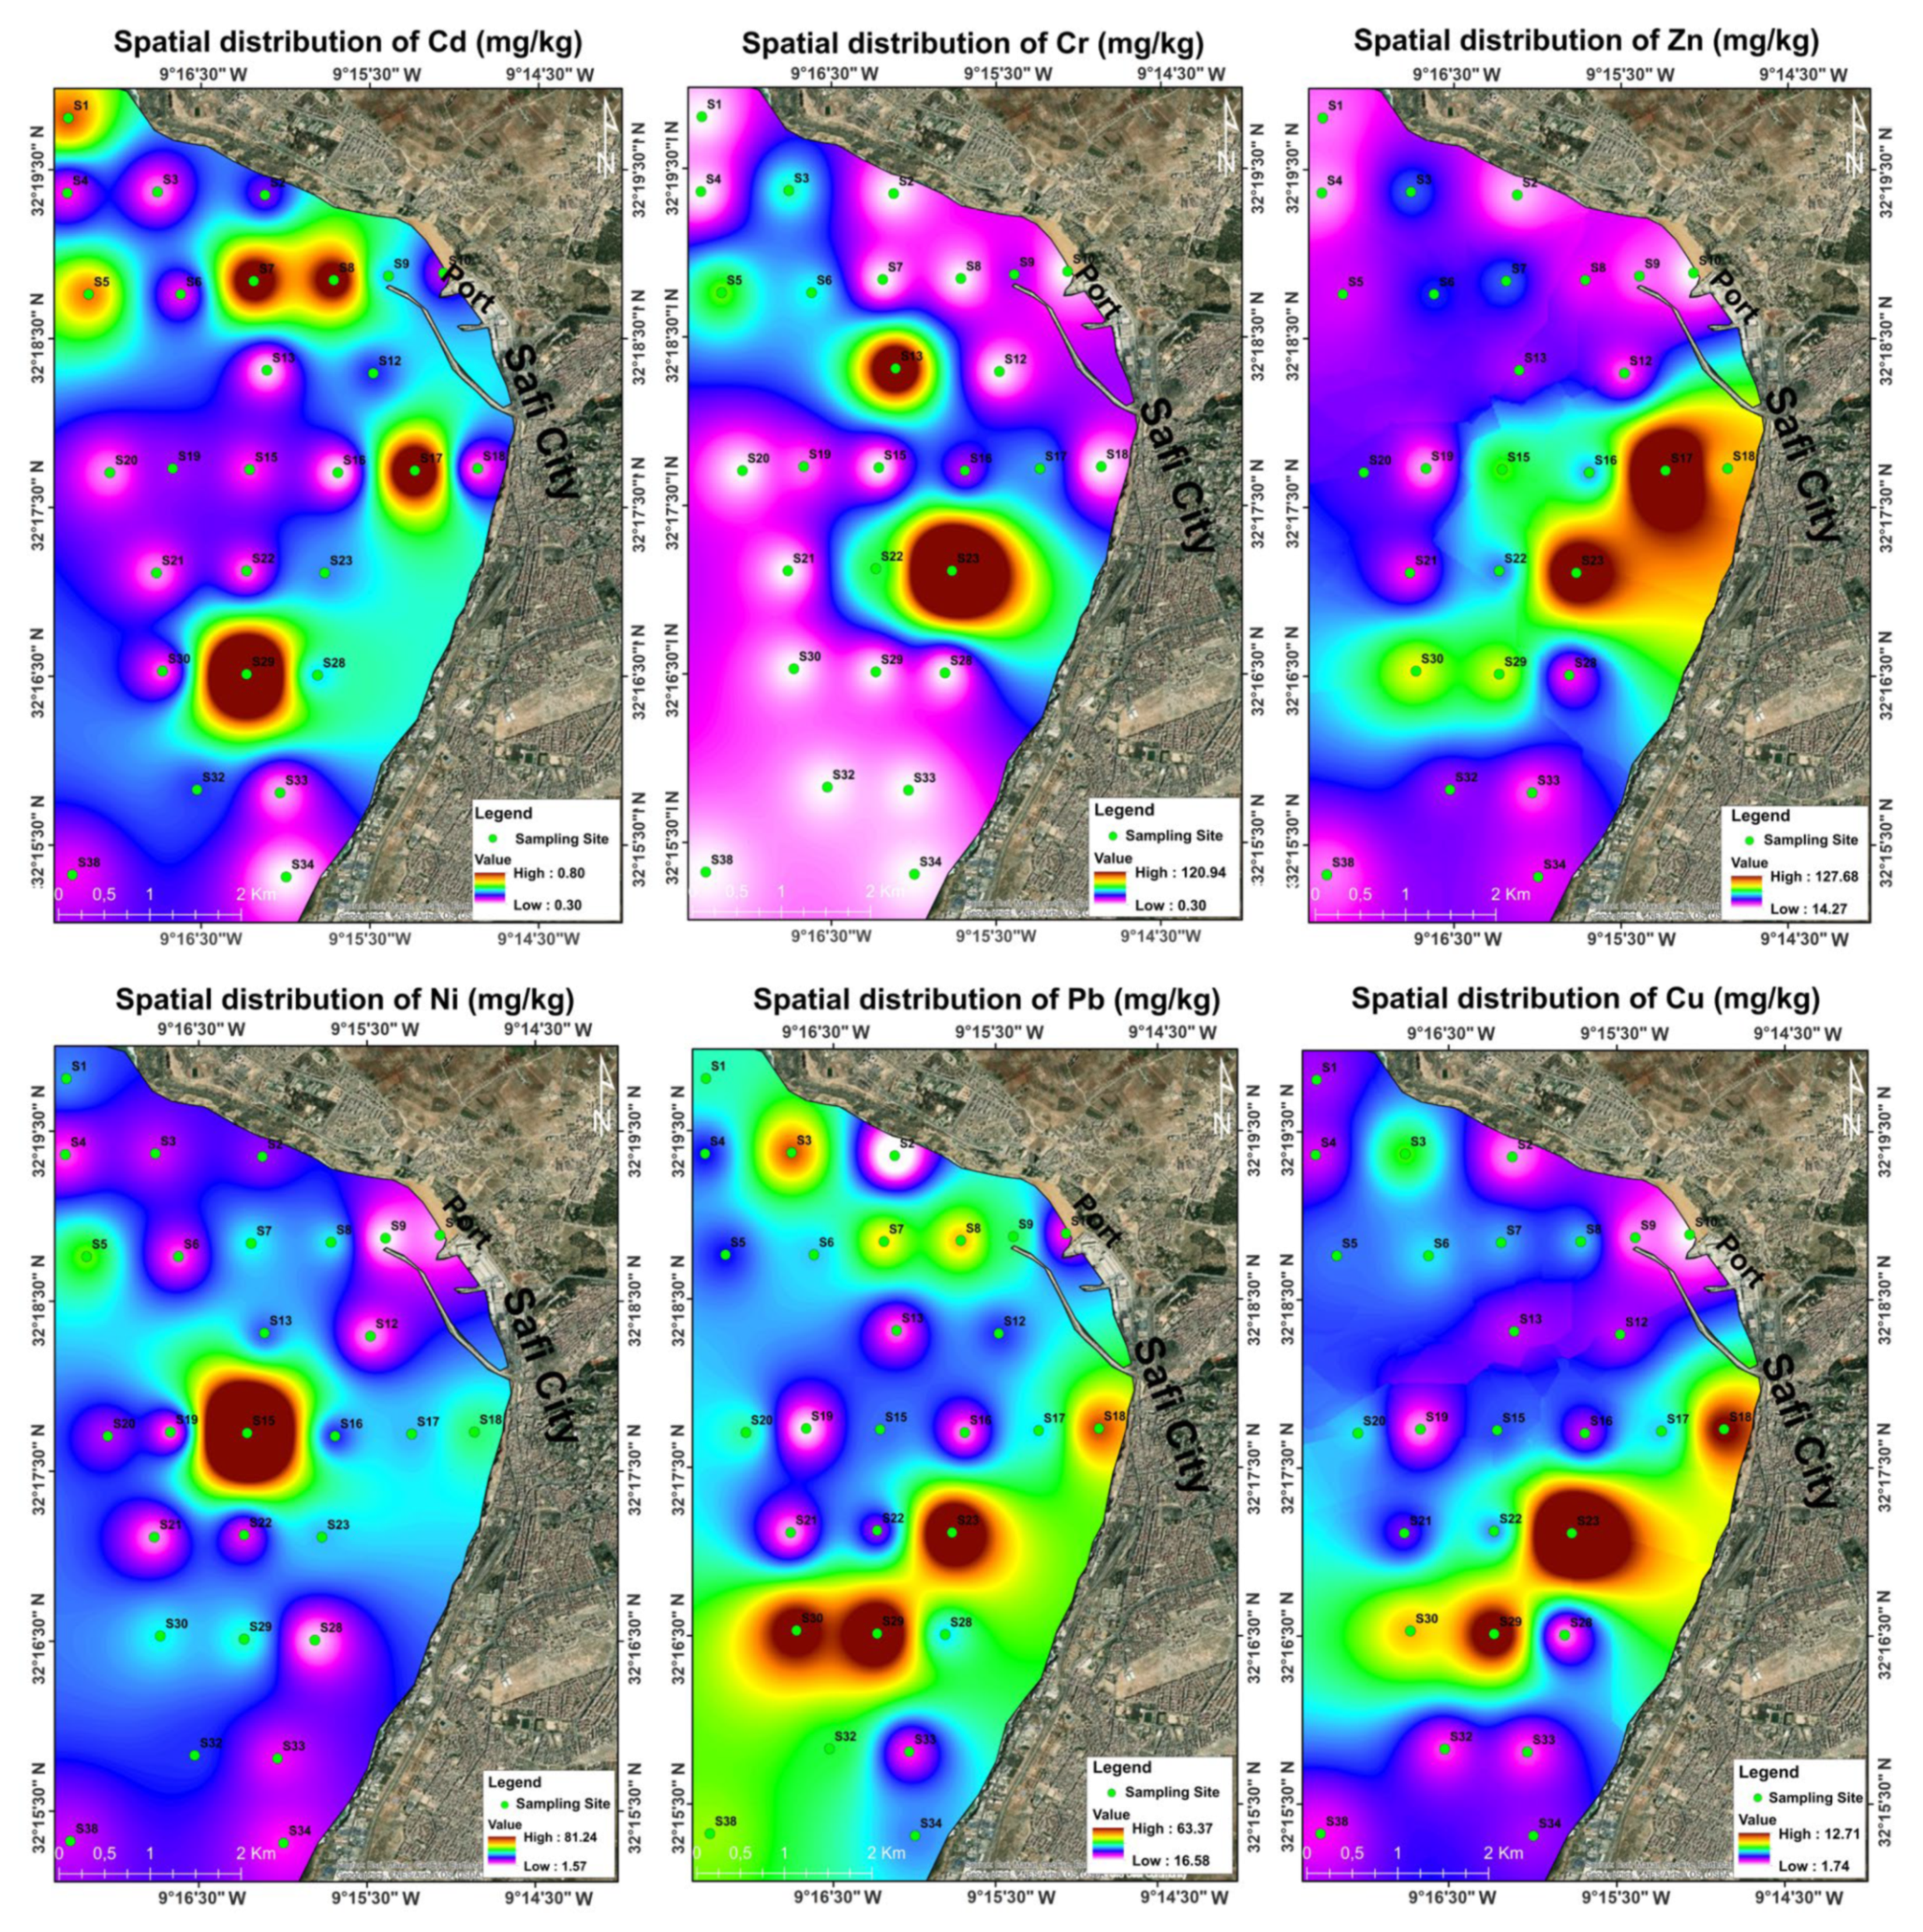
- Establish the spatial distribution of heavy metals in Safi Bay.
- Attempt to define the possible origin of the heavy metals in this coastal environment to allow for the adequate and efficient management of Safi Bay for sustainable socioeconomic and environmental development.
2. Materials and Methods
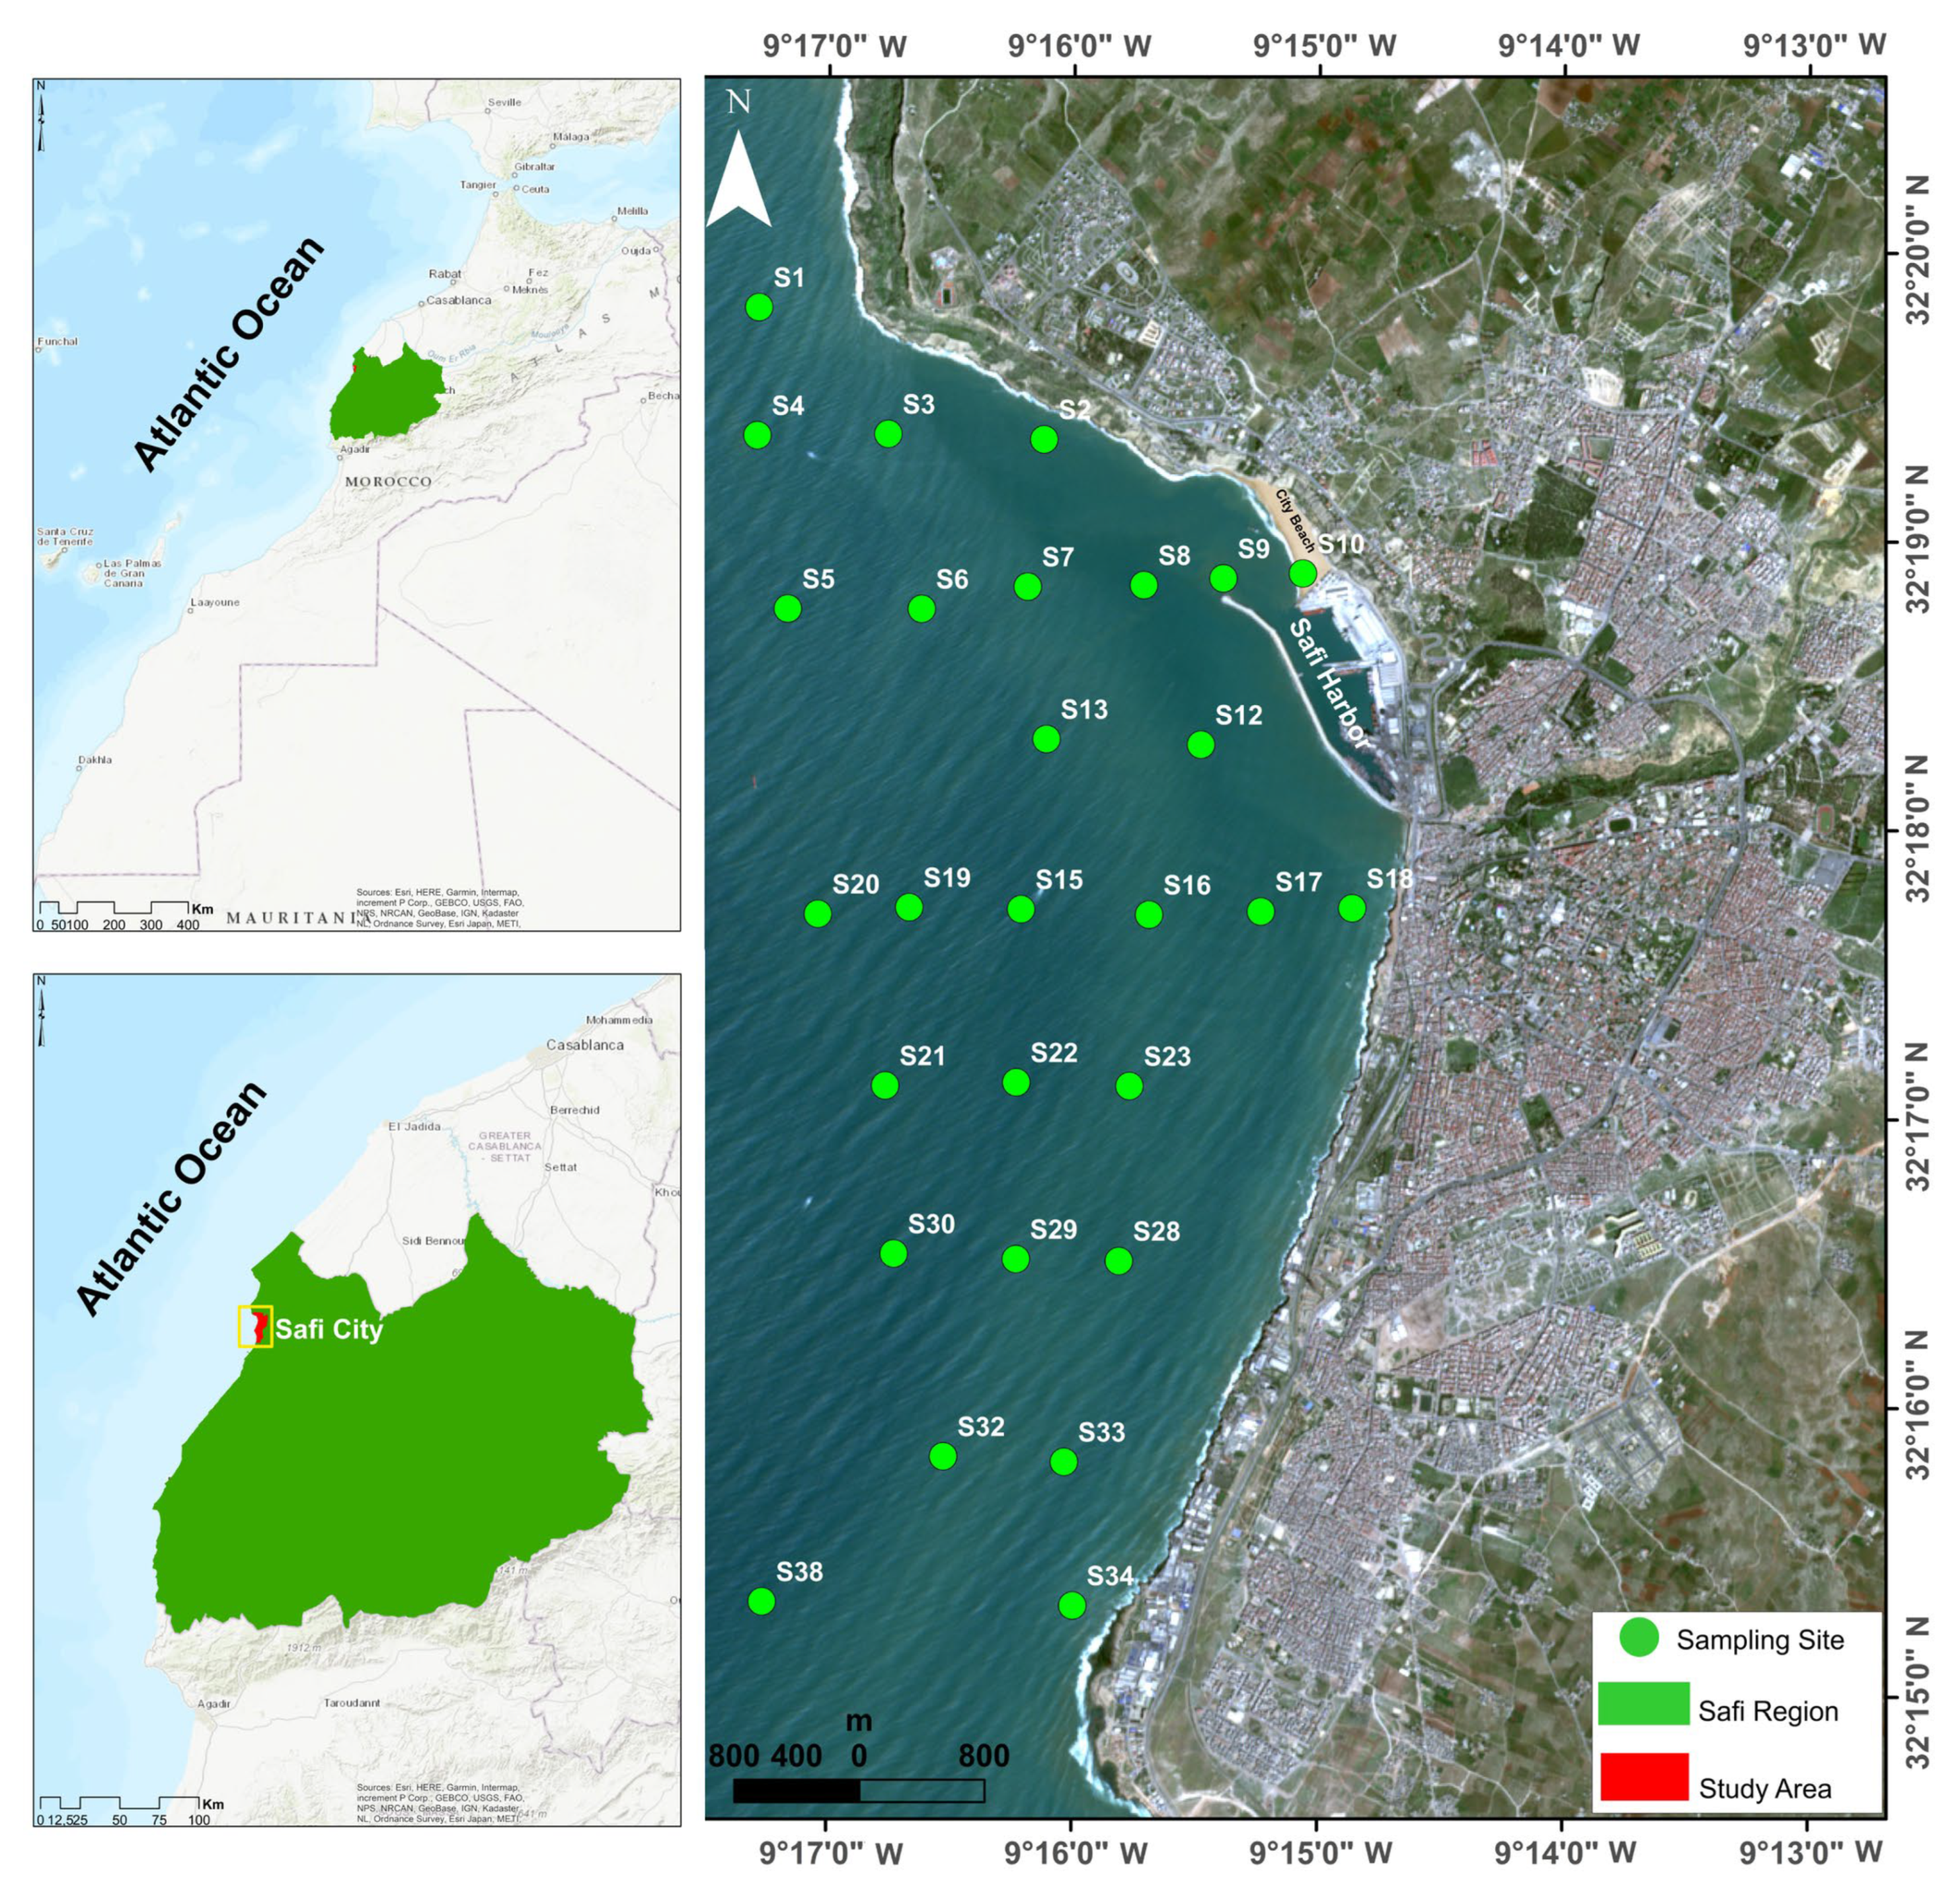
2.1. Study Area
2.2. Sampling
2.3. Heavy Metals Determination
2.4. Statistical Analyses
2.5. Assessment of the Environmental Pollution Degree
2.5.1. Contamination Factor (CF)
2.5.2. Degree of Contamination (DC)
2.5.3. Pollution Load Index (PLI)
- PLI < 1, no metal pollution;
- PLI > 1, polluted condition.
2.5.4. Geo-Accumulation Index (Igeo)
2.5.5. Potential Ecological Risk Index ( and RI)
2.5.6. Sediment Quality Guidelines (SQGs)
3. Results and Discussions
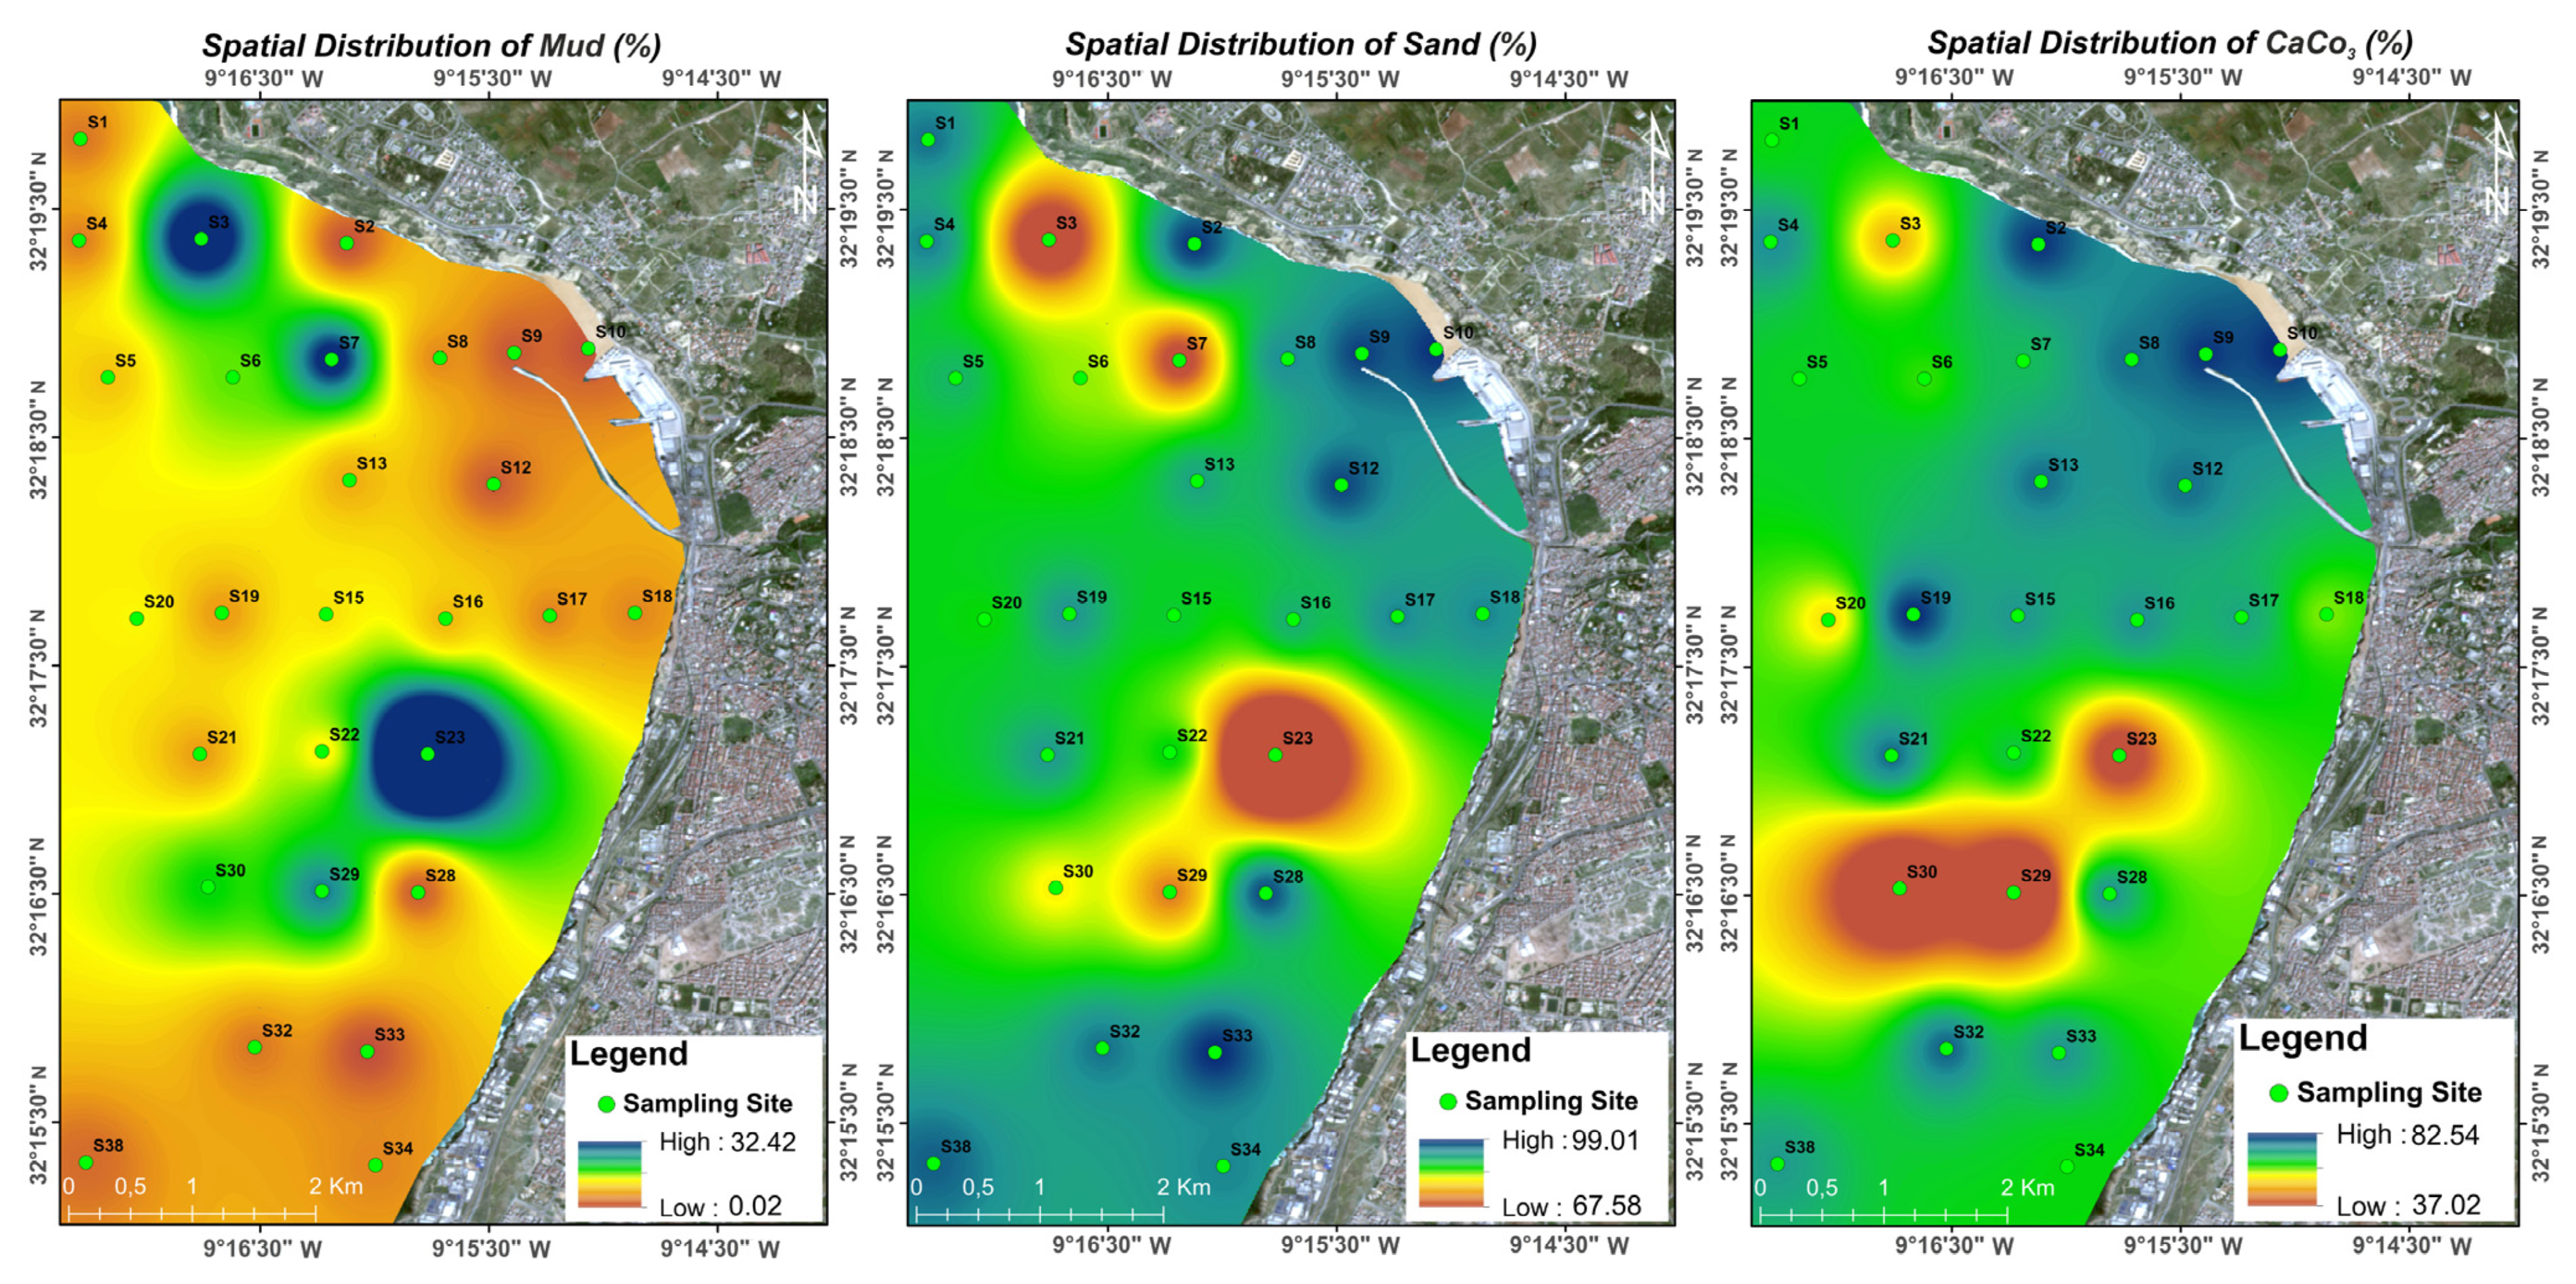
3.1. Spatial Distribution of Sediment Grain Size and CaCO3 Content
3.2. Assessment of the Surface Sediment Contamination by Heavy Metals
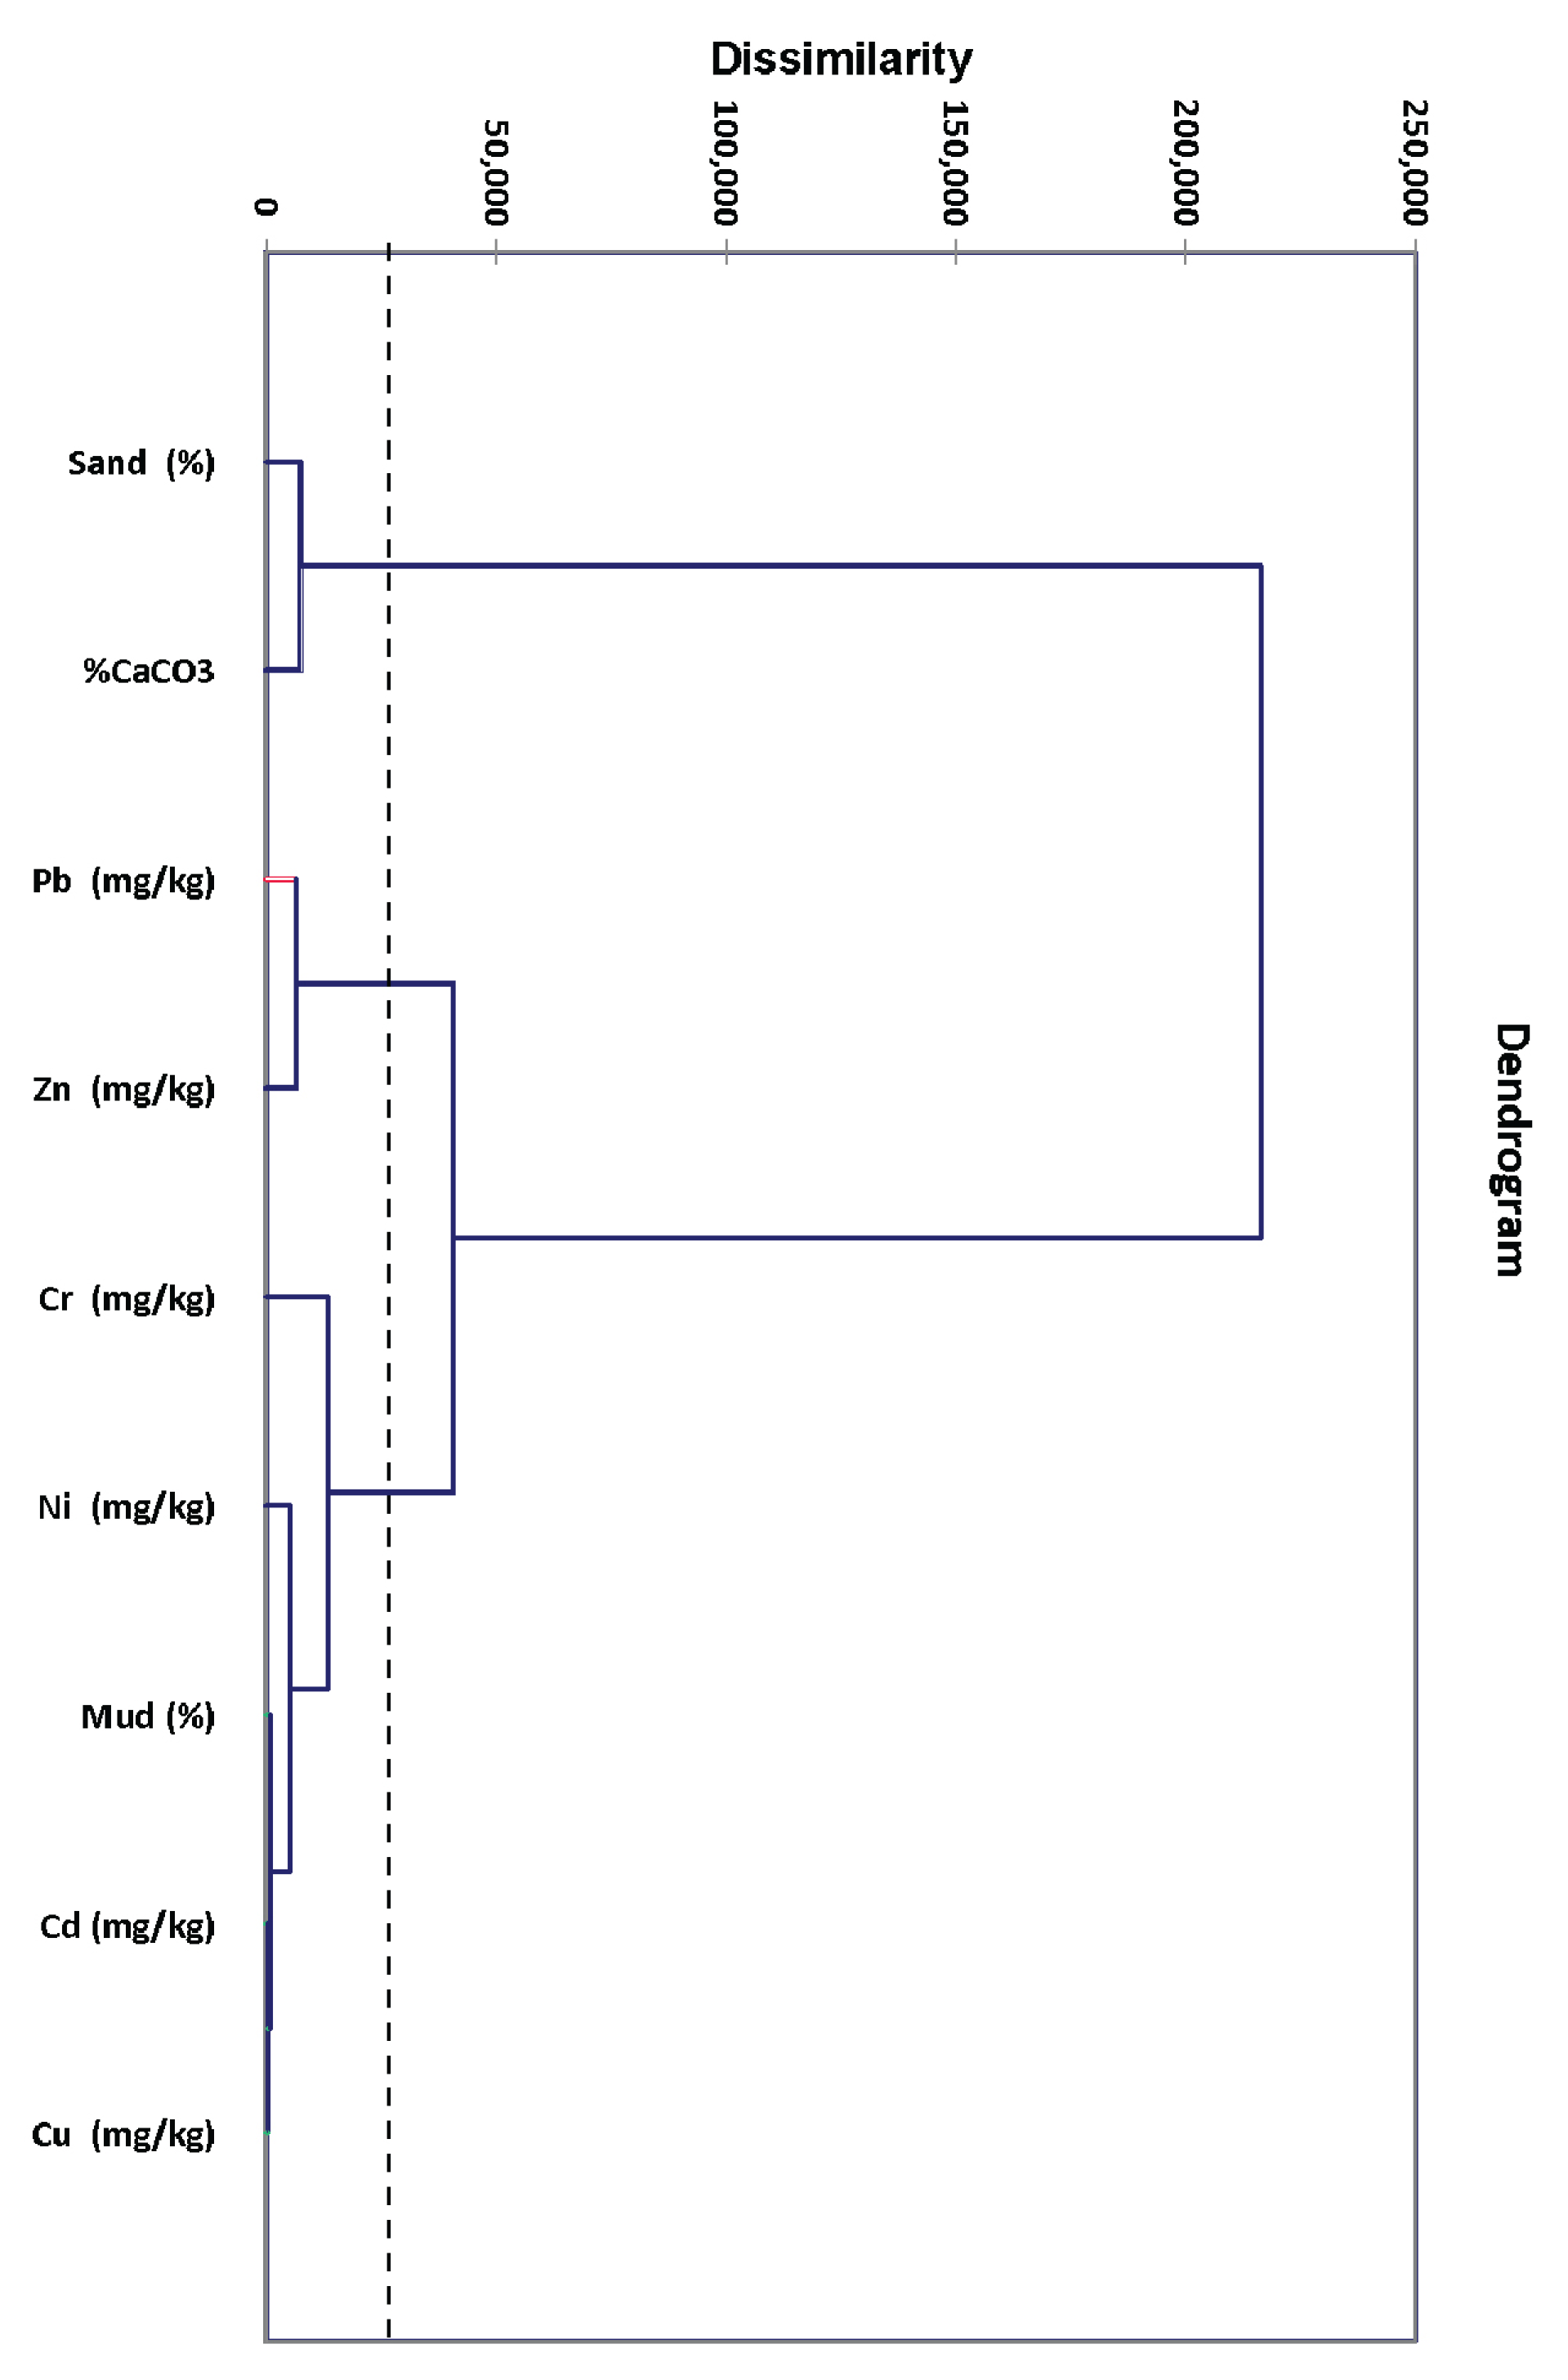
3.3. Correlation among Metals
3.4. Assessment of Heavy Metal Contamination
4. Conclusions
Author Contributions
Funding
Institutional Review Board Statement
Informed Consent Statement
Data Availability Statement
Conflicts of Interest
References
- Varol, M. Assessment of heavy metal contamination in sediments of the Tigris River (Turkey) using pollution indices and multivariate statistical techniques. J. Hazard. Mater. 2011, 195, 355–364. [Google Scholar] [CrossRef] [PubMed]
- Haruna, A.; Uzairu, A.; Harrison, G. Chemical fractionation of trace metals in sewage water-irrigated soils. Int. J. Environ. Res. 2011, 5, 733–744. [Google Scholar]
- Tam, N.; Wong, Y. Spatial variation of heavy metals in surface sediments of Hong Kong Mangrove Swamps. Environ. Pollut. 2000, 110, 195–205. [Google Scholar] [CrossRef] [PubMed]
- Ghaderi, A.; Abduli, M.; Karbassi, A.; Nasrabadi, T.; Khajeh, M. Evaluating the effects of fertilizers on bioavailable metallic pollution of soils, case study of Sistan farms, Iran. Int. J. Environ. Res. 2012, 6, 565–570. [Google Scholar]
- Gao, C.; Lin, Q.; Bao, K.; Zhao, H.; Zhang, Z.; Xing, W.; Wang, G. Historical variation and recent ecological risk of heavy metals in wetland sediments along Wusuli River, Northeast China. Environ. Earth Sci. 2014, 72, 4345–4355. [Google Scholar] [CrossRef]
- Liu, J.; Yin, P.; Chen, B.; Gao, F.; Song, H.; Li, M. Distribution and contamination assessment of heavy metals in surface sediments of the Luanhe River Estuary, northwest of the Bohai Sea. Mar. Pollut. Bull. 2016, 109, 633–639. [Google Scholar] [CrossRef]
- Malvandi, H. Preliminary evaluation of heavy metal contamination in the Zarrin-Gol River sediments, Iran. Mar. Pollut. Bull. 2017, 117, 547–553. [Google Scholar] [CrossRef]
- Anbuselvan, N.; Senthil Nathan, D.; Sridharan, M. Heavy metal assessment in surface sediments off Coromandel Coast of India: Implication on marine pollution. Mar. Pollut. Bull. 2018, 131, 712–726. [Google Scholar] [CrossRef]
- Priya, A.K.; Gnanasekaran, L.; Dutta, K.; Rajendran, S.; Balakrishnan, D.; Soto-Moscoso, M. Biosorption of heavy metals by microorganisms: Evaluation of different underlying mechanisms. Chemosphere 2022, 307, 135957. [Google Scholar] [CrossRef]
- Maanan, M.M.; Saddik, M.; Chaibi, M.; Assobhei, O.; Zourarah, B. Environmental and ecological risk assessment of heavy metals in sediments of Nador lagoon, Morocco. Ecol. Indic. 2014, 48, 616–626. [Google Scholar] [CrossRef]
- Zhang, Z.; Li, J.; Mamat, Z.; Ye, Q. Sources identification and pollution evaluation of heavy metals in the surface sediments of Bortala River. Northwest China. Ecotoxicol. Environ. Saf. 2015, 126, 94–101. [Google Scholar] [CrossRef] [PubMed]
- Ali, M.M.; Ali, M.L.; Islam, M.S.; Rahman, M.Z. Preliminary assessment of heavy metals in water and sediment of Karnaphuli River, Bangladesh. Environ. Nanotechnol. Monit. Manag. 2016, 5, 27–35. [Google Scholar] [CrossRef]
- Mejjad, N.; Laissaoui, A.; Fekri, A.; Benmhammed, A.; El Hammoumi, O.; Cherif, E.K. Does human activities growth lead to biodiversity loss in the Moroccan coastal lagoons? A diagnostic comparison study. In Proceedings of the 4th Edition of International Conference on Geo-IT and Water Resources 2020, Geo-IT and Water Resources 2020, Al-Hoceima, Morocco, 11–12 March 2020. [Google Scholar]
- Yozukmaz, A.; Yabanlı, M. Heavy Metal Contamination and Potential Ecological Risk Assessment in Sediments of Lake Bafa (Turkey). Sustainability 2023, 15, 9969. [Google Scholar] [CrossRef]
- Manav, R.; Uğur Görgün, A.; Filizok, I. Radionuclides (210Po and 210Pb) and some heavy metals in fish and sediments in Lake Bafa, Turkey, and the contribution of 210Po to the radiation dose. Int. J. Environ. Res. Public Health 2016, 13, 1113. [Google Scholar] [CrossRef] [PubMed]
- Antizar-Ladislao, B.; Mondal, P.; Mitra, S.; Sarkar, S.K. Assessment of trace metal contamination level and toxicity in sediments from coastal regions of West Bengal, eastern part of India. Mar. Pollut. Bull. 2015, 101, 886–894. [Google Scholar] [CrossRef]
- Qutu, J.; Junyu, H.; Guanqiong, Y.; George, C. Heavy metal contamination assessment of surface sediments of the East Zhejiang coastal area during 2012–2015. Ecotoxicol. Environ. Saf. 2018, 163, 444–455. [Google Scholar]
- Mejjad, N.; Laissaoui, A.; El-Hammoumi, O.; Fekri, A.; Amsil, H.; El-Yahyaoui, A.; Benkdad, A. Geochemical, radiometric, and environmental approaches for the assessment of the intensity and chronology of metal contamination in the sediment cores from Oualidia lagoon (Morocco). Environ. Sci. Pollut. Res. 2018, 25, 22872–22888. [Google Scholar] [CrossRef]
- Lin, L.; Li, C.; Yang, W.; Zhao, L.; Liu, M.; Li, Q.; Crittenden, J.C. Spatial variations and periodic changes in heavy metals in surface water and sediments of the Three Gorges Reservoir, China. Chemosphere 2020, 240, 124837. [Google Scholar] [CrossRef]
- Hazem, T.A.; Talaat, A.H.; Ibrahim, M.S.; Khalid, M.E. Assessment of Heavy Metals Pollution in Marine Sediments along the Mediterranean Sea, Egypt. J. Geogr. Environ. Earth Sci. Int. 2016, 7, 1–11. [Google Scholar] [CrossRef]
- Vidović, J.; Dolenec, M.; Dolenec, T.; Rožič, P.Ž. Benthic Foraminifera Assemblages as Elemental Pollution Bioindicator in Marine Sediments Around Fish Farm (Vrgada Island, Central Adriatic, Croatia). Mar. Pollut. Bull. 2014, 83, 198–213. [Google Scholar] [CrossRef]
- Zhang, M.; He, P.; Qiao, G.; Huang, J.; Yuan, X.; Li, Q. Heavy metal contamination assessment of surface sediments of the Subei Shoal, China: Spatial distribution, source apportionment and ecological risk. Chemosphere 2019, 223, 211–222. [Google Scholar] [CrossRef] [PubMed]
- Wang, X.S.; Qin, Y.; Sang, S.X. Accumulation and sources of heavy metals in urban topsoils: A case study from the city of Xuzhou, China. Environ. Geol. 2005, 48, 101–107. [Google Scholar] [CrossRef]
- Bat, L.; Özkan, E.Y. Heavy metal levels in sediment of the Turkish Black Sea Coast. In Oceanography and Coastal Informatics: Breakthroughs in Research and Practice; Information Resources Management Association, Ed.; IGI Global: Hershey, PA, USA, 2019; pp. 86–107. [Google Scholar] [CrossRef]
- Jayaprakash, M.; Jonathan, M.P.; Srinivasalu, S.; Muthuraj, S.; Ram-Mohan, V.; Rajeshwara-Rao, N. Acid-leachable trace metals in sediments from an industrialized region (Ennore Creek) of Chennai city, SE coast of India: An approach towards regular monitoring. Estuary Coast. Shelf Sci. 2008, 76, 692–703. [Google Scholar] [CrossRef]
- Muthu Raj, S.; Jayaprakash, M. Distribution and enrichment of trace metals in marine sediments of Bay of Bengal, off Ennore. south-east coast of India. Environ. Geol. 2018, 56, 207–217. [Google Scholar] [CrossRef]
- Gao, X.; Li, P. Concentration and fractionation of trace metals in surface sediments of intertidal Bohai Bay, China. Mar. Pollut. Bull. 2012, 64, 1529–1536. [Google Scholar] [CrossRef]
- Pan, K.; Wang, W.X. Trace metal contamination in estuarine and coastal environments in China. Sci. Total Environ. 2012, 421, 3–16. [Google Scholar] [CrossRef]
- Scheibye, K.; Weisser, J.; Borggaard, O.K.; Larsen, M.M.; Holm, P.E.; Vammen, K.; Christensen, J.H. Sediment baseline study of levels and sources of polycyclic aromatic hydrocarbons and heavy metals in Lake Nicaragua. Chemosphere 2014, 95, 556–565. [Google Scholar] [CrossRef]
- Chen, H.; Chen, R.; Teng, Y.; Wu, J. Contamination characteristics, ecological risk and source identification of trace metals in sediments of the Le’an River (China). Ecotoxicol. Environ. Saf. 2016, 125, 85–92. [Google Scholar] [CrossRef]
- Lu, J.; Li, A.; Huang, P. Distribution, sources and contamination assessment of heavy metals in surface sediments of the south yellow sea and northern part of the east China sea. Mar. Pollut. Bull. 2017, 124, 470–479. [Google Scholar] [CrossRef]
- Liu, Q.; Wang, F.; Meng, F.; Jiang, L.; Li, G.; Zhou, R. Assessment of metal contamination in estuarine surface sediments from Dongying City, China: Use of a modified ecological risk index. Mar. Pollut. Bull. 2018, 126, 293–303. [Google Scholar] [CrossRef]
- Benmhammed, A.; Laissaoui, A.; Mejjad, N.; Ziad, N.; Chakir, E.; Benkdad, A.; Bouh, H.A.; El Yahyaoui, A. Recent pollution records in Sidi Moussa coastal lagoon (western Morocco) inferred from sediment radiometric dating. J. Environ. Radioact. 2021, 227, 106464. [Google Scholar] [CrossRef]
- Madadi, R.; Mejjad, N.; De-la-Torre, G.E. Geochemical speciation, ecological risk, and source identification of heavy metal(loid)s in sediments and waters from Musa Estuary, Persian Gulf. Mar. Pollut. Bull. 2023, 190, 114836. [Google Scholar] [CrossRef]
- Zahra, A.; Hashmi, M.Z.; Malik, R.N.; Ahmed, Z. Enrichment and geoaccumulation of heavy metals and risk assessment of sediments of Kurang Nallah-feeding tributary of the Rawal Lake reservoir, Pakistan. Sci. Total Environ. 2014, 470–471, 925–933. [Google Scholar] [CrossRef]
- Jiang, X.; Teng, A.; Xu, W.; Liu, X. Distribution and pollution assessment of heavy metals in surface sediments in the Yellow Sea. Mar. Pollut. Bull. 2014, 83, 366–375. [Google Scholar] [CrossRef]
- Mejjad, N.; Rovere, M. Understanding the impacts of blue economy growth on deep-sea ecosystem services. Sustainability 2021, 13, 12478. [Google Scholar] [CrossRef]
- Kouali, H.; Chaouti, A.; Achtak, H.; Elkalay, K.; Dahbi, A. Contamination and ecological risk assessment of trace metals in surface sediments from coastal areas (El Jadida, Safi and Essaouira) along the Atlantic coast of Morocco. J. Afr. Earth Sci. 2022, 186, 104417. [Google Scholar] [CrossRef]
- Rafiq, F.; Techetach, M.; Achtak, H.; Boundir, Y.; Kouali, H.; Sisouane, M.; Mandri, B.; Cherifib, O.; Dahbi, A. First assessment of domestic and industrial effluents impact on intertidal zone of Safi coastline (west of Morocco): Physicochemical characteristics and metallic trace contamination. Desalin. Water Treat. 2022, 245, 167–177. [Google Scholar] [CrossRef]
- Minoubi, A.; El Khalidi, K.; Chaibi, M.; Zourarah, B.; Ayt Ougougdal, M.; Poizot, E.; Mear, Y. Impact des ouvrages portuaires sur l’évolution du trait de côte de la baie de Safi (littoral atlantique-Maroc). Rev. Marocaine Géomorphol. 2018, 2018, 18–35. [Google Scholar]
- Zakarya, E. La Houle et Son Impact sur le Littoral Atlantique Marocain, Approche par Modélisation. Ph.D. Thesis, Université de Paris IV, Paris, France, 1994. [Google Scholar]
- Charrouf, L. Les Problèmes d’Ensablement des Ports Marocains sur la Façade Atlantique: Leur Impact Sédimentologique sur le Littoral. Ph.D. Thesis, Université de Paris-Sud, Centre Scientifique d’Orsay, Bures-sur-Yvette, France, 1989. [Google Scholar]
- Cirac, P.; Faugeres, J.C.; Gayet, J. Résultats préliminaire d’une reconnaissance sédimentaire du plateau atlantique marocain. Bull. l’Inst. Géol. 1979, 25, 69–81. [Google Scholar]
- Mathieu, R. Sédiments et Foraminifères Actuels de la Marge Continentale Atlantique du Maroc. Ph.D. Thesis, Université de Pierre et Marie Curie, Paris, France, 1986. [Google Scholar]
- Folk, R.L.; Ward, W.C. A Study in the Significance of Grain-Size Parameters. J. Sediment. Petrol. 1957, 27, 3–26. [Google Scholar] [CrossRef]
- Allen, S.E.; Grimshaw, H.M.; Rowland, A.P. Chemical analysis. In Methods in Plant Ecology; Moore, P.D., Chapman, S.B., Eds.; Blackwell Scientific Publication: Hoboken, NJ, USA, 1986; pp. 285–344. [Google Scholar]
- Li, G.; Hu, B.; Bi, J.; Leng, Q.; Xiao, C.; Yang, Z. Heavy metals distribution and contamination in surface sediments of the coastal Shandong Peninsula (Yellow Sea). Mar. Pollut. Bull. 2013, 76, 420–426. [Google Scholar] [CrossRef] [PubMed]
- Remeikaitė-Nikienė, N.; Garnaga-Budrė, G.; Lujanienė, G.; Jokšas, K.; Stankevičius, A.; Malejevas, V.; Barisevičiūtė, R. Distribution of metals and extent of contamination in sediments from the south-eastern Baltic Sea (Lithuanian zone). Oceanologia 2018, 60, 193–206. [Google Scholar] [CrossRef]
- Elsagh, A.; Jalilian, H.; Aslshabestari, M.G. Evaluation of heavy metal pollution in coastal sediments of Bandar Abbas, the Persian Gulf, Iran: Mercury pollution and environmental geochemical indices. Mar. Pollut. Bull. 2021, 167, 112314. [Google Scholar] [CrossRef] [PubMed]
- Ferreira, S.L.; da Silva Junior, J.B.; dos Santos, I.F.; de Oliveira, O.M.; Cerda, V.; Queiroz, A.F. Use of pollution indices and ecological risk in the assessment of contamination from chemical elements in soils and sediments–Practical aspects. Trends Environ. Anal. Chem. 2022, 35, e00169. [Google Scholar] [CrossRef]
- Muller, G. Index of geoaccumulation in the sediments of the Rhine River. GeoJournal 1969, 2, 108–118. [Google Scholar]
- Hokanson, L. Ecological risk index for aquatic pollution control, a sedimentological approach. Water Res. 1980, 14, 975–1001. [Google Scholar] [CrossRef]
- Salomons, W.; Forstner, U. Metals in the Hydrocycle; eBook; Springer: Berlin/Heidelberg, Germany; Tokyo, Japan, 1984. [Google Scholar] [CrossRef]
- Sakan, S.M.; Djordjevic, D.S.; Manojlovic, D.D.; Polic, P.S. Assessment of heavy metal pollutants accumulation in the Tisza river sediments. J. Environ. Manag. 2009, 90, 3382–3390. [Google Scholar] [CrossRef]
- Sekabira, K.; Oryem Origa, H.; Basamba, T.; Mutumba, G.; Kakudidi, E. Assessment of heavy metal pollution in the urban stream sediments and its tributaries. Int. J. Environ. Sci. Technol. 2010, 7, 435–446. [Google Scholar] [CrossRef]
- Abrahim, G.; Parker, R. Assessment of heavy metal enrichment factors and the degree of contamination in marine sediments from Tamaki estuary, Auckland, New Zealand. Environ. Monit. Assess. 2008, 136, 227–238. [Google Scholar] [CrossRef]
- Tomlinson, D.L.; Wilson, J.G.; Harris, C.R.; Jeffrey, D.W. Problems in the assessment of heavy-metal levels in estuaries and the formation of a pollution index. Helgol. Meeresunters. 1980, 33, 566–575. [Google Scholar] [CrossRef]
- Suresh, G.; Sutharsan, P.; Ramasamy, V.; Venkatachalapathy, R. Assessment of spatial distribution and potential ecological risk of the heavy metals in relation to granulometric contents of Veeranam lake sediments, India. Ecotoxicol. Environ. Saf. 2012, 84, 117–124. [Google Scholar] [CrossRef]
- Stoffers, P.; Glasby, G.P.; Wilson, C.J.; Davis, K.R.; Walter, P. Heavy metal pollution in Wellington Harbour. N. Z. J. Mar. Freshw. Res. 1986, 20, 495–512. [Google Scholar] [CrossRef]
- Förstner, U.; Ahlf, W.; Calmano, W.; Kersten, M. Sediment Criteria Development: Contributions from Environmental Geochemistry to Water Quality Management. In Sediments and Environmental Geochemistry; Springer: Berlin/Heidelberg, Germany, 1990; pp. 311–338. [Google Scholar]
- Loska, K.; Cebula, J.; Pelczar, J.; Wiechula, D.; Kwapulinski, J. Use of enrichment, and contamination factors together with geoaccumulation indexes to evaluate the content of Cd, Cu, and Ni in the Bybnik water reservoir in Poland. Water Air Soil Pollut. 1997, 93, 347–365. [Google Scholar] [CrossRef]
- Gonzáles-Macías, C.; Schifter, I.; Lluch-Cota, D.B.; Méndez-Rodríguez, L.; Hernández-Vázquez, S. Distribution, enrichment and accumulation of heavy metals in coastal sediments of Salina Cruz Bay, Mexico. Environ. Monit. Assess. 2006, 118, 211–230. [Google Scholar] [CrossRef]
- Chen, C.W.; Kao, C.M.; Chen, C.F.; Dong, C.D. Distribution and accumulation of heavy metals in the sediments of Kaohsiung Harbor, Taiwan. Chemosphere 2007, 66, 1431–1440. [Google Scholar] [CrossRef] [PubMed]
- Saraee, K.R.E.; Abdi, M.R.; Naghavi, K.; Saion, E.; Shafaei, M.A.; Soltani, N. Distribution of heavy metals in surface sediments from the South China Sea ecosystem, Malaysia. Environ. Monit. Assess. 2011, 183, 545–554. [Google Scholar] [CrossRef] [PubMed]
- Maanan, M.; El Barjy, M.; Hassou, N.; Zidane, H.; Zourarah, B.; Maanan, M. Origin and potential ecological risk assessment of trace elements in the watershed topsoil and coastal sediment of the Oualidia lagoon, Morocco. Hum. Ecol. Risk Assess. 2017, 24, 602–614. [Google Scholar] [CrossRef]
- El Barjy, M.; Maanan, M.; Maanan, M.; Salhi, F.; Tnoumi, A.; Zourarah, B. Contamination and environmental risk assessment of heavy metals in marine sediments from Tahaddart estuary (NW of Morocco). Hum. Ecol. Risk Assess. 2020, 26, 87–102. [Google Scholar] [CrossRef]
- Rafiq, F.; Techetach, M.; Boundir, Y.; Achtak, H.; Mandri, B.; Benhamdoun, A.; Cherifi, O.; Dahbi, A. First vertical exploration of organometallic contamination of sediment at the fishing port of Safi (West of Morocco). Moroc. J. Chem. 2022, 10, 115–126. [Google Scholar] [CrossRef]
- Mejjad, N.; Laissaoui, A.; Benmhammed, A.; Fekri, A.; El Hammoumi, O.; Benkdad, A.; Amsil, H.; Chakir, E.M. Potential ecological risk assessment of rare earth elements in sediments cores from the Oualidia lagoon, Morocco. Soil Sediment Contam. Int. J. 2022, 31, 941–958. [Google Scholar] [CrossRef]
- Xu, Z.Q.; Ni, S.J.; Tuo, X.G.; Zhang, C.J. Calculation of heavy metals’ toxicity coefficient in the evaluation of potential ecological risk index. Environ. Sci. Technol. 2008, 31, 112–115. [Google Scholar]
- Zhang, L.H.; Du, Y.F.; Wang, D.D.; Gao, S.; Gao, W.H. Distribution patterns and pollution assessments of heavy metals in the Spartina alterniflora salt-marsh wetland of Rudong, Jiangsu province. Environ. Sci. 2014, 35, 2401–2410. [Google Scholar] [CrossRef]
- Soliman, N.F.; Nasr, S.M.; Okbah, M.A. Potential ecological risk of heavy metals in sediments from the Mediterranean coast, Egypt. J. Environ. Health Sci. Eng. 2015, 13, 70. [Google Scholar] [CrossRef]
- Sun, G.; Chen, Y.; Bi, X.; Yang, W.; Chen, X.; Zhang, B.; Cui, Y. Geochemical assessment of agricultural soil: A case study in Songnen-Plain (Northeastern China). Catena 2013, 111, 56–63. [Google Scholar] [CrossRef]
- Mejjad, N.; Laissaoui, A.; Fekri, A.; Hassen, N.E.H.; Benmhammed, A.; El Hammoumi, O.; Benkdad, A.; Amsil, H. Tracking natural and human impact on sediment dynamics using radiometric approach in Oualidia lagoon (Morocco). Int. J. Environ. Anal. Chem. 2022, 102, 4300–4315. [Google Scholar] [CrossRef]
- Kim, Y.; Kim, K.; Kang, H.D.; Kim, W.; Doh, S.H.; Kim, D.S.; Kim, B.K. The accumulation of radiocesium in coarse marine sediment: Effects of mineralogy and organic matter. Mar. Pollut. Bull. 2007, 54, 1341–1350. [Google Scholar] [CrossRef]
- Mejjad, N.; Laissaoui, A.; El-Hammoumi, O.; Benmansour, M.; Benbrahim, S.; Bounouira, H.; Benkdad, A.; Bouthir, F.Z.; Fekri, A.; Bounakhla, M. Sediment geochronology and geochemical behavior of major and rare earth elements in the Oualidia Lagoon in the western Morocco. J. Radioanal. Nucl. Chem. 2016, 309, 1133–1143. [Google Scholar] [CrossRef]
- Zidane, H.; Maanan, M.; Mouradi, A. Environmental and ecological risk of heavy metals in the marine sediment from Dakhla Bay, Morocco. Environ. Sci. Pollut. Res. 2017, 24, 7970–7981. [Google Scholar]
- Wenning, R.J.; Ingersoll, C.G. Summary of the SETAC Pellston Workshop on Use of Sediment Quality Guidelines and Related Tools for the Assessment of Contaminated Sediments, Fairmont, MT, USA, 17–22 August 2002; Society of Environmental Toxicology and Chemistry (SETAC): Pensacola, FL, USA, 2002. [Google Scholar]
- Zhan, S.; Peng, S.; Liu, C.; Chang, Q.; Xu, J. Spatial and temporal variations of heavy metals in surface sediments in Bohai Bay, North China. Bull. Environ. Contam. Toxicol. 2010, 84, 482–487. [Google Scholar] [CrossRef]
- Gu, Y.G. Heavy metal fractionation and ecological risk implications in the intertidal surface sediments of Zhelin Bay, South China. Mar. Pollut. Bull. 2018, 129, 905–912. [Google Scholar] [CrossRef]
- Zourarah, B.; Maanan, M.; Robin, M. Sedimentary records of anthropogenic contribution to heavy metal content in Oum Er Bia estuary (Morocco). Environ. Chem. Lett. 2009, 7, 67–78. [Google Scholar] [CrossRef]
- Legorburu, I.; Rodríguez, J.G.; Borja, Á.; Menchaca, I.; Solaun, O.; Valencia, V.; Galparsoro, I.; Larreta, J. Source characterization and spatio–temporal evolution of the metal pollution in the sediments of the Basque estuaries (Bay of Biscay). Mar. Pollut. Bull. 2013, 66, 25–38. [Google Scholar] [CrossRef] [PubMed]
- Taylor, S.R.; McLennan, S.M. The Continental Crust: Its Composition and Evolution; Blackwell Scientific Publication: Carlton, Australia, 1985; p. 312. [Google Scholar]
- Viers, J.; Dupré, B.; Gaillardet, J. Chemical composition of suspended sediments in World Rivers: New insights from a new database. Sci. Total Environ. 2009, 407, 853–868. [Google Scholar] [CrossRef] [PubMed]
- Burton, G.A., Jr. Sediment quality criteria in use around the world. Limnology 2002, 3, 65–76. [Google Scholar] [CrossRef]
- Yi, Y.; Yang, Z.; Zhang, S. Ecological risk assessment of heavy metals in sediment and human health risk assessment of heavy metals in fishes in the middle and lower reaches of the Yangtze river basin. Environ. Pollut. 2011, 159, 2575–2585. [Google Scholar] [CrossRef]
- Liu, J.L.; Wu, H.; Feng, J.X.; Li, Z.J.; Lin, G.H. Heavy metal contamination and ecological risk assessments in the sediments and zoobenthos of selected mangrove ecosystems, South China. Catena 2014, 119, 136–142. [Google Scholar] [CrossRef]
- Ward, J.H. Hierarchical grouping to optimize an objective function. J. Am. Stat. Assoc. 1963, 58, 236–244. [Google Scholar] [CrossRef]
- Hajji, C.; Bendou, A.; Hassou, A. Management of Moroccan solid harbor waste: Comparative analysis and recommendations. J. Water Environ. Sci. 2017, 1, 59–76. [Google Scholar]
- Byrnes, T.A.; Dunn, R.J.K. Boating- and shipping-related environmental impacts and example management measures: A review. J. Mar. Sci. Eng. 2020, 8, 908. [Google Scholar] [CrossRef]
- Warnken, J.; Dunn, R.J.K.; Teasdale, P.R. Investigation of recreational boats as a source of copper at anchorage sites using time-integrated diffusive gradients in thin film and sediment measurements. Mar. Pollut. Bull. 2004, 49, 833–843. [Google Scholar] [CrossRef]


| Stations | Latitude | Longitude | Depth (m) | Sand (%) | Mud (%) | %CaCO3 | Textural Class |
|---|---|---|---|---|---|---|---|
| S1 | 32°19′48.30″ N | 9°17′17.10″ W | 18.4 | 97.39 | 2.61 | 72.34 | Sand |
| S2 | 32°19′21.05″ N | 9°16′7.33″ W | 6.5 | 98.79 | 1.21 | 82.13 | Sand |
| S3 | 32°19′22.04″ N | 9°16′45.43″ W | 23.2 | 82.16 | 17.84 | 62.98 | Slightly muddy sand |
| S4 | 32°19′21.54″ N | 9°17′17.67″ W | 30.08 | 97.16 | 2.84 | 78.30 | Sand |
| S5 | 32°18′45.88″ N | 9°17′10.03″ W | 29.3 | 95.15 | 4.85 | 72.77 | Sand |
| S6 | 32°18′49.35″ N | 9°16′37.21″ W | 25.5 | 92.02 | 7.98 | 71.06 | Slightly muddy sand |
| S7 | 32°18′50.34″ N | 9°16′11.42″ W | 21.9 | 84.64 | 15.36 | 74.47 | Slightly muddy sand |
| S8 | 32°18′50.83″ N | 9°15′42.71″ W | 17.05 | 96.86 | 3.14 | 79.57 | Sand |
| S9 | 32°18′52.32″ N | 9°15′23.37″ W | 15.2 | 98.55 | 1.45 | 82.13 | Sand |
| S10 | 32°18′53.31″ N | 9°15′4.03″ W | 3.5 | 98.86 | 1.14 | 82.55 | Sand |
| S12 | 32°18′17.65″ N | 9°15′28.64″ W | 13.76 | 98.41 | 1.59 | 79.57 | Sand |
| S13 | 32°18′18.64″ N | 9°16′6.73″ W | 23.5 | 95.88 | 4.12 | 79.57 | Sand |
| S15 | 32°17′43.48″ N | 9°16′12.58″ W | 26.5 | 94.25 | 5.75 | 77.45 | Sand |
| S16 | 32°17′42.49″ N | 9°15′41.53″ W | 25.8 | 95.41 | 4.59 | 77.87 | Sand |
| S17 | 32°17′42.99″ N | 9°15′14.00″ W | 21.4 | 96.98 | 3.02 | 76.17 | Sand |
| S18 | 32°17′43.97″ N | 9°14′51.73″ W | 12.5 | 96.94 | 3.06 | 69.36 | Sand |
| S19 | 32°17′43.97″ N | 9°16′40.12″ W | 28.2 | 96.46 | 3.54 | 82.55 | Sand |
| S20 | 32°17′42.48″ N | 9°17′2.39″ W | 29.74 | 93.72 | 6.28 | 65.53 | Slightly muddy sand |
| S21 | 32°17′6.83″ N | 9°16′45.97″ W | 30.6 | 96.26 | 3.74 | 79.57 | Sand |
| S22 | 32°17′7.33″ N | 9°16′13.75″ W | 28.4 | 93.85 | 6.15 | 73.62 | Slightly muddy sand |
| S23 | 32°17′6.84″ N | 9°15′46.21″ W | 26.8 | 67.57 | 32.43 | 52.34 | Muddy sand |
| S28 | 32°16′30.19″ N | 9°15′48.56″ W | 24.8 | 98.30 | 1.70 | 77.45 | Sand |
| S29 | 32°16′30.68″ N | 9°16′13.74″ W | 26.5 | 87.41 | 12.59 | 37.02 | Slightly muddy sand |
| S30 | 32°16′31.67″ N | 9°16′43.62″ W | 29.2 | 90.79 | 9.21 | 41.28 | Slightly muddy sand |
| S32 | 32°15′49.57″ N | 9°16′31.31″ W | 26.3 | 97.35 | 2.65 | 80.00 | Sand |
| S33 | 32°15′48.59″ N | 9°16′2.03″ W | 22.5 | 99.02 | 0.98 | 77.45 | Sand |
| S34 | 32°15′18.87″ N | 9°15′59.69″ W | 11.22 | 96.96 | 3.04 | 72.34 | Sand |
| S38 | 32°15′19.34″ N | 9°17′15.84″ W | 31.8 | 97.82 | 2.18 | 77.02 | Sand |
| Classification | Description |
|---|---|
| 0 < mCd < 1.5 | Nil–very low degree of contamination |
| 1.5 < mCd < 2 | Low degree of contamination |
| 2 < mCd < 4 | Moderate degree of contamination |
| 4 < mCd < 8 | High degree of contamination |
| 8 < mCd < 16 | Very high degree of contamination |
| 16 < mCd < 32 | Extremely high degree of contamination |
| mCd ≥ 32 | Ultra-high degree of contamination |
| Igeo Value | Igeo Class | Designation of Sediment Quality |
|---|---|---|
| >5 | 6 | Extremely contaminated |
| 4–5 | 5 | Strongly to extremely contaminated |
| 3–4 | 4 | Strongly contaminated |
| 2–3 | 3 | Moderately to strongly contaminated |
| 1–2 | 2 | Moderately contaminated |
| 0–1 | 1 | Uncontaminated to moderately contaminated |
| <0 | 0 | Uncontaminated |
| Value | Risk Intensity | RI Value | Risk Intensity |
|---|---|---|---|
| <40 | Low ecological risk | <150 | Low ecological risk |
| 40 < ≤ 80 | Moderate ecological risk | 150 ≤ RI < 300 | Moderate ecological risk |
| 80 < ≤ 160 | Appreciable ecological risk | 300 ≤ RI < 600 | Considerable ecological risk |
| 160 < ≤ 320 | High ecological risk | RI > 600 | Very high ecological risk |
| > 320 | Serious ecological risk |
| Locations | Metal Concentrations (mg/kg) | References | |||||
|---|---|---|---|---|---|---|---|
| Cd | Cr | Cu | Ni | Pb | Zn | ||
| Safi Bay, Morocco | 0.395 | 11.343 | 3.850 | 10.395 | 33.972 | 36.546 | Present study |
| Dakhla Bay, Morocco | 0.4 | 108 | 17.3 | 5.8 | 71.3 | 20.8 | [76] |
| Bohai Bay, China | 0.04–0.84 | ND | 7.20–44.0 | ND | 5.90–97.0 | 56.3–309 | [78] |
| Bay of Bengal, India | 19.8 | 109.45 | 76.45 | 27.984 | 49.629 | 78.76 | [8] |
| Zhelin Bay, China | 0.063 | 23.07 | 7.95 | 7.5 | 35.69 | 74.95 | [79] |
| Laizhou Bay, China | 0.19 | 32.69 | 10.99 | 17.38 | 13.37 | 50.63 | [11] |
| Tahaddart Estuary, Morocco | 0.16 | 91.83 | 57.1 | 34.92 | 25.55 | 73.73 | [66] |
| Oualidia Lagoon, Morocco | 0.66 | 102.4 | 17.7 | 15.73 | 10.1 | 75.8 | [18] |
| Nador Lagoon, Morocco | 1.6 | 71.6 | 150.8 | 45.2 | 135 | 554.9 | [10] |
| OumEr Bia estuary, Morocco | 0.36 | 9.5 | 19.6 | ND | 28 | 138 | [80] |
| The fishing port of Safi, Morocco | 1.2–2.4 | ND | 45–90 | ND | ND | 276–552 | [67] |
| Bay of Biscay, Spain | 0.08–0.11 | 2.13–6.16 | 11.8–21.76 | 4.17–15.12 | 6.88–26.23 | 28.8–66.79 | [81] |
| Upper Continental Crust | 0.09 | 35 | 25 | 20 | 20 | 71 | [82] |
| The suspended sediment of World Rivers | 1.55 | 133 | 75.9 | 74.5 | 61.1 | 208 | [83] |
| TEL | 0.6 | 37.3 | 35.7 | 18 | 35 | 123 | [84] |
| TET | 3 | 100 | 86 | 61 | 170 | 540 | [84] |
| Variables | Cd (mg/kg) | Cr (mg/kg) | Cu (mg/kg) | Ni (mg/kg) | Pb (mg/kg) | Zn (mg/kg) | Sand (%) | Mud (%) | %CaCO3 |
|---|---|---|---|---|---|---|---|---|---|
| Cd (mg/kg) | 1.00 | ||||||||
| Cr (mg/kg) | −0.07 | 1.00 | |||||||
| Cu (mg/kg) | 0.27 | 0.62 * | 1.00 | ||||||
| Ni (mg/kg) | 0.05 | −0.02 | 0.12 | 1.00 | |||||
| Pb (mg/kg) | 0.44 | 0.32 | 0.83 ** | 0.08 | 1.00 | ||||
| Zn (mg/kg) | 0.34 | 0.45 | 0.68 ** | 0.25 | 0.53 * | 1.00 | |||
| Sand (%) | −0.18 | −0.71 ** | −0.82 ** | −0.09 | −0.70 ** | −0.50 | 1.00 | ||
| Mud (%) | 0.18 | 0.71 ** | 0.82 ** | 0.09 | 0.70 ** | 0.50 | −1.00 | 1.00 | |
| %CaCO3 | −0.35 | −0.26 | −0.78 ** | −0.05 | −0.81 ** | −0.48 | 0.63 * | −0.63 * | 1.00 |
| Sites | Contamination Factor (Cf) | Degree of Contamination (DC) | Modified Degree of Contamination (mCd) | PLI | |||||
|---|---|---|---|---|---|---|---|---|---|
| Cd | Cr | Cu | Ni | Pb | Zn | ||||
| S1 | 2.53 | 0.00 | 0.05 | 0.14 | 2.70 | 0.29 | 5.72 | 0.95 | 0.19 |
| S2 | 1.78 | 0.00 | 0.04 | 0.09 | 1.33 | 0.24 | 3.49 | 0.58 | 0.14 |
| S3 | 1.62 | 0.21 | 0.09 | 0.08 | 3.73 | 0.51 | 6.23 | 1.04 | 0.41 |
| S4 | 1.68 | 0.00 | 0.05 | 0.06 | 2.25 | 0.25 | 4.29 | 0.72 | 0.15 |
| S5 | 2.49 | 0.27 | 0.07 | 0.22 | 2.26 | 0.36 | 5.66 | 0.94 | 0.45 |
| S6 | 1.69 | 0.19 | 0.07 | 0.06 | 2.52 | 0.48 | 5.01 | 0.84 | 0.35 |
| S7 | 2.90 | 0.00 | 0.07 | 0.16 | 3.32 | 0.51 | 6.97 | 1.16 | 0.25 |
| S8 | 2.81 | 0.00 | 0.07 | 0.16 | 3.42 | 0.34 | 6.81 | 1.13 | 0.23 |
| S9 | 1.97 | 0.09 | 0.04 | 0.02 | 2.83 | 0.29 | 5.24 | 0.87 | 0.22 |
| S10 | 1.74 | 0.00 | 0.03 | 0.04 | 1.91 | 0.20 | 3.93 | 0.65 | 0.12 |
| S12 | 1.86 | 0.00 | 0.05 | 0.04 | 2.30 | 0.30 | 4.56 | 0.76 | 0.15 |
| S13 | 1.55 | 0.61 | 0.05 | 0.13 | 1.81 | 0.39 | 4.54 | 0.76 | 0.40 |
| S15 | 1.67 | 0.00 | 0.06 | 1.08 | 2.39 | 0.75 | 5.95 | 0.99 | 0.30 |
| S16 | 1.54 | 0.09 | 0.05 | 0.12 | 1.78 | 0.56 | 4.13 | 0.69 | 0.30 |
| S17 | 3.04 | 0.16 | 0.07 | 0.15 | 2.58 | 1.82 | 7.83 | 1.30 | 0.54 |
| S18 | 1.63 | 0.00 | 0.14 | 0.19 | 3.74 | 0.93 | 6.62 | 1.10 | 0.28 |
| S19 | 1.76 | 0.04 | 0.04 | 0.05 | 1.60 | 0.26 | 3.75 | 0.63 | 0.20 |
| S20 | 1.61 | 0.00 | 0.07 | 0.09 | 2.73 | 0.44 | 4.94 | 0.82 | 0.18 |
| S21 | 1.61 | 0.00 | 0.06 | 0.05 | 1.74 | 0.33 | 3.79 | 0.63 | 0.14 |
| S22 | 1.64 | 0.24 | 0.07 | 0.07 | 2.08 | 0.53 | 4.62 | 0.77 | 0.36 |
| S23 | 1.93 | 1.21 | 0.23 | 0.15 | 5.07 | 1.43 | 10.01 | 1.67 | 0.92 |
| S28 | 1.98 | 0.00 | 0.04 | 0.03 | 2.57 | 0.33 | 4.95 | 0.83 | 0.14 |
| S29 | 4.01 | 0.01 | 0.15 | 0.17 | 4.89 | 0.85 | 10.08 | 1.68 | 0.36 |
| S30 | 1.65 | 0.00 | 0.11 | 0.16 | 4.28 | 0.86 | 7.07 | 1.18 | 0.27 |
| S32 | 1.87 | 0.00 | 0.04 | 0.12 | 2.88 | 0.40 | 5.31 | 0.88 | 0.19 |
| S33 | 1.59 | 0.00 | 0.04 | 0.07 | 1.89 | 0.31 | 3.91 | 0.65 | 0.14 |
| S34 | 1.53 | 0.00 | 0.05 | 0.07 | 2.42 | 0.35 | 4.42 | 0.74 | 0.15 |
| S38 | 1.70 | 0.00 | 0.05 | 0.08 | 3.08 | 0.29 | 5.20 | 0.87 | 0.16 |
| Mean | 1.97 | 0.11 | 0.07 | 0.14 | 2.72 | 0.52 | 5.54 | 0.92 | 0.27 |
| Min | 1.53 | 0.00 | 0.03 | 0.02 | 1.33 | 0.20 | 3.49 | 0.58 | 0.12 |
| Max | 4.01 | 1.21 | 0.23 | 1.08 | 5.07 | 1.82 | 10.08 | 1.68 | 0.92 |
| Sites | Geo-Accumulation Index (Igeo) | |||||
|---|---|---|---|---|---|---|
| Cd | Cr | Cu | Ni | Pb | Zn | |
| S1 | 0.75 | −8.80 | −4.85 | −3.40 | 0.85 | −2.37 |
| S2 | 0.25 | −8.72 | −5.27 | −4.02 | −0.18 | −2.62 |
| S3 | 0.11 | −2.86 | −4.04 | −4.23 | 1.31 | −1.56 |
| S4 | 0.16 | −8.81 | −4.94 | −4.64 | 0.59 | −2.56 |
| S5 | 0.73 | −2.50 | −4.50 | −2.76 | 0.59 | −2.05 |
| S6 | 0.17 | −2.95 | −4.35 | −4.68 | 0.75 | −1.65 |
| S7 | 0.95 | −8.60 | −4.42 | −3.19 | 1.15 | −1.55 |
| S8 | 0.90 | −8.65 | −4.39 | −3.21 | 1.19 | −2.12 |
| S9 | 0.39 | −4.08 | −5.25 | −6.16 | 0.92 | −2.36 |
| S10 | 0.21 | −8.75 | −5.57 | −5.25 | 0.35 | −2.88 |
| S12 | 0.31 | −8.66 | −4.89 | −5.08 | 0.61 | −2.30 |
| S13 | 0.04 | −1.29 | −4.89 | −3.53 | 0.27 | −1.95 |
| S15 | 0.15 | −8.82 | −4.56 | −0.47 | 0.67 | −1.00 |
| S16 | 0.04 | −4.12 | −4.90 | −3.66 | 0.25 | −1.43 |
| S17 | 1.02 | −3.19 | −4.38 | −3.32 | 0.78 | 0.28 |
| S18 | 0.12 | −8.85 | −3.46 | −2.96 | 1.32 | −0.69 |
| S19 | 0.23 | −5.09 | −5.29 | −4.80 | 0.09 | −2.52 |
| S20 | 0.10 | −8.86 | −4.36 | −4.13 | 0.86 | −1.77 |
| S21 | 0.10 | −8.86 | −4.75 | −5.05 | 0.22 | −2.17 |
| S22 | 0.12 | −2.64 | −4.45 | −4.43 | 0.47 | −1.51 |
| S23 | 0.36 | −0.31 | −2.70 | −3.31 | 1.76 | −0.07 |
| S28 | 0.40 | −8.57 | −5.24 | −5.57 | 0.77 | −2.18 |
| S29 | 1.42 | −8.13 | −3.32 | −3.10 | 1.71 | −0.82 |
| S30 | 0.13 | −8.83 | −3.76 | −3.19 | 1.51 | −0.80 |
| S32 | 0.31 | −8.65 | −5.09 | −3.62 | 0.94 | −1.92 |
| S33 | 0.08 | −8.88 | −5.11 | −4.38 | 0.34 | −2.29 |
| S34 | 0.02 | −8.94 | −4.83 | −4.48 | 0.69 | −2.12 |
| S38 | 0.18 | −8.79 | −5.02 | −4.20 | 1.04 | −2.37 |
| Mean | 0.35 | −6.65 | −4.59 | −3.96 | 0.78 | −1.76 |
| Max | 1.42 | −0.31 | −2.70 | −0.47 | 1.76 | 0.28 |
| Min | 0.02 | −8.94 | −5.57 | −6.16 | −0.18 | −2.88 |
| Sites | Ecological Risk Factor () | RI | RI Grade | |||||
|---|---|---|---|---|---|---|---|---|
| Cd | Cr | Cu | Ni | Pb | Zn | |||
| S1 | 50.60 | 0.01 | 0.32 | 0.78 | 8.44 | 0.21 | 60.36 | Low |
| S2 | 35.60 | 0.01 | 0.24 | 0.51 | 4.14 | 0.18 | 40.68 | Low |
| S3 | 32.30 | 0.46 | 0.56 | 0.44 | 11.64 | 0.38 | 45.77 | Low |
| S4 | 33.50 | 0.01 | 0.30 | 0.33 | 7.04 | 0.19 | 41.36 | Low |
| S5 | 49.80 | 0.59 | 0.41 | 1.22 | 7.05 | 0.27 | 59.33 | Low |
| S6 | 33.70 | 0.43 | 0.45 | 0.32 | 7.88 | 0.35 | 43.14 | Low |
| S7 | 57.90 | 0.01 | 0.43 | 0.91 | 10.38 | 0.38 | 70.00 | Low |
| S8 | 56.10 | 0.01 | 0.44 | 0.89 | 10.70 | 0.25 | 68.39 | Low |
| S9 | 39.30 | 0.20 | 0.24 | 0.12 | 8.85 | 0.22 | 48.92 | Low |
| S10 | 34.80 | 0.01 | 0.19 | 0.22 | 5.96 | 0.15 | 41.33 | Low |
| S12 | 37.10 | 0.01 | 0.31 | 0.25 | 7.18 | 0.22 | 45.07 | Low |
| S13 | 30.90 | 1.36 | 0.31 | 0.71 | 5.67 | 0.29 | 39.24 | Low |
| S15 | 33.30 | 0.01 | 0.39 | 5.98 | 7.46 | 0.55 | 47.69 | Low |
| S16 | 30.80 | 0.19 | 0.31 | 0.66 | 5.57 | 0.41 | 37.94 | Low |
| S17 | 60.80 | 0.36 | 0.44 | 0.83 | 8.06 | 1.34 | 71.83 | Low |
| S18 | 32.50 | 0.01 | 0.83 | 1.06 | 11.67 | 0.68 | 46.76 | Low |
| S19 | 35.10 | 0.10 | 0.23 | 0.30 | 5.00 | 0.19 | 40.93 | Low |
| S20 | 32.20 | 0.01 | 0.45 | 0.47 | 8.52 | 0.32 | 41.97 | Low |
| S21 | 32.20 | 0.01 | 0.34 | 0.25 | 5.44 | 0.25 | 38.48 | Low |
| S22 | 32.70 | 0.53 | 0.42 | 0.39 | 6.50 | 0.39 | 40.93 | Low |
| S23 | 38.50 | 2.69 | 1.41 | 0.84 | 15.85 | 1.05 | 60.33 | Low |
| S28 | 39.60 | 0.01 | 0.24 | 0.17 | 8.02 | 0.24 | 48.29 | Low |
| S29 | 80.10 | 0.01 | 0.92 | 0.96 | 15.29 | 0.62 | 97.91 | Low |
| S30 | 32.90 | 0.01 | 0.68 | 0.91 | 13.38 | 0.64 | 48.51 | Low |
| S32 | 37.30 | 0.01 | 0.27 | 0.67 | 9.00 | 0.29 | 47.54 | Low |
| S33 | 31.80 | 0.01 | 0.26 | 0.40 | 5.92 | 0.23 | 38.61 | Low |
| S34 | 30.50 | 0.01 | 0.32 | 0.37 | 7.57 | 0.25 | 39.03 | Low |
| S38 | 33.90 | 0.01 | 0.28 | 0.45 | 9.63 | 0.21 | 44.48 | Low |
| Mean | 39.49 | 0.25 | 0.43 | 0.76 | 8.49 | 0.38 | 49.81 | Low |
| grade | Low | Low | Low | Low | Low | Low | Low | |
Disclaimer/Publisher’s Note: The statements, opinions and data contained in all publications are solely those of the individual author(s) and contributor(s) and not of MDPI and/or the editor(s). MDPI and/or the editor(s) disclaim responsibility for any injury to people or property resulting from any ideas, methods, instructions or products referred to in the content. |
© 2023 by the authors. Licensee MDPI, Basel, Switzerland. This article is an open access article distributed under the terms and conditions of the Creative Commons Attribution (CC BY) license (https://creativecommons.org/licenses/by/4.0/).
Share and Cite
Minoubi, A.; Mejjad, N.; El Khalidi, K.; Bouchkara, M.; Fadili, A.; Chaibi, M.; Zourarah, B. Spatial Distribution and Contamination Level Assessment of Marine Sediment of the Safi Bay (Moroccan Atlantic Coast). Oceans 2023, 4, 331-349. https://doi.org/10.3390/oceans4040023
Minoubi A, Mejjad N, El Khalidi K, Bouchkara M, Fadili A, Chaibi M, Zourarah B. Spatial Distribution and Contamination Level Assessment of Marine Sediment of the Safi Bay (Moroccan Atlantic Coast). Oceans. 2023; 4(4):331-349. https://doi.org/10.3390/oceans4040023
Chicago/Turabian StyleMinoubi, Abdenaim, Nezha Mejjad, Khalid El Khalidi, Mohammed Bouchkara, Ahmed Fadili, Mohamed Chaibi, and Bendahhou Zourarah. 2023. "Spatial Distribution and Contamination Level Assessment of Marine Sediment of the Safi Bay (Moroccan Atlantic Coast)" Oceans 4, no. 4: 331-349. https://doi.org/10.3390/oceans4040023
APA StyleMinoubi, A., Mejjad, N., El Khalidi, K., Bouchkara, M., Fadili, A., Chaibi, M., & Zourarah, B. (2023). Spatial Distribution and Contamination Level Assessment of Marine Sediment of the Safi Bay (Moroccan Atlantic Coast). Oceans, 4(4), 331-349. https://doi.org/10.3390/oceans4040023