Article

Otolith δ18O Composition as a Tracer of Yellowfin Tuna (Thunnus albacares) Origin in the Indian Ocean

1
AZTI, Marine Research, Basque Research and Technology Alliance (BRTA), 20110 Pasaia, Gipuzkoa, Spain
2
CSIRO Oceans and Atmosphere, Hobart, Tasmania 7000, Australia
3
Marbec, University Montpellier, CNRS, Ifremer, IRD, 34095 Montpellier, France
4
Environmental Isotope Laboratory, Department of Geosciences, University of Arizona, Tucson, AZ 85721, USA
5
Marbec, University Montpellier, CNRS, Ifremer, IRD, 34203 Sete, France
6
International Seafood Sustainability Foundation, Washington, DC 20005, USA
*
Author to whom correspondence should be addressed.
Oceans 2021, 2(3), 461-476; https://doi.org/10.3390/oceans2030026
Submission received: 15 March 2021 / Revised: 2 July 2021 / Accepted: 6 July 2021 / Published: 14 July 2021

Abstract

:
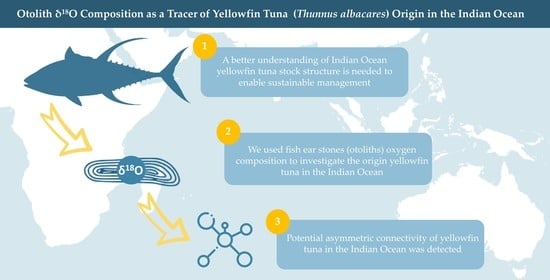
Yellowfin tuna of the Indian Ocean is overfished, and a better understanding of the stock structure is needed to enable sustainable management. Here, otolith δ18O values of young-of-the-year fish from known nursery areas of the equatorial Indian Ocean (West, Central and East) were used to establish a reference isotopic signature to predict the origin of sub-adult and adult individuals. Sub-adult tuna otolith δ18O values from Reunion Island were similar to the West nursery signature, but otolith δ18O values of sub-adults from Pakistan were unlike any of the nurseries sampled. Therefore, δ18O values from the Pakistan area samples were considered an additional nursery source for predicting the origin of adult tuna, using a multinomial logistic regression classification method. The western equatorial area was the most productive nursery for three fishing grounds sampled, with a minor contribution of Pakistan-like origin fish. Contribution of Central or East nurseries to the adult population was negligible. One adult otolith was analysed by secondary ion mass spectrometry along the otolith growth transect and results were compared with an isoscape approach to infer lifetime movements. This study is an important first step towards understanding the spatial structure and connectivity of the species.

Graphical Abstract

1. Introduction

Effective management of highly migratory marine species (i.e., species that can migrate long distances between international waters), such as billfish and tuna, is a great challenge due to their widespread distributions that often straddle domestic and international jurisdictional boundaries [1,2]. Yellowfin tuna (Thunnus albacares) is one of the species listed as highly migratory in Annex 1 of the United Nations Convention on the Law of the Sea (UNCLOS), and it inhabits the pelagic ecosystem of the tropical and subtropical regions of the Atlantic, Indian and Pacific Oceans [3]. This species has been subject to high fishing pressure over the last three decades [4], particularly in the Indian Ocean. Here, recent increases in catches have led to biomass and fishing mortality exceeding those corresponding to the Maximum Sustainable Yield [4,5]. The Indian Ocean yellowfin tuna stock is, therefore, considered overfished and subject to overfishing [6]. The stock assessment model of yellowfin tuna in the Indian Ocean runs under the single stock assumption, due to the rapid and large-scale movements indicated by the Indian Ocean Regional Tuna Tagging Program (RTTP-IO) [7]. However, some regional studies suggest that the stock structure and spatial dynamics of yellowfin tuna could be more complex than previously thought. Limited gene flow has been detected between the central and the eastern Indian Ocean [8], while genetically discrete populations of yellowfin tuna were identified among fish from the north central Indian Ocean, around Sri Lanka, Maldives and the Indian coast [9,10]. However, the lack of studies at an oceanic scale impedes a global overview of the current stock structure of yellowfin tuna in the Indian Ocean [11].
Yellowfin tuna can be found throughout the Indian Ocean, as far south as 45° S [12], but their spawning activity is restricted to lower latitudes with higher water temperatures and mesoscale oceanographic activity [13,14,15]. Spawning activity occurs more frequently in shallower waters, with greater abundance of larvae near land masses, particularly islands, compared to offshore waters [16]. Spawning occurs mainly from December to March along the equatorial region (0–10° S), and west of 75° E, in waters around Seychelles and off Somalia [17,18,19,20]. The western region accounts for the 75% of the total catches of yellowfin tuna in the Indian Ocean [21]. Secondary spawning grounds have also been described off Madagascar in the western Indian Ocean [17], off Maldives in the central Indian Ocean [18], and in waters between Sri Lanka and west Sumatra and off the coast of Australia in the eastern Indian Ocean [7,19]. From ~45 cm FL onwards, yellowfin tuna can perform extensive migrations between these spawning areas and feeding grounds in southern and northern latitudes [22,23]. However, the relative importance of different spawning areas to the total catches, and the degree of connectivity and mixing rates of yellowfin tuna in the Indian Ocean, are still unknown even though this information is essential to the development of effective and sustainable management strategies [24,25].
Chemical analysis of fish otoliths has proved to be a useful method to study the origin and movement of yellowfin tuna in the Pacific and Atlantic oceans [26,27,28]. The approach relies on two assumptions: (1) during otolith formation material is accreted and preserved as fish grows, and (2) the chemical composition of the otolith is related to the physicochemical environment inhabited by the fish at time of deposition [29]. As such, the chemical composition of the otolith material deposited during the early life stage of the fish is often linked to the ambient seawater physicochemical properties at the source (i.e., spawning area) [30]. Particularly, otolith oxygen isotopic composition (δ18O) has proved to be a reliable marker of the individual’s origin and an effective tool for stock identification and mixing estimation purposes [31,32,33,34]. Oxygen isotope composition of otolith aragonite responds to variation in the δ18O value of ambient seawater which, in turn, is dependent on evaporation and therefore related to seawater salinity [35]. As salinity in offshore waters masses is assumed to remain effectively constant [36], otolith δ18O values respond to the temperature-dependent fractionation between otolith aragonite and ambient water, leading to an inverse relationship between otolith δ18O values and temperature [37,38]. Thus, variations in otolith δ18O can be used as natural broad scale-geolocators to investigate migration and movement in fishes, particularly across temperature and salinity gradients [39,40]. This information may be useful for deciphering lifetime movements of teleost fish, although a thorough understanding of the mechanisms controlling otolith δ18O values is still required [34,41].
Traditionally, otolith δ18O composition has been measured by isotope ratio mass spectrometry (IRMS). One of the limitations of IRMS is that it relies on obtaining a minimum amount of calcium carbonate powder from otolith milling. As a result, the technique does not allow for fine temporal scale resolution (i.e., the signal corresponding to several months must be integrated) or fine scale life history reconstructions (i.e., core to edge transects) [42]. Thanks to recent analytical advances, it is now possible to measure stable isotopes with higher spatial/temporal resolution using secondary ion mass spectrometry (SIMS). This technique requires more preparation of the samples to be analysed [42], but in return offers a promising tool to unravel migration patterns and life history characteristics at much shorter timescales [43,44,45,46]. When water temperature and oxygen isotopic composition are known, it is possible to delineate isoscapes (i.e., spatial maps of predicted isotopic variation) that can be used to track potential movements across water masses with distinct isotopic signatures [47].
The aim of the present study was to assess the origin and the connectivity of sub-adult (age 1–2) and adult (age > 2+) yellowfin tuna from the main fishery grounds in the Indian Ocean. For that, the δ18O composition of the otolith portion corresponding to early life was analysed using IRMS. These signatures were then compared to a baseline of nursery signatures (by analysing the equivalent otolith portion of the early life period) developed from young-of-the-year (YOY, age 0) yellowfin tuna from known nursery areas in the Indian Ocean. In addition, SIMS analysis was applied, for the first time to yellowfin tuna, to measure the δ18O values along the otolith growth axis and assess the potential of this technique to provide detailed information on the movements and life history of yellowfin tuna in the Indian Ocean. Finally, isoscapes of potential gradients in otolith δ18O values were predicted from the oxygen isotope fractionation equation and used to illustrate the possible movements of this adult yellowfin tuna.

2. Materials and Methods

2.1. Fish Sampling

Otoliths of yellowfin tuna were collected from three major nursery areas (West, Central and East) and from four fishery grounds (South Africa, Pakistan, Reunion, and West Australia) in the Indian Ocean (Figure 1). Samples were collected by scientists or scientific observers directly on-board purse seine and longline vessels, or at port during two consecutive years (2018 and 2019), as part of a collaborative research project on Population Structure of Tuna, Billfish and Sharks of the Indian Ocean [48]. Capture location was available with a 5° × 5° quadrant range and sampling of fish belonging to the same school was limited to 5 individuals. Fork length (FL, to the nearest cm), sampling date, and sampling location were recorded for all samples collected (Table 1). Samples were classified as YOY (<38 cm FL), sub-adults (40–75 cm FL) and adults (>102 cm FL) according to the age-length relationship described in [49] and the 102 cm maturity threshold in [17]. Sagittal otoliths were extracted, cleaned of adhering organic tissue, rinsed with ultrapure water, and stored dry in plastic vials. The otolith collection available for this study comprised fish from different cohorts and hatched at different periods of the year. The baseline samples used to characterize yellowfin tuna nursery areas were first reported in [50] and were shown to be temporally stable among years for δ18O values. Therefore, YOY otoliths of different year classes, but belonging to the same nursery area, were pooled for this study.

2.2. Otolith δ18O Analysis by IRMS

When both otoliths were available, a single sagittal otolith (right or left) was randomly selected from each pair for analysis. Otoliths were embedded in two-part epoxy resin (Araldite 2020, Huntsman Advanced Materials, Basel, Switzerland). Each rectangular block was polished from the otolith rostrum using 3M® silicon carbide sandpaper (particle size = 220 µm) and a series of decreasing grain diameter lapping discs (30, 15, 9, 3 and 1 µm) with a lapping wheel, moistened with ultrapure water, to obtain a transverse section where the primordium was exposed. The resin blocks were sonicated for 10 min in ultrapure water (Milli-Q) and left to air dry for 24 h before being glued on a sample plate using Crystalbond thermoplastic glue (Crystalbond 509; Buehler Ltd., Illinois, IL, USA). Microsampling of otolith powder for oxygen stable isotope ratio (δ18O) was performed using a high-resolution computerised micromill (New Wave MicroMill System, NewWave Research G. C. Co., Ltd., Cambs, UK). To ensure that the same portion of the otolith was analysed in every fish, the length of the otolith section of the smallest yellowfin tuna in the baseline (19.5 cm FL) was used to create a standard template for the micromilling paths (e.g., Figure S1). This template was estimated to cover the otolith area corresponding to approximately the first two months of life, and thus representing the early life chemical composition of the otolith [50]. Ten drill passes were run at a depth of 50 µm per pass over a preprogrammed drill path using a 300-µm diameter carbide bit (Komet dental; Gebr. Basseler, Lemgo, Germany). Powdered material was then analysed for δ18O on an automated carbonate preparation device (KIEL-III, Thermo Fisher Scientific, Waltham, MA, USA) coupled to an isotope ratio mass spectrometer (IRMS, Finnigan MAT 252, Thermo Fisher Scientific) at the Environmental Isotope Laboratory of the University of Arizona. Oxygen isotope values were reported according to standards of the International Atomic Energy Agency in Vienna and represent ratios of 18O/16O in the sample relative to the Vienna Pee Dee Belemnite (VPDB) scale. The isotope ratio measurements were calibrated against repeated measurements of National Bureau of Standards (NBS-19 and NBS-18) and analytical precision was ±0.10 ‰ (1 sigma).

2.3. Otolith δ18O Analysis by SIMS

One otolith of an adult yellowfin tuna (134 cm FL) captured in South Africa in May 2018 was selected for high precision δ18O analyses using secondary ion mass spectrometry (SIMS). The individual’s age was estimated to be 4.5+ years according to the age-length curve of [49]. Fish birth year and month was back-calculated from collection date. SIMS requires high precision in sample preparation because smooth and even surfaces are needed for proper quantification, so that any irregularity in the sample surface (e.g., cracks, bubbles, reliefs, inclinations, etc.) can be avoided [42,51]. The otolith was embedded in a rectangular box following the same methodology as described above. The resin block was then embedded again with the rostrum upwards in a 25 mm diameter silicon cylindric mould with two-part epoxy resin until the surface of the section was covered. It was then kept at a room temperature for 48 h to cure the resin. The resulting cylinder containing the otolith positioned vertically, was then polished with a series 3M® silicon carbide lapping discs (9, 3 and 1 µm) moistened with ultrapure water, until the primordium was clearly exposed. Then a velvet polishing pad moistened with ultrapure water and sprinkled with alumina powder (0.5 μm) was used to expose the core and produce a flat mirror-finished surface. The oxygen isotope data were acquired at the NERC Ion Microprobe Facility (SIMS) from the University of Edinburgh with a Cameca IMS 1270 (AMETEK Inc., Berwyn, PA, USA), using a ~5 nA primary 133Cs+ beam. Secondary ions were extracted at 10 kV, and 16O (~3.0 × 10⁹ cps) and 18O (~4.0 × 10⁶ cps) were monitored simultaneously on dual Faraday cups (L’2 and H’2). Each analysis involved a pre-sputtering time of 60 s, followed by automatic secondary beam and entrance slit centering and finally data collection in two blocks of ten cycles, amounting to a total count time of 80 s. The internal precision of each analysis was < 0.2 per mil. To correct for changes in the instrumental mass fractionation (IMF), data were normalized to a UWC-1 (δ18O = 23.3 SMOW) calcite standard [52] which was mounted together with the samples and measured throughout the analytical sessions. The external precision was estimated from the repeat analysis of the standard to be (0.17–0.26) per mil. Measurements were made along the growth axis of the otolith, from the primordium to the edge with a series of 40 spots of ~15 µm each (Figure S2). The first 4 spots were discarded as they were not placed in the middle of the core. Temporal resolution covered by each spot increased with increasing distance from the core, from days near the otolith core, to weeks towards the edge [8]. To compare δ18O values measured by the two analytical methods (SIMS and IRMS), δ18O data were converted from VSMOW to VPDB using the following equation [53]:
δ18OVPDB = 0.97001 × δ18OVSMOW − 29.99‰
To correct for deviations between IRMS and SIMS, a regression equation relating these two types of measurements in cod otoliths was applied [54]:
δ18OIRMS = 0.4773 × δ18OSIMS + 0.483
Raw SIMS δ18O measurements are presented in Table S1.

2.4. Isoscape Computation

A simplistic model was applied to predict the spatial variations in the oxygen isotope composition of otoliths (δ18OOTO) in order to infer the possible location of the analysed individual at a given point in time in the horizontal plane. A linear equation, which relates the isotopic composition of water (δ18OWATER) and the seawater temperature (T, in °C) was applied [39]:
T = γ (δ18OOTO − δ18OWATER) + β
where δ18OOTO is relative to the VPDB standard and δ18OWATER is relative to the VSMOW standard. A global gridded data set of δ18OWATER was obtained from [35] and averaged for three depth ranges: (1) 0–20 m, (2) 20–50 m and (3) 50–100m, as these are the depths yellowfin tuna inhabit most of the time [55]. Parameters γ = −0.27 and β = 5.19, described for Pacific Ocean bluefin tuna (Thunnus orientalis), were used for the computation [37]. Temperature was derived from the reanalysis produced by the European Copernicus Marine Environment Monitoring Service (CMEMS, http://marine.copernicus.eu), “CORIOLIS-GLOBAL-CORA-OBS_FULL_TIME_SERIE” product. Monthly data from January 2013 to May 2018 (i.e., the lifetime calculated for the fish) was averaged for each 1° × 1° grid for the three depth ranges described above. Maps were generated using QGis software (3.8.3-Zanzibar version). Note that this simplistic model assumes constant parameters for the otolith fractionation equation, and that locally, seasonal fluctuations in seawater temperature may result in an increased variability of δ18O otolith values than considered here.

2.5. Statistical Analyses

Early life δ18O values measured by IRMS were examined for normality and homogeneity of variances using Shapiro-Wilks normality test and Fligner-Killeen test of homogeneity of variances, respectively. All locations met the parametric assumptions. Differences between δ18O values of sub-adult yellowfin tuna from Pakistan and Reunion were compared using a Student´s t-test. Sub-adult signatures were also compared with δ18O values of YOY yellowfin tuna from the 3 main baseline nursery regions, using 1-way ANOVA and Tukey’s HSD test. Projections of nursery origin composition of adult yellowfin tuna from each fishery ground were estimated using a multinomial logistic regression (MLR) classification method as described by Rooker et al. [56]. Four probability thresholds were used to predict nursery origin (0.5, 0.6, 0.7 and 0.8). As the probability threshold increases above 0.5, some individuals may not have sufficient predicted probabilities to be assigned to any nursery present in the baseline, and thus will be classified as an undetermined source. As such, the fraction of individuals failing to meet the probability threshold of any nursery will increase as the probability threshold increases [56]. The δ18O SIMS otolith profile was estimated by computing the moving means of two adjacent values at a given distance from the core to the edge. All analyses were performed using R software (R Foundation for Statistical Computing, Vienna, Austria) [57].

3. Results

3.1. Nursery Origin of Sub-Adult and Adult Yellowfin Tuna

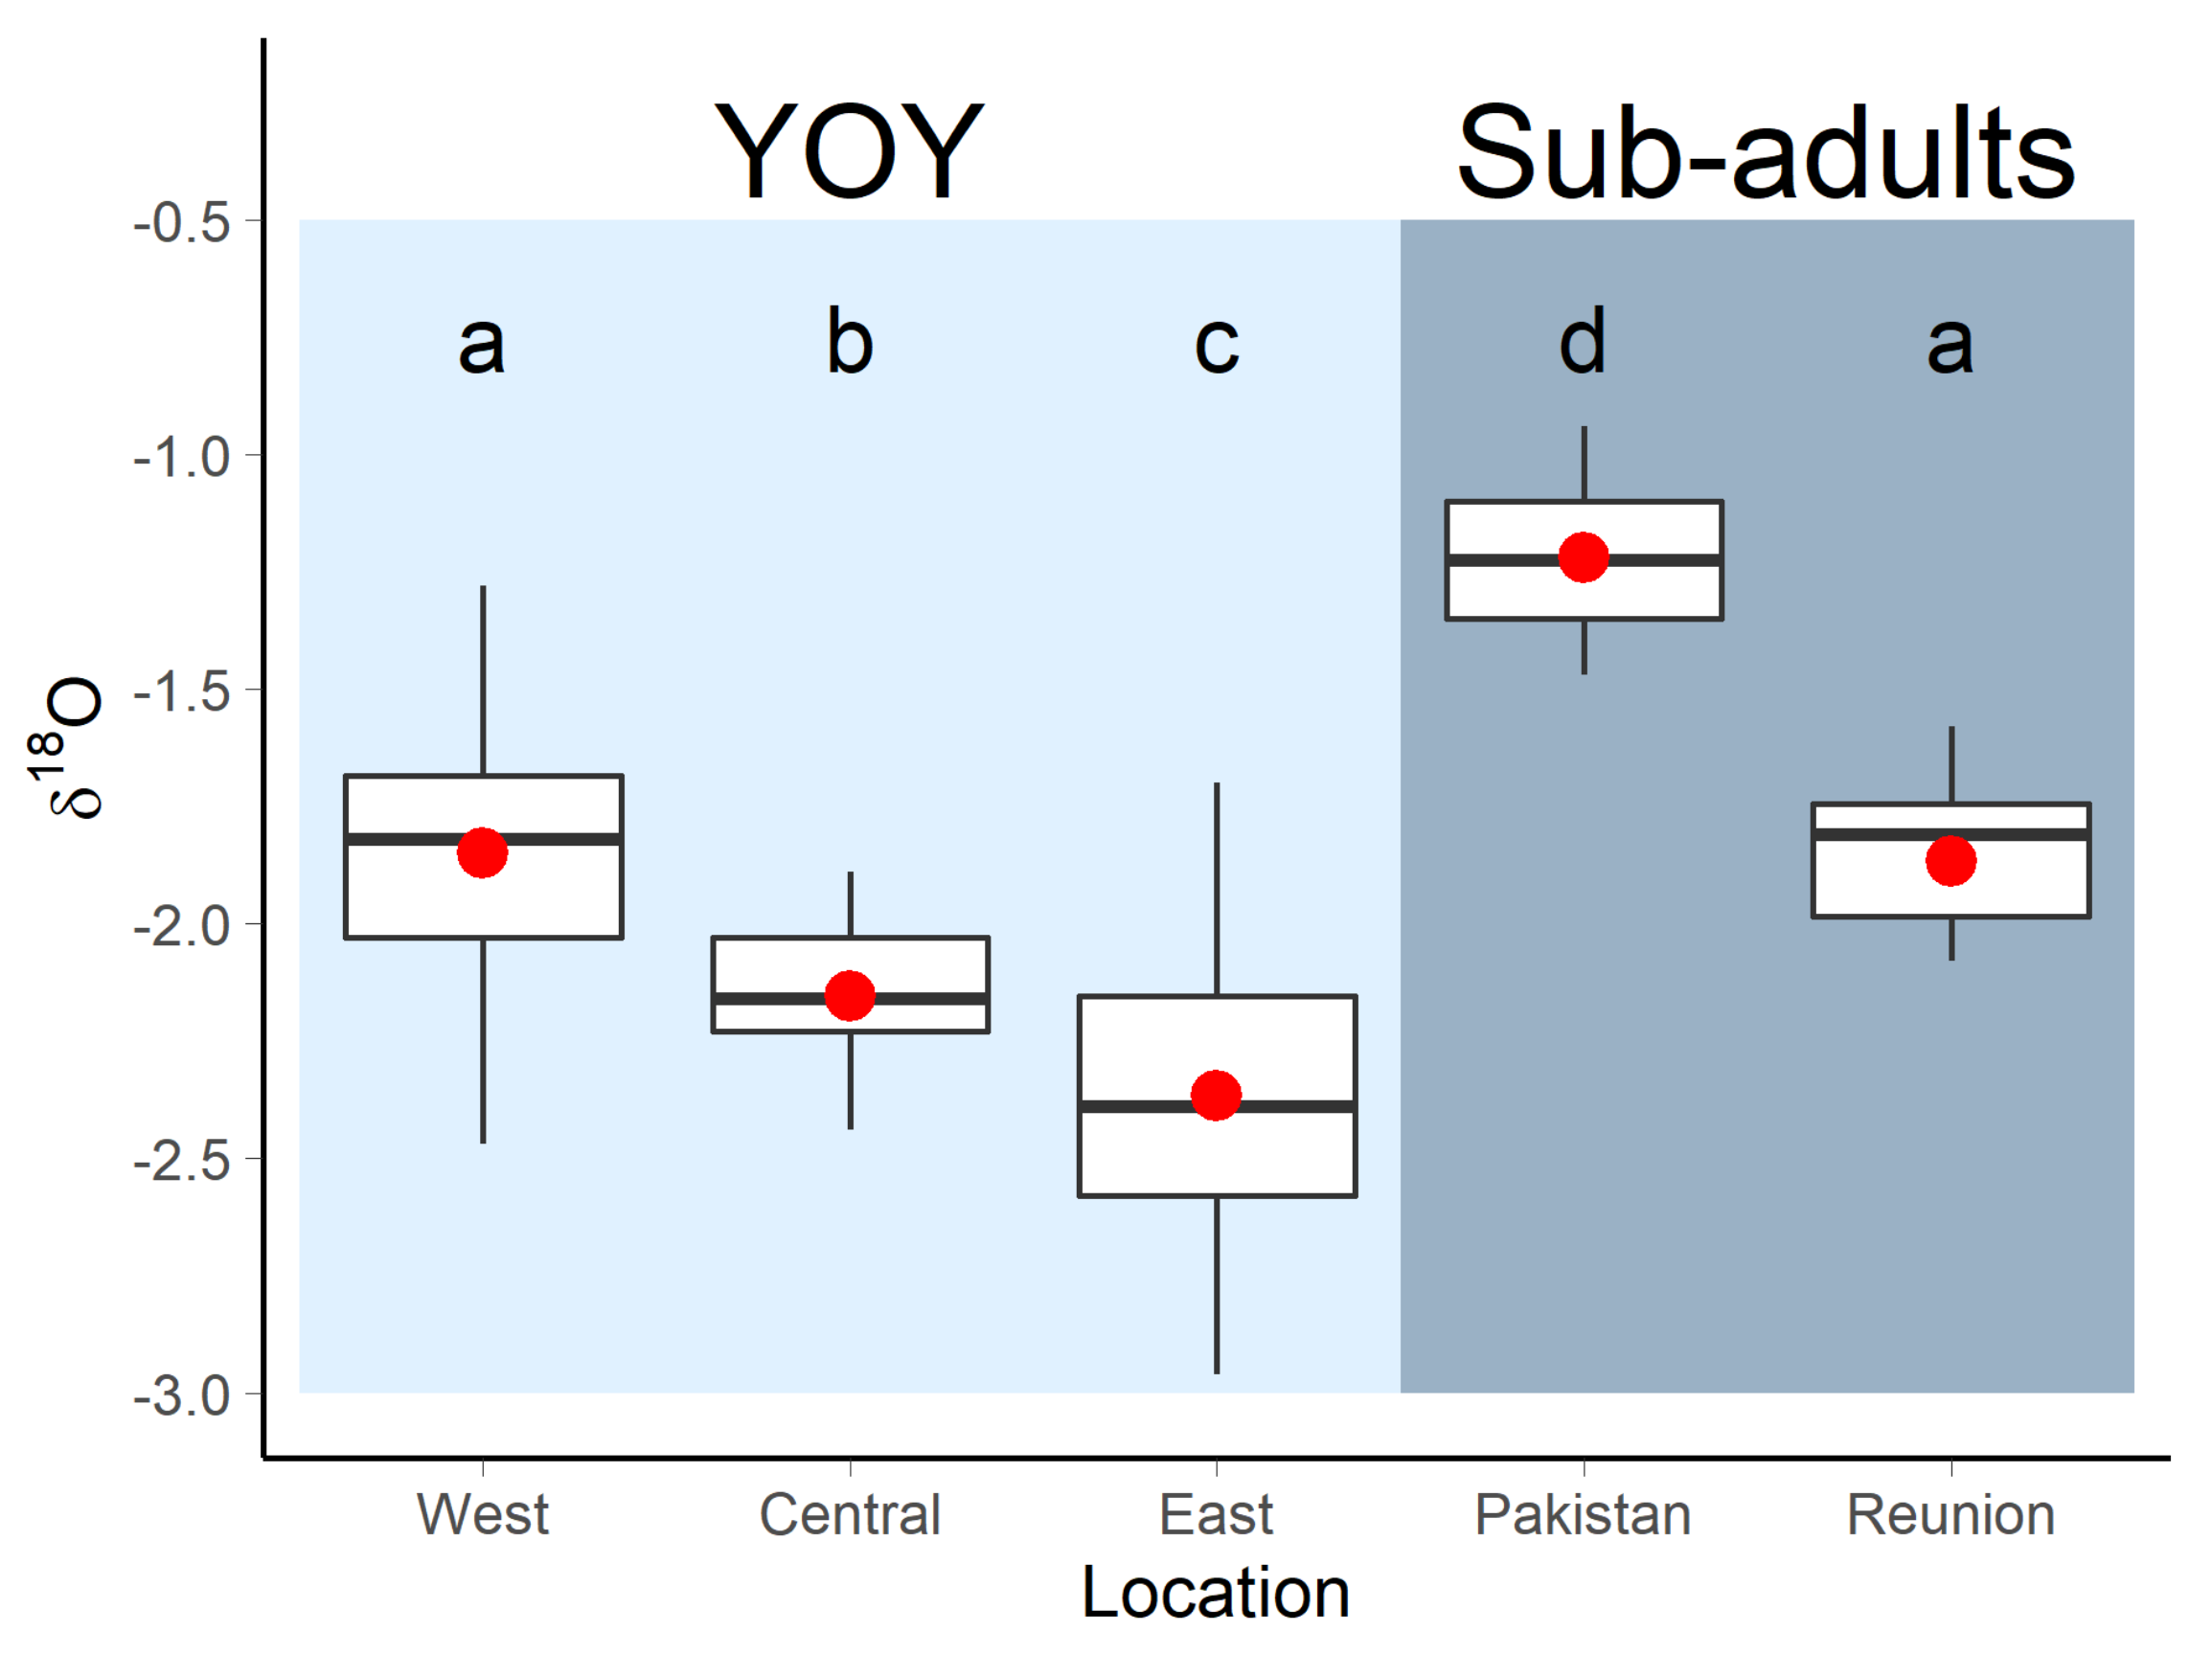
Sub-adult yellowfin tuna from Pakistan and Reunion showed distinct early life δ18O composition (t–test, p < 0.001). The δ18O otolith measurements ranged from −0.94 to −1.47 for yellowfin tuna captured in Pakistan, and from −1.58 to −2.35 for fish captured in Reunion (Figure 2). While the δ18O values of fish captured in Reunion were not significantly different from the nearest nursery, the West nursery (Tukey HSD, P = 0.998), early life δ18O composition of fish captured in Pakistan was distinct from any of the nurseries present in the baseline (Figure 2). Therefore, the early life δ18O signature of Pakistan was considered as an additional nursery signature to be included with the reference samples, although the exact geographical location of the nursery area represented cannot be determined (hereafter called Pakistan-like origin).
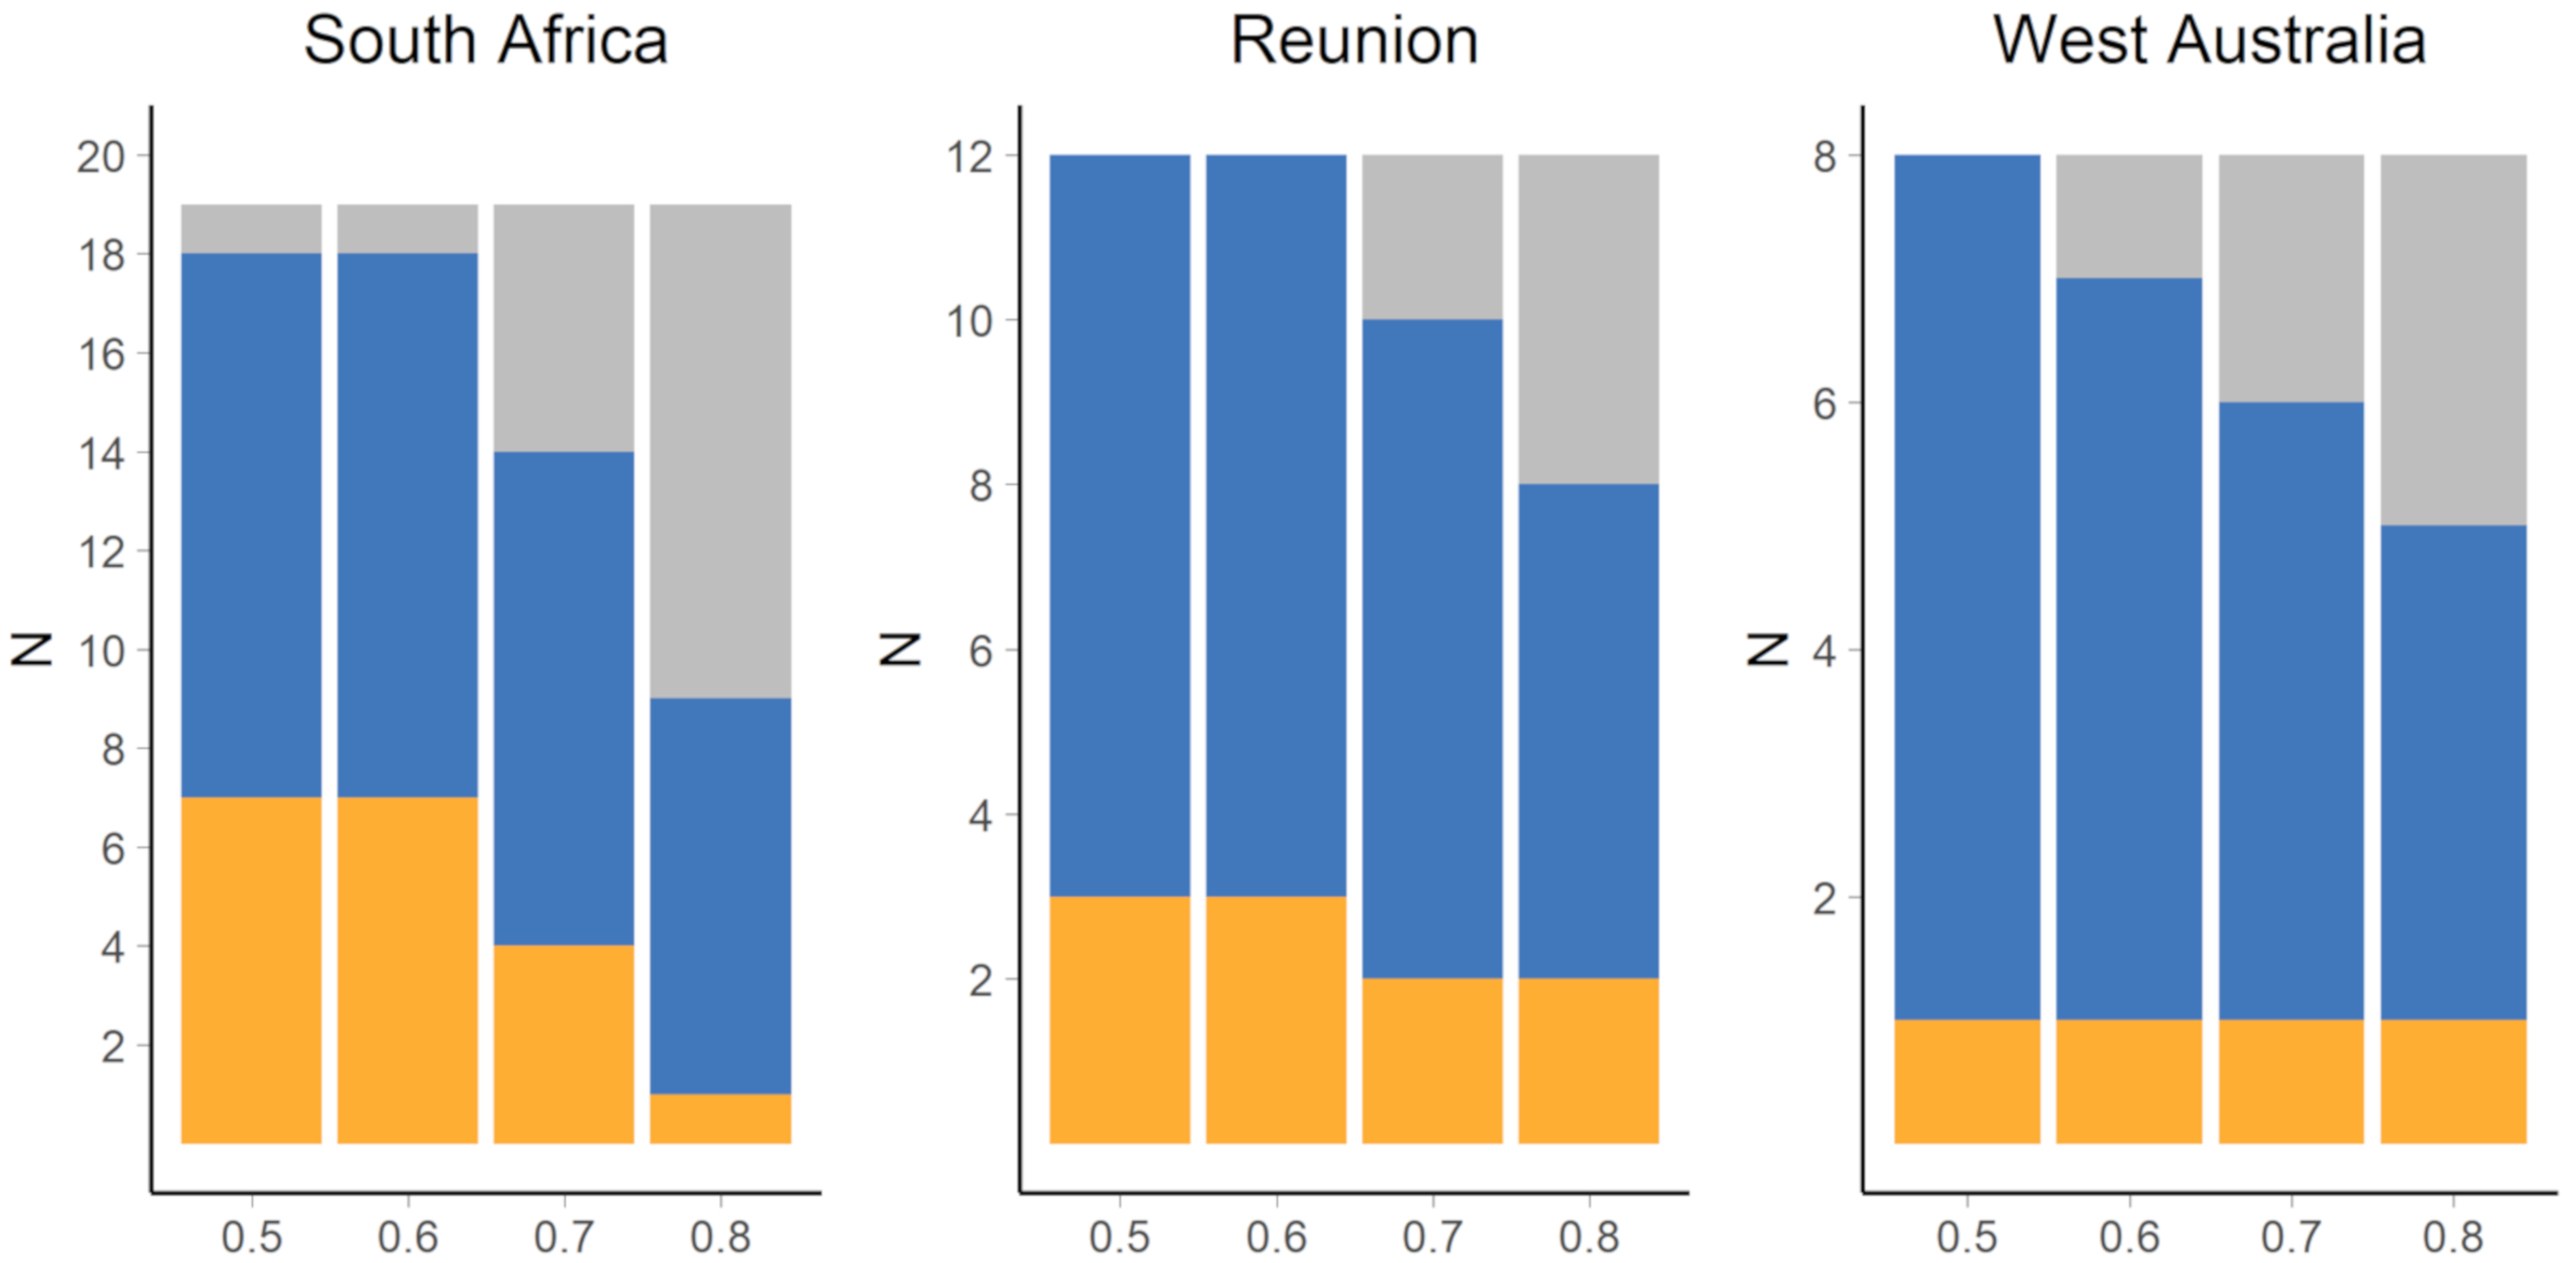
Most of the adult yellowfin tuna captured in South Africa, Reunion and West Australia were assigned to the West nursery using the MLR approach. None of the adult yellowfin tuna were assigned to the Central or East nurseries, but some adults with a Pakistan-like δ18O signature were detected in the three fishery grounds sampled (Figure 3). The number of unclassified individuals was highest for adult yellowfin tuna captured in South Africa. When the probability threshold was set at 0.5 or 0.6, one adult yellowfin tuna was classified as undetermined. When the probability threshold was set at 0.7 and 0.8, 5 and 10 out of the 19 adult yellowfin tuna captured in South Africa were classified as undetermined respectively. The other individuals were classified as from the West or from the Pakistan-like nursery of origin (Figure 3). For adult fish captured in Reunion, most of the individuals (9 out of 12) were assigned to the West nursery origin with a probability threshold of ≤0.6, while the three remaining fish were classified as from the Pakistan-like origin. The number of unclassified fish was two and four for a probability threshold of 0.7 and 0.8, respectively. For adult fish captured in West Australia one fish was assigned to the Pakistan-like origin for all probability thresholds, while the rest of the fish were assigned to the West nursery of origin. The number of unclassified individuals increased from zero to three with increasing probability thresholds (0.5–0.8).

3.2. Oxygen Isotopic Distribution Along the Otolith and Isoscape Predictions

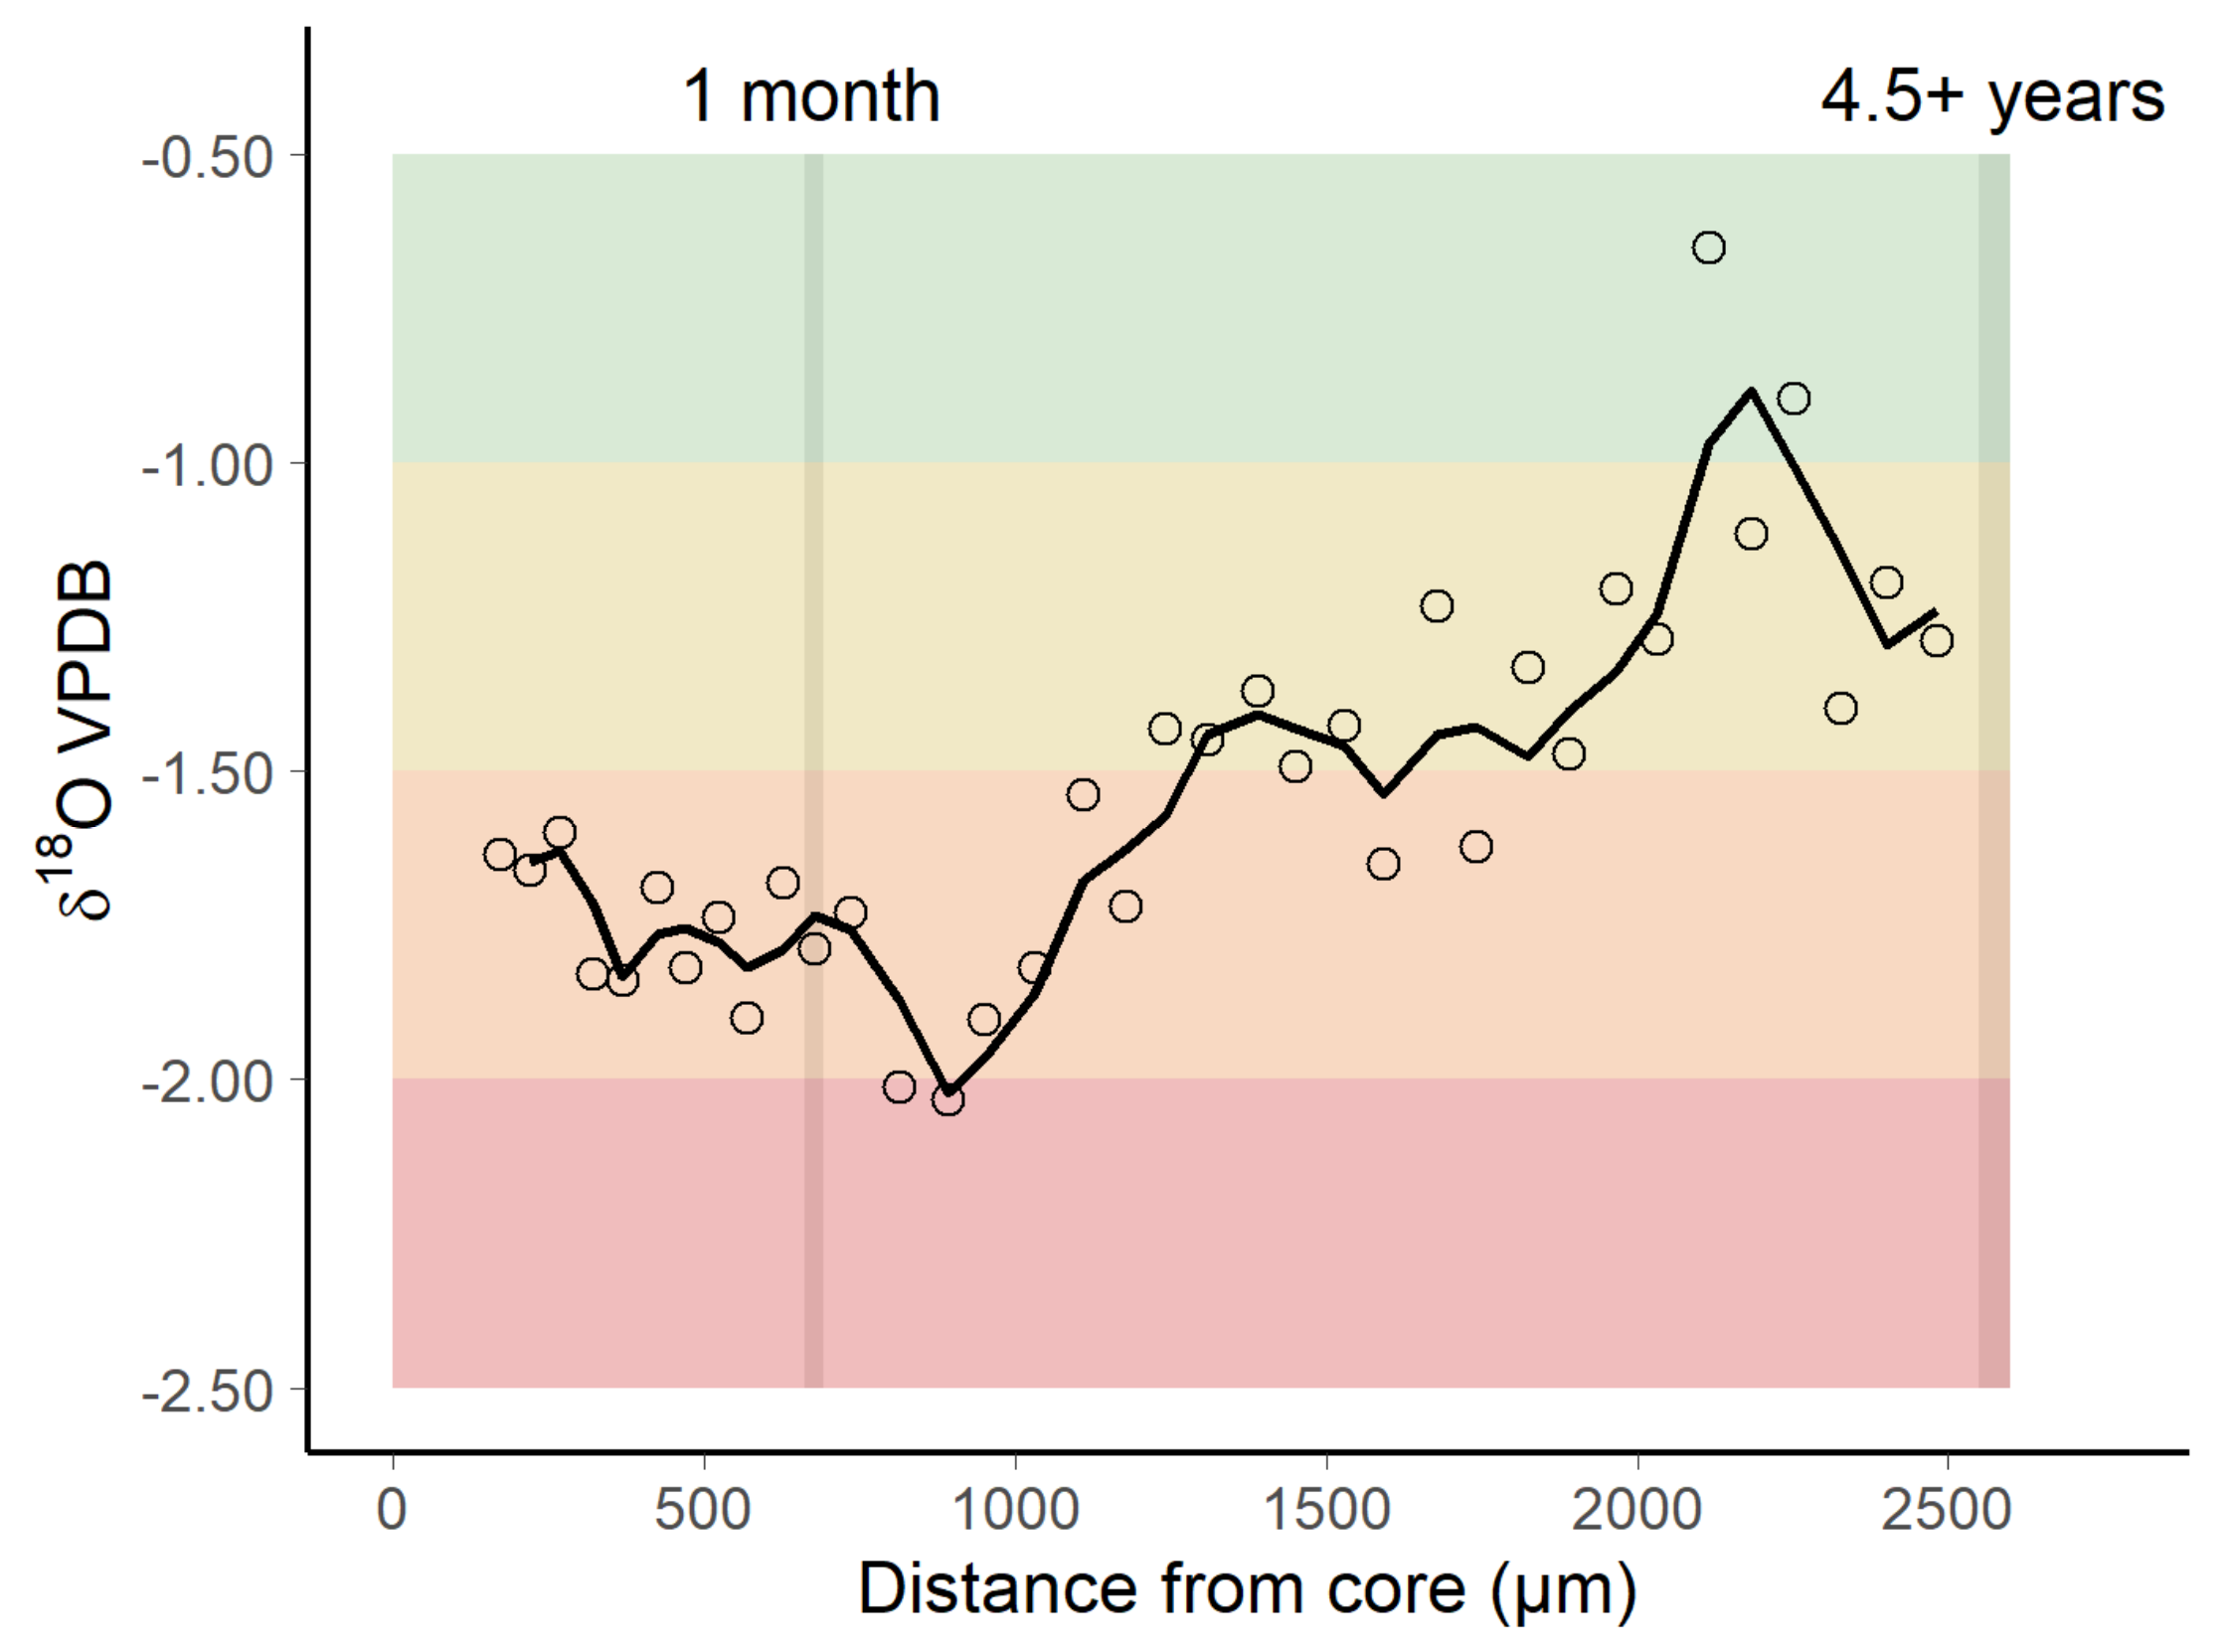
Otolith δ18O values measured by SIMS ranged from −2.03 to −0.65 along the growth transect. In total, 36 spots were analysed along the otolith growth axis from core to edge, spanning the fish’s life history from a few days post-hatch, to capture. There was an increasing trend in mean δ18O values from the otolith core to the edge, corresponding to an increase in fish age (Figure 4). For the first ~900 µm, δ18O values were low and little variability was observed. The average value of the signature during to the first month of life was −1.74, attained by integrating the spots from the core to the inflection point, where the growth axis changes direction in the otolith transverse section. This value was similar to that obtained by IRMS in the second otolith of the pair (−1.72) from the same individual. After ~1000 µm from the core, δ18O values increased sharply to a distance of ~1240 µm from the core, reaching δ18O values of the order of −1.50 (Figure 4), after which, δ18O values stabilized. A peak of δ18O values (around −1) was observed towards the end of the transect, between ~2100–2250 µm, after which it decreased again to around −1.25. Unfortunately, the last spot in the transect was not set exactly on the otolith edge, so that the isotopic composition of the catch location (South Africa) was not analysed.
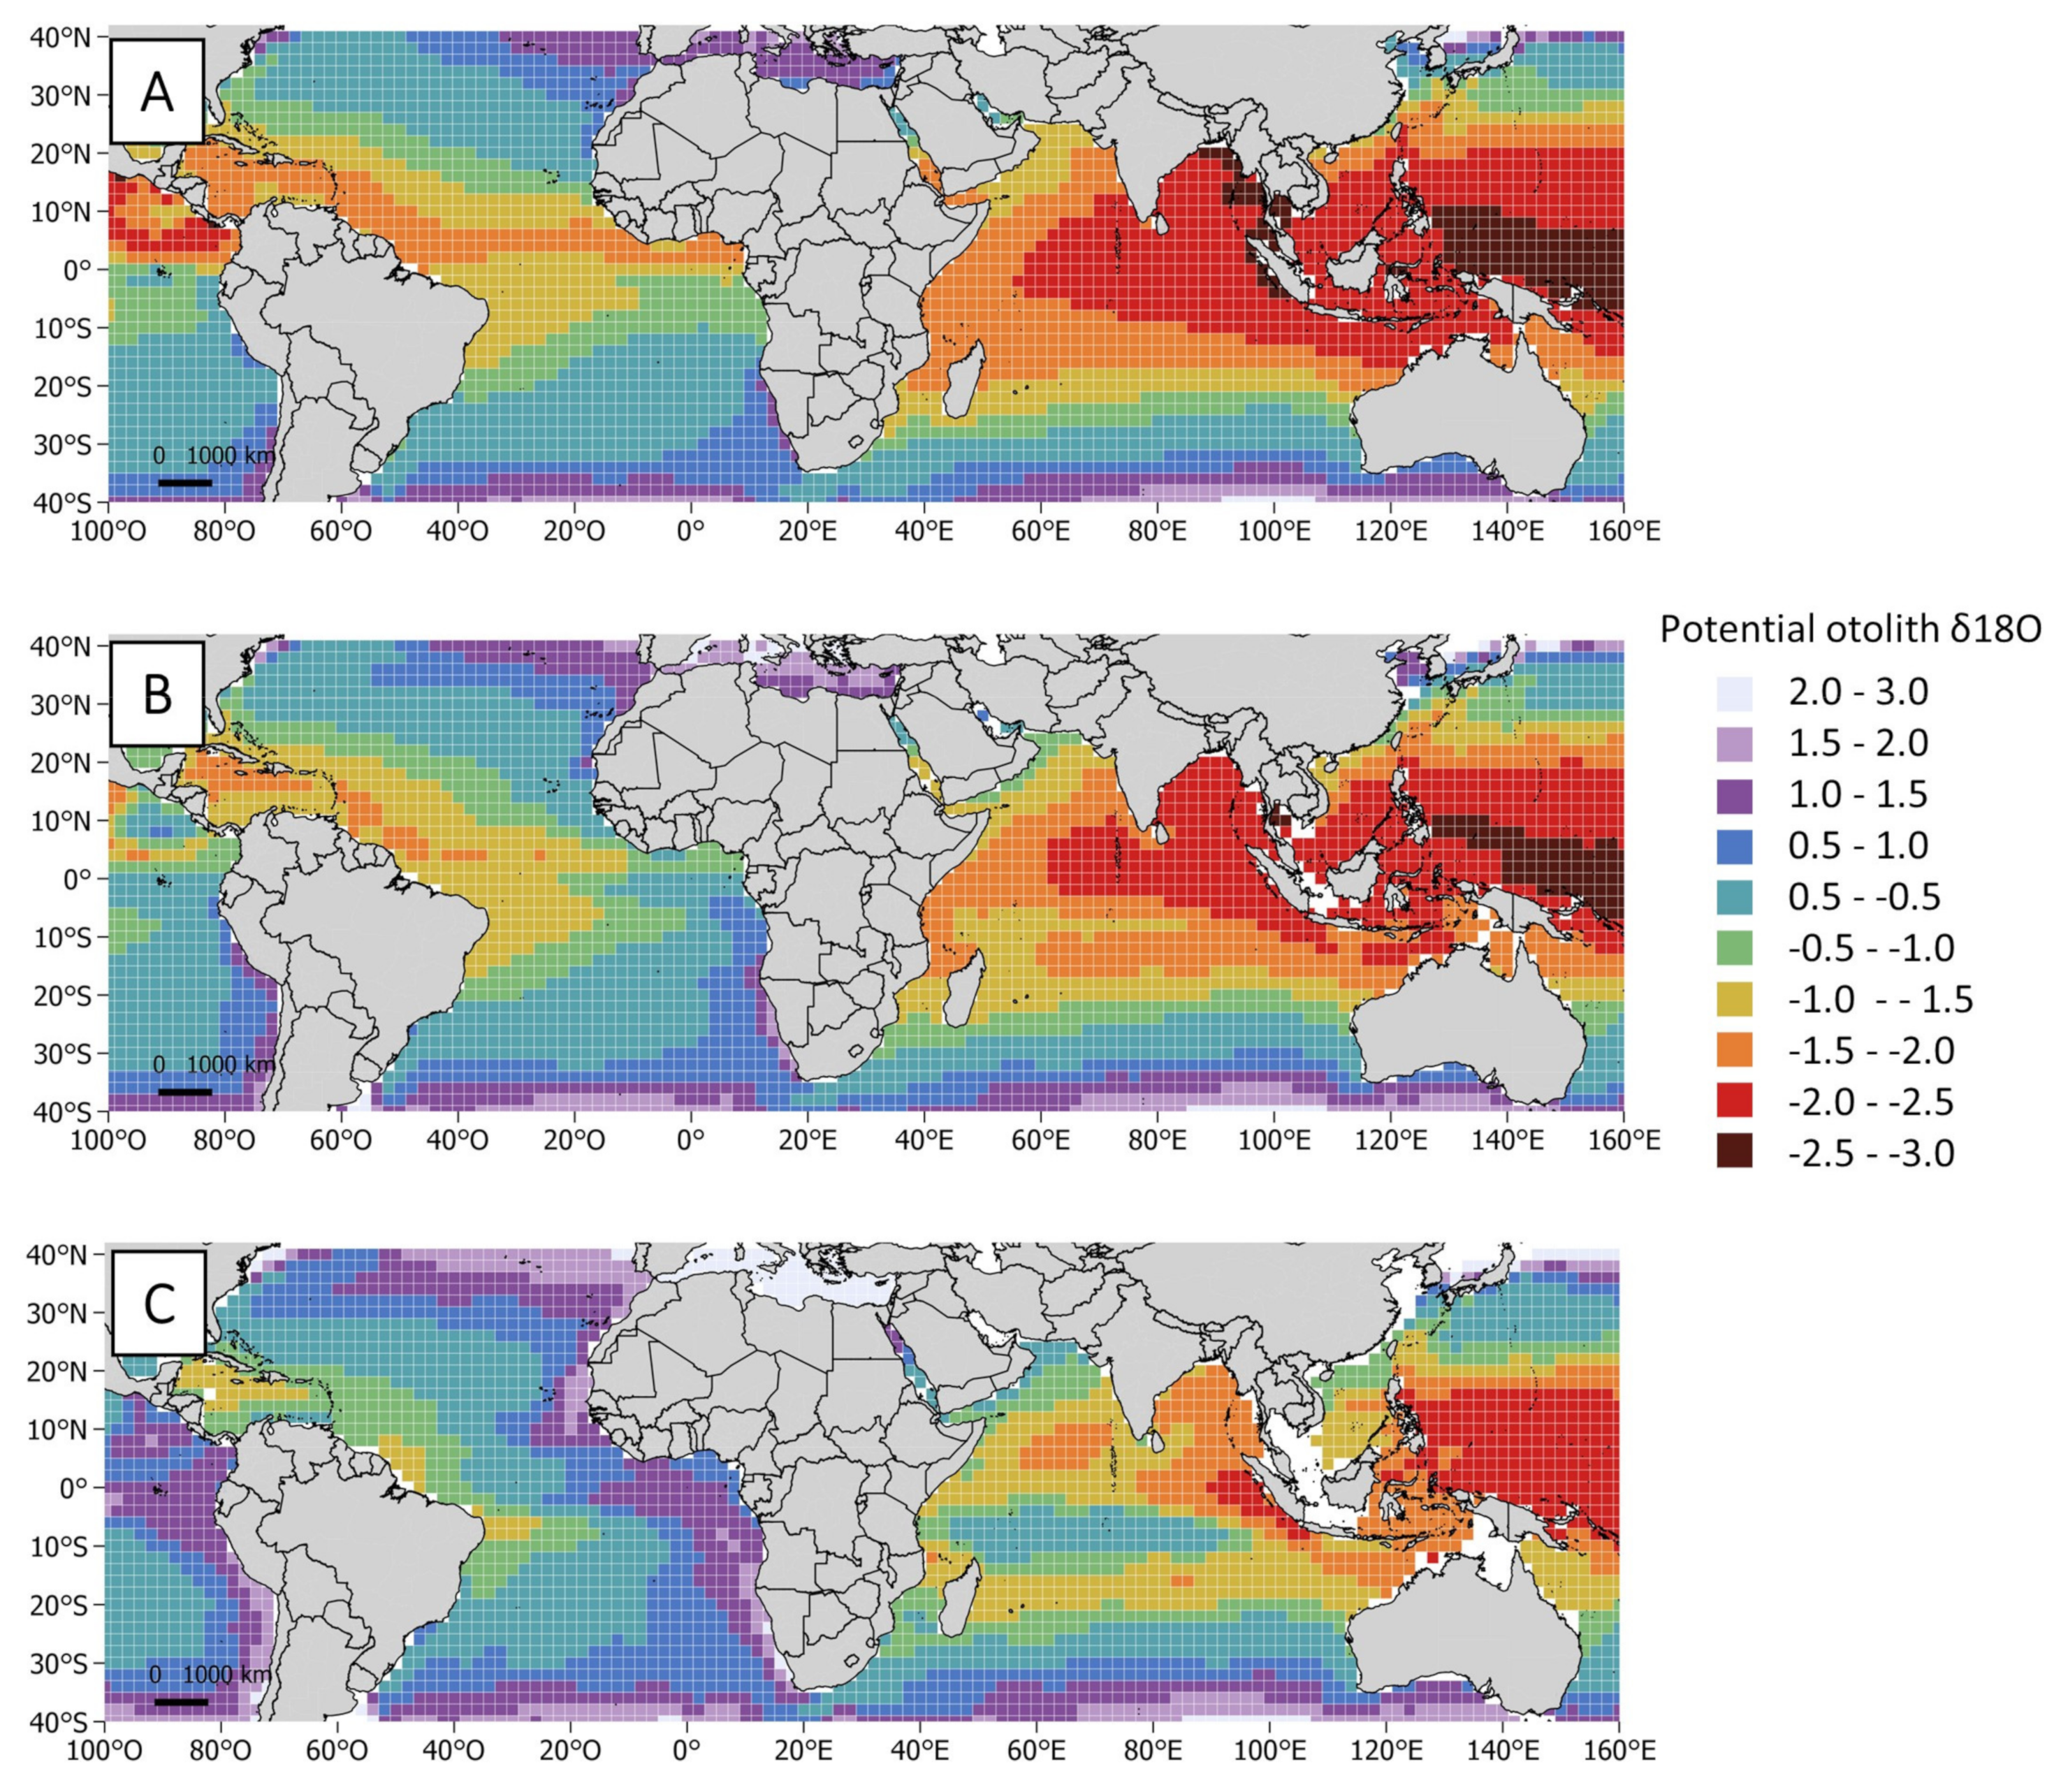
Predicted spatial variations in the isotopic composition of oxygen in otoliths ranged from 3.0 to −3.0 and overall, expected values were higher in the Atlantic Ocean (Figure 5). In the Indian Ocean, north of 20° S predicted δ18O values for 0–20 m depth range were higher in the western region, with maximum values found in the Arabian Sea. Predicted δ18O values decreased eastward, with minimum values found off Sumatra and eastern Bay of Bengal basin (Figure 5A). A similar pattern of δ18O values was detected for the 20–50 m depth range. Higher δ18O were found south of the equator (0–10° S), west of 90° E, and around Madagascar Island (Figure 5B). At this depth, δ18O values off Sumatra were in the range of those of the rest eastern Indian Ocean. For the 50–100 m depth range, δ18O values were the same off Sumatra, but increased in the rest of the Indian Ocean (Figure 5C). South of 20° S, δ18O values followed a nearly perfect zonation by latitude, with predicted values increasing with increasing southward latitude.

4. Discussion

4.1. Nursery Origin of Sub-Adult and Adult Yellowfin Tuna

The current study analyses the early life δ18O values in otoliths in order to expand our understanding of the movement and mixing of yellowfin tuna in the Indian Ocean. There is a decreasing trend in otolith δ18O values from West to East that closely reflects the increasing trend in water temperatures (Figure S3). This implies that each of the three major nursery areas used as a baseline in this study have distinct δ18O signatures that serve as natural tags to identify the origin of older individuals [26,27,58]. The lengths of sub-adults analysed in this study ranged from 47 to 75 cm FL and although they were not in spawning condition [17], yellowfin tuna of this length are capable of large migrations in search of foraging grounds [23]. Given this, we expected the early life δ18O composition for sub-adults from Pakistan and Reunion to reflect a mix of overlapping oxygen isotope signals from fish arriving from different nursery origins. However, juveniles from Pakistan and Reunion showed very different early life isotopic signatures, suggesting that these fish originated from distinct nursery areas. The early life otolith δ18O composition of sub-adults from Reunion resembled that from the closest known nursery, the West nursery, suggesting some retention of sub-adult fish near this area. High retention of yellowfin tuna of this size near to their closest nursery area has also been reported in the Pacific Ocean [27,28]. Interestingly, the nursery signature of juvenile fish from Pakistan was very different to any other nursery signature in the baseline. Although it is not possible to directly determine where the nursery area of these fish is located, observed δ18O results of this study could indicate the possible existence of a nursery area in the Arabian Basin region. Higher otolith δ18O values can be expected in this area compared to other regions in the Indian Ocean. During the boreal winter monsoon (December to April), cold and dry winds cool the surface waters along the northwestern Arabian Sea [59] and, consequently, colder waters (SST ~ 22–24 °C) can be found at this time (Figure S3). The Arabian Sea is under the influence of the Arabian Gulf water mass and therefore the saline content of the region is higher than elsewhere in the Indian Ocean basin (Figure S3). These features may explain the relatively high otolith δ18O values found in sub-adults collected off Pakistan, if these fish originated from this area. There are no known spawning grounds of yellowfin tuna in this area, although the possibility of a separate population of yellowfin tuna in the Arabian Sea has been proposed [60,61].
Otolith early life δ18O values proved useful for ascertaining the possible origin of adult fish captured in three different fishing grounds of the south Indian Ocean (South Africa, Reunion, and West Australia). Estimates of nursery origin of adult fish predicted that most of the individuals analysed in the three fishing grounds were derived from the West nursery, regardless of the modelling probability threshold used. This issue highlights the importance of the western Indian Ocean as a major production area for yellowfin tuna. As with sub-adults, our results indicate a high proportion of adult fish captured in Reunion were derived from the West nursery area. Fish of West nursery origin were also found in the West Australian fishing ground. This large dispersal capacity was found during the Regional Tuna Tagging Program of the Indian Ocean (RTTP-IO), where tagged fish from Tanzania migrated eastward following the 28–29 °C isotherm [62], although fish from the west Indian Ocean were not recaptured as far east as West Australia in that study [23]. Fish with West nursery origin were also found among adult fish collected in South Africa although, during the RTTP-IO, few yellowfin tuna tagged off Tanzania were recovered in the Agulhas current, along the South African coast [23]. A substantial number of South African-caught fish were left unclassified as were a number from Reunion and West Australia. While this might be a result of the δ18O overlap among the estimated baselines, it is also possible that individuals from other, more local nursery areas not sampled in this study, were present in the adult mixed sample. In addition, a few adults with the Pakistan-like nursery signature were identified in each of the three adult locations sampled, suggesting that, as adults, some movements out of the potential Arabian Sea nursery area may occur. These movements by fish within the Arabian Sea area has been corroborated by RTTP-IO data analysing the trajectories of yellowfin tuna tagged off Oman (Figure S4). We did not find fish from the Central or East nursery origins in the adult mixed sample collected at any of the three fishing grounds. This may be explained by the retention of sub-adult and adult yellowfin tuna near these two nursery areas, or because yellowfin tuna from the Central and East nurseries tend to migrate towards feeding grounds not sampled in this study (e.g., Bay of Bengal). Limited movement of adult yellowfin tuna outside the Maldives region, where the Central nursery is located, was described in tagging studies [63]. It has been suggested that tuna tend to be less mobile in archipelagic waters than in the open ocean [63]. Another potential explanation is the large number of anchored fish aggregating devices (FADs) in the Maldivian region, under which yellowfin tuna and other species are exploited. Tunas are attracted to floating objects, and once lured and trapped in a network of anchored FADs, travelling distances of tuna can be reduced [64,65]. It is also possible that Central and East nurseries are less productive than the western equatorial area, and therefore the occurrence of individuals from these origins is lower.
The biggest limitation of the present study is that the available samples used as a calibration set (YOYs) did not match the cohort of our sub-adult and adult samples. For otolith chemical analyses, the existence of such temporal variability can diminish the interpretation of the observed results and confound spatial differences [66]. However, decadal stability of otolith δ18O values has been described by other authors [58,67] and no temporal differences were detected in otolith core δ18O values between YOY yellowfin tuna from different cohorts in the major nurseries of the Indian Ocean [50].

4.2. Oxygen Isotopic Distribution Along the Otolith and Isoscape Predictions

The SIMS analysis provided a high resolution δ18O record along the otolith growth transect. This is the first time that this analysis has been performed for a tropical tuna species, and the results highlight the potential of SIMS analyses to significantly expand our understanding of the movements and life history of this species. Electronic tagging devices can provide geolocation estimates for a fish on a daily basis, but data over the entire lifespan are not always available, either because very small fish are not able to carry the devices, the devices cannot store a large amount of data, batteries become exhausted, or the tags are not retained by the fish over that time [68,69]. Measuring variations in δ18O across an otolith growth axis using the SIMS approach provides fine scale information of the thermal experience of a fish over its lifetime, which may be particularly useful for comparing relative patterns of δ18O values among contingents, that is, fish with divergent migrations within stocks [70]. In the case of the yellowfin tuna analysed, the results indicate that the fish may have spent parts of its life in different water masses. At the beginning of the transect, relatively little variability in otolith δ18O was found, which may indicate retention within a homogeneous area in the first months of growth. Over this part of the transect, observed δ18O values were low and, as fish grew, δ18O values increased. According to the inverse relationship between otolith δ18O and water temperature [38,39], this suggests an overall decrease in experienced ambient water temperatures. This trend may reflect a migration from equatorial waters to higher latitudes, a shift in the depth niche inhabited or, more likely, a combination of both. It is known that yellowfin tuna perform extensive migrations between spawning and feeding grounds, but also that depth preference changes according to body size [22,71]. By combining available maps of oxygen δ18O and temperature at three depth ranges, the possible location of the analysed individual at a given point in time in the horizontal plane could be inferred. Although adult yellowfin tuna are capable of diving to depths in excess of 1000 m, these deep dives may not have sufficient duration to have been recorded in the otolith [55,72].
During the juvenile phase, the δ18O values were in the range of those predicted for the west equatorial Indian Ocean at 0–20 m and 20–50 m depth ranges (Figure 5A,B). As the fish grew, the observed δ18O values were in the range of those predicted for the south sub-equatorial Indian Ocean or the Arabian Basin for these same depth ranges. Alternatively, the analysed individual may also have moved to deeper waters (50–100 m) in west equatorial Indian Ocean or in subtropical waters south of the equator (Figure 5C). Some values also coincided with the range of predicted δ18O values for 25–30° S band in the Indian Ocean (all depth ranges), and therefore it is more likely that the fish was moving into south-tropical waters than into the north Arabian Sea. Due to the lack of a representative spot at the otolith edge, it was not possible to check whether observed δ18O coincided with that predicted for South Africa (where the fish was caught). It is most likely that this yellowfin tuna originated in the Indian Ocean rather than the Atlantic Ocean, because higher otolith δ18O values for the juvenile phase would have been detected in the latter case (Figure 5). This result is consistent with the findings from Mullins et al. [73], which did not find Atlantic origin fish among yellowfin tuna captured in South Africa.
However, there are several issues that decrease the accuracy with which environmental histories of yellowfin tuna in the Indian Ocean can be reconstructed using otolith δ18O composition. First, estimates were made based on the otolith fractionation equation using parameters estimated for Pacific Ocean bluefin tuna, a species belonging to the same sub-genus, but with different habitat preferences. This may have influenced the observed results, since experimentally determined values of γ and β appear to vary significantly among species [37]. The most robust approach for deriving a field-based fractionation equation parameter for yellowfin tuna, would be to analyse δ18O data from otoliths formed under stable water temperature and δ18Owater conditions of individuals reared in captivity [74]. In addition, otolith δ18O composition could be analysed on fish for which electronic tag information is available, providing a means for evaluating the accuracy of the estimates [75]. Second, the need of more precise estimates of water δ18O values is a current limitation for geolocation using otolith δ18O composition [47]. Third, the isoscape maps presented here were derived from measurements of mean annual sea surface temperatures coupled to ocean δ18O water values estimations. Local and/or seasonal fluctuation events in water temperature may lead to biased estimates of individual geolocation [34,41]. Likewise, δ18O water values available to date in the Indian Ocean are derived from a purely numerical approach rather than observational data. Future challenges of ocean δ18O water modeling include the addition of ocean circulation models that improve the representation of seasonal effects in δ18O water values [35]. Finally, individual variation in the physiological response to temperature needs to be better understood [41]. Most of the studies carried out to date have concluded that otolith δ18O is mainly driven by ambient temperatures and deposited in the otoliths independently of kinetic and metabolic effects [37,76,77,78]. However small-scale local fluctuations in water temperature, salinity and/or shifts in the pH of the endolymph may also bias estimates of individual geolocation and lead to inaccurate predictions [79,80].
One of the major challenges of the SIMS technique, is the difficulty in preparing suitable samples. Data quality from SIMS analyses depends on high quality sample surface condition [42,51] and samples that do not meet these high standards may need to be discarded. Yellowfin tuna have fragile, thin, and elliptic otoliths that require particular care during sectioning and polishing so preparing transverse sections is an extremely delicate process. Age estimates made by identifying and counting growth increments on the otoliths will allow spots for analysis to be positioned relative to growth increments at a “known age”. This will help identify the timing of latitudinal migrations between spawning and feeding locations more precisely. However, the inherent complexity of yellowfin tuna otoliths makes it challenging to estimate fish age from increment counts in otolith transverse sections [81,82] and further research is required in this area. Working towards solving these issues will enhance our ability to apply the SIMS technique to understanding yellowfin tuna life history.

5. Conclusions

Although results obtained from this study come from a limited number of samples, they suggest that connectivity and mixing rates of yellowfin tuna within the Indian Ocean might be more complex than previously assumed. This preliminary study points towards an asymmetric connectivity of yellowfin tuna within the Indian Ocean, with the West nursery being a major source of yellowfin tuna to the south equatorial fisheries of the Indian Ocean while the Central and East nurseries make little apparent contribution. In 2019, 75% of the total catch of yellowfin tuna in the Indian Ocean was caught in the western region [21]. The intense fishing of yellowfin tuna in this area, together with a lack of replenishment from the Central and East nurseries, may result in differential local or regional stock dynamics. Ignoring such patterns of connectivity could result in inaccurate estimates of stock productivity and misinterpretation of abundance trends in the stock assessment process [83]. Analysing early life δ18O signatures of YOY from known spawning areas over several years would set up a baseline for assigning older individuals to their nursery of origin more effectively. Locating and sampling other potential spawning areas in the Indian Ocean will expand our knowledge of nursery areas [11]. Given the distinct early life δ18O signature found in otoliths of yellowfin tuna collected off Pakistan, it will be important to investigate whether the region is, in fact, a spawning area. This would require larval surveys in the region and/or collecting samples from adult yellowfin tuna and performing macroscopic identification of gonads. Further research on the origin of adult yellowfin tuna using otolith microchemistry should be undertaken to investigate the contribution of different nursery regions to fishery catches. Moreover, targeted analysis of otoliths from adult fish in spawning condition at the different nursery areas could elucidate the degree of spawning area fidelity and exchange between nurseries. The SIMS approach proved to be a useful tool to infer the lifetime movements of an adult yellowfin tuna. The comparison of relative patterns of δ18O composition along the growth axis of the otolith among more individuals could contribute to a better understanding of the contingent structure and metapopulation dynamics of this species [84]. Although δ18O is a promising geolocator for yellowfin tuna in the Indian Ocean, more accurate estimates of water δ18O and the relationship between water δ18O and temperature are required. Therefore, additional research is necessary to identify the complex connectivity patterns and individual-scale movements of yellowfin tuna within the Indian Ocean, which will have important implications for the management of this species. Ultimately, this information will be essential to inform sustainable management decisions that ensure the future of the resource and, hence, the fishery.

Supplementary Materials

The following are available online at https://www.mdpi.com/article/10.3390/oceans2030026/s1, Figure S1: The MicroMill drill path used (red line) for oxygen stable isotope analyses in two yellowfin tunas of 29 cm FL (A) and 134 cm FL (B) otolith transverse sections, Figure S2: Transverse section of an adult yellowfin tuna (Thunnus albacares) otolith showing the transect (red line) followed and spot analysis locations (black numbering) for δ18O SIMS analysis, Figure S3: Seasonal mean sea surface salinity (SSS, top panels) and sea surface temperature (SST, bottom panels) in the Indian Ocean averaged for the 2017–2018 period in December, January, February and March (left-hand panels) and June, July, August, September and October (right hand panels). Monthly data was obtained from the “INSITU_GLO_TS_OA_NRT_OBSERVATIONS_013_002_a” product available in the EU Copernicus Marine Service Information, Figure S4: Trajectories of 46 yellowfin tuna (Thunnus albacares) tagged off Oman. Data from the RTTP-IO database (https://www.iotc.org/tagging-data-2014-0, accessed on 10 March 2021), Table S1: Raw secondary ion mass spectrometry measurements of δ18O along the growth axis of an otolith from a 134 cm FL yellowfin tuna (Thunnus albacares) captured in South Africa.

Author Contributions

Conceptualization, I.A.-A., I.F. and H.M.; methodology, D.L.D.; validation, A.M.D. and N.C.; formal analysis, I.A.-A.; investigation, I.A.-A., resources, J.F.; data curation, J.F. and I.A.-A.; writing—original draft preparation, I.A.-A.; writing—review and editing, I.F., J.F., A.M.D., N.C., D.L.D., F.M., C.D. and H.M.; visualization, I.A.-A.; supervision, I.F. and H.M.; project administration, I.F., F.M., C.D. and H.M.; funding acquisition, C.D., F.M. and H.M. All authors have read and agreed to the published version of the manuscript.

Funding

This research was funded by the European Union, grant number S12.697993 and the FAO/IOTC, within the framework of a collaborative project (GCP/INT/233/EC–Population structure of IOTC species in the Indian Ocean) between FAO/IOTC and CSIRO Oceans and Atmosphere, AZTI, Institut de Recherche pour le Développement (IRD), and Indonesia’s Center for Fisheries Research (CFR). IAA was funded by a PhD research grant of the Department of Agriculture, Fisheries and Food Policy from the Basque Government (Convocatoria ayudas de formación a jóvenes investigadores y tecnólogos 2017).

Institutional Review Board Statement

Ethical review and approval were waived for this study, because the fish were obtained from fisheries and were already dead when the otoliths were extracted.

Data Availability Statement

The IRMS data presented in this study is openly available in [FigShare] at [10.6084/m9.figshare.14212340]. The SIMS data presented in this study is available in [Table S1].

Acknowledgments

Authors want also to thank to the many people that were involved in the collection of the otoliths used for this study; Iñigo Krug from AZTI-BRTA, Natacha Nikolic and Anais Médieu from MARBEC, Mohamed Ahusan from Maldives Research Institute, Matt Lansdell and Craig Proctor from CSIRO, Asep Priatna, Pratiwi Lestari, and Muhammad Taufik from Indonesian Research Institute for Marine Fisheries, Denham Parker from CAPFISH Sudafrica, Hamid Badar Usmani, Kashifa Zehra, and Mohammad Wasim Khan from Marine Fisheries Department of Pakistan, and Umair Shahid, Syed Meesum Reza Kazmi, Saeed ul Islam, Mariam Tariq, Sidra Zafar and Jaweria Zaidi from WWF Pakistan, we are grateful for all their efforts. We would also like to thank the many vessel owners, skippers, observers, crews, and processors who provided fish for sampling. SIMS analyses at the Edinburgh Ion Micro-Probe Facility (EIMF) were conducted under the supervision of John Craven. We thank him for his help and assistance with technical issues. This document is the contribution 1033 from AZTI, Marine Research, Basque Research and Technology Alliance (BRTA).

Conflicts of Interest

The authors declare no conflict of interest. The funders had no role in the design of the study; in the collection, analyses, or interpretation of data; in the writing of the manuscript, or in the decision to publish the results. The views expressed herein can in no way be taken to reflect the official opinion of the European Union.

References

  1. Kritzer, J.P.; Liu, O.R. Fishery management strategies for addressing complex spatial structure in marine fish stocks. In Stock Identification Methods: Applications in Fishery Science, 2nd ed.; Cadrin, S.X., Kerr, L., Mariani, S., Eds.; Elsevier Academic Press: Amsterdam, The Netherlands, 2014; pp. 29–57. [Google Scholar] [CrossRef]
  2. Aranda, M.; Murillas, A.; Motos, L. International management of shared stocks. In Developments in Aquaculture and Fisheries Science; Elsevier BV: Amsterdam, The Netherlands, 2006; Chapter 2; pp. 29–54. [Google Scholar]
  3. Collette, B.B.; Nauen, C.E. Scombrids of the World. An Annotated and Illustrated Catalogue of Tunas, Mackerels, Bonitos and Related Species Known to Date; FAO: Rome, Italy, 1983. [Google Scholar]
  4. ISSF. Status of the World Fisheries for Tuna. March 2020; ISSF Technical Report 2020-12; ISSF: Washington, DC, USA, 2020. [Google Scholar]
  5. IOTC. Nominal Catch by Species and Gear, by Vessel Flag Reporting Country. IOTC-2019-DATASETS-NCDB. 2019. Available online: https://www.iotc.org/data/datasets/latest/NC (accessed on 17 January 2020).
  6. IOTC. Status of Yellowfin Tuna (Thunnus albacares) in the Indian Ocean; Executive Summery 2020; IOTC: Victoria, Seychelles, 2020; Appendix 11; Available online: https://www.iotc.org/sites/default/files/Yellowfin2020.pdf (accessed on 1 December 2020).
  7. IOTC. Yellowfin Tuna Supporting Information. Status Summary for Species of Tuna and Tuna-Like Species Under IOTC Mandate, as well as Other Species Impacted by IOTC Fisheries. 2017. Available online: http://www.iotc.org/documents/status-indian-ocean-yellowfin-tuna-yft-thunnus-albacares-resource (accessed on 3 February 2017).
  8. Proctor, C.H.; Lester, R.J.G.; Clear, N.P.; Grewe, P.M.; Moore, B.R.; Eveson, J.P.; Lestari, P.; Wujdi, A.; Taufik, M.; Wudianto Lansdell, M.J.; et al. Population Structure of Yellowfin Tuna (Thunnus albacares) and Bigeye Tuna (T. obesus) in the Indonesian Region. Final Report as Output of ACIAR Project FIS/2009/059; ACIAR: Hobart, Australia, 2019. [Google Scholar]
  9. Dammannagoda, S.T.; Hurwood, D.A.; Mather, P.B. Evidence for fine geographical scale heterogeneity in gene frequencies in yellowfin tuna (Thunnus albacares) from the north Indian Ocean around Sri Lanka. Fish. Res. 2008, 90, 147–157. [Google Scholar] [CrossRef] [Green Version]
  10. Kunal, S.P.; Kumar, G.; Menezes, M.R.; Meena, R.M. Mitochondrial DNA analysis reveals three stocks of yellowfin tuna Thunnus albacares (Bonnaterre, 1788) in Indian waters. Conserv. Genet. 2013, 14, 205–213. [Google Scholar] [CrossRef]
  11. Artetxe-Arrate, I.; Fraile, I.; Marsac, F.; Farley, J.H.; Rodriguez-Ezpeleta, N.; Davies, C.R.; Clear, N.P.; Grewe, P.; Murua, H. A review of the fisheries, life history and stock structure of tropical tuna (skipjack Katsuwonus pelamis, yellowfin Thunnus albacares and bigeye Thunnus obesus) in the Indian Ocean. Adv. Mar. Biol. 2020, 88, 39–89. [Google Scholar] [CrossRef]
  12. Sharp, G.D. Tuna Oceanography-an applied science. In Tuna: Physiology, Ecology, and Evolution; Block, B., Stevens, G., Eds.; Academic Press: San Diego, CA, USA, 2001; pp. 345–388. [Google Scholar]
  13. Schaefer, K.M. Reproductive biology of tunas. In Tuna: Physiology, Ecology and Evolution; Block, B.A., Stevens, E., Eds.; Academic Press: San Diego, CA, USA, 2001; pp. 225–270. [Google Scholar] [CrossRef]
  14. Reglero, P.; Tittensor, D.; Álvarez-Berastegui, D.; Aparicio-González, A.; Worm, B. Worldwide distributions of tuna larvae: Revisiting hypotheses on environmental requirements for spawning habitats. Mar. Ecol. Prog. Ser. 2014, 501, 207–224. [Google Scholar] [CrossRef] [Green Version]
  15. Muhling, B.A.; Lamkin, J.T.; Alemany, F.; García-García, A.; Farley, J.; Ingram, G.W.; Álvarez-Berastegui, D.; Reglero, P.; Carrion, R.L. Reproduction and larval biology in tunas, and the importance of restricted area spawning grounds. Rev. Fish. Biol. Fish. 2017, 27, 697–732. [Google Scholar] [CrossRef]
  16. Boehlert, G.; Mundy, B. Vertical and onshore-offshore distributional patterns of tuna larvae in relation to physical habitat features. Mar. Ecol. Prog. Ser. 1994, 107, 1–13. [Google Scholar] [CrossRef]
  17. Zudaire, I.; Murua, H.; Grande, M.; Bodin, N. Reproductive potential of Yellowfin Tuna (Thunnus albacares) in the western Indian Ocean. Fish. Bull. 2013, 111, 252–264. [Google Scholar] [CrossRef] [Green Version]
  18. Zhu, G.; Xu, L.; Zhou, Y.; Song, L. Reproductive biology of yellowfin tuna T. albacares in the west-central Indian Ocean. J. Ocean. Univ. China 2008, 7, 327–332. [Google Scholar] [CrossRef]
  19. Nootmorn, P.; Yakoh, A.; Kawises, K. Reproductive Biology of Yellowfin Tuna in the Eastern Indian Ocean; IOTC-2005-WPTT-14; IOTC: Victoria, Seychelles, 2005; pp. 379–385. [Google Scholar]
  20. Stéquert, B.; Marsac, F. Tropical Tuna–Surface Fisheries in the Indian Ocean; FAO Fisheries Technical Paper; FAO: Rome, Italy, 1989. [Google Scholar]
  21. IOTC. Nominal Catches by Fleet, Year, Gear, IOTC Area and Species. IOTC-2020-WPTT22(AS)-DATA03. 2020. Available online: https://www.iotc.org/WPTT/22AS/Data/03-NC (accessed on 4 December 2020).
  22. Fonteneau, A.; Pallares-Soubrier, P. Interactions between tuna fisheries: A global review with specific examples from the Atlantic Ocean. In Status of Interactions of Pacific Tuna Fisheries in 1995, Proceedings of the Second FAO Expert Consultation Interactions of Pacific Tuna Fisheries, Shimizu, Japan, 23–31 January 1995; Shomura, R.S., Majkowski, J., Harman, R.F., Eds.; FAO Fisheries Technical Paper; FAO: Rome, Italy, 1995; Available online: http://www.fao.org/3/W3628E/w3628e0b.htm (accessed on 15 November 2020).
  23. Fonteneau, A.; Hallier, J.-P. Fifty years of dart tag recoveries for tropical tuna: A global comparison of results for the western Pacific, eastern Pacific, Atlantic, and Indian Oceans. Fish. Res. 2015, 163, 7–22. [Google Scholar] [CrossRef]
  24. Kerr, L.A.; Hintzen, N.; Cadrin, S.X.; Clausen, L.W.; Dickey-Collas, M.; Goethel, D.; Hatfield, E.M.; Kritzer, J.P.; Nash, R.D. Lessons learned from practical approaches to reconcile mismatches between biological population structure and stock units of marine fish. ICES J. Mar. Sci. 2017, 74, 1708–1722. [Google Scholar] [CrossRef] [Green Version]
  25. Bosley, K.M.; Goethel, D.R.; Berger, A.M.; Deroba, J.J.; Fenske, K.H.; Hanselman, D.H.; Langseth, B.J.; Schueller, A.M. Overcoming challenges of harvest quota allocation in spatially structured populations. Fish. Res. 2019, 220, 105344. [Google Scholar] [CrossRef]
  26. Kitchens, L.; Rooker, J.; Reynal, L.; Falterman, B.; Saillant, E.; Murua, H. Discriminating among yellowfin tuna Thunnus albacares nursery areas in the Atlantic Ocean using otolith chemistry. Mar. Ecol. Prog. Ser. 2018, 603, 201–213. [Google Scholar] [CrossRef]
  27. Wells, R.; Rooker, J.; Itano, D. Nursery origin of yellowfin tuna in the Hawaiian Islands. Mar. Ecol. Prog. Ser. 2012, 461, 187–196. [Google Scholar] [CrossRef] [Green Version]
  28. Rooker, J.R.; Wells, R.J.D.; Itano, D.G.; Thorrold, S.R.; Lee, J.M. Natal origin and population connectivity of bigeye and yellowfin tuna in the Pacific Ocean. Fish. Oceanogr. 2016, 25, 277–291. [Google Scholar] [CrossRef]
  29. Campana, S.E. Chemistry and composition of fish otoliths:pathways, mechanisms and applications. Mar. Ecol. Prog. Ser. 1999, 188, 263–297. [Google Scholar] [CrossRef] [Green Version]
  30. Thorrold, S.R.; Latkoczy, C.; Swart, P.K.; Jones, C.M. Natal Homing in a Marine Fish Metapopulation. Science 2001, 291, 297–299. [Google Scholar] [CrossRef] [Green Version]
  31. Rooker, J.R.; Secor, D.H. Stock Structure and Mixing of Atlantic Bluefin Tuna: Evidence from Stable δ13C and δ18O Isotopes in Otoliths; ICCAT Collective Volume of Scientific Papers; ICCAT: Madrid, Spain, 2004; Volume 56, pp. 1115–1120. [Google Scholar]
  32. Kerr, L.A.; Whitener, Z.T.; Cadrin, S.X.; Morse, M.R.; Secor, D.H.; Golet, W. Mixed stock origin of Atlantic bluefin tuna in the U.S. rod and reel fishery (Gulf of Maine) and implications for fisheries management. Fish. Res. 2020, 224, 105461. [Google Scholar] [CrossRef]
  33. Secor, D.H. Synopsis of Regional Mixing Levels for Atlantic Bluefin Tuna Estimated from Otolith Stable Isotope Analysis, 2007–2014; Collective Volume of Scientific Papers ICCAT.; ICCAT: Madrid, Spain, 2015; Volume 71, pp. 1683–1689. [Google Scholar]
  34. Darnaude, A.M.; Hunter, E. Validation of otolith δ18O values as effective natural tags for shelf-scale geolocation of migrating fish. Mar. Ecol. Prog. Ser. 2018, 598, 167–185. [Google Scholar] [CrossRef] [Green Version]
  35. LeGrande, A.N.; Schmidt, G. Global gridded data set of the oxygen isotopic composition in seawater. Geophys. Res. Lett. 2006, 33. [Google Scholar] [CrossRef] [Green Version]
  36. Wrigth, J. Global climate change in Marine Stable Isotope Records. In Quaternary Geo-Chronology: Methods and Applications; Noller, J., Sowers, J., Lettis, W., Eds.; American Geophysical Union: Washington, DC, USA, 2013; pp. 671–682. [Google Scholar]
  37. Kitagawa, T.; Ishimura, T.; Uozato, R.; Shirai, K.; Amano, Y.; Shinoda, A.; Otake, T.; Tsunogai, U.; Kimura, S. Otolith δ18O of Pacific bluefin tuna Thunnus orientalis as an indicator of ambient water temperature. Mar. Ecol. Prog. Ser. 2013, 481, 199–209. [Google Scholar] [CrossRef] [Green Version]
  38. Thorrold, S.; Campana, S.E.; Jones, C.M.; Swart, P. Factors determining δ13C and δ18O fractionation in aragonitic otoliths of marine fish. Geochim. Cosmochim. Acta 1997, 61, 2909–2919. [Google Scholar] [CrossRef]
  39. Trueman, C.N.; MacKenzie, K.; Palmer, M.R. Identifying migrations in marine fishes through stable-isotope analysis. J. Fish. Biol. 2012, 81, 826–847. [Google Scholar] [CrossRef]
  40. Hsieh, Y.; Shiao, J.; Lin, S.; Iizuka, Y. Quantitative reconstruction of salinity history by otolith oxygen stable isotopes: An example of a euryhaline fishLateolabrax japonicus. Rapid Commun. Mass Spectrom. 2019, 33, 1344–1354. [Google Scholar] [CrossRef] [PubMed]
  41. Darnaude, A.M.; Sturrock, A.; Trueman, C.N.; Mouillot, D.; EIMF; Campana, S.; Hunter, E. Listening In on the Past: What Can Otolith δ18O Values Really Tell Us about the Environmental History of Fishes? PLoS ONE 2014, 9, e108539. [Google Scholar] [CrossRef] [PubMed] [Green Version]
  42. Hane, Y.; Kimura, S.; Yokoyama, Y.; Miyairi, Y.; Ushikubo, T.; Ishimura, T.; Ogawa, N.; Aono, T.; Nishida, K. Reconstruction of temperature experienced by Pacific bluefin tuna Thunnus orientalis larvae using SIMS and microvolume CF-IRMS otolith oxygen isotope analyses. Mar. Ecol. Prog. Ser. 2020, 649, 175–188. [Google Scholar] [CrossRef]
  43. Matta, M.E.; Orland, I.; Ushikubo, T.; Helser, T.E.; Black, B.; Valley, J. Otolith oxygen isotopes measured by high-precision secondary ion mass spectrometry reflect life history of a yellowfin sole (Limanda aspera). Rapid Commun. Mass Spectrom. 2013, 27, 691–699. [Google Scholar] [CrossRef]
  44. Shiao, J.-C.; Itoh, S.; Yurimoto, H.; Iizuka, Y.; Liao, Y.-C. Oxygen isotopic distribution along the otolith growth axis by secondary ion mass spectrometry: Applications for studying ontogenetic change in the depth inhabited by deep-sea fishes. Deep. Sea Res. Part. I Oceanogr. Res. Pap. 2014, 84, 50–58. [Google Scholar] [CrossRef]
  45. Shirai, K.; Otake, T.; Amano, Y.; Kuroki, M.; Ushikubo, T.; Kita, N.T.; Murayama, M.; Tsukamoto, K.; Valley, J. Temperature and depth distribution of Japanese eel eggs estimated using otolith oxygen stable isotopes. Geochim. Cosmochim. Acta 2018, 236, 373–383. [Google Scholar] [CrossRef]
  46. Willmes, M.; Lewis, L.S.; Davis, B.; Loiselle, L.; James, H.F.; Denny, C.; Baxter, R.; Conrad, J.L.; Fangue, N.A.; Hung, T.; et al. Calibrating temperature reconstructions from fish otolith oxygen isotope analysis for California’s critically endangered Delta Smelt. Rapid Commun. Mass Spectrom. 2019, 33, 1207–1220. [Google Scholar] [CrossRef]
  47. Trueman, C.; St John Glew, K. Isotopic Tracking of Marine Animal Movement. In Tracking Animal Migration with Stable Isotopes, 2nd ed.; Hobson, K., Wassenaar, L., Eds.; Academic Press: San Diego, CA, USA, 2019; pp. 137–172. [Google Scholar] [CrossRef]
  48. Davies, C.; Marsca, F.; Murua, H.; Fraile, I.; Fahmi, Z.; Farley, J.; Grewe, P.; Proctor, C.; Clear, N.; Lansdell, M.; et al. Study of Population Structure of IOTC Species and Sharks of Interest in the Indian Ocean Using Genetics and Microchemistry: 2020; Final Report to IOTC.; FAO: Rome, Italy, 2020. [Google Scholar]
  49. Eveson, J.P.; Million, J.; Sardenne, F.; Le Croizier, G. Estimating growth of tropical tunas in the Indian Ocean using tag-recapture data and otolith-based age estimates. Fish. Res. 2015, 163, 58–68. [Google Scholar] [CrossRef]
  50. Artetxe-Arrate, I.; Fraile, I.; Clear, N.; Darnaude, A.; Dettman, D.; Pécheyran, C.; Farley, J.; Murua, H. Discrimination of yellowfin tuna (Thunnus albacares) from nursery areas in the Indian Ocean using otolith chemistry. Mar. Ecol. Prog. Ser. 2021. [Google Scholar] [CrossRef]
  51. Kita, N.T.; Ushikubo, T.; Fu, B.; Valley, J. High precision SIMS oxygen isotope analysis and the effect of sample topography. Chem. Geol. 2009, 264, 43–57. [Google Scholar] [CrossRef]
  52. Graham, C.M.; Valley, J.W.; Eiler, J.M.; Wada, H. Timescales and mechanisms of fluid infiltration in a marble: An ion microprobe study. Contrib. Miner. Pet. 1998, 132, 371–389. [Google Scholar] [CrossRef]
  53. Brand, W.A.; Coplen, T.B.; Vogl, J.; Rosner, M.; Prohaska, T. Assessment of international reference materials for isotope-ratio analysis (IUPAC Technical Report). Pure Appl. Chem. 2014, 86, 425–467. [Google Scholar] [CrossRef]
  54. Helser, T.E.; Kastelle, C.R.; McKay, J.L.; Orland, I.J.; Kozdon, R.; Valley, J. Evaluation of micromilling/conventional isotope ratio mass spectrometry and secondary ion mass spectrometry of δ18O values in fish otoliths for sclerochronology. Rapid Commun. Mass Spectrom. 2018, 32, 1781–1790. [Google Scholar] [CrossRef]
  55. Schaefer, K.M.; Fuller, D.W.; Block, B.A. Movements, behavior, and habitat utilization of yellowfin tuna (Thunnus albacares) in the northeastern Pacific Ocean, ascertained through archival tag data. Mar. Biol. 2007, 152, 503–525. [Google Scholar] [CrossRef]
  56. Rooker, J.R.; Fraile, I.; Liu, H.; Abid, N.; Dance, M.A.; Itoh, T.; Kimoto, A.; Tsukahara, Y.; Rodriguez-Marin, E.; Arrizabalaga, H. Wide-Ranging Temporal Variation in Transoceanic Movement and Population Mixing of Bluefin Tuna in the North Atlantic Ocean. Front. Mar. Sci. 2019, 6, 1–13. [Google Scholar] [CrossRef] [Green Version]
  57. R Core Team. R: A Language and Environment for Statistical Computing; R Foundation for Statistical Computing: Vienna, Austria, 2019; Available online: https://www.R-project.org/ (accessed on 1 December 2020).
  58. Rooker, J.R.; Secor, D.; De Metrio, G.; Schloesser, R.; Block, B.A.; Neilson, J.D. Natal Homing and Connectivity in Atlantic Bluefin Tuna Populations. Science 2008, 322, 742–744. [Google Scholar] [CrossRef] [Green Version]
  59. Keshtgar, B.; Alizadeh-Choobari, O.; Irannejad, P. Seasonal and interannual variations of the intertropical convergence zone over the Indian Ocean based on an energetic perspective. Clim. Dyn. 2020, 54, 3627–3639. [Google Scholar] [CrossRef]
  60. Barth, J.M.; Damerau, M.; Matschiner, M.; Jentoft, S.; Hanel, R. Genomic Differentiation and Demographic Histories of Atlantic and Indo-Pacific Yellowfin Tuna (Thunnus albacares) Populations. Genome Biol. Evol. 2017, 9, 1084–1098. [Google Scholar] [CrossRef]
  61. Grewe, P.; Feutry, P.; Foster, S.; Aulich, J.; Landsdell, M.; Cooper, S.; Clear, N.; Nikolic, N.; Krug, I.; Mendibil, I.; et al. Genetic Population Connectivity of Yellowfin Tuna in the Indian Ocean from the PSTBS-IO Project; Report No.: IOTC-2020-WPTT22(AS)12_REV1; FAO: Rome, Italy, 2020. [Google Scholar]
  62. Langley, A.; Million, J. Determining an Appropriate Tag Mixing Period for the Indian Ocean Yellowfin Tuna Stock Assessment; IOTC–2012–WPTT14–31; FAO: Rome, Italy, 2012. [Google Scholar]
  63. Kolody, D.; Hoyle, S. Evaluation of Tag Mixing Assumptions for Skipjack, Yellowfin and Bigeye Tuna Stock Assessments in the Western Pacific and Indian Oceans; WCPFC-SC9-2013/ SA-IP-11; FAO: Rome, Italy, 2013. [Google Scholar]
  64. Hallier, J.-P.; Gaertner, D. Drifting fish aggregation devices could act as an ecological trap for tropical tuna species. Mar. Ecol. Prog. Ser. 2008, 353, 255–264. [Google Scholar] [CrossRef] [Green Version]
  65. Fonteneau, A. On the Movements and Stock Structure of Skipjack (Katsuwonus pelamis) in the Indian Ocean; IOTC–2014–WPTT16–36; FAO: Rome, Italy, 2014; pp. 1–16. [Google Scholar]
  66. Gillanders, B. Temporal and spatial variability in elemental composition of otoliths: Implications for determining stock identity and connectivity of populations. Can. J. Fish. Aquat. Sci. 2002, 59, 669–679. [Google Scholar] [CrossRef]
  67. Schloesser, R.; Rooker, J.R.; Louchuoarn, P.; Neilson, J.D.; Secor, D. Interdecadal variation in seawater d13C and d18O recorded in fish otoliths. Limnol. Oceanogr. 2009, 54, 1665–1668. [Google Scholar] [CrossRef] [Green Version]
  68. Brownscombe, J.W.; Lédée, E.J.I.; Raby, G.D.; Struthers, D.P.; Gutowsky, L.; Nguyen, V.; Young, N.; Stokesbury, M.J.W.; Holbrook, C.M.; Brenden, T.O.; et al. Conducting and interpreting fish telemetry studies: Considerations for researchers and resource managers. Rev. Fish. Biol. Fish. 2019, 29, 369–400. [Google Scholar] [CrossRef]
  69. Musyl, M.; Domeier, M.; Nasby-Lucas, N.; Brill, R.; McNaughton, L.; Swimmer, J.; Lutcavage, M.; Wilson, S.; Galuardi, B.; Liddle, J. Performance of pop-up satellite archival tags. Mar. Ecol. Prog. Ser. 2011, 433, 1–28. [Google Scholar] [CrossRef] [Green Version]
  70. Secor, D.H. Specifying divergent migrations in the conceptof stock: The contingent hypothesis. Fish Res. 1999, 43, 13–34. [Google Scholar] [CrossRef]
  71. Graham, J.B.; Dickson, K.A. Tuna comparative physiology. J. Exp. Biol. 2004, 207, 4015–4024. [Google Scholar] [CrossRef] [Green Version]
  72. Dagorn, L.; Holland, K.N.; Hallier, J.-P.; Taquet, M.; Moreno, G.; Sancho, G.; Itano, D.G.; Aumeeruddy, R.; Girard, C.; Million, J.; et al. Deep diving behavior observed in yellowfin tuna (Thunnus albacares). Aquat. Living Resour. 2006, 19, 85–88. [Google Scholar] [CrossRef] [Green Version]
  73. Mullins, R.B.; McKeown, N.; Sauer, W.H.H.; Shaw, P. Genomic analysis reveals multiple mismatches between biological and management units in yellowfin tuna (Thunnus albacares). ICES J. Mar. Sci. 2018, 75, 2145–2152. [Google Scholar] [CrossRef]
  74. Nakamura, M.; Yoneda, M.; Ishimura, T.; Shirai, K.; Tamamura, M.; Nishida, K. Temperature dependency equation for chub mackerel (Scomber japonicus) identified by a laboratory rearing experiment and microscale analysis. Mar. Freshw. Res. 2020, 71, 1384. [Google Scholar] [CrossRef] [Green Version]
  75. Tanner, S.E.; Santos, P.R.; Cabral, H. Otolith chemistry in stock delineation: A brief overview, current challenges and future prospects. Fish. Res. 2016, 173, 206–213. [Google Scholar] [CrossRef]
  76. Geffen, A.J. Otolith oxygen and carbon stable isotopes in wild and laboratory-reared plaice (Pleuronectes platessa). Environ. Boil. Fishes 2012, 95, 419–430. [Google Scholar] [CrossRef]
  77. Macdonald, J.I.; Drysdale, R.; Witt, R.; Cságoly, Z.; Marteinsdóttir, G. Isolating the influence of ontogeny helps predict island-wide variability in fish otolith chemistry. Rev. Fish. Biol. Fish. 2019, 30, 173–202. [Google Scholar] [CrossRef]
  78. Kalish, J.M. Marine Biology Oxygen and carbon stable isotopes in the otoliths. Mar Biol. 1991, 110, 37–47. [Google Scholar] [CrossRef]
  79. Nishida, K.; Yasu, A.; Nanjo, N.; Takahashi, M.; Kitajima, S.; Ishimura, T. Microscale stable carbon and oxygen isotope measurement of individual otoliths of larvae and juveniles of Japanese anchovy and sardine. Estuar. Coast. Shelf Sci. 2020, 245, 106946. [Google Scholar] [CrossRef]
  80. Høie, H.; Folkvord, A.; Otterlei, E. Effect of somatic and otolith growth rate on stable isotopic composition of early juvenile cod (Gadus morhua L) otoliths. J. Exp. Mar. Biol. Ecol. 2003, 289, 41–58. [Google Scholar] [CrossRef]
  81. Shih, C.-L.; Hsu, C.-C.; Chen, C.-Y. First attempt to age yellowfin tuna, Thunnus albacares, in the Indian Ocean, based on sectioned otoliths. Fish. Res. 2014, 149, 19–23. [Google Scholar] [CrossRef]
  82. Sardenne, F.; Dortel, E.; Le Croizier, G.; Million, J.; Labonne, M.; Leroy, B.; Bodin, N.; Chassot, E. Determining the age of tropical tunas in the Indian Ocean from otolith microstructures. Fish. Res. 2015, 163, 44–57. [Google Scholar] [CrossRef] [Green Version]
  83. Kerr, L.A.; Cadrin, S.X.; Secor, D.H.; Taylor, N. Evaluating the Effect of Atlantic Bluefin Tuna Movement on the Perception of Stock Units; ICCAT Collective Volume of Scientific Papers; ICCAT: Madrid, Spain, 2015; Volume 74, pp. 1660–1682. [Google Scholar]
  84. Cadrin, S.X.; Secor, D.H. Accounting for Spatial Population Structure in Stock Assessment: Past, Present, and Future. In The Future of Fisheries Science in North America; Beamish, R., Rothschild, B., Eds.; Springer Science and Business Media LLC: Amsterdam, The Netherlands, 2009; pp. 405–426. [Google Scholar]
Figure 1. Sampling distribution of yellowfin tuna (Thunnus albacares) in the Indian Ocean. Otolith collections included young of the year from nursery areas used as baseline (light blue) and sub-adults and/or adults from fishery grounds (dark blue).
Oceans 02 00026 g001
Figure 2. Boxplots showing otolith early life δ18O composition of YOY (light blue) and sub-adult (dark blue) yellowfin tuna (Thunnus albacares) from the Indian Ocean. Letters identify significant differences (Tukey HSD, p < 0.05) between location means. Inter quartile range (25th and 75th percentile) is shown by extent of boxes and error bars represent 10th and 90th percentiles. Median (50th percentile) and mean values are shown in boxes as black lines and red dots, respectively.
Oceans 02 00026 g002
Figure 3. Estimated number of Pakistan-like (yellow), West nursery (blue) and undetermined (grey) origin yellowfin tuna (Thunnus albacares) samples captured in three different fishing grounds of the Indian Ocean. Results are based on multinomial logistic regression (MLR) framework. Four probability thresholds (0.5–0.8) are shown.
Oceans 02 00026 g003
Figure 4. Measurements of δ18O values made by SIMS across the otolith growth axis from core to the near-edge in an adult yellowfin tuna. The 134 cm FL individual was captured in South Africa in May 2018. Dots are values measured at each spot, and solid line represents the mobile mean. The approximate location of the first month of life and 4.5+ years are indicated.
Oceans 02 00026 g004
Figure 5. Isoscape of predicted δ18O composition in otoliths based on global surface water measured δ18O values [35] at 0–20 m (A), 20–50 m (B) and 50–100 m (C), using the equation T = γ(δ18OOTO − δ18OWATER) + β [39] and parameters γ and β from [37]. Data were averaged at each 1° × 1° grid.
Oceans 02 00026 g005
Table 1. Number, sampling period, size, and estimated ages of yellowfin tuna (Thunnus albacares) at each sampling area. Size is fork length (FL) in cm.
LocationNSampling DatesFL Range (cm)Estimated
Age (years)
Life Stage
Classification 1
West nursery51March–April 2018 and 201926–37<1YOY
Central nursery31August 2018 and February 201928–36<1YOY
East nursery31April and November 201819–34<1YOY
Pakistan12September 201864–751–2Sub-adult
Reunion15December 201747–511Sub-adult
Reunion12February–March 2018;
February 2019
124–169>4Adult
South Africa19March–May 2018133–138>4Adult
West Australia8May 2019143–174>5Adult
1 Life stage classifications according to the age-length key relationship described in Eveson et al. [49] and maturity threshold in Zudaire et al. [17].
Publisher’s Note: MDPI stays neutral with regard to jurisdictional claims in published maps and institutional affiliations.