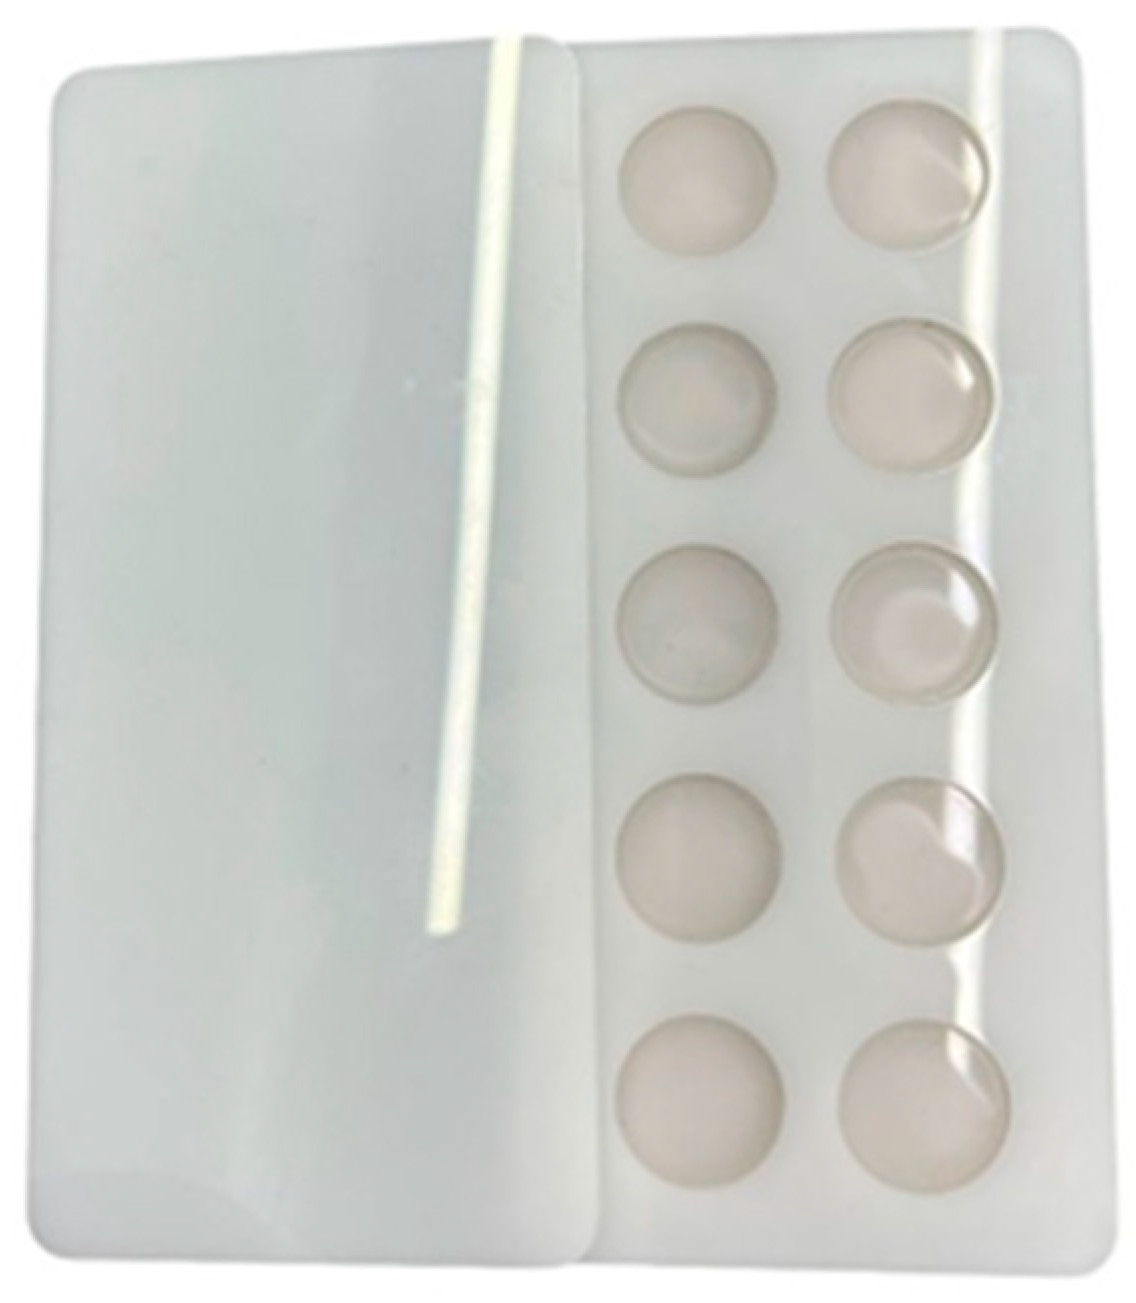
Figure 1.
Custom polypropylene plastic sheets were laser-cut to serve as molds for circular specimens.
Figure 1.
Custom polypropylene plastic sheets were laser-cut to serve as molds for circular specimens.
Figure 2.
Specimen fabrication for color stability tests. (A) Fifty (50) circular discs (Ø20 × 2 mm) for colorimeter device and visual examination tests, (B) fifty (50) rectangular samples (40 × 4 × 0.5 mm) for spectrophotometer device test.
Figure 2.
Specimen fabrication for color stability tests. (A) Fifty (50) circular discs (Ø20 × 2 mm) for colorimeter device and visual examination tests, (B) fifty (50) rectangular samples (40 × 4 × 0.5 mm) for spectrophotometer device test.
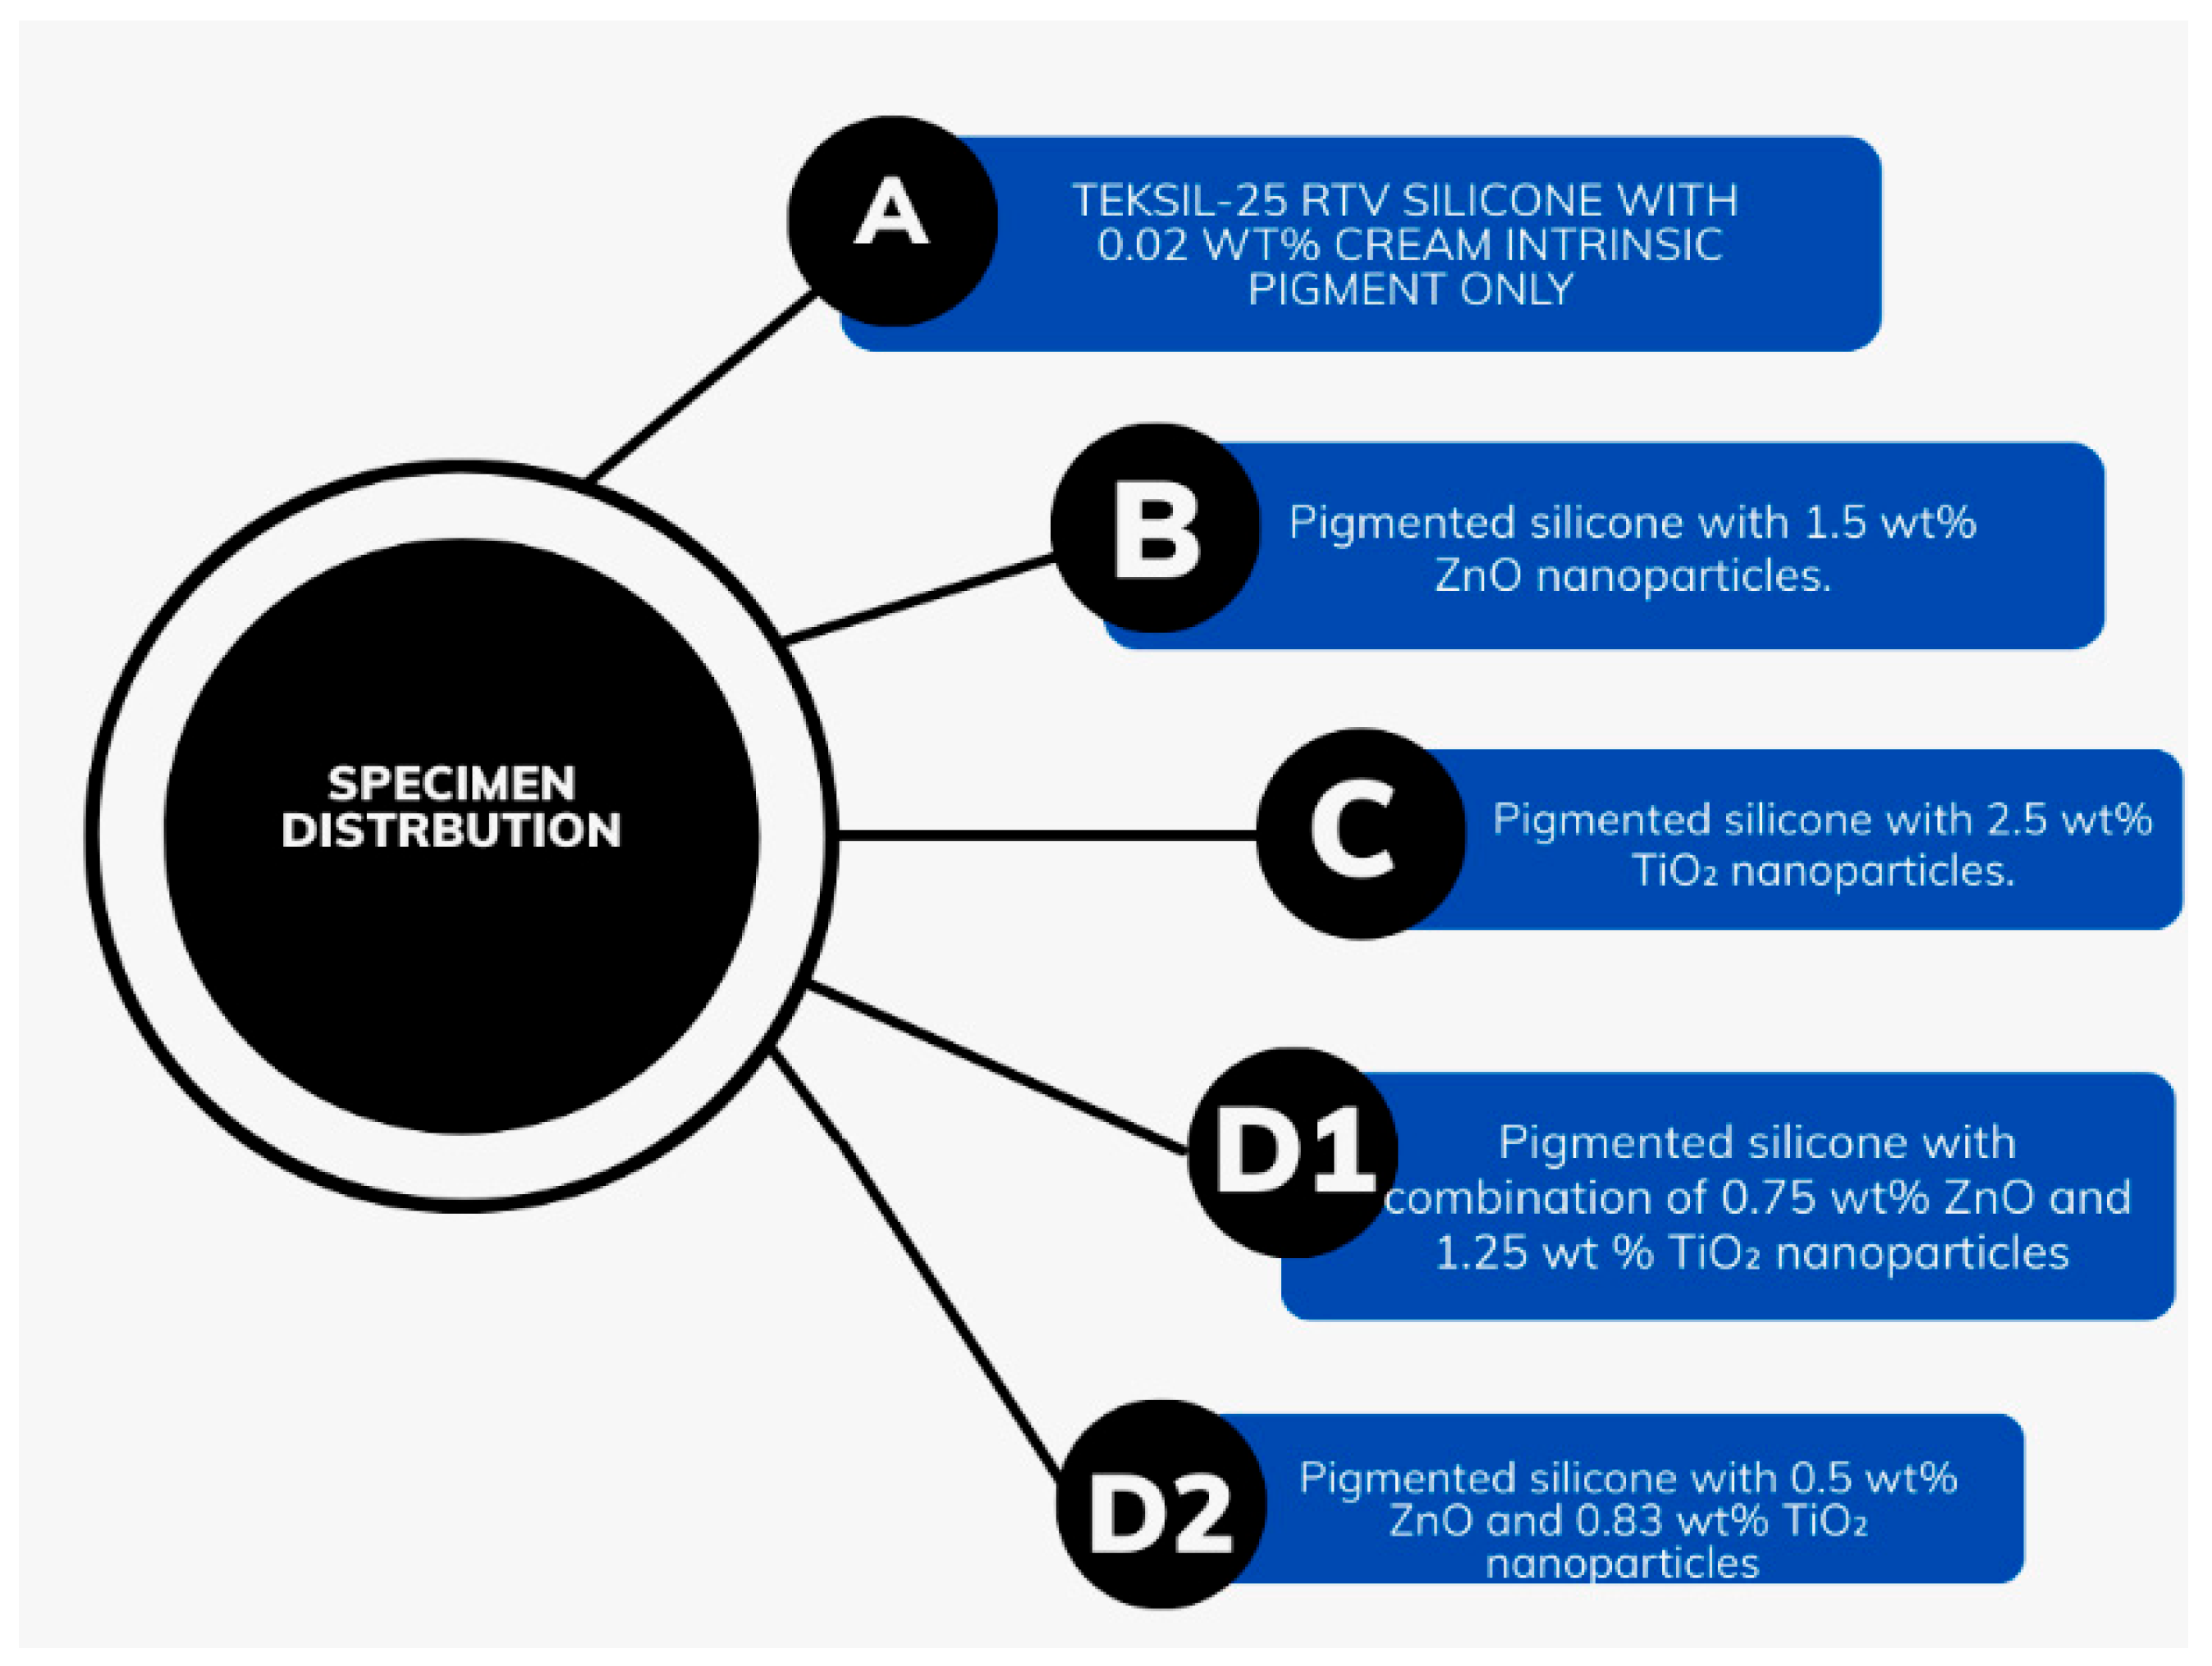
Figure 3.
Flow chart shows specimen distribution and preparation. Group A: Teksil-25 RTV silicone with 0.02 wt% cream intrinsic pigment only. Group B: Pigmented silicone with 1.5 wt% ZnO nanoparticles. Group C: Pigmented silicone with 2.5 wt% TiO2 nanoparticles. Group D1: Pigmented silicone with 0.75 wt% ZnO and 1.25 wt% TiO2 nanoparticles. Group D2: Pigmented silicone with 0.5 wt% ZnO and 0.83 wt% TiO2 nanoparticles.
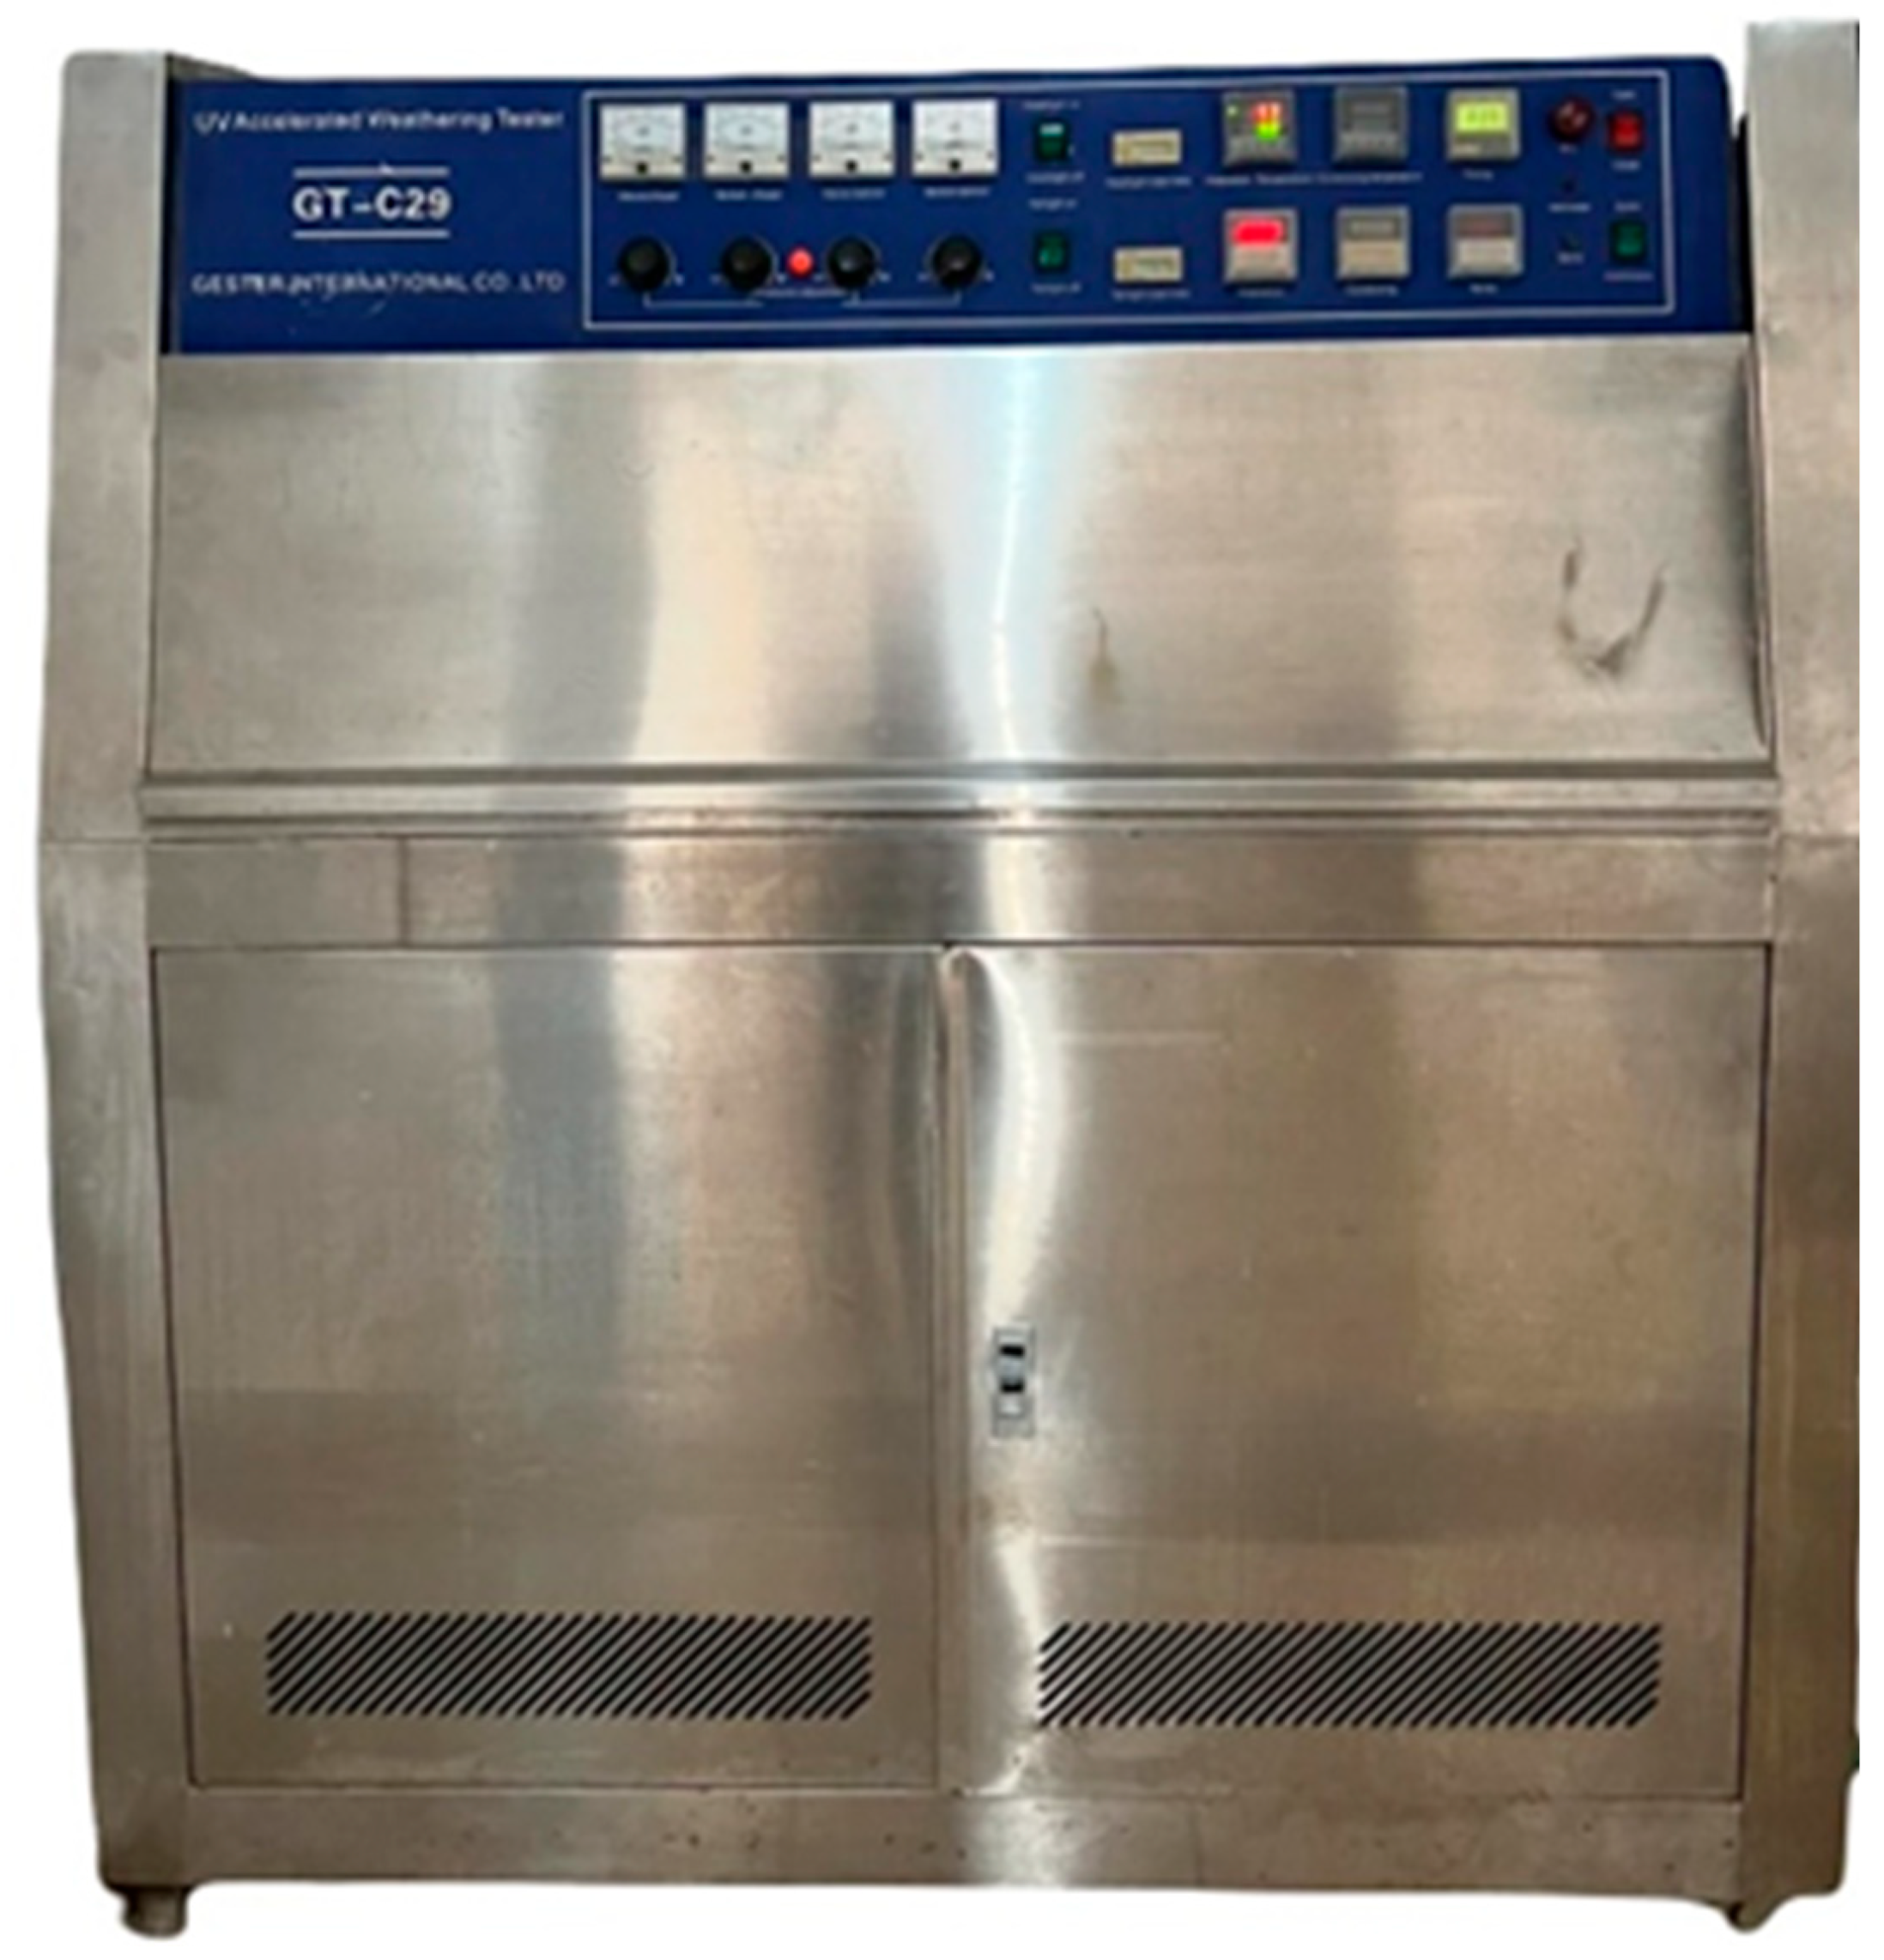
Figure 4.
UV weathering aging chamber (Model: GT-C29, Gestor International Co., Ltd., China).
Figure 4.
UV weathering aging chamber (Model: GT-C29, Gestor International Co., Ltd., China).
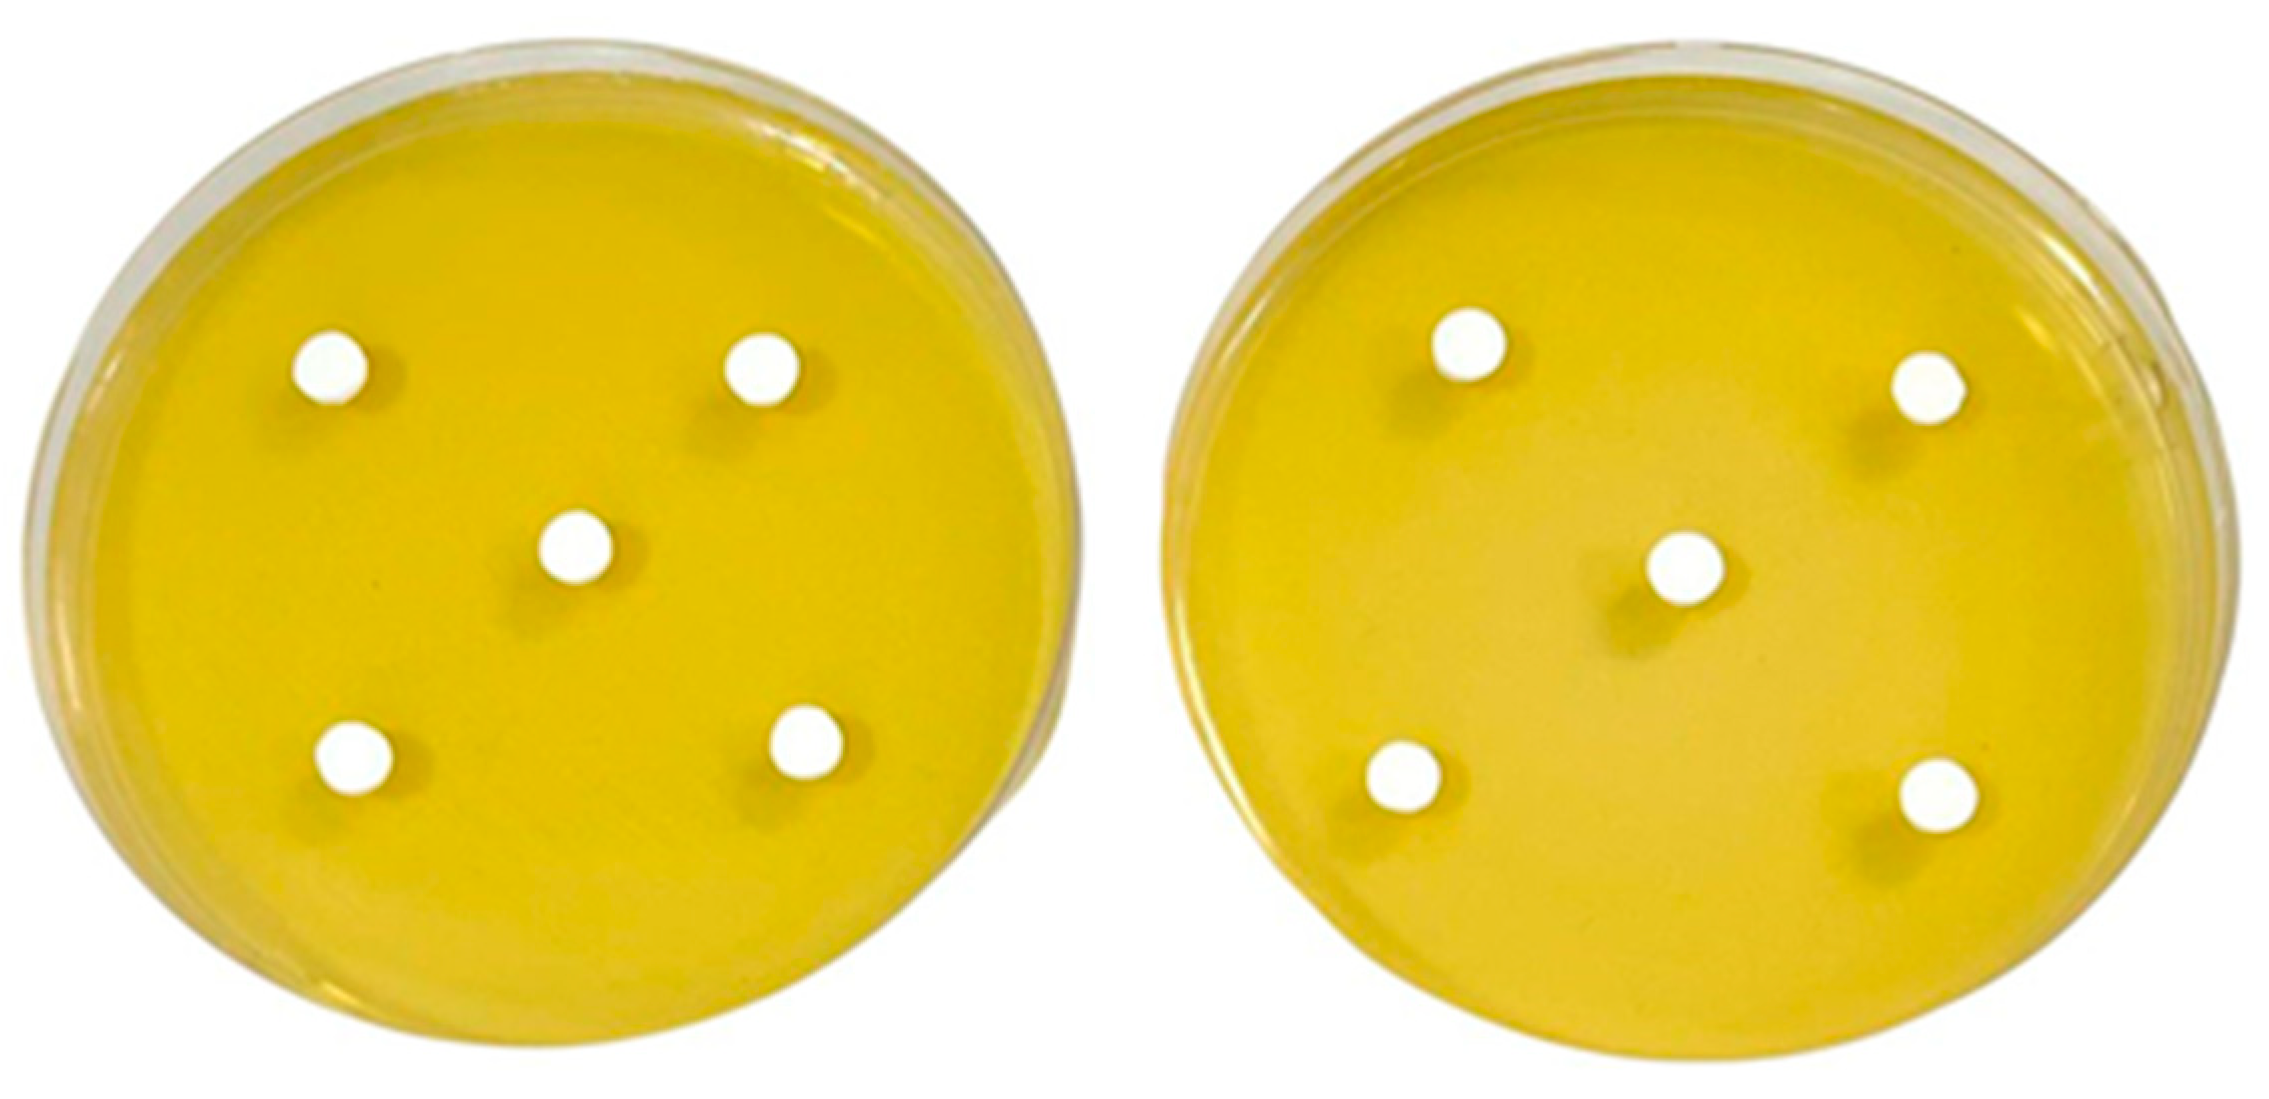
Figure 5.
Specimen fabrication for evaluating antifungal activity with disk diffusion method.
Figure 5.
Specimen fabrication for evaluating antifungal activity with disk diffusion method.
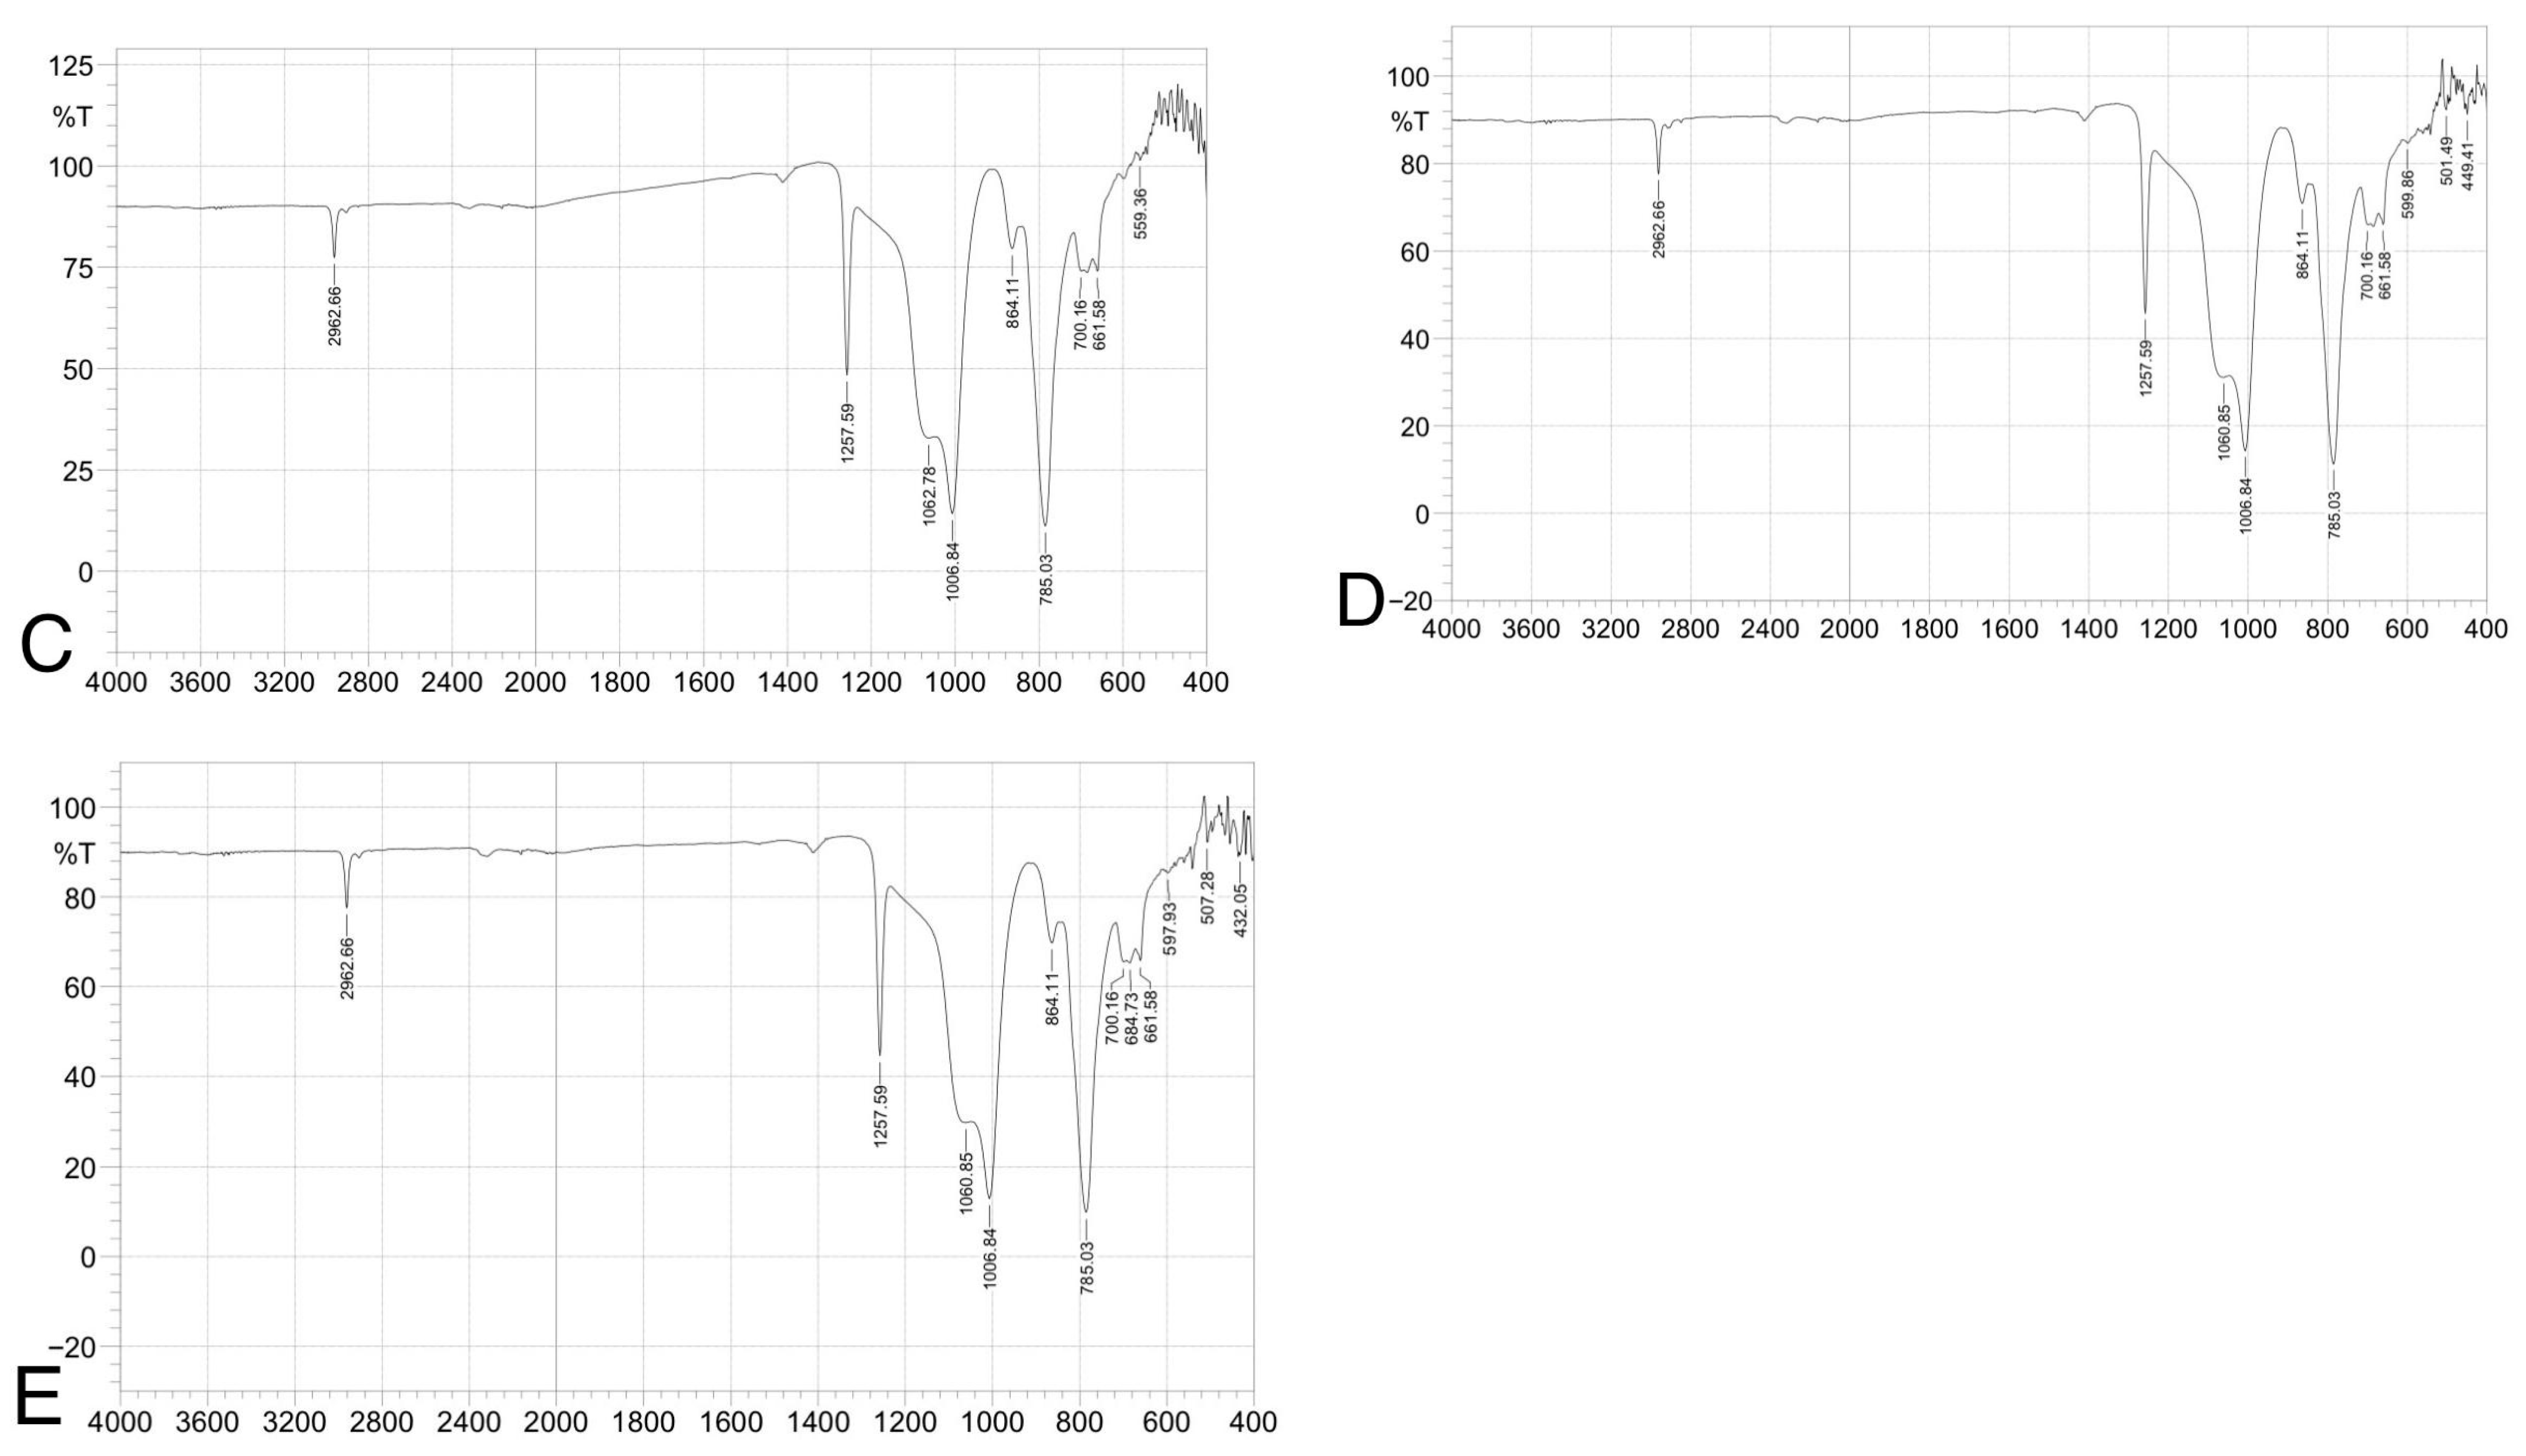
Figure 6.
(ATR-FTIR) spectra of silicone elastomer groups: (A) control, (B) 1.5 wt% ZnO, (C) 2.5 wt% TiO2, (D) 0.75 wt% ZnO + 1.25 wt% TiO2, and (E) 0.5 wt% ZnO + 0.83 wt% TiO2. Spectra confirm preservation of characteristic peaks (e.g., Si–O–Si, CH3), indicating no structural alteration due to nanoparticle addition.
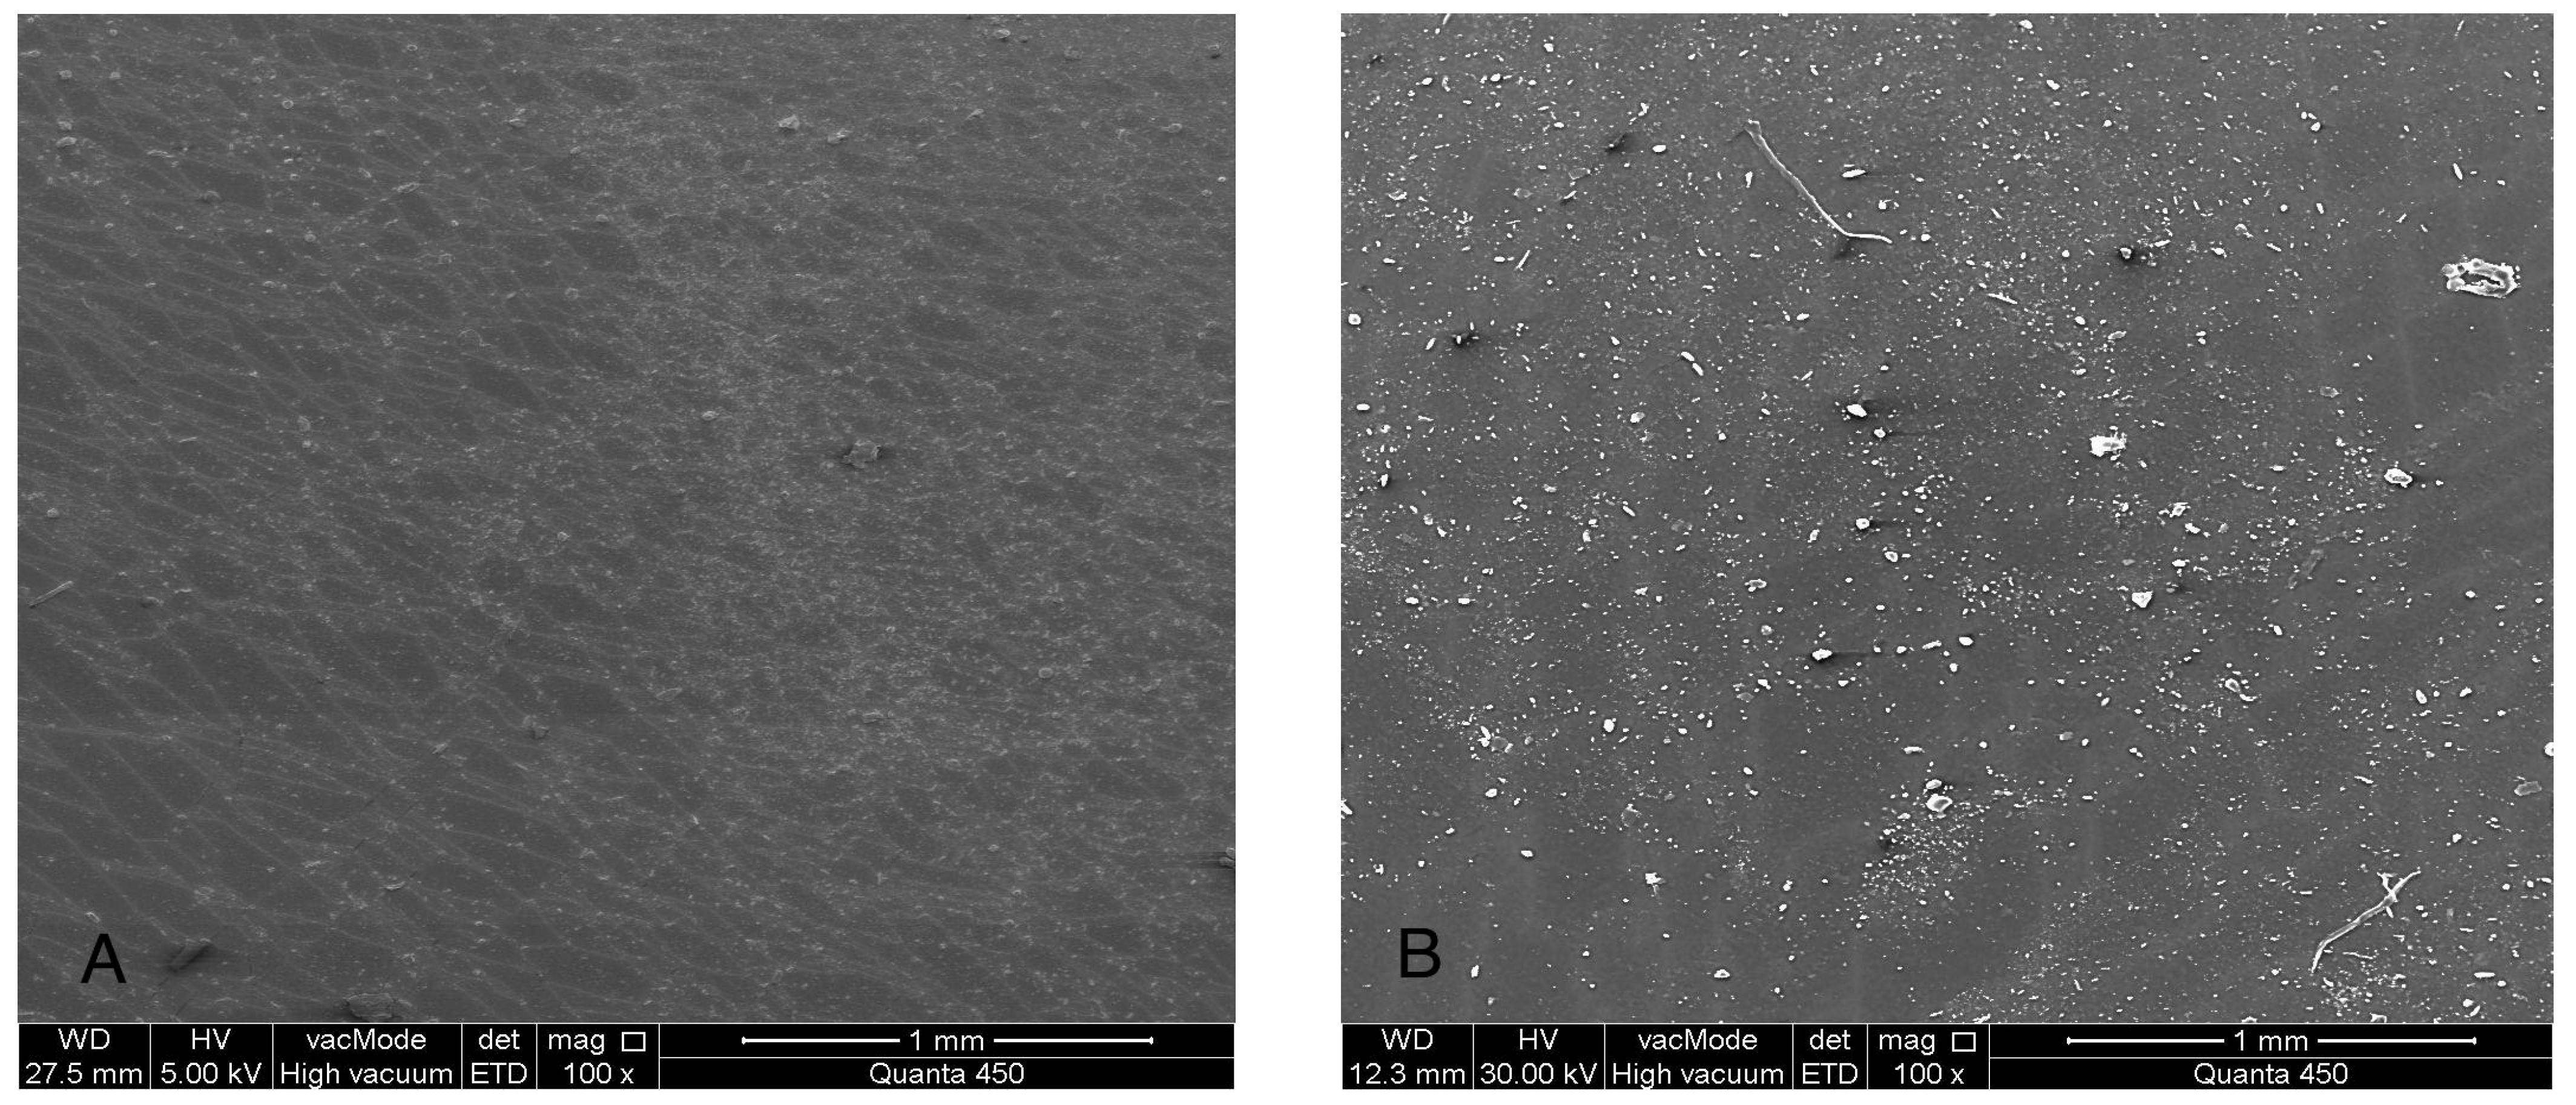
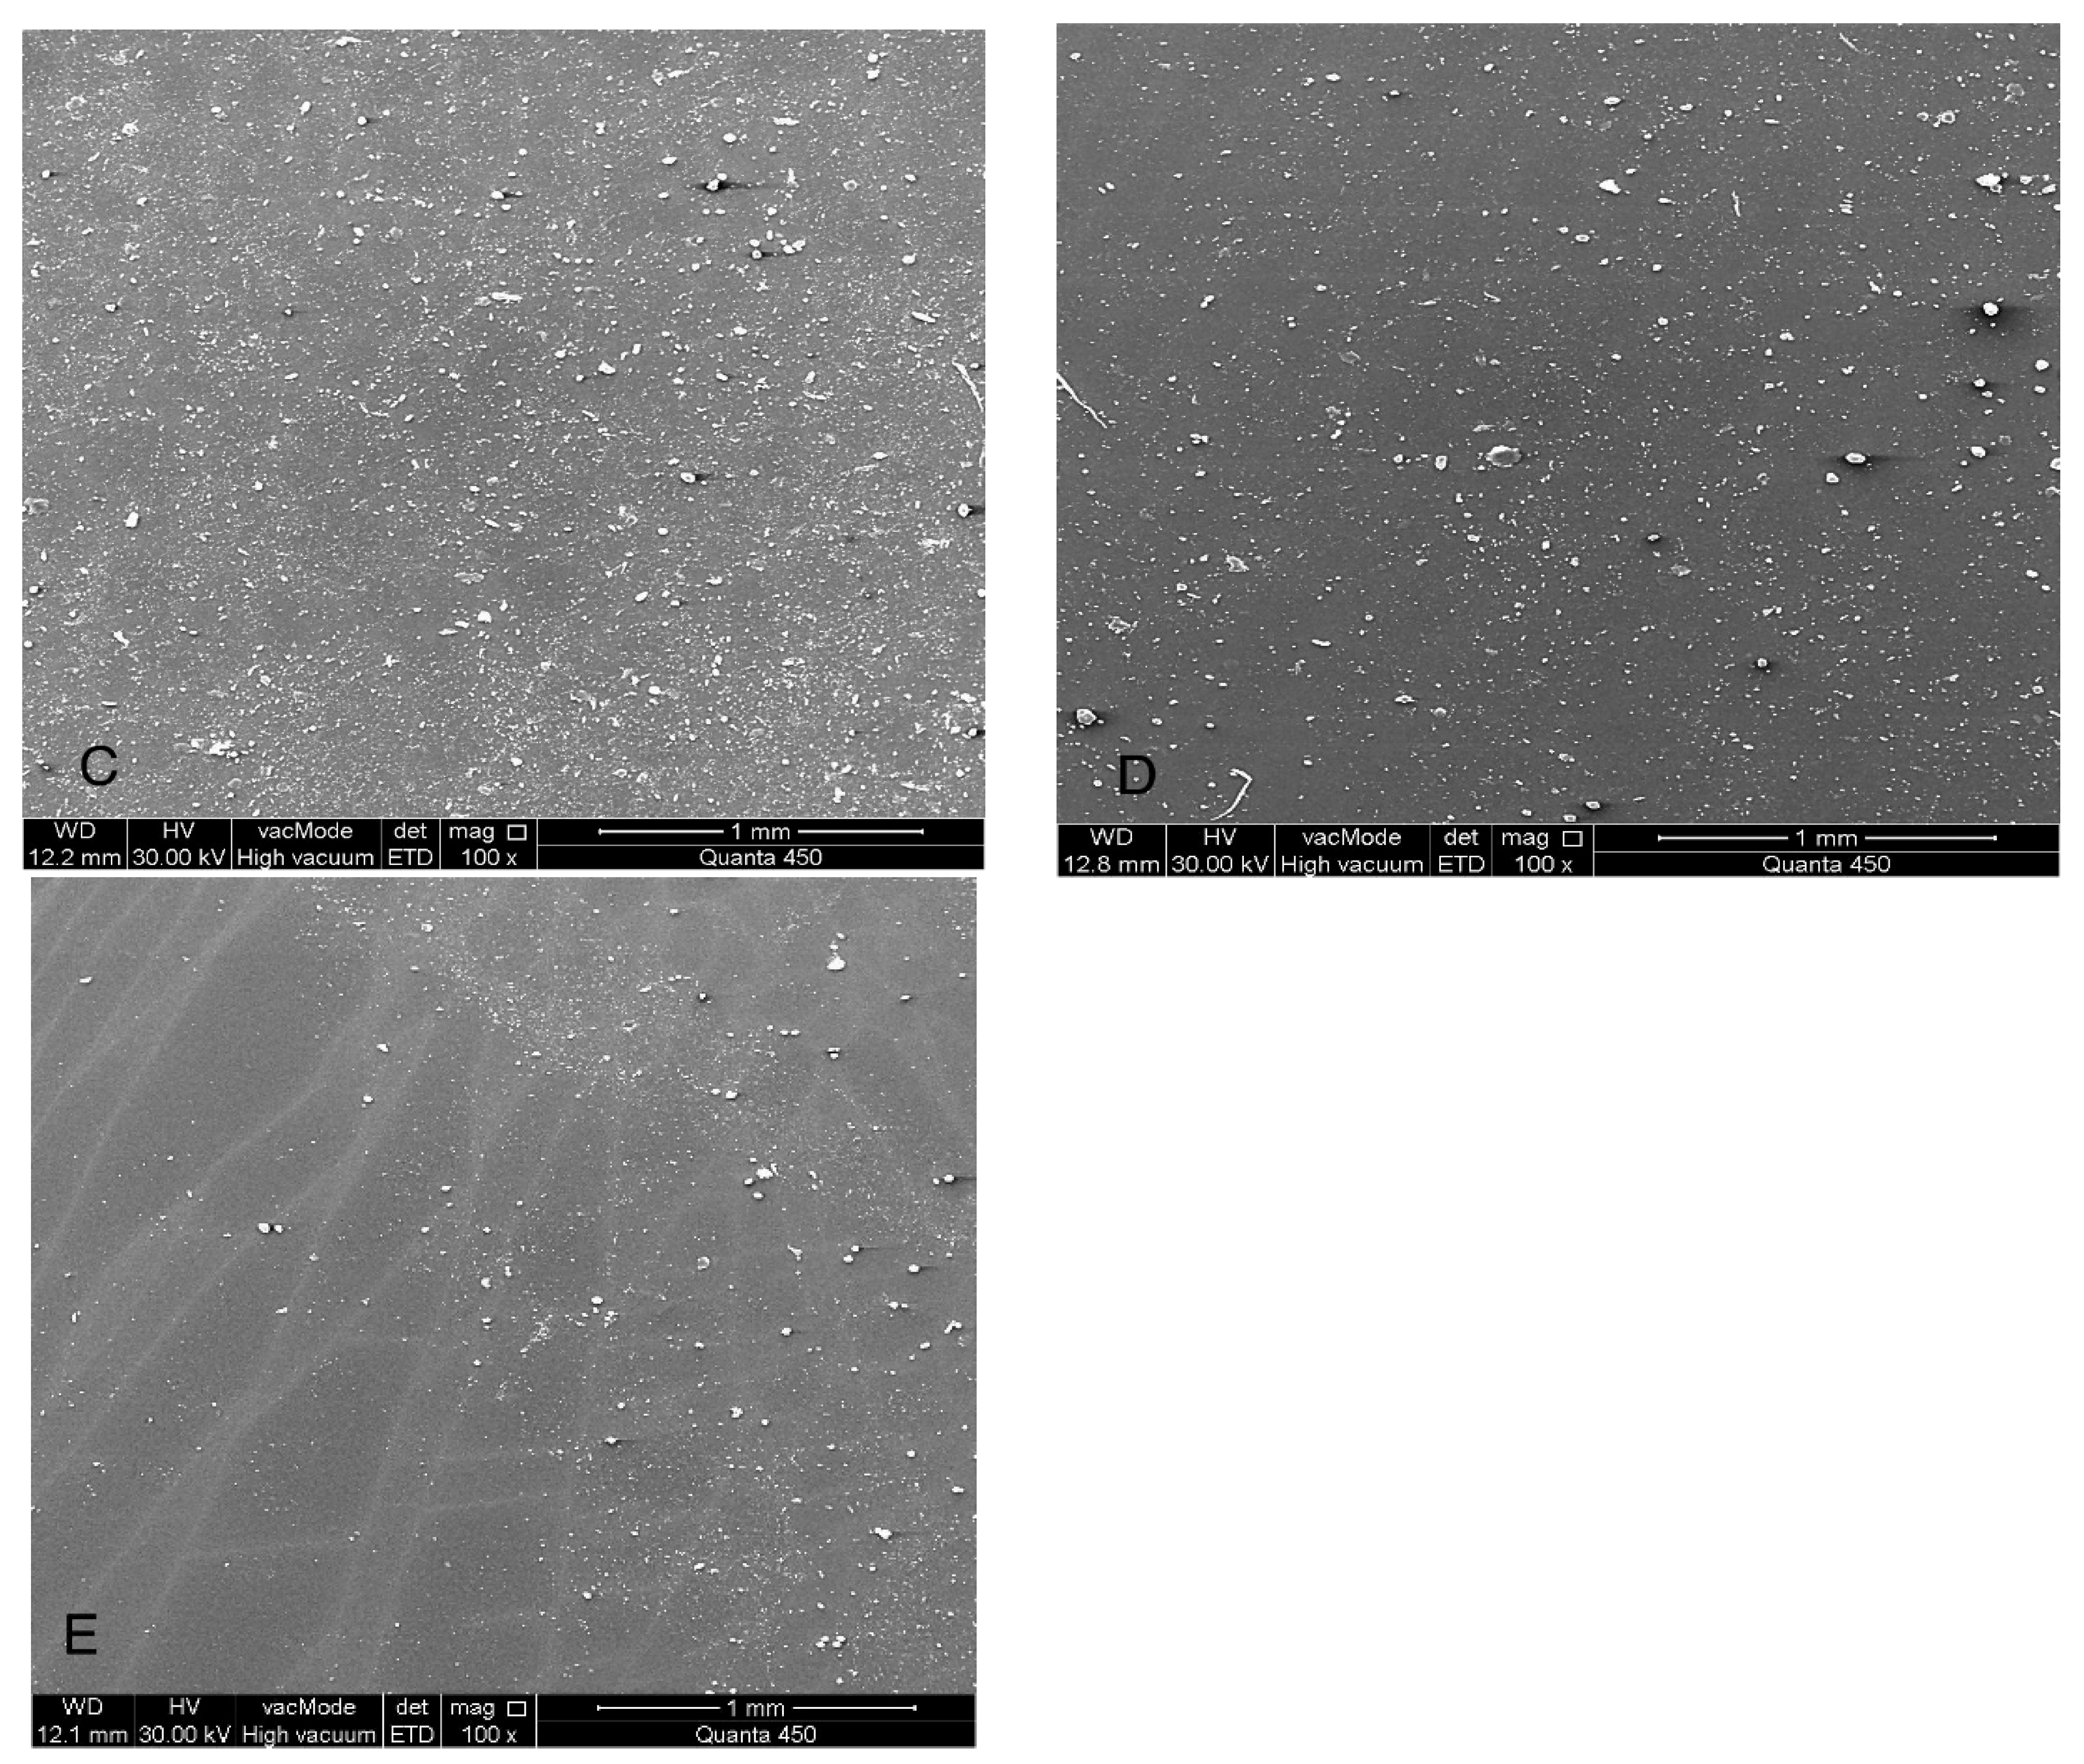
Figure 7.
(SEM) images at 100× magnification of maxillofacial silicone specimens: (A) Control (pigmented silicone only, no nanoparticles), (B) 1.5 wt% ZnO, (C) 2.5 wt% TiO2, (D) 0.75 wt% ZnO + 1.25 wt% TiO2 (Group D1), and (E) 0.5 wt% ZnO + 0.83 wt% TiO2 (Group D2). SEM images reveal surface morphology and nanoparticle distribution. Image A displays a smooth surface, while images (B–E) show increasing surface roughness and fine nanoparticle dispersion across the silicone matrix.
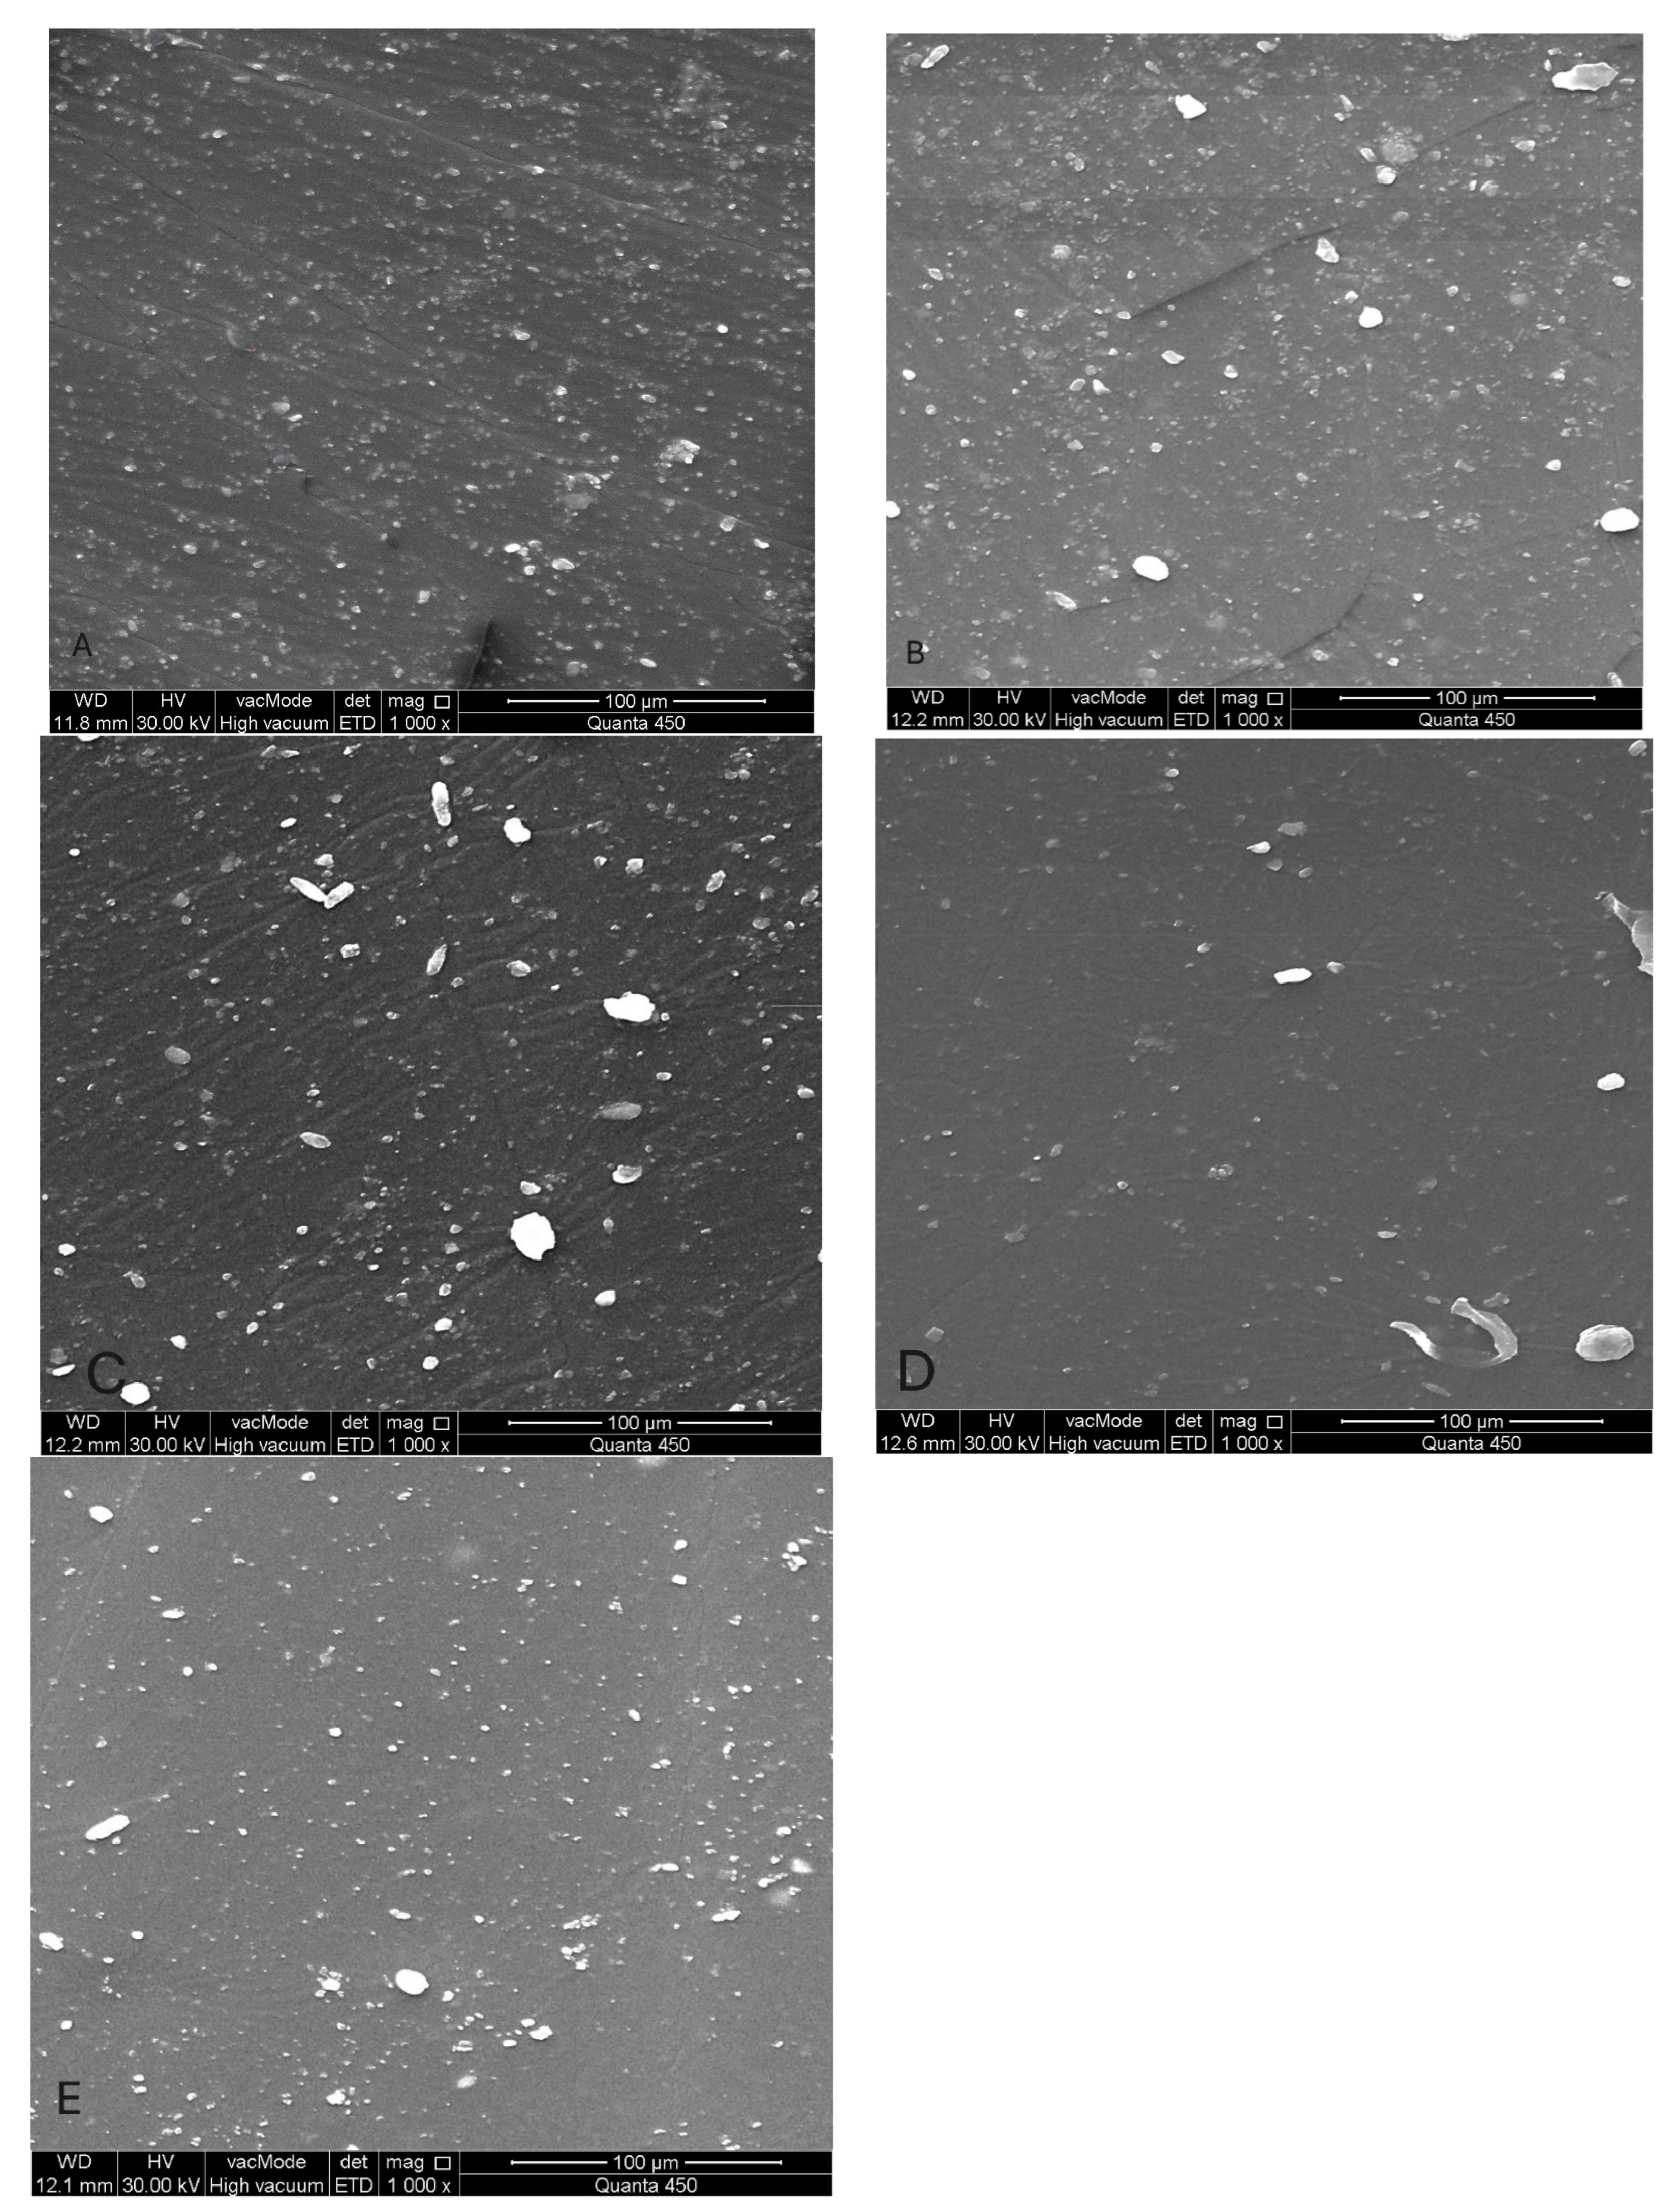
Figure 8.
(SEM) images at 1000× magnification of maxillofacial silicone specimens: (A) Control (pigmented silicone only, no nanoparticles), (B) 1.5 wt% ZnO, (C) 2.5 wt% TiO2, (D) 0.75 wt% ZnO + 1.25 wt% TiO2 (Group D1), and (E) 0.5 wt% ZnO + 0.83 wt% TiO2 (Group D2). SEM images reveal surface morphology and nanoparticle distribution. Image A displays a smooth surface, while images (B–E) show increasing surface roughness and fine nanoparticle dispersion across the silicone matrix.
Figure 9.
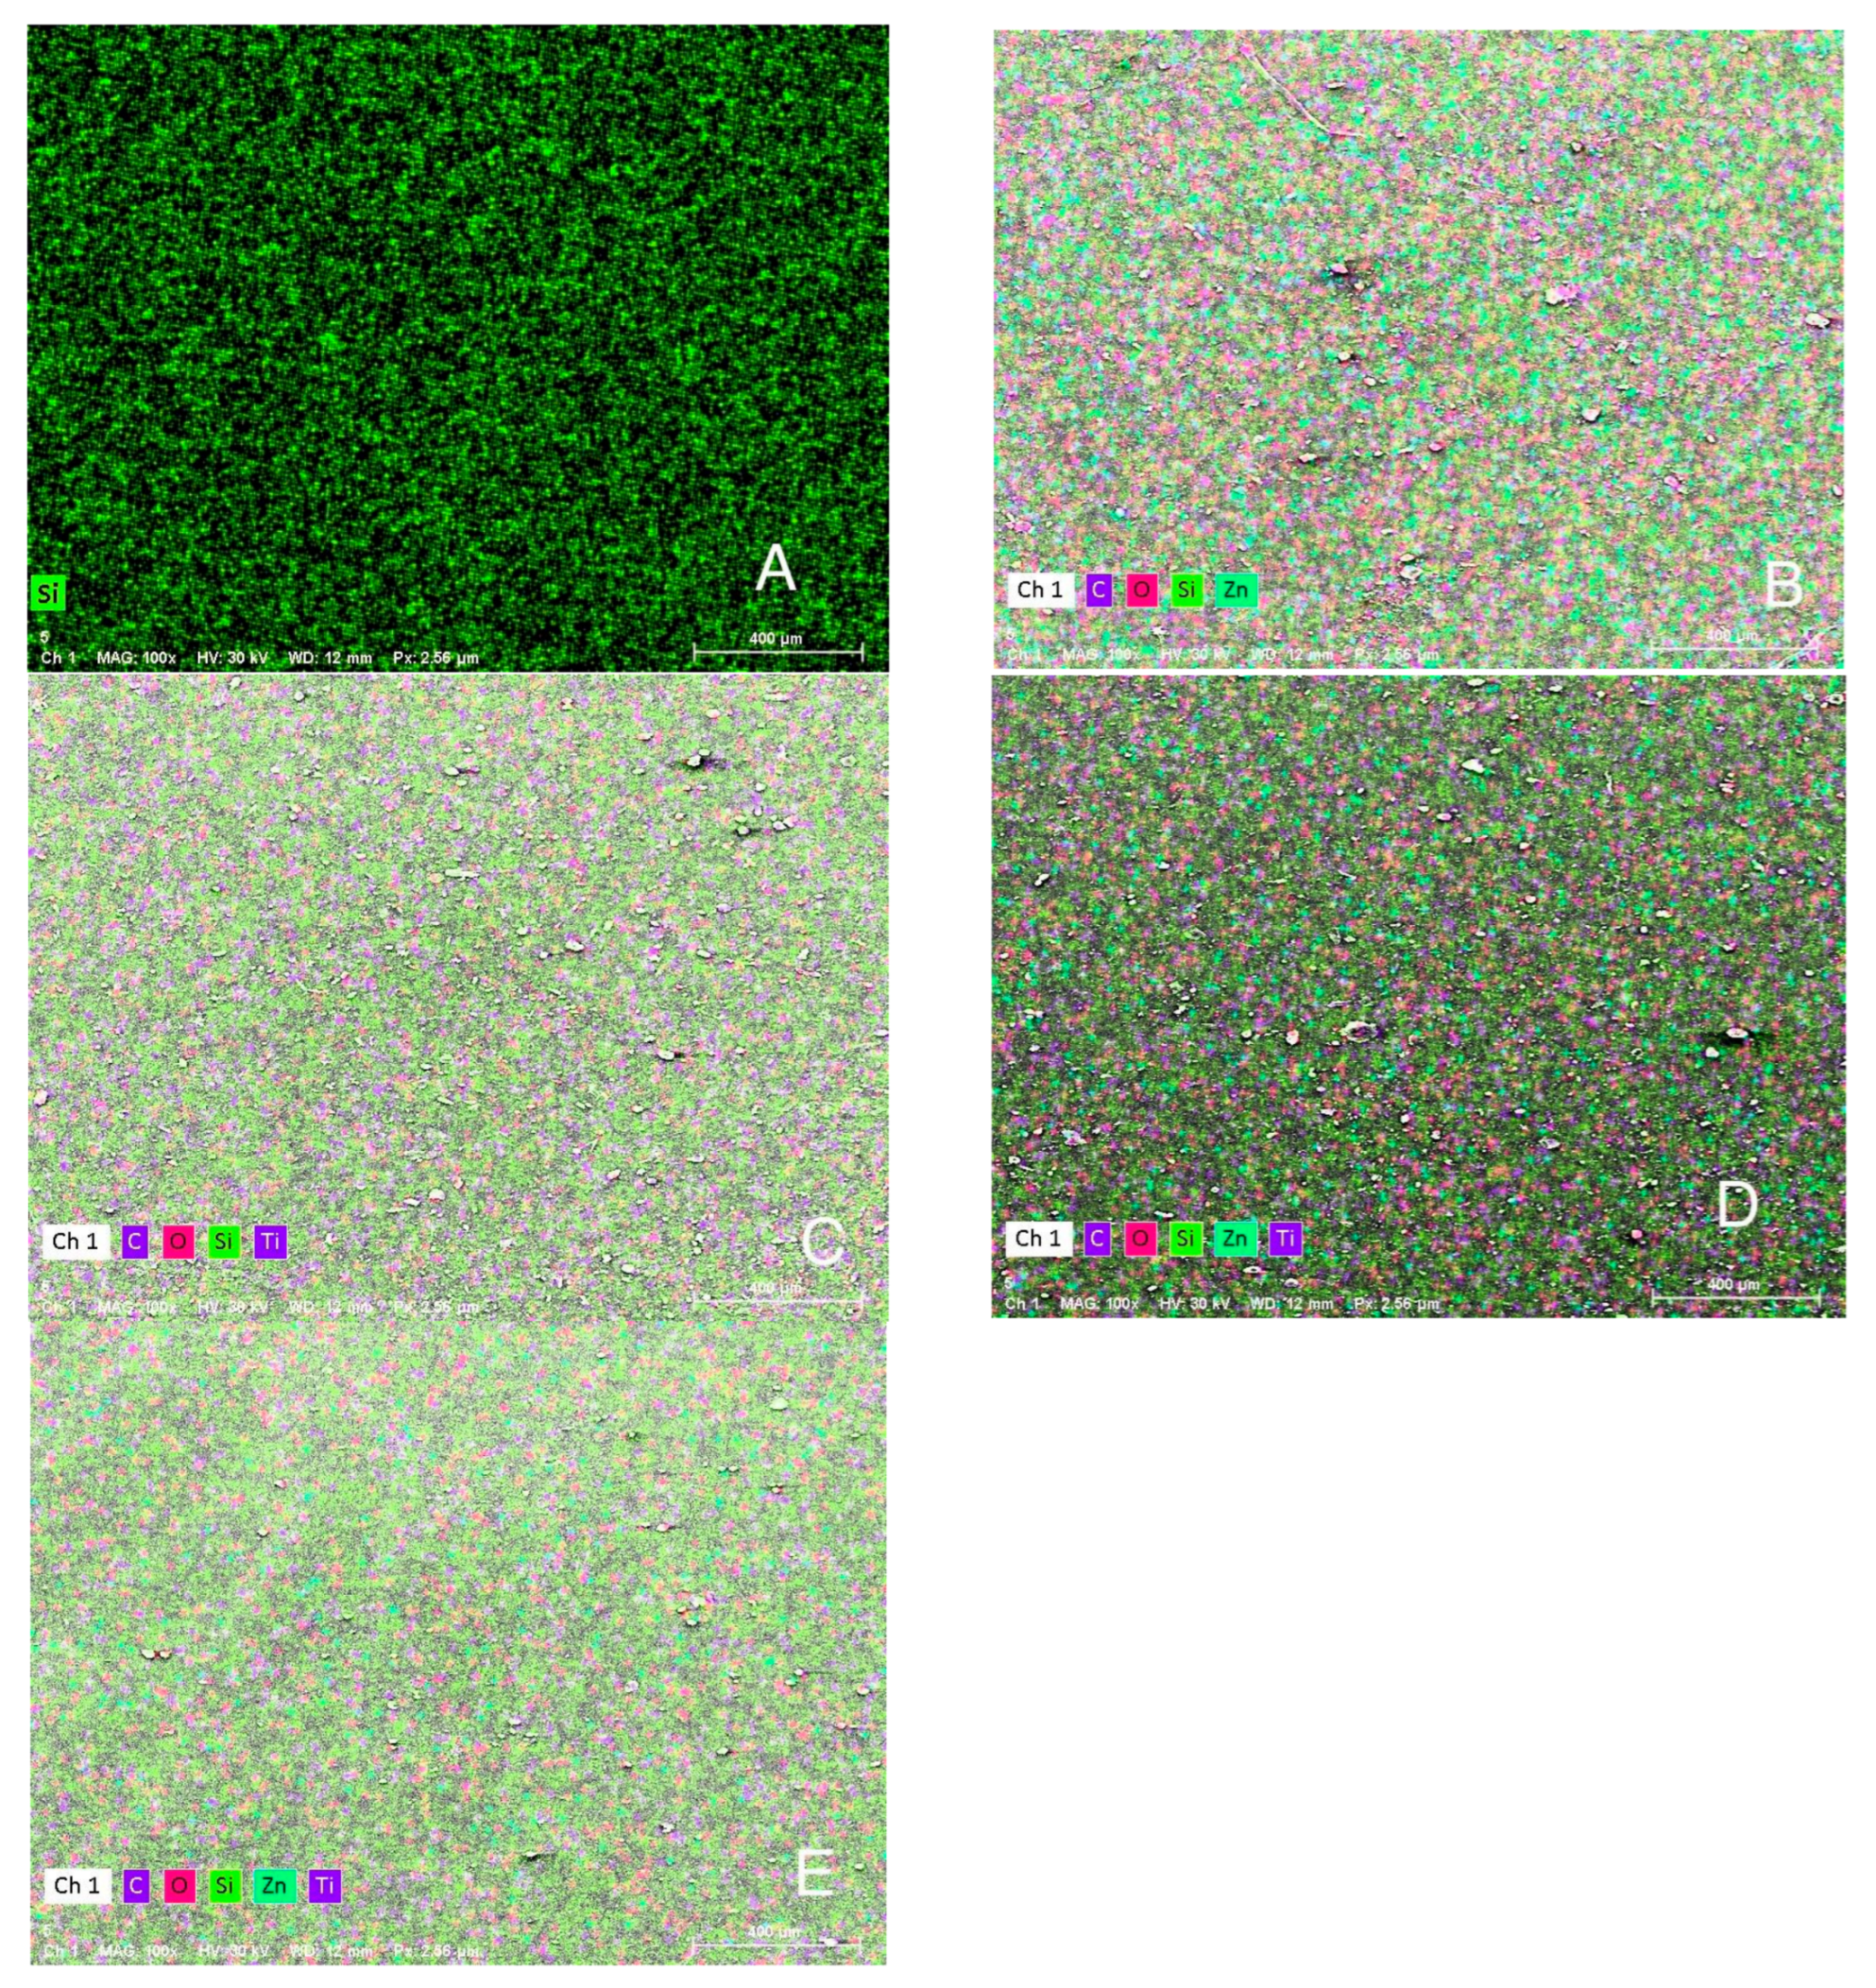
(EDS) Elemental mapping images (A) Control (pigmented silicone only, no nanoparticles), (B) 1.5 wt% ZnO, (C) 2.5 wt% TiO2, (D) 0.75 wt% ZnO + 1.25 wt% TiO2 (Group D1), and (E) 0.5 wt% ZnO + 0.83 wt% TiO2 (Group D2). EDS mapping images showing the distribution of major elements: silicon (green), carbon (magenta), oxygen (red), zinc (cyan), and titanium (blue). Image A shows no nanoparticle presence, while images (B–E) demonstrate increasing levels of Zn and Ti with homogeneous dispersion across the silicone surface.
Figure 10.
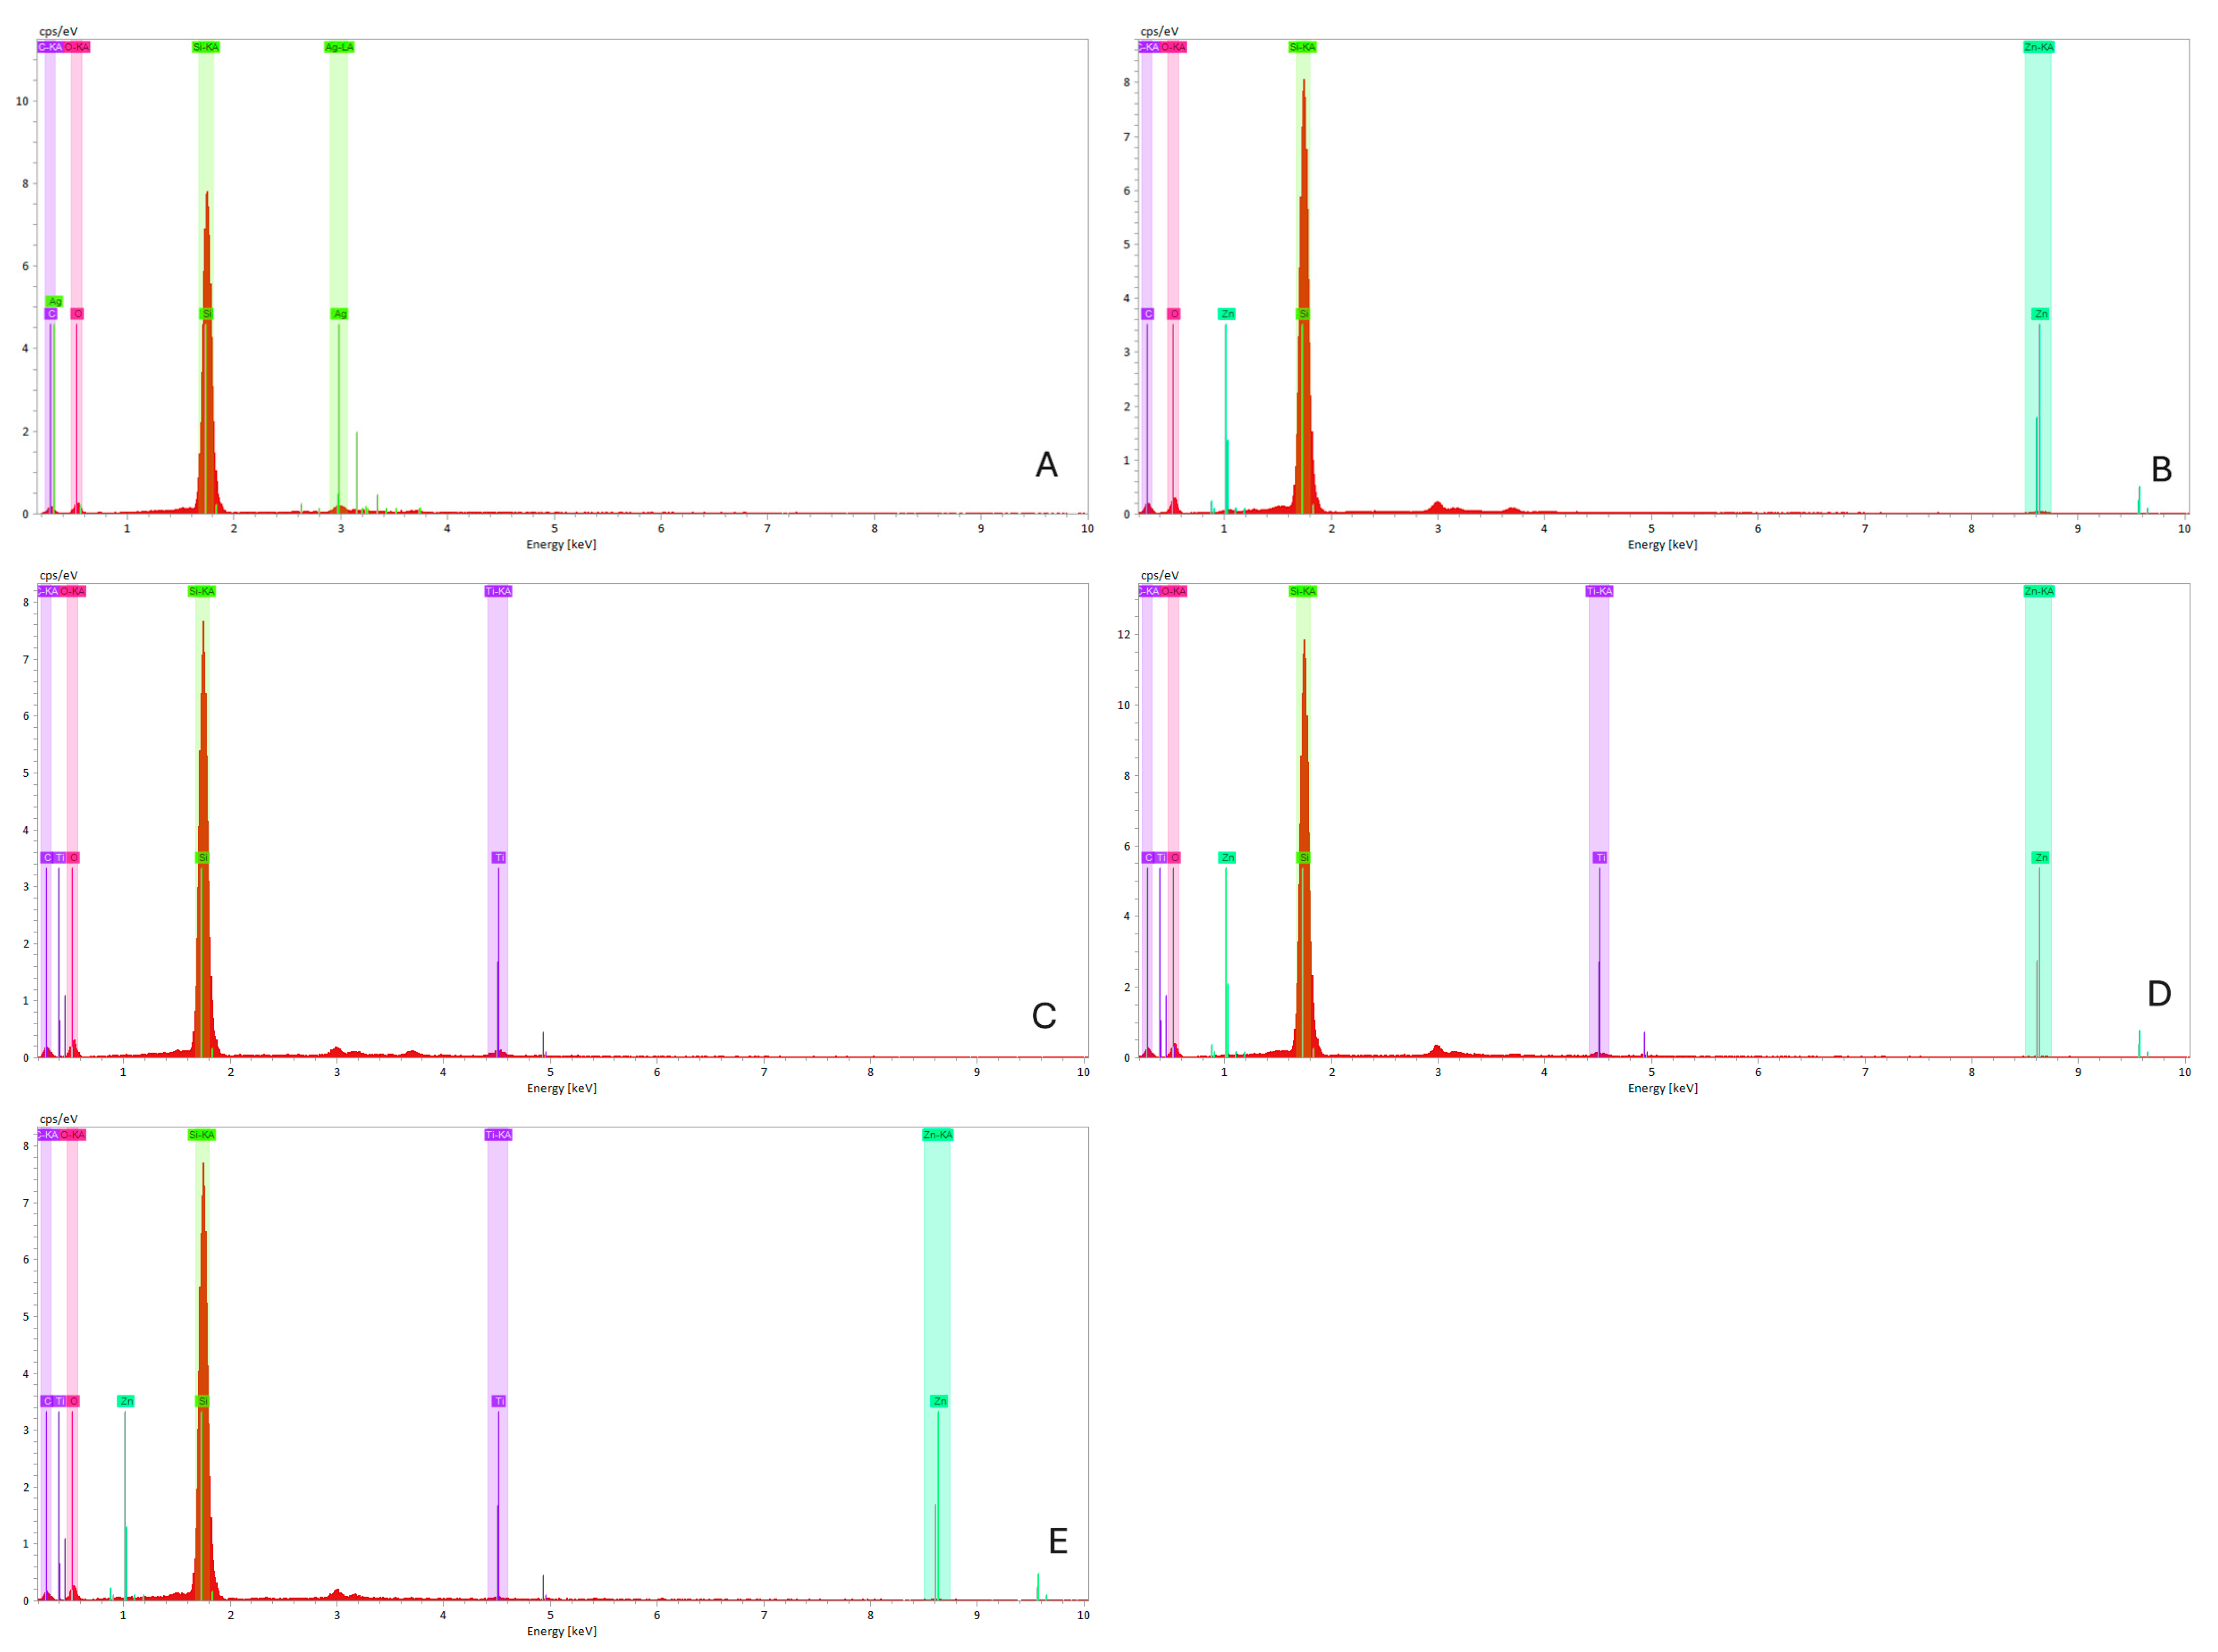
(EDS) spectra graphs of maxillofacial silicone specimens. (A) Control (clear silicone, no nanoparticles), (B) 1.5 wt% ZnO, (C) 2.5 wt% TiO2, (D) 0.75 wt% ZnO + 1.25 wt% TiO2 (Group D1), and (E) 0.5 wt% ZnO + 0.83 wt% TiO2 (Group D2). The elemental peaks for Zn, Ti, Si, C, and O confirm the incorporation of nanoparticles without altering the base matrix.
Figure 11.
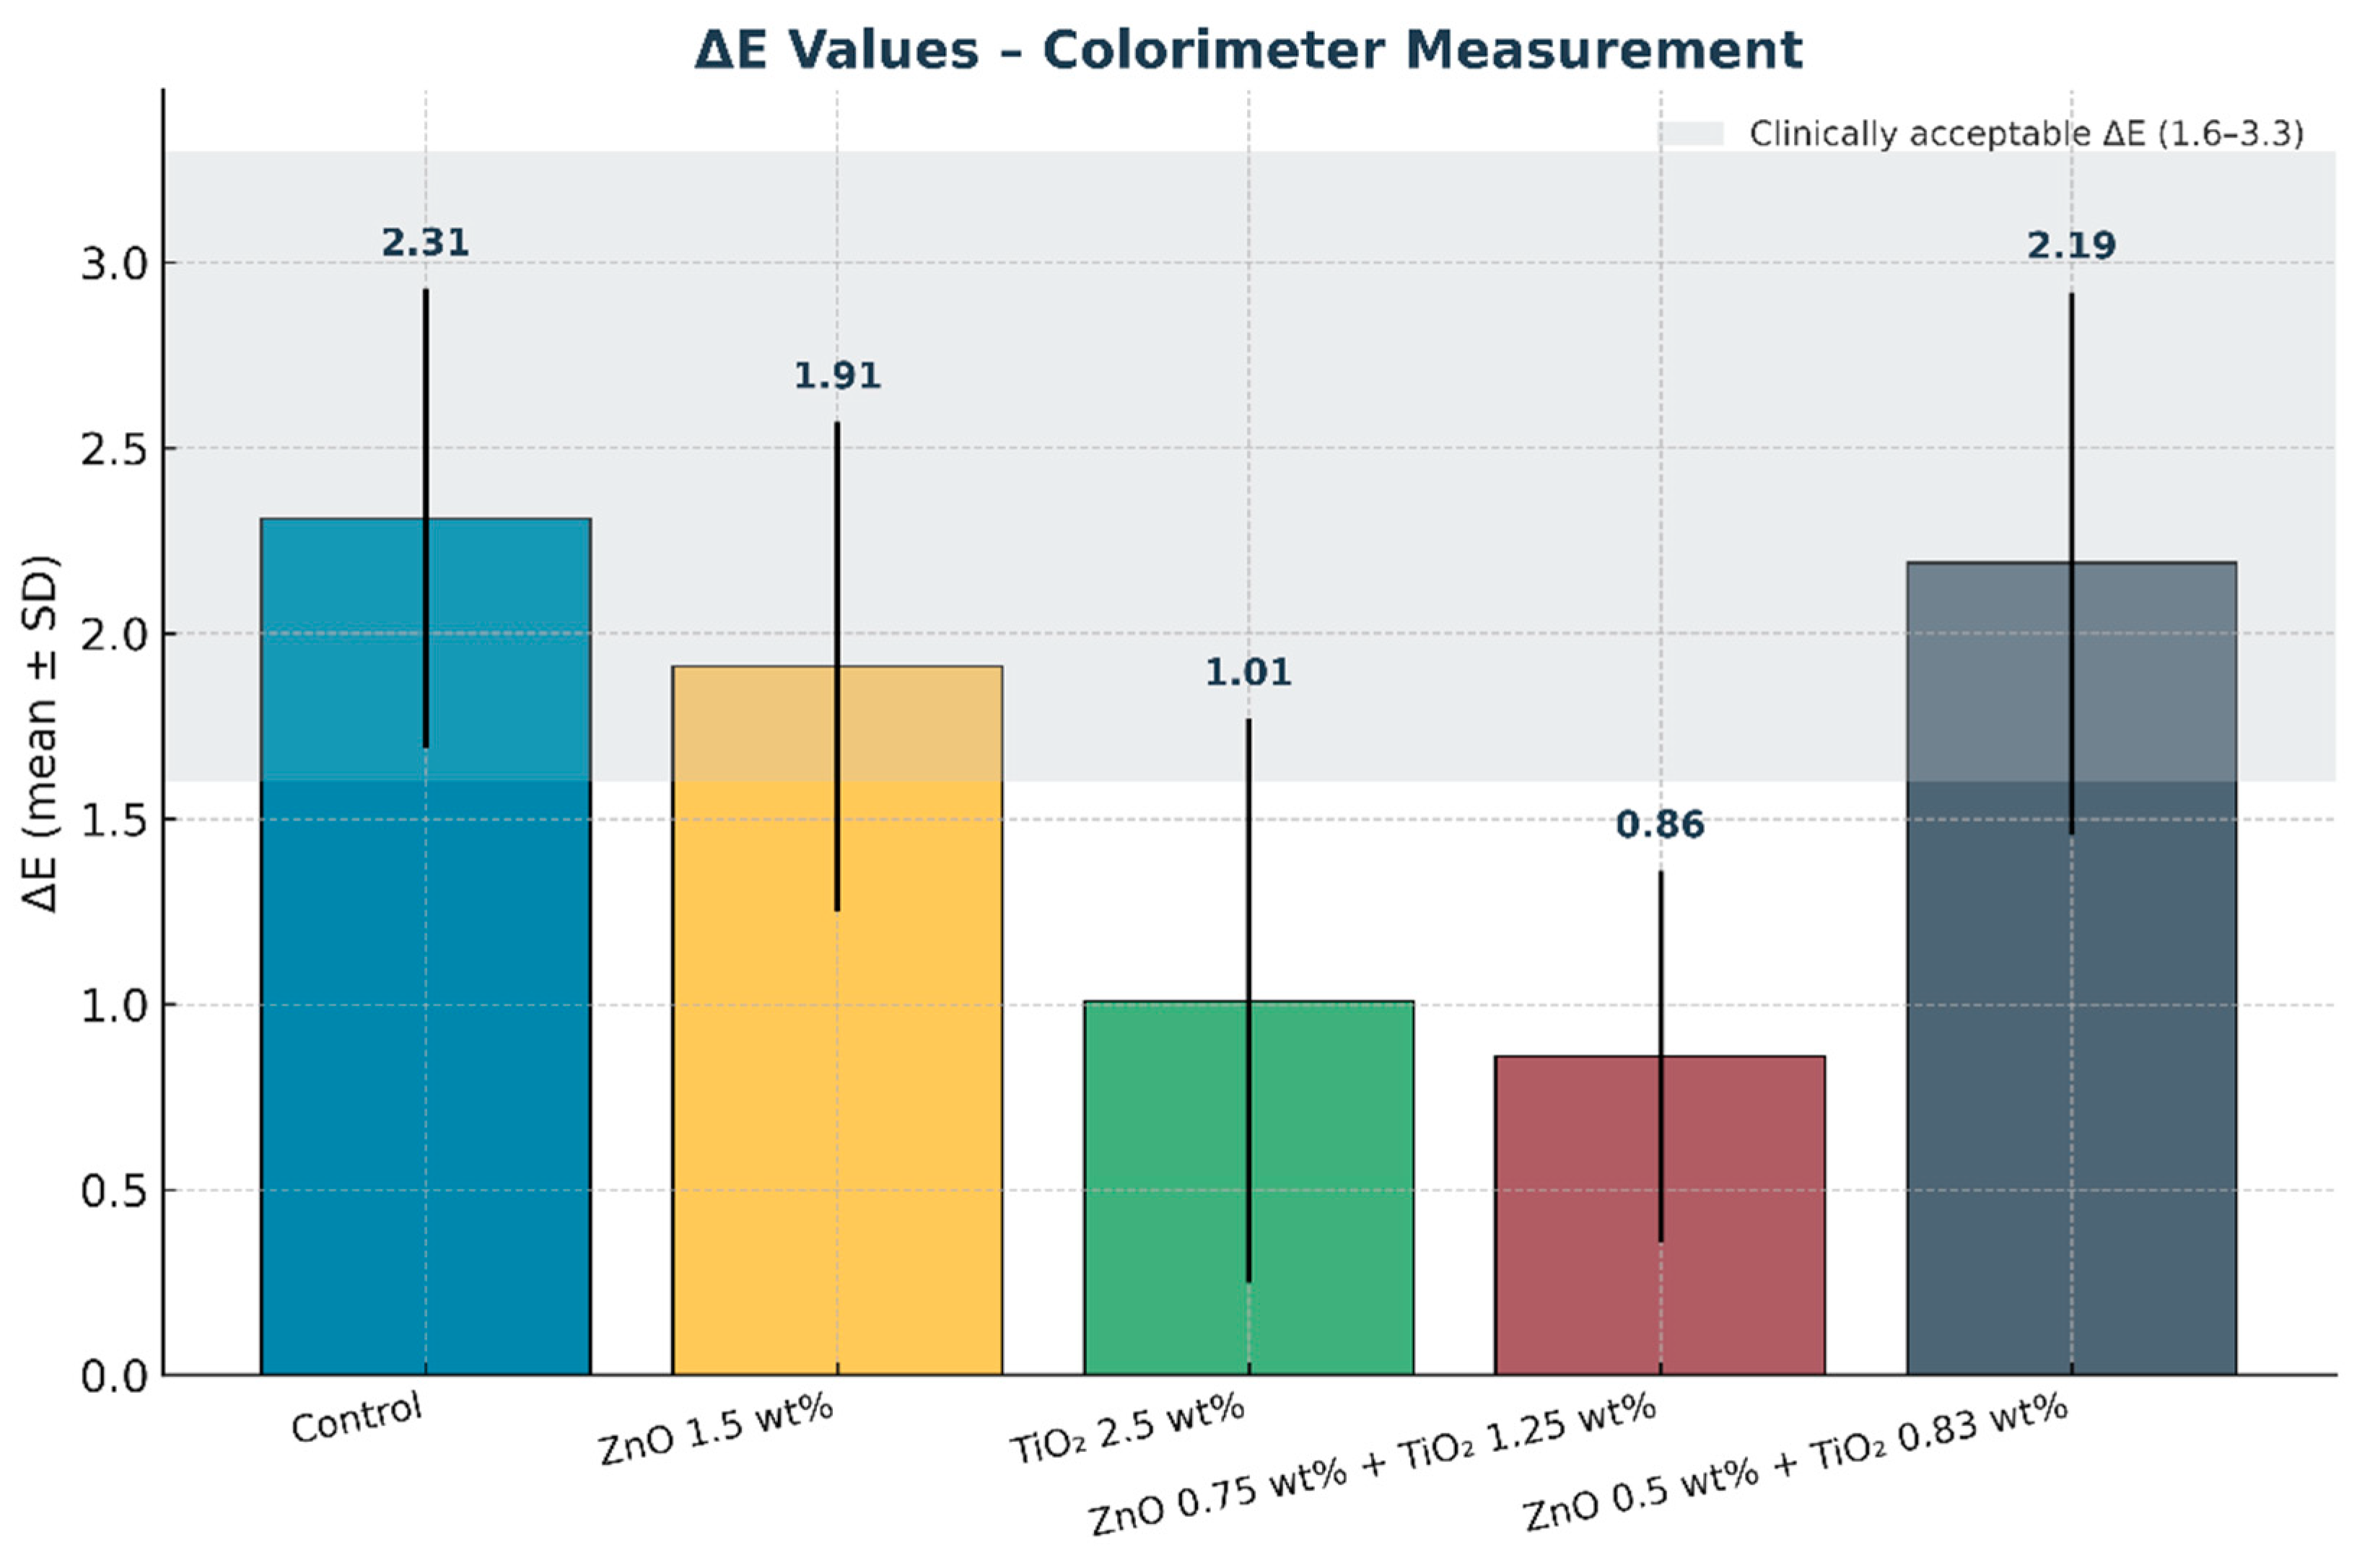
Mean color difference (ΔE) values of maxillofacial silicone elastomers measured with a colorimeter. Error bars represent standard deviation (SD). The shaded grey band indicates the clinically acceptable ΔE range (1.6–3.3). The combined nanoparticle group (0.75 wt% ZnO + 1.25 wt% TiO2) exhibited the lowest ΔE values, demonstrating superior color stability after artificial aging.
Figure 12.
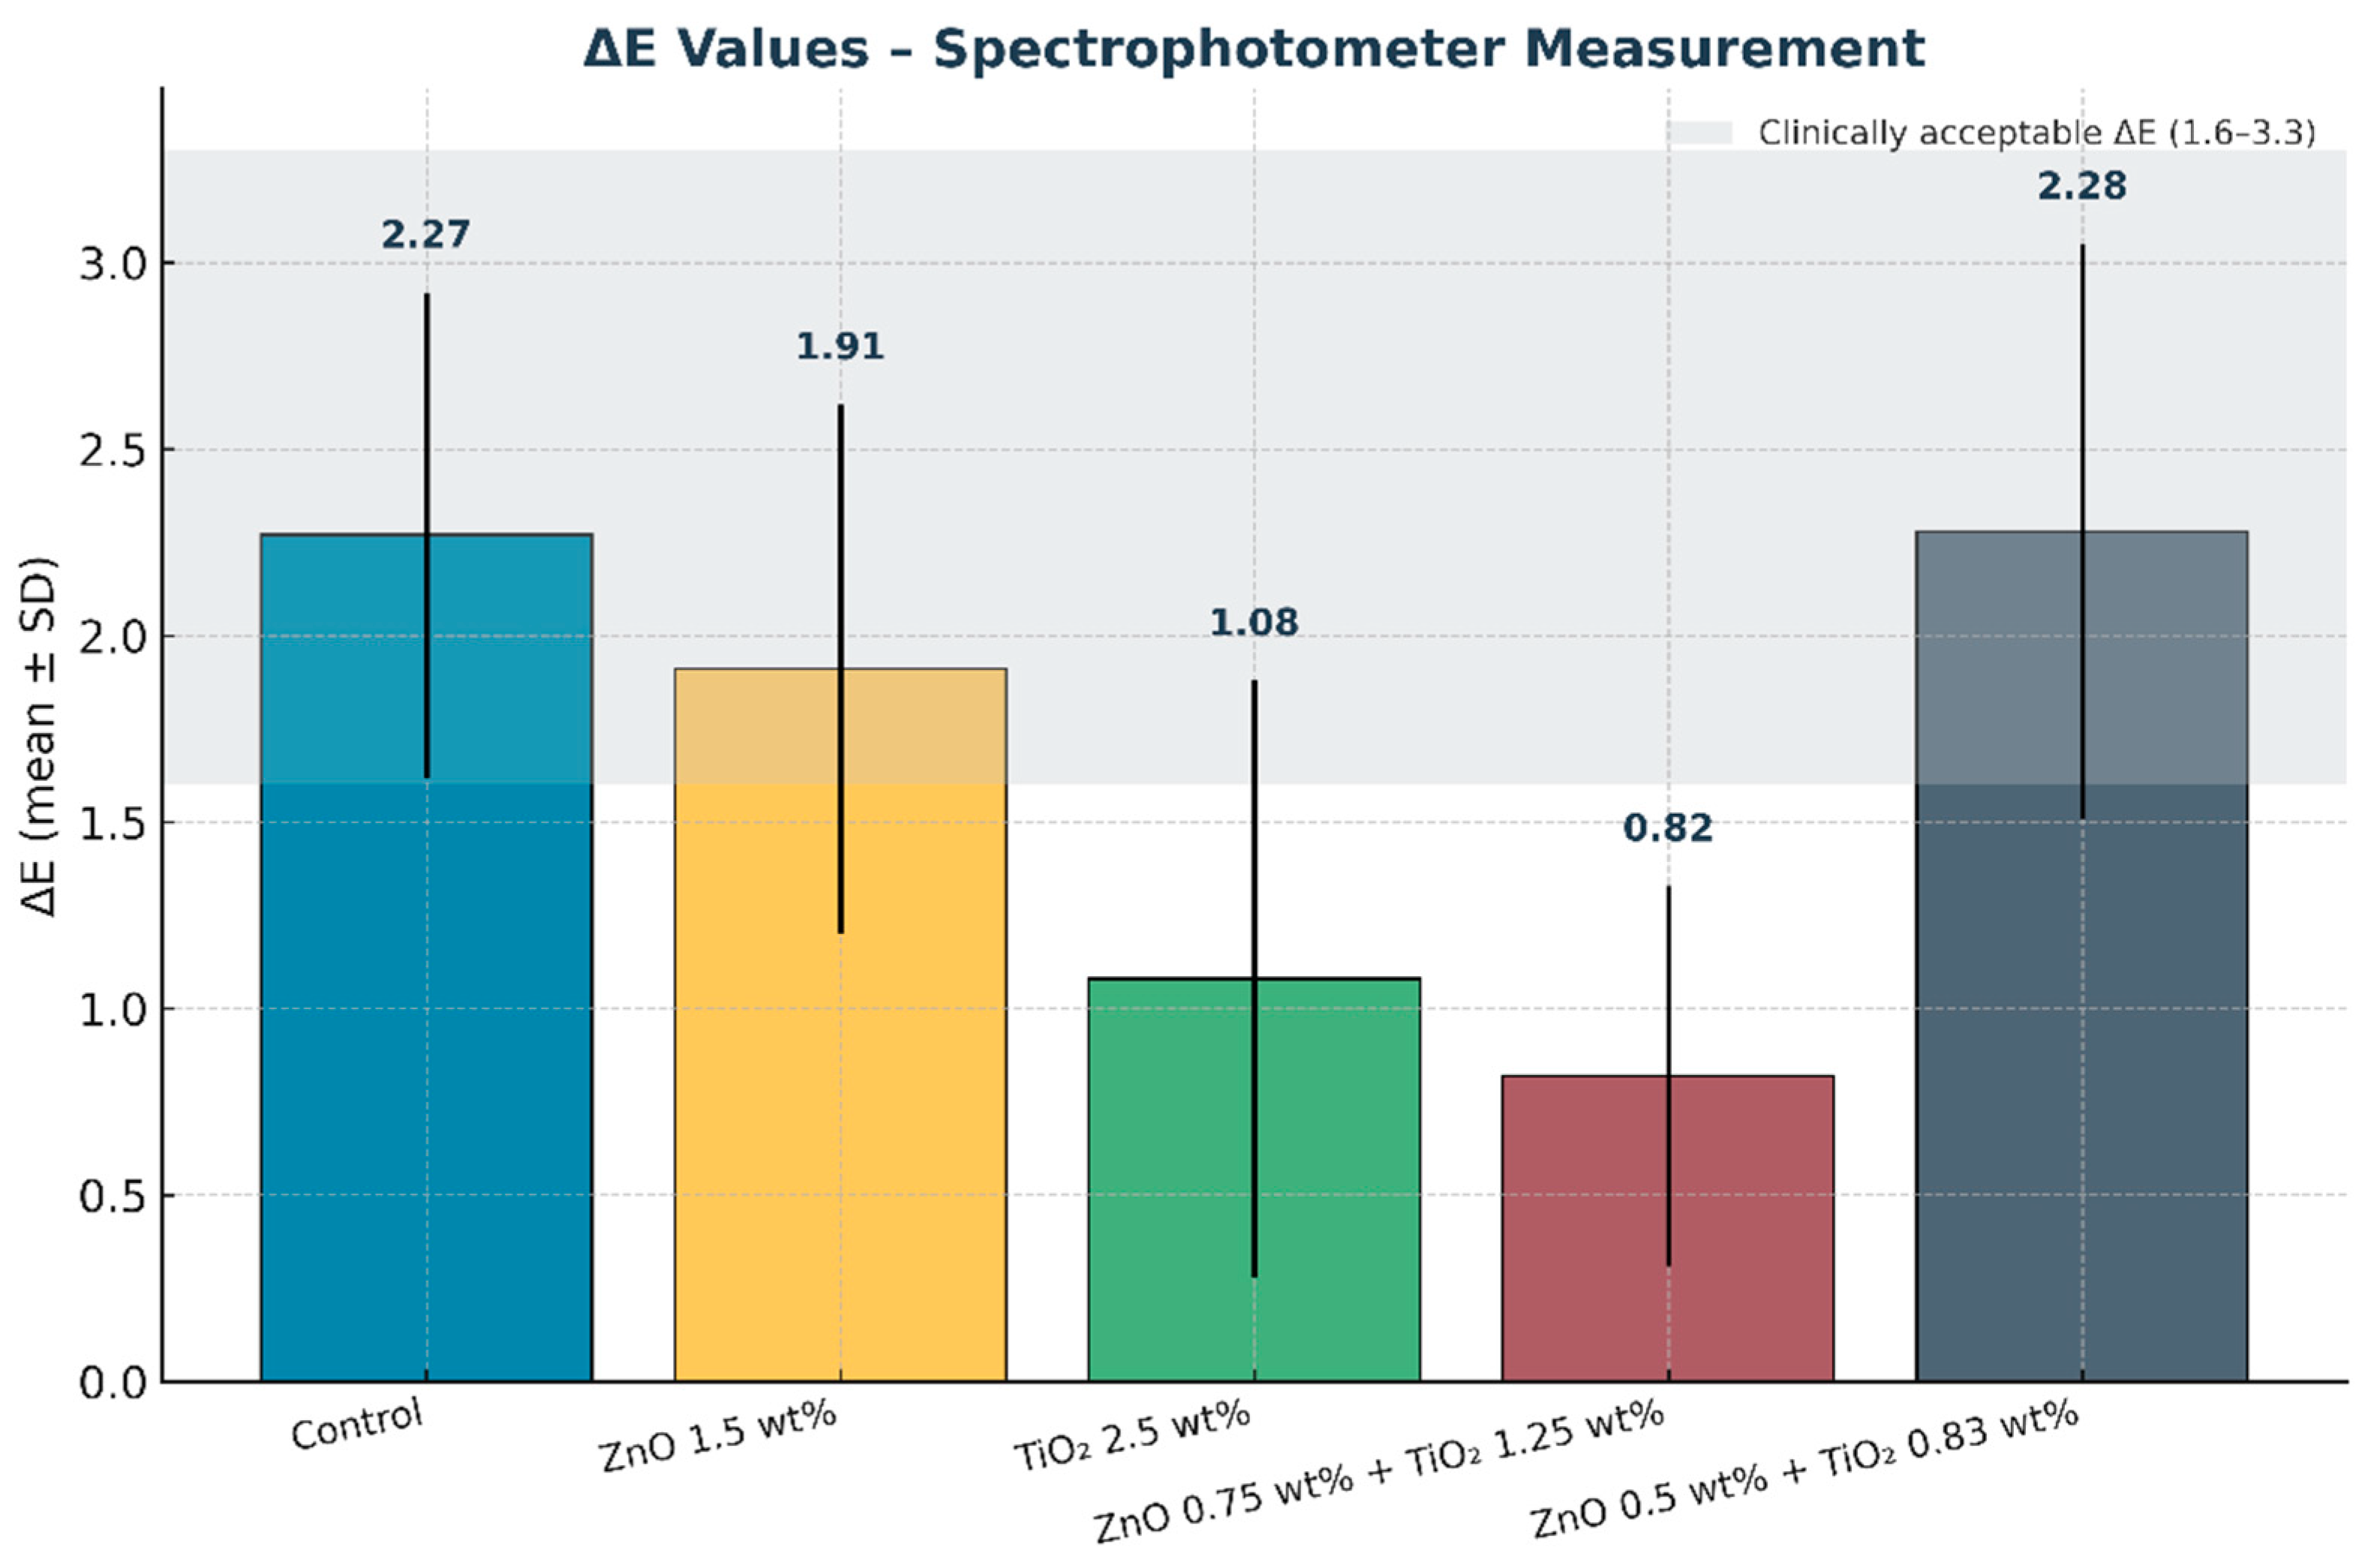
Mean color change values (ΔE) of maxillofacial silicone elastomers measured with a spectrophotometer. Error bars represent standard deviation (SD). The shaded grey band indicates the clinically acceptable ΔE range (1.6–3.3). The combined nanoparticle group (0.75 wt% ZnO + 1.25 wt% TiO2) exhibited the lowest ΔE, confirming superior color stability after artificial aging.
Figure 13.
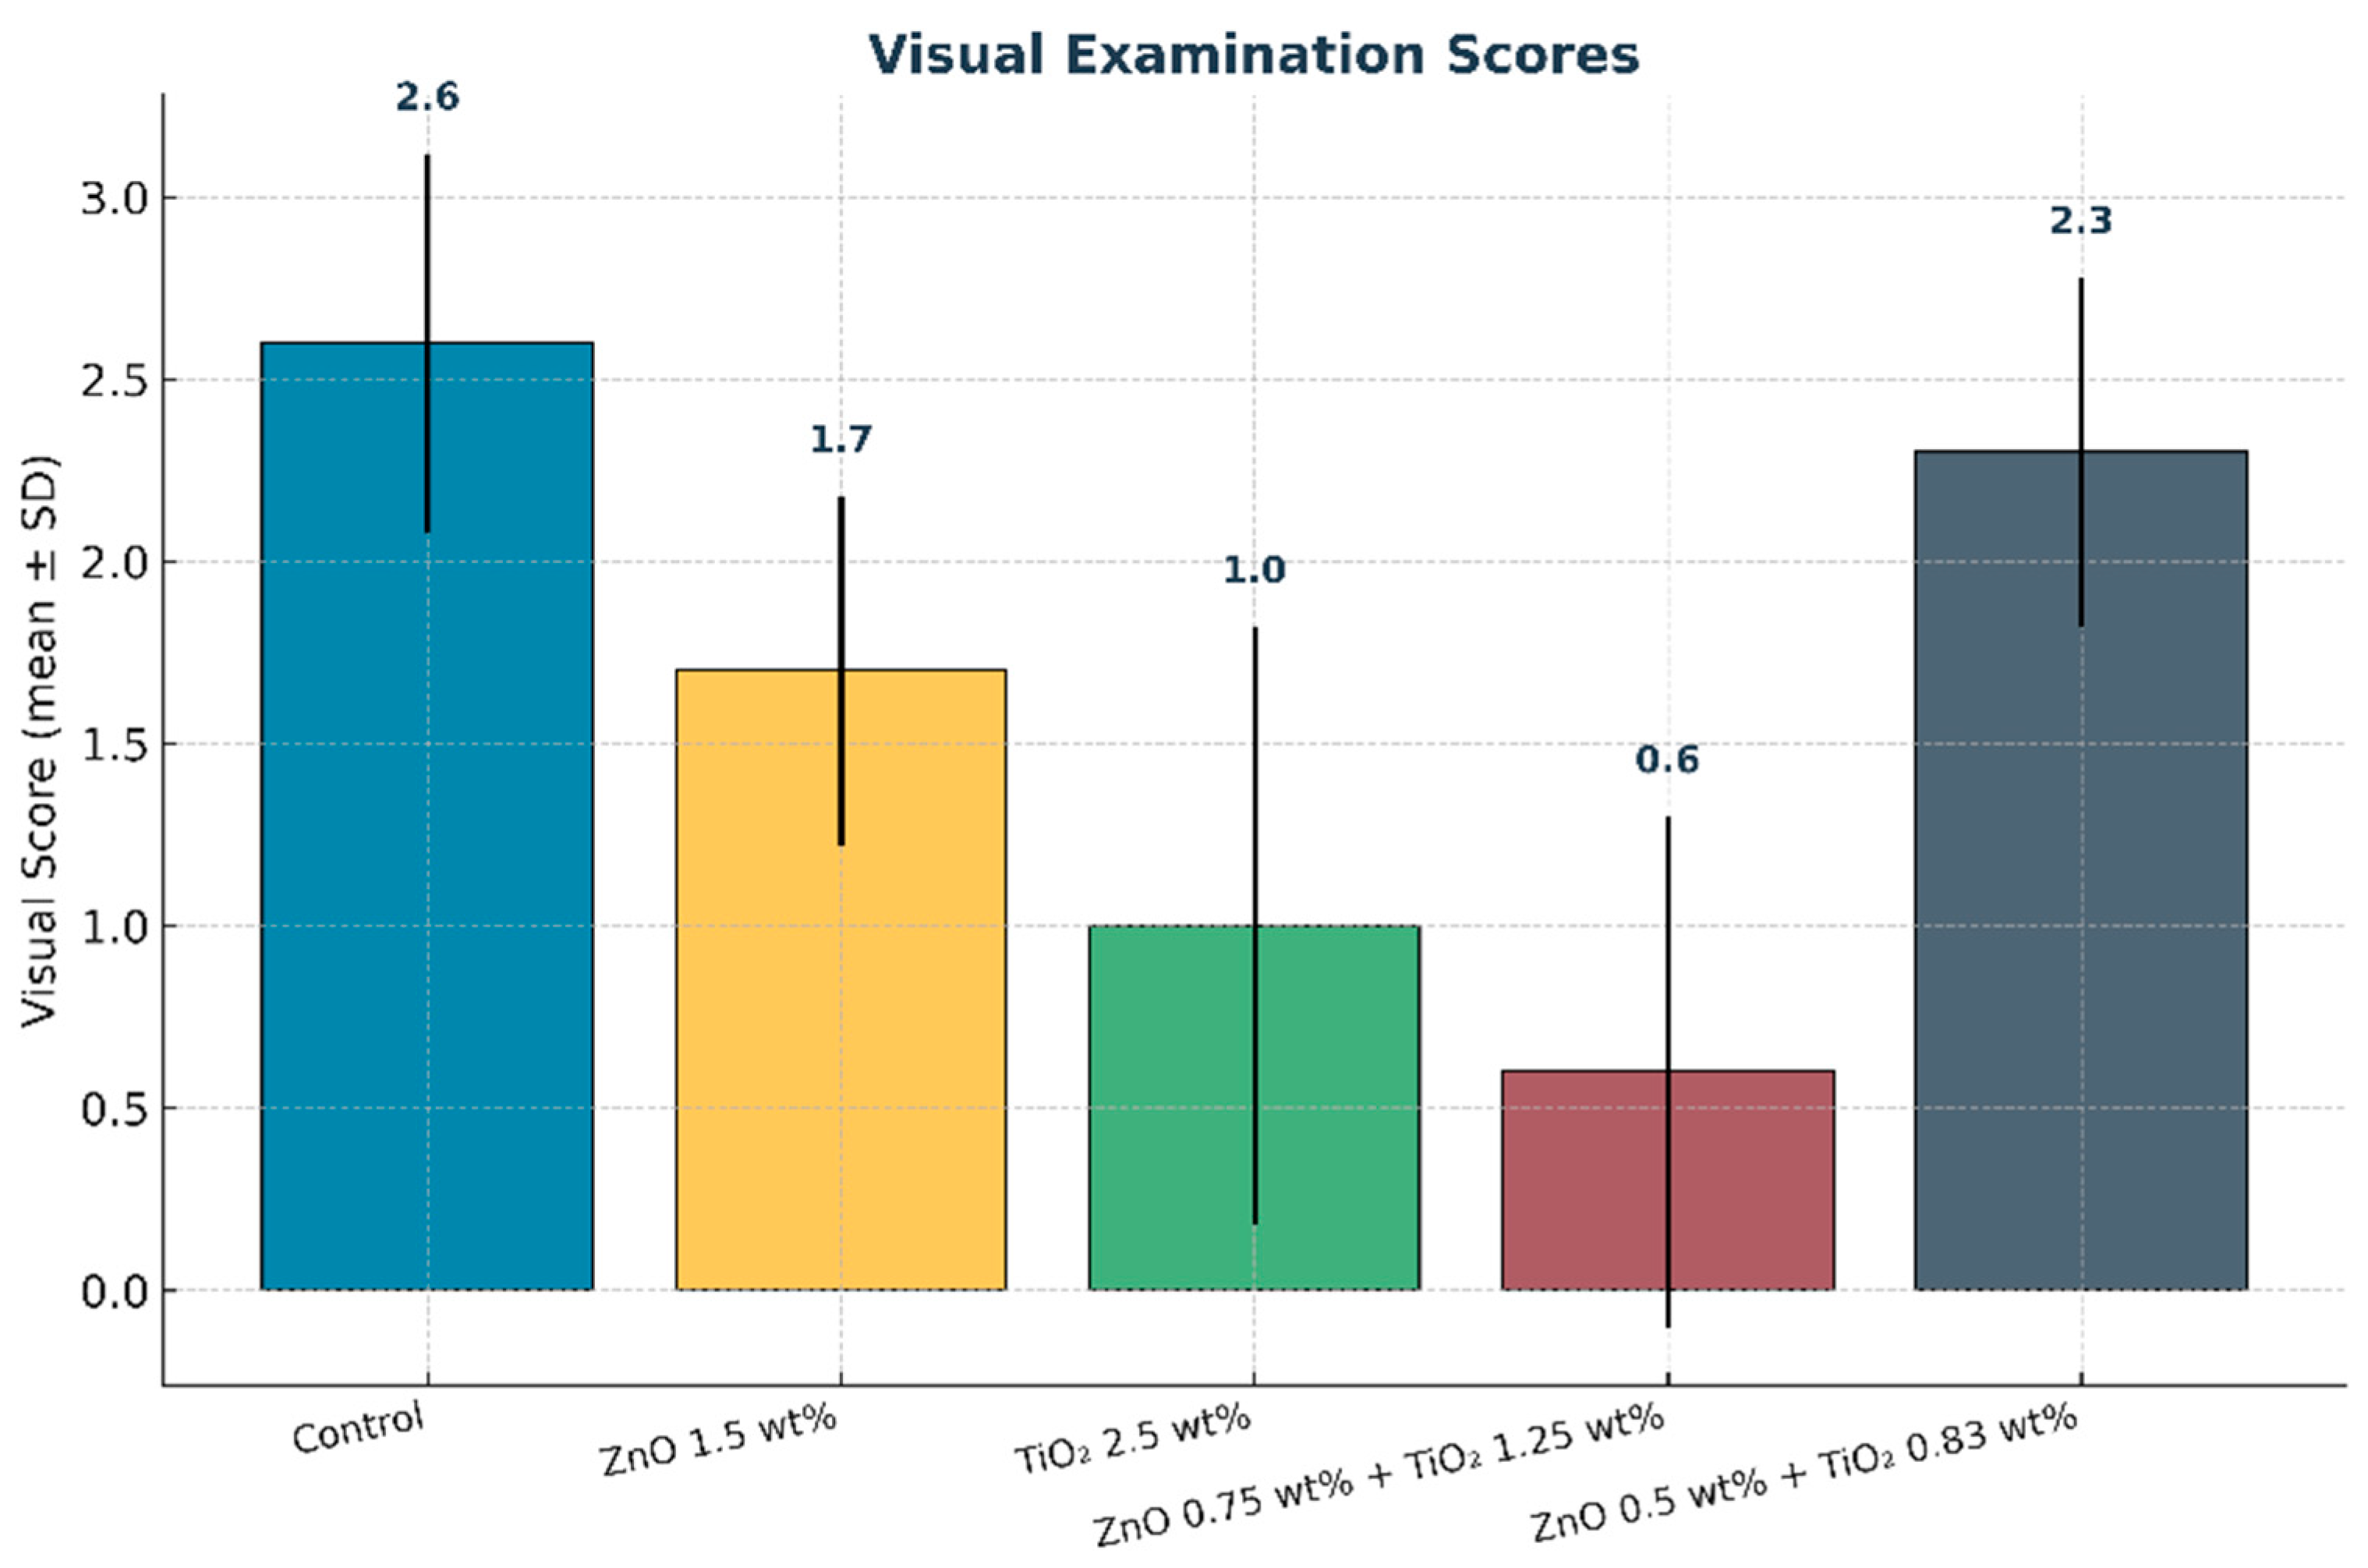
Mean visual examination scores of maxillofacial silicone elastomers after artificial aging. Error bars represent standard deviation (SD). The combined nanoparticle group (0.75 wt% ZnO + 1.25 wt% TiO2) exhibited the lowest scores, reflecting the greatest visual color stability.
Figure 13.
Mean visual examination scores of maxillofacial silicone elastomers after artificial aging. Error bars represent standard deviation (SD). The combined nanoparticle group (0.75 wt% ZnO + 1.25 wt% TiO2) exhibited the lowest scores, reflecting the greatest visual color stability.
Figure 14.
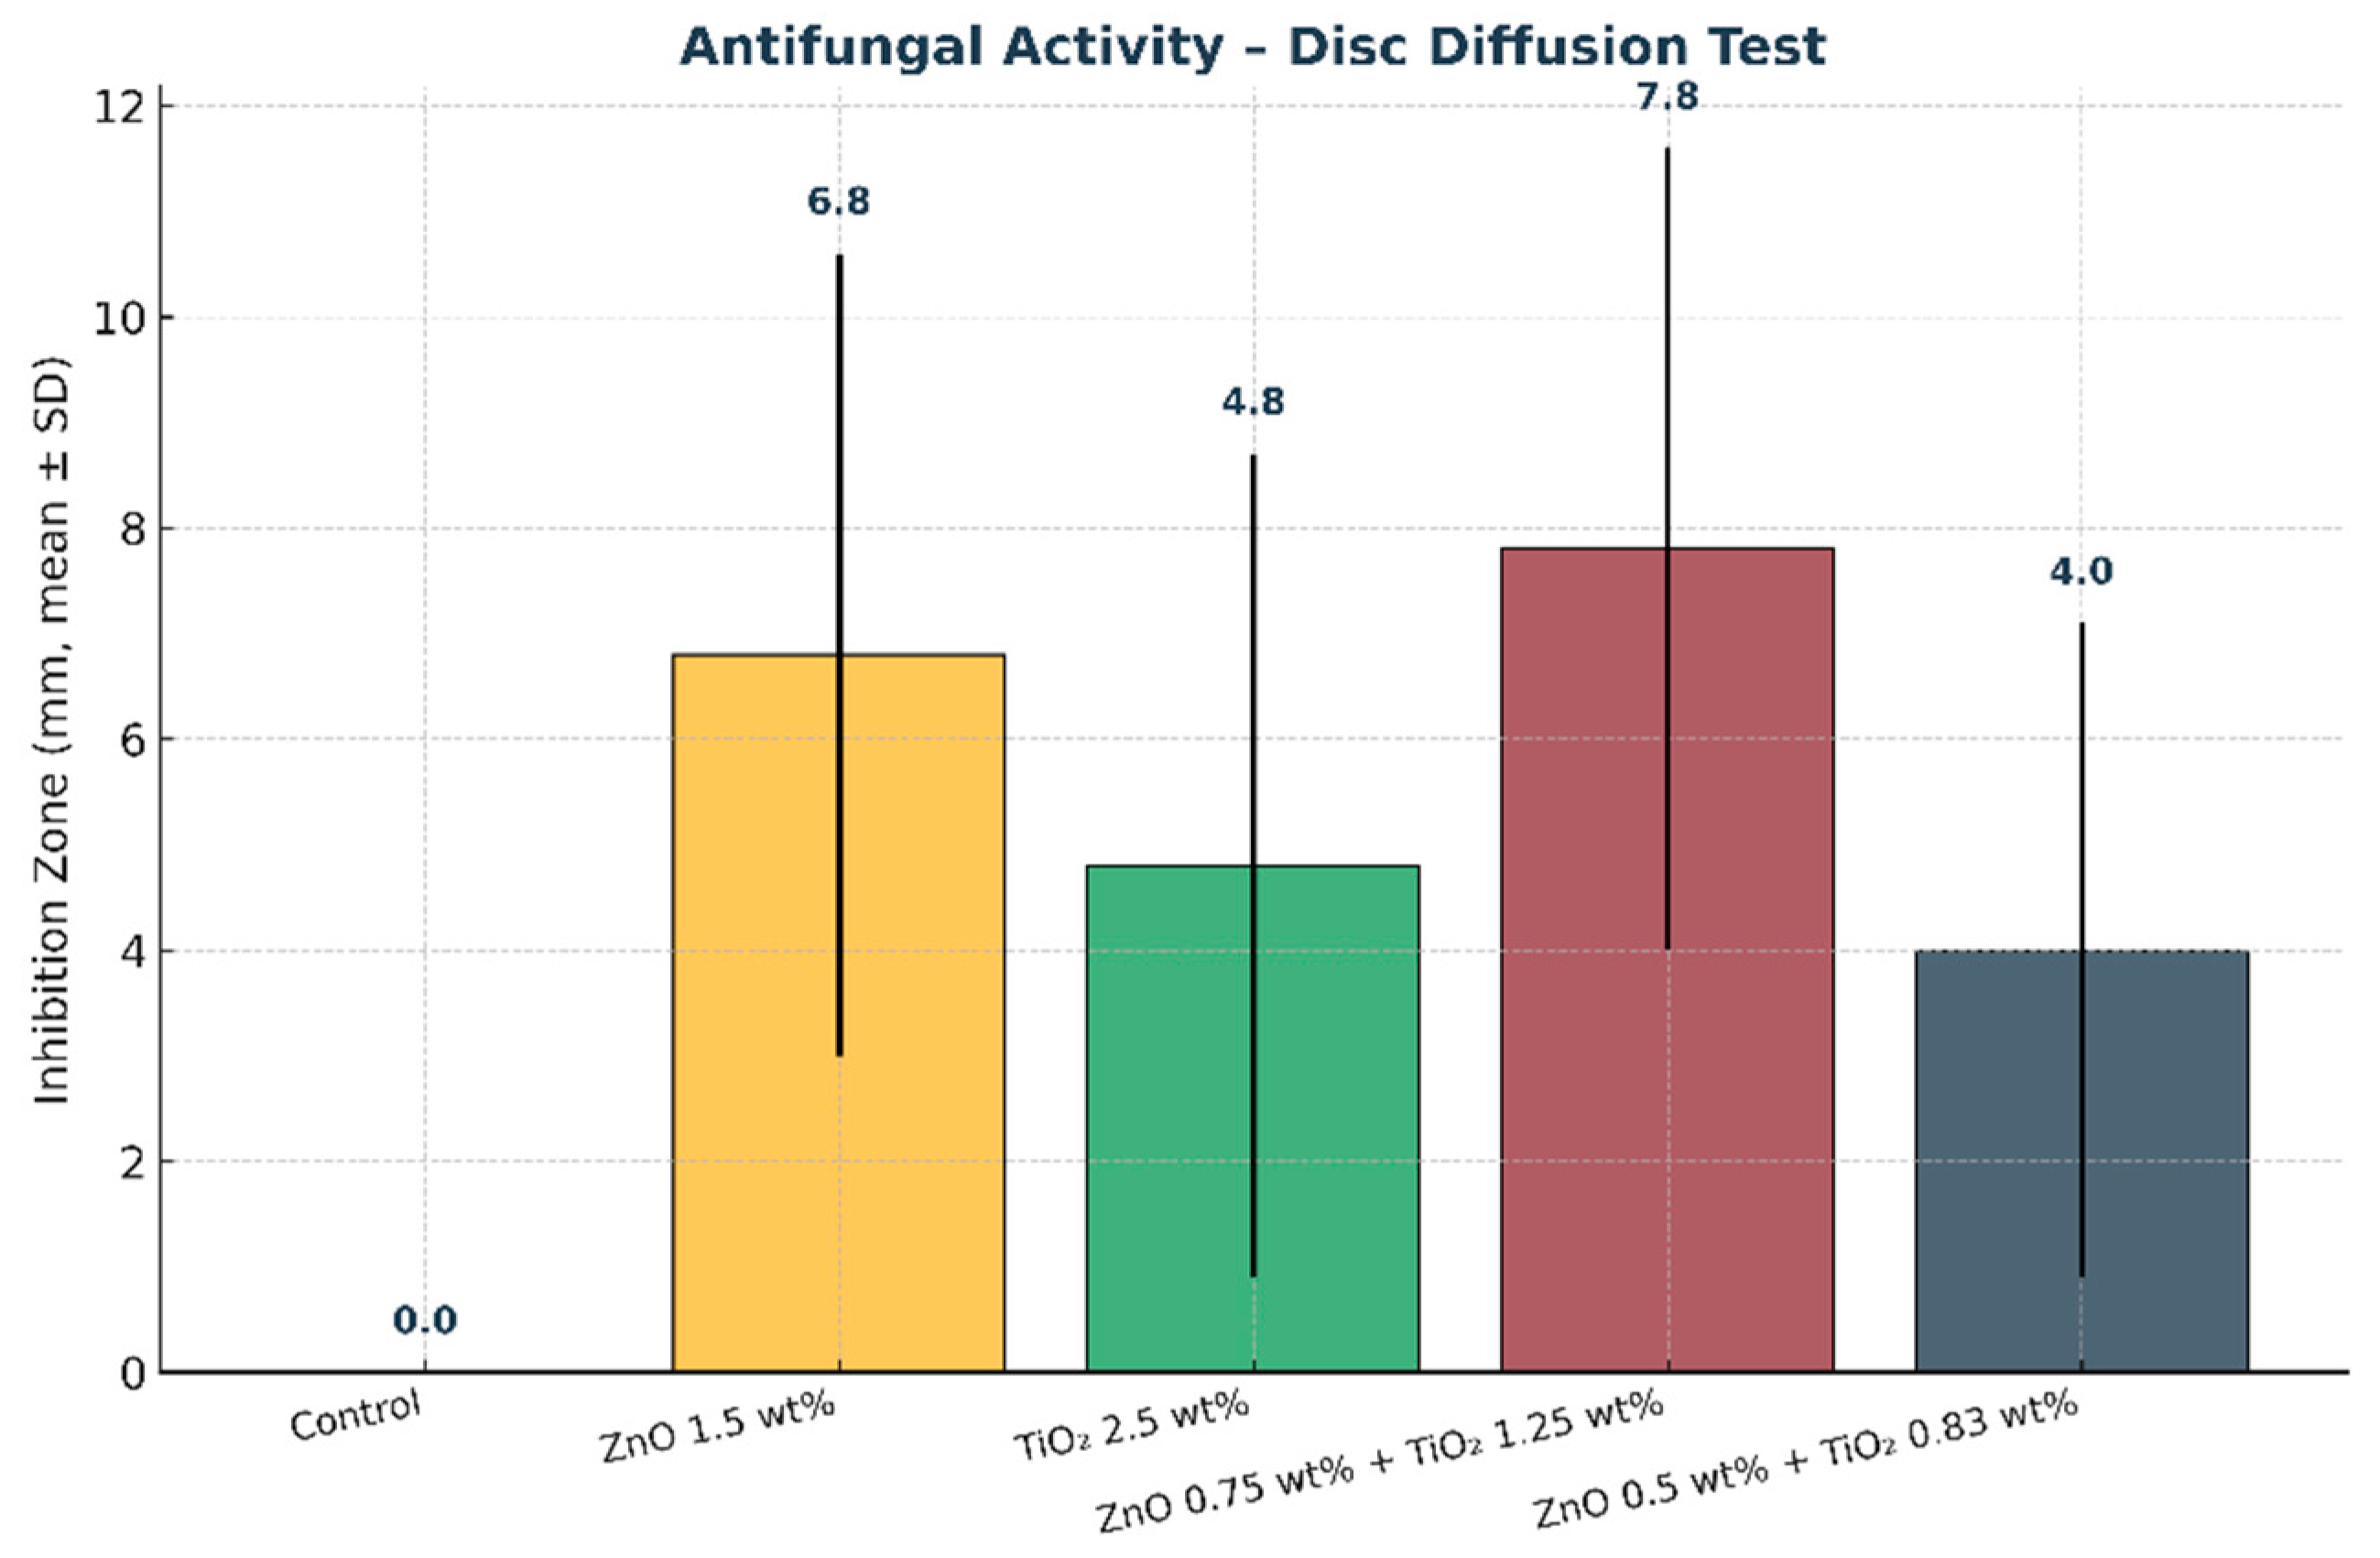
Mean inhibition zone diameters (mm) of maxillofacial silicone specimens obtained from the disc diffusion test. Error bars represent standard deviation (SD). The combined nanoparticle group (0.75 wt% ZnO + 1.25 wt% TiO2) demonstrated the largest inhibition zone, indicating the strongest antifungal activity compared with the control and single nanoparticle groups.
Table 1.
Specimen Distribution.
Table 1.
Specimen Distribution.
| Group A (Control) | Group B | Group C | Group D1 | Group D2 |
|---|
| Teksil-25 RTV silicone with 0.02% cream intrinsic pigmentation only. | 1.5% by weight ZnO nano+ pigmented RTV silicone. | 2.5% by weight TiO2 nano + pigmented RTV silicone. | 0.75% by weight ZnO and 1.25% by weight TiO2 nano + pigmented RTV silicone. | 0.5% by weight ZnO and 0.83% by weight TiO2 nano + pigmented RTV silicone. |
Table 2.
UV weathering aging chamber Parameters.
Table 2.
UV weathering aging chamber Parameters.
| Average Wavelength | 340 nm |
| Temperature | 60 ± 3 °C |
| Condensation duration cycle | 3.75 h |
| Energy | 0.89 W/m2/nm |
| Water spray duration cycle | 0.25 h |
| UV light exposure duration cycle | 8 h |
| Relative humidity | 65 ± 5% |
Table 3.
Visual examination.
Table 3.
Visual examination.
| Score | Degree of Change | ΔE (CIELAB) Range | Visual Interpretation |
|---|
| 0 | No change | ΔE < 0.5 | No perceptible difference |
| 1 | Slight change | 0.5 ≤ ΔE < 1.5 | Barely noticeable to trained observers |
| 2 | Mild change | 1.5 ≤ ΔE < 3.0 | Noticeable under close inspection |
| 3 | Moderate change | 3.0 ≤ ΔE < 6.0 | Clearly visible to average observers |
| 4 | Severe change | ΔE ≥ 6.0 | Obvious at a glance |
Table 4.
Means and standard deviations of color change (ΔE) of colorimeter device.
Table 4.
Means and standard deviations of color change (ΔE) of colorimeter device.
| Group | ∆L | ∆A | ∆B | ∆E |
|---|
| Control | −0.72 ± 1.42 | −0.53 ± 0.19 | 1.01 ± 0.76 | 2.31 ± 0.62 |
| 1.5% ZnO | −0.56 ± 0.56 | −0.04 ± 0.18 | 1.91 ± 0.52 | 1.91 ± 0.66 |
| 2.5% TiO2 | −0.55 ± 0.67 | −0.11 ± 0.10 | −0.77 ± 1.15 | 1.01 ± 0.76 |
| 0.75% ZnO+ 1.25%TiO2 | −0.74 ± 0.54 | 0.00 ± 0.09 | 0.02 ± 0.69 | 0.86 ± 0.50 |
| 0.5% ZnO+ 0.83% TiO2 | −0.54 ± 0.64 | 0.13 ± 0.12 | 1.78 ± 0.30 | 2.19 ± 0.73 |
Table 5.
ANOVA results for color changes (ΔE) after artificial aging for colorimeter device.
Table 5.
ANOVA results for color changes (ΔE) after artificial aging for colorimeter device.
| ∆E | SS | DF | MS | F | Sig. |
|---|
| Between Groups | 9.956 | 4 | 2.489 | 6.401 | 0.000 |
| Within Groups | 17.498 | 45 | 0.389 | | |
| Total | 27.454 | 49 | | | |
Table 6.
Data Analysis of Post hoc test for (ΔE) values of Color stability test with colorimeter device.
Table 6.
Data Analysis of Post hoc test for (ΔE) values of Color stability test with colorimeter device.
| Groups | Sig. |
|---|
| Control | 1.5%ZnO | 0.978 |
| 2.5% TiO2 | 0.079 |
| 0.75% ZnO + 1.25%TiO2 | 0.002 |
| 0.5% ZnO + 0.83% TiO2 | 1.000 |
| 1.5% ZnO | Control | 0.978 |
| 2.5% TiO2 | 0.252 |
| 0.75% ZnO + 1.25%TiO2 | 0.011 |
| 0.5% ZnO + 0.83% TiO2 | 0.986 |
| 2.5% TiO2 | Control | 0.079 |
| 1.5%ZnO | 0.252 |
| 0.75% ZnO + 1.25%TiO2 | 0.647 |
| 0.5% ZnO + 0.83% TiO2 | 0.092 |
| 0.75% ZnO + 1.25%TiO2 | Control | 0.002 |
| 1.5% ZnO | 0.011 |
| 2.5% TiO2 | 0.647 |
| 0.5% ZnO+ 0.83% TiO2 | 0.002 |
| 0.5% ZnO + 0.83% TiO2 | Control | 1.000 |
| 1.5% ZnO | 0.986 |
| 2.5% TiO2 | 0.092 |
| 0.75% ZnO + 1.25%TiO2 | 0.002 |
Table 7.
Means and standard deviations of color change (ΔE) of Spectrophotometer device.
Table 7.
Means and standard deviations of color change (ΔE) of Spectrophotometer device.
| Group | ∆L | ∆A | ∆B | ∆E |
|---|
| Control | −0.70 ± 1.48 | −0.54 ± 0.19 | 0.89 ± 0.68 | 2.27 ± 0.65 |
| 1.5% ZnO | −0.48 ± 0.57 | −0.02 ± 0.17 | 1.83 ± 0.50 | 1.91 ± 0.71 |
| 2.5% TiO2 | −0.44 ± 0.72 | −0.11 ± 0.11 | −0.81 ± 1.23 | 1.08 ± 0.80 |
| 0.75% ZnO+ 1.25%TiO2 | −0.71 ± 0.55 | −0.01 ± 0.08 | −0.01 ± 0.53 | 0.82 ± 0.51 |
| 0.5% ZnO+ 0.83% TiO2 | −0.56 ± 0.66 | 0.12 ± 0.11 | 1.77 ± 0.30 | 2.28 ± 0.77 |
Table 8.
ANOVA results for color changes (ΔE) after artificial aging for Spectrophotometer device.
Table 8.
ANOVA results for color changes (ΔE) after artificial aging for Spectrophotometer device.
| | Sum of Squares | df | Mean Square | F | Sig. |
|---|
| ∆E | Between Groups | 17.666 | 4 | 4.416 | 10.892 | 0.000 |
| Within Groups | 18.247 | 45 | 0.405 | | |
| Total | 35.913 | 49 | | | |
Table 9.
Data Analysis of Post hoc test for (ΔE) values of Color stability test with spectrophotometer device.
Table 9.
Data Analysis of Post hoc test for (ΔE) values of Color stability test with spectrophotometer device.
| Groups | Sig. |
|---|
| Control | 1.5%ZnO | 0.711 |
| 2.5% TiO2 | 0.001 |
| 0.75% ZnO + 1.25%TiO2 | 0.000 |
| 0.5% ZnO + 0.83% TiO2 | 1.000 |
| 1.5% ZnO | Control | 0.711 |
| 2.5% TiO2 | 0.028 |
| 0.75% ZnO + 1.25%TiO2 | 0.009 |
| 0.5% ZnO + 0.83% TiO2 | 0.676 |
| 2.5% TiO2 | Control | 0.001 |
| 1.5%ZnO | 0.028 |
| 0.75% ZnO + 1.25%TiO2 | 0.997 |
| 0.5% ZnO + 0.83% TiO2 | 0.001 |
| 0.75% ZnO + 1.25%TiO2 | Control | 0.000 |
| 1.5% ZnO | 0.009 |
| 2.5% TiO2 | 0.997 |
| 0.5% ZnO+ 0.83% TiO2 | 0.000 |
| 0.5% ZnO + 0.83% TiO2 | Control | 1.000 |
| 1.5% ZnO | 0.676 |
| 2.5% TiO2 | 0.001 |
| 0.75% ZnO + 1.25%TiO2 | 0.000 |
Table 10.
Means and standard deviations of visual examinations scores.
Table 10.
Means and standard deviations of visual examinations scores.
| Group | Score (Mean ± SD) |
|---|
| Control | 2.6 ± 0.52 |
| 1.5% ZnO | 1.7 ± 0.48 |
| 2.5% TiO2 | 1.0 ± 0.82 |
| 0.75% ZnO + 1.25%TiO2 | 0.6 ± 0.70 |
| 0.5% ZnO + 0.83% TiO2 | 2.3 ± 0.48 |
Table 11.
ANOVA results for scores of visual examination test.
Table 11.
ANOVA results for scores of visual examination test.
| Score | SS | DF | MS | F | Sig. |
|---|
| Between Groups | 9.956 | 4 | 2.489 | 6.401 | 0.000 |
| Within Groups | 17.498 | 45 | 0.389 | | |
| Total | 27.454 | 49 | | | |
Table 12.
Data Analysis of Post hoc test for (ΔE) values of Color stability test with visual examination.
Table 12.
Data Analysis of Post hoc test for (ΔE) values of Color stability test with visual examination.
| Groups | Sig. |
|---|
| Control | 1.5%ZnO |
0.009
|
| 2.5% TiO2 |
0.000
|
| 0.75% ZnO + 1.25%TiO2 |
0.000
|
| 0.5% ZnO + 0.83% TiO2 |
0.723
|
| 1.5% ZnO | Control |
0.009
|
| 2.5% TiO2 |
0.121
|
| 0.75% ZnO + 1.25%TiO2 |
0.009
|
| 0.5% ZnO + 0.83% TiO2 |
0.215
|
| 2.5% TiO2 | Control |
0.000
|
| 1.5%ZnO |
0.121
|
| 0.75% ZnO + 1.25%TiO2 |
0.864
|
| 0.5% ZnO + 0.83% TiO2 |
0.000
|
| 0.75% ZnO + 1.25%TiO2 | Control |
0.000
|
| 1.5% ZnO |
0.009
|
| 2.5% TiO2 |
0.864
|
| 0.5% ZnO+ 0.83% TiO2 |
0.000
|
| 0.5% ZnO + 0.83% TiO2 | Control |
0.723
|
| 1.5% ZnO |
0.215
|
| 2.5% TiO2 |
0.000
|
| 0.75% ZnO + 1.25%TiO2 |
0.000
|
Table 13.
Means and standard deviations of disc diffusion test.
Table 13.
Means and standard deviations of disc diffusion test.
| Group | Mean Inhibition Zone ± SD (mm) |
|---|
| Control | 0.0 ± 0.0 |
| 1.5% ZnO | 6.8 ± 3.8 |
| 2.5% TiO2 | 4.8 ± 3.9 |
| 0.75% ZnO+ 1.25%TiO2 | 7.8 ± 3.8 |
| 0.5% ZnO+ 0.83% TiO2 | 4.0 ± 3.1 |
Table 14.
ANOVA results for Disc diffusion test inhibition zones.
Table 14.
ANOVA results for Disc diffusion test inhibition zones.
| Inhibition Zone | SS | DF | MS | F | Sig. |
|---|
| Between Groups |
366.080
|
4
|
91.520
|
7.357
| 0.000 |
| Within Groups |
559.800
|
45
|
12.440
| | |
| Total |
925.880
|
49
| | | |
Table 15.
Data Analysis of Post hoc test for disc diffusion test.
Table 15.
Data Analysis of Post hoc test for disc diffusion test.
| Groups | Sig. |
|---|
| Control | 1.5%ZnO |
0.001
|
| 2.5% TiO2 |
0.030
|
| 0.75% ZnO + 1.25%TiO2 |
0.000
|
| 0.5% ZnO + 0.83% TiO2 |
0.101
|
| 1.5% ZnO | Control |
0.001
|
| 2.5% TiO2 |
0.712
|
| 0.75% ZnO + 1.25%TiO2 |
0.969
|
| 0.5% ZnO + 0.83% TiO2 |
0.400
|
| 2.5% TiO2 | Control |
0.030
|
| 1.5%ZnO |
0.712
|
| 0.75% ZnO + 1.25%TiO2 |
0.331
|
| 0.5% ZnO + 0.83% TiO2 |
0.986
|
| 0.75% ZnO + 1.25%TiO2 | Control |
0.000
|
| 1.5% ZnO |
0.969
|
| 2.5% TiO2 |
0.331
|
| 0.5% ZnO+ 0.83% TiO2 |
0.132
|
| 0.5% ZnO + 0.83% TiO2 | Control |
0.101
|
| 1.5% ZnO |
0.400
|
| 2.5% TiO2 |
0.986
|
| 0.75% ZnO + 1.25%TiO2 |
0.132
|
