Abstract
Background/Objectives: In the oral environment, tooth-colored restorations are frequently exposed to staining agents, affecting their aesthetic and physical properties. This study assessed the impact of stains and bleaching agents on the surface roughness, microhardness, and color stability of four different composite materials (Omnichroma, Charisma, Z350, and TPH). Methods: Based on group distribution, the discs of all the composite material samples were prepared. All the ninety-six-disc specimens (n = 96) were then randomly divided into four different groups based on different composite resin groups. The samples were then immersed into four different immersing media [each group had twenty-four-disc samples (n = 24)]. Finally, all the samples then faced the challenge of a bleaching agent application. Measurements were taken at baseline, post-immersion, and post-bleaching stages. Results: Red wine caused increased roughness in Filtek™ Z350 and significant color change in Omnichroma, while coffee increased roughness in Omnichroma and altered the color of TPH spectra. Soda led to increased roughness and significant color change in TPH spectra. Additionally, Filtek™ Z350 experienced reduced microhardness across all solutions after bleaching. Conclusion: This study concluded that staining and bleaching adversely affected the tested composites, with increases in surface roughness, color change, and microhardness reduction observed. Overall, Charisma diamond demonstrated the greatest resilience to staining and bleaching challenges, whereas Filtek™ Z350 XT exhibited the most pronounced degradation, indicating that composite formulation critically governs both aesthetic and mechanical stability under clinically relevant conditions.
1. Introduction
Dental composites have a long history. In the 1960s, Dr. Rafael Bowen developed the first dimethacrylate-based resin system, Bowen’s resin, which transformed restorative dentistry by providing an aesthetically pleasing substitute for amalgam [1]. Early composites were made of quartz or silica fillers in a Bis-GMA matrix, but they could only be used in non-load-bearing regions because of their poor mechanical qualities. Strength and wear resistance were greatly increased by developments in filler technology, such as the creation of hybrid composites in the 1980s and microfilled in the 1970s [2]. The 21st century witnessed the emergence of nanofilled and bulk-fill composites, improving handling, aesthetics, and durability [3]. Recent advancements encompass bioactive composites that emit ions for remineralization [4] and self-healing materials designed to prolong the lifespan of restorations [5]. These developments underscore the ongoing progression of dental composites towards enhanced performance and biofunctionality.
The global tooth whitening market is expected to increase at a compound annual growth rate (CAGR) of around 4%, from approximately 6.14 billion dollars in 2020 to 8.21 billion dollars by 2026 [6]. Nowadays, looking for a beautiful smile has become popular worldwide. Achieving this demand needs a healthy, natural, and aesthetic smile. Bleaching and composite restorations were made to overcome esthetic problems. Bleaching has been recognized as an effective and conservative method for removing intrinsic and extrinsic stains from teeth, whether done in the office or at home [7].
The main ingredient in in-office bleaching agents used is usually hydrogen peroxide or carbamide peroxide, which, when applied, decomposes into hydrogen peroxide and urea. Through an oxidation process, hydrogen peroxide serves as the active whitening agent. Reactive oxygen species (ROS) are released when they are applied to teeth and diffuse through the dentin and enamel. Chromogenic chemicals are large, pigmented organic molecules that cause staining; these ROS interact with and degrade them [8,9]. The chromogens are broken up into smaller, less pigmented molecules by this chemical reaction, which causes a whitening effect. Additional ingredients like desensitizers (such as fluoride or potassium nitrate) to reduce tooth sensitivity and stabilizers to extend the peroxide’s shelf life and efficacy are frequently found in in-office bleaching solutions. In addition to limiting negative effects on tooth structure, the expert application and carefully regulated concentration guarantee quick and evident results.
It is unavoidable to prevent the composite material from contact with the bleaching agent, especially in anterior restoration, during the bleaching procedure In the oral environment, tooth-colored restorations are exposed to several types of stains, including coffee, tea, and spices [10,11]. Because of this, resin composite materials should be intrinsically color-stable and stain-resistant to achieve an excellent aesthetic appearance [10].
Therefore, many studies were performed to inspect the effect of bleaching agents on the different physical and microscopic properties of various types of composite restoration, such as color change [12,13,14], surface roughness [12,14,15], and microhardness [16,17,18], after being exposed to common stains.
Different types of stains may change the color of composite restoration, especially when exposed to stains for a long period. Coffee was found to stain the composite more than tea. Another study observed a great color change when immersed in red wine (RW) [19,20]. It has been found that the staining susceptibility of composite resins significantly increases after the application of 15% carbamide peroxide [21]. Moreover, 10% carbamide peroxide was able to remove extrinsic stains from composite resin exposed to juice, tea, and chlorhexidine [22].
A significant color change of composite restoration was found after the bleaching procedure, especially when bleached with a high concentration of hydrogen peroxide. Torres et al. reported a significant color change after bleaching with 35% hydrogen peroxide compared to 20% hydrogen peroxide [23].
Many studies have reported an increased surface roughness due to the chemical reaction produced by the bleaching procedure [24]. Scanning electron microscopic analysis showed a great increase in the composite’s surface roughness after applying hydrogen peroxide compared to a slight change when using chromide peroxide [14]. Furthermore, Yap and Wattanapayungku showed that prolonged use of home bleaching agents may cause significant surface roughness. Moreover, the increase in surface roughness results in microscopic cracks when scanned by a scanning electron microscope [25,26,27]. For that reason, some studies recommended polishing composite restoration after the bleaching procedure since the increase in surface roughness might result in increased plaque accumulation and staining susceptibility [15,28]. In contrast, Hannig et al. [29] reported a significant decrease in the microhardness of composite material after the bleaching procedure, not only confined to the surface but going deep up to 2 mm as a consequence. Polishing may not be enough to restore the physical properties of the composite material [30]. A study conducted by Klaric et al. showed that the use of a high concentration of hydrogen peroxide 40% for a total time of 45 min resulted in a significant reduction in microhardness; on the other hand, several studies showed no significant reduction of microhardness of restorative material after being bleached with different concentration of bleaching agent [18,25].
This study aimed to investigate the effect of a bleaching agent on color change, microhardness, surface roughness, and fluorescence of different types of composite restorative material after being stained in various media: coffee, red wine (RW), soda, and distilled water (D/W).
2. Materials and Methods
2.1. Sample Size Calculations
The disc samples underwent a number of characterization and analytical procedures. The mean and standard deviation (SD) from a previously published study were used [31] to determine the sample size (n = 96). Using the ClinCalc program, the power calculation method was applied to the study’s means, SD, and 80% confidence interval. For each group, a sample size of five (n = 5) was obtained at a significance level of p = 0.05.
2.2. Specimen Preparation
A total of 96 specimens (n = 96) was finalized. Out of the total number of samples, 24 samples (n = 24) for each composite group were prepared. The composite groups Omnichroma (Tokuyama Dental Deutschland GmbH, Metelen, Germany), TPH Spectra (Dentsply DeTrey GmbH, Kontanz, Germany), Charisma Diamond (MC Dental Holdings Europe GmbH, Leipziger Straße 2, 63450 Hanau, Hesse, Germany), and FiltekTM Z350 (3M Company, 3M Center, St. Paul, MN, USA) were selected. A square silicone mold was utilized with 5 × 5 mm with 2 mm thickness [32]. For every immersion medium, 6 samples (n = 6) were used from every composite resin group (Figure 1a).
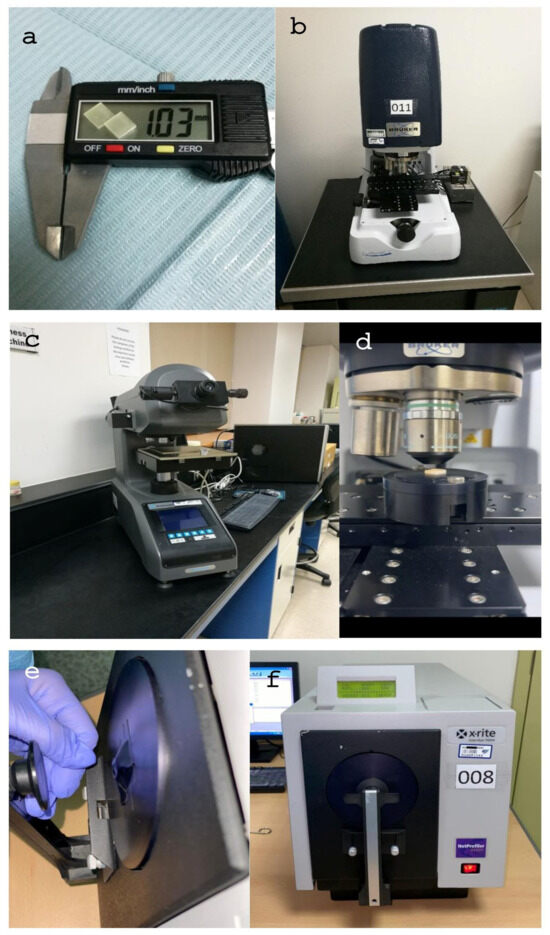
Figure 1.
The different steps of characterization along with the material discs. (a) Composite discs; (b) surface roughness machine; (c,d) microhardness in progress; (e,f) spectrophotometry in progress for the disc samples.
The mold with the composite was covered with a glass slide and was gently pressed to remove excess material in order to ensure a flat surface. Light curing was performed with Dentsply QHL75 (Dentsply DeTrey GmbH, 78467, Konstanz, Germany) for 40 s. All the specimens were kept at 37 °C in an incubator for 24 h to ensure complete polymerization. The top surfaces of all specimens were polished with a MetaServ 250 Grinder-Polisher machine (BUEHLER, 41 Waukegan Road Lake, Bluff, IL, USA). The final material sample was then followed by the characterization for color, microhardness, and surface roughness to obtain the baseline data.
2.3. Staining Process
The specimens of each group were divided into 3 subgroups. The specimens in each group were immersed in immersing media, RW (Lussory premium tempranillo non-alcoholic RW, Dismark Products S.L, A Coruña, Spain), coffee (Brazil Arabica Black Coffee, Seobuk-gu, Seonghwan-eup, 42 Yeounam Yulgeum-ro, Seobuk-gu, Cheonan-si, Chungcheongnam-do, Republic of Korea), soda (Pepsi, Al Nakhlah Tower 3026 Mohammed Ibn Salman Ibn Abdulaziz Rd As Sahafah, Riyadh, Saudi Arabia), and D/W (control group) as per the calculation of surface to surface-to-volume ratio [33,34]. The volume of each solution was established at 10 mL and subjected to immersion for 3 h daily at room temperature during the 40-day testing period [35]. The coffee group specimens were immersed in a 10 mL filtered coffee vial. The RW group specimens were immersed in a 10 mL non-alcoholic RW vial. The soda group specimens were immersed in a 10 mL soda vial. The D/W group specimens were immersed in a 10 mL D/W vial [36]. After each staining period, all the specimens were rinsed with deionized water and kept again in the respective vial at 37 °C.
2.4. Bleaching Procedure
The specimens were then immersed in In-Office Bleaching (Opalescence Boost PF 40%, Ultradent, 505 West Ultradent Drive, South Jordan, UT, USA). The bleaching procedure was performed in three sessions (as per manufacturer recommendations). The gel was applied on the specimen surfaces using a disposable applicator (Microbrush International, 1376 Cheyenne Ave., Grafton, WI, USA). This procedure was repeated three times in the session; the gel was reapplied every 20 min, totaling 60 min per session. After every bleaching session, the specimens were washed with deionized water for 2 min. Once the procedure was completed, the disc samples were stored at 37 °C until we performed the assigned characterizations [37].
2.5. Microhardness Analysis
At the baseline and after 40 days of immersion cycles, the specimens from each group were air-dried and positioned beneath the indenter of a digital microhardness tester (MicroMet 6040 Microhardness Testing Machine, Buehler Lake Bluff, IL, USA) (Figure 1c,d). Three indents were made on the polished surface of each specimen under a 200 g load applied through the indenter, with a dwell time of 20 s, and an average of three indents were used for analysis. The same process was applied after bleaching for 14 days on the same specimen. The formula used to determine the VHN values was
where HV is the unit of microhardness used for Vickers’ Pyramid number, F is the load (kgf), and d is the diagonal length (millimeters).
HV = 1.8544(F/d2)
2.6. Surface Roughness Analysis
The surface roughness of restorative materials was analyzed with a 3D optical noncontact surface profiler (Contour GT Surface Roughness Tester, Bruker Daltonics GmbH, Bremen, Germany) based on noncontact scanning interferometry to evaluate the roughness of each surface at baseline, after the staining process, and after bleaching (Figure 1b).
2.7. Spectrophotometry Analysis
A spectrophotometer (Color-Eye® 7000A Spectrophotometer, Gretag Macbeth, 617, New Windsor, NY, USA) was employed to assess and quantify the color spectrophotometric (Figure 1e,f). The color was measured before the staining process at the baseline, and also after staining and then after bleaching. In this scheme, the color was measured in three coordinate dimensions of L* (lightness), a* green-red (−a = green; +a = red), and b∗ blue-yellow (−b = blue; +b = yellow). Using the following formula, ΔE values were calculated for the spectrophotometric analysis.
where ΔE is the calculated difference between the two colors.
ΔE* = √ (L2* − L1*)2 + (a2* − a1*)2 + (b2* − b1*)2
L* denotes a subtle difference between standard and sample color.
a* corresponds to the difference in redness or greyness color.
b* implies blueness-yellowness between the sample and standard color
2.8. Scanning Electron Microscopy (SEM) Analysis
The specimen teeth of each material were examined for surface morphology using an SEM (SEM; JEOL Ltd., Tokyo, Japan; FEI Inspect, Breda, The Netherlands). All of the thermally aged tooth samples were placed on specimen holders. For 90 s, these samples were exposed to a 40 mV gold sputter (Balzers SCD 050 Sputter Coater; Liechtenstein, Germany). Following their preparation, an SEM examination was carried out. Surface morphology and ocular examination were resolved through the application of characterizations. During the imaging procedure, detailed images were taken with up to 4000× magnification level (where the voltage was 20 kV).
2.9. Statistical Analysis
Data analysis was performed by using SPSS-22.0 (IBM product, Chicago, IL, USA). Numerical data based on measurements of surface roughness, micro-hardness, primary color parameters, and color change were presented as mean and standard deviation. These numeric variables were explored for the test of normality by using the Kolmogorov-Smirnov test within each material that revealed a normal distribution. Repeated measures of ANOVA were performed to compare surface roughness, microhardness, primary color parameters, and color change between the materials specific to the solution and post hoc Tukey’s test. Post hoc pairwise comparisons used Tukey’s HSD (honestly significant difference) test with 95% family-wise confidence intervals to control Type I error. For significant interactions (e.g., material × solution), simple effects analysis was performed. Paired t-tests compared timepoints within materials/solutions, with Bonferroni-adjusted α (0.0167 per test) for multiple comparisons. The significance threshold was p ≤ 0.05 for main effects and p ≤ 0.01 for interaction terms.
3. Results
3.1. Vicker’s Microhardness
Table 1 shows the mean and SD of microhardness at baseline, after staining, and after bleaching. No significant effect of solutions on microhardness was found within each group (Figure 2). Coffee was found to have a significant effect on Omnichroma and Charisma diamonds. Soda had a significant effect on Omnichroma and Filtek Z350 after the bleaching procedure, and it affected TPH spectra after staining and bleaching. Red wine affected Filtek Z350 (p < 0.018) and TPH spectra (p < 0.039).

Table 1.
Mean and standard deviation values for the microhardness analysis of all the composite resins.
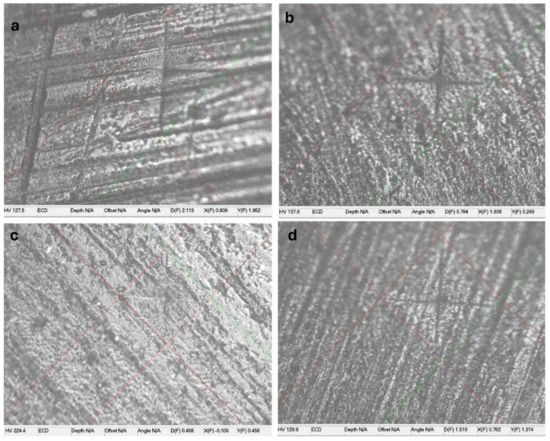
Figure 2.
The microhardness indentation for different composite restoratives materials. (a) Omnichroma; (b) Charisma; (c) Z350; (d) TPH.
3.2. Surface Roughness
Table 2 shows the mean and SD of surface roughness at baseline, after staining, and after bleaching. No significant effect of solutions on surface roughness within each group (Figure 3). Red wine had a significant effect on the Charisma diamond (p < 0.018) and Filtek Z350 (p < 0.039). TPH spectra were affected by all four media after the bleaching procedure.
Table 2.
Mean and standard deviation values for the surface roughness analysis of all the composite resins.
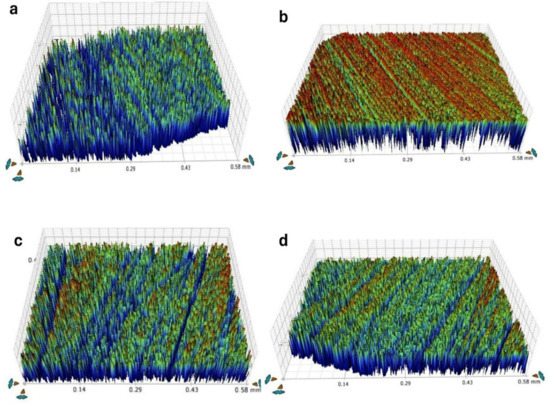
Figure 3.
The surface roughness of different composite restorative materials. (a) Omnichroma; (b) Charisma; (c) Z350; (d) TPH.
3.3. Spectrophotometry
Table 3 shows the color change (ΔE) values among different types of composite material and the change in color within the same type of composite after immersion in different media. Omnichroma (Tokuyama composite material) showed significant color changes after immersion in coffee followed by bleaching. In addition, Omnichroma showed significant color change after immersion in RW and a significant change after bleaching. Samples that were immersed in RW showed a significant color change among different immersion media within the Omnichroma, Tokuyama material. Moreover, Charisma (diamond, Kulzer composite material) showed a significant color change after immersion in RW only. Bleaching did not significantly affect the color of the Charisma composite material among all immersion solutions. However, the control group showed significant color stability when compared to different solutions with the same composite material. Filtek™ Z350 composite material showed a significant color change in the coffee-immersed group after immersion and after bleaching. The change in color after bleaching was significant with the same group and within the different solutions. Moreover, the RW group showed a significant color change after immersion. Finally, in the TPH (Spectra, Dentsply Sirona composite) group, there was a statistically significant color change in the coffee-immersed group after immersion and after bleaching.
Table 3.
Mean and standard deviation values for the spectrophotometric analysis of all the composite resins.
3.4. Scanning Electron Microscopy (SEM) Analysis
Photos of the composite were recorded based on the results of high-magnification SEM. The SEM images of the Omnichroma composite, followed by all the media, are shown in Figure 4a–d. The surface, followed by the coffee solution, exhibited a smooth appearance. No cracks, cleavage, or obvious irregular surfaces appeared (Figure 4a). Figure 4b shows the disc followed by the RW solution, which appeared without cracks or cleavage; however, some pits appeared on the surface. The soda solution affected the disc surface more than the above-mentioned two media (Figure 4c), where the surface was rougher, and some obvious pits were also observed. Nonetheless, the D/W affected the surface the most, as it was very rough in appearance, having an irregular pattern of surface finish (Figure 4d).
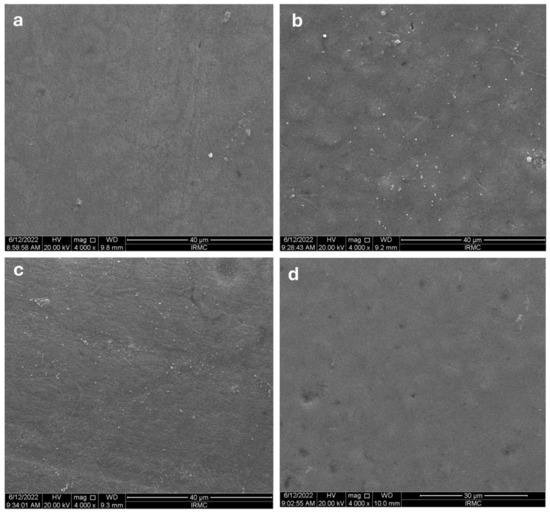
Figure 4.
The SEM images for Omnichroma’s images after immersing them in different media: (a) coffee, (b) red wine, (c) soda, (d) distilled water.
The SEM images of the Charisma composite, followed by all the media, are shown in Figure 5a–d. The appearance of Charisma showed rough surfaces for all the immersive media. Followed by the solution, the appearance of the material showed an irregular flaky appearance without any cracks (Figure 5a). Figure 5b shows the disc followed by the RW solution, which showed an irregular surface with some cracks appearing; however, no cleavage appeared. The most affected surface appeared was of that immersed in the soda solution of the disc surface, with some pit formation; however, no sign of cleavage appeared (Figure 5c). On the other hand, the D/W-affected surface showed a rough surface with some pits appearing without any cleavage formation (Figure 5d).
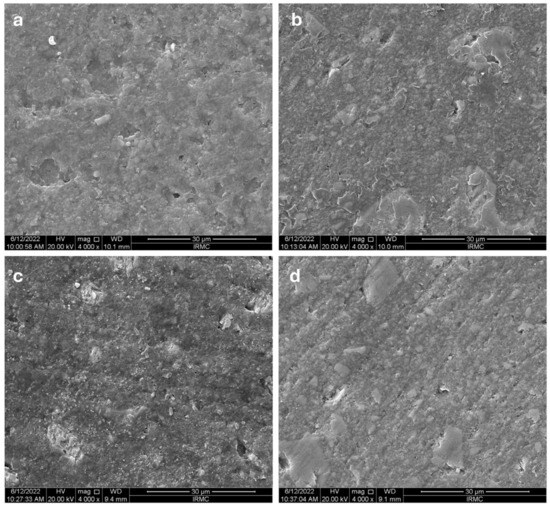
Figure 5.
The SEM images for Charisma’s images after immersing them in different media: (a) coffee, (b) red wine, (c) soda, (d) distilled water.
The SEM images of Z-350’s composite, followed by all the media, are shown in Figure 6a–d. The surface of Z-350 composite resin exposed to the coffee solution exhibited an irregular texture with some minor pitting but without any evidence of cleavage formation (Figure 6a). In contrast, the RW solution resulted in a smoother surface with minimal pit formation, as illustrated in Figure 6b. The soda solution caused the most pronounced surface alterations, including heavy pitting along with irregularities, yet no cleavage was observed, as shown in Figure 6c. Conversely, the surface exposed to D/W displayed only minor irregularities with no signs of cracks or cleavage formation (Figure 6d).
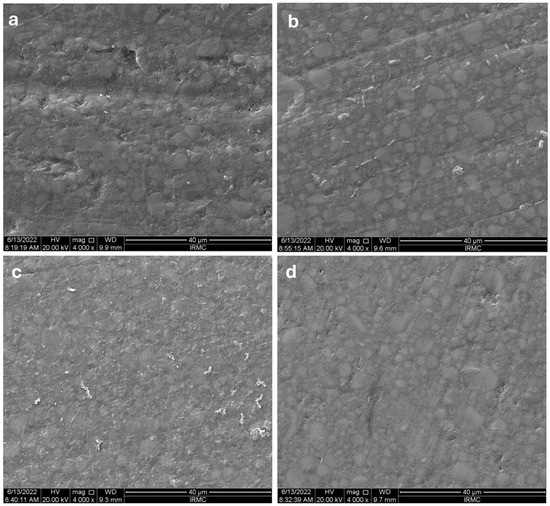
Figure 6.
The SEM images for Z-350’s images after immersing them in different media: (a) coffee, (b) red wine, (c) soda, (d) distilled water.
The SEM images of TPH’s composite, followed by all the media, are shown in Figure 7a–d. The surface of the TPH composite exposed to the coffee solution exhibited a relatively smoother texture with minor irregularities and no evidence of crack formation. As shown in Figure 7b, the RW solution resulted in an irregular surface, though no cleavage formation was observed. The most significant surface alterations were seen with the soda solution, which produced a noticeably rough surface with numerous small pits, voids, and irregularities, as illustrated in Figure 7c. Conversely, the surface affected by D/W appeared smoother than the other groups, with fewer visible scratches (Figure 7d).
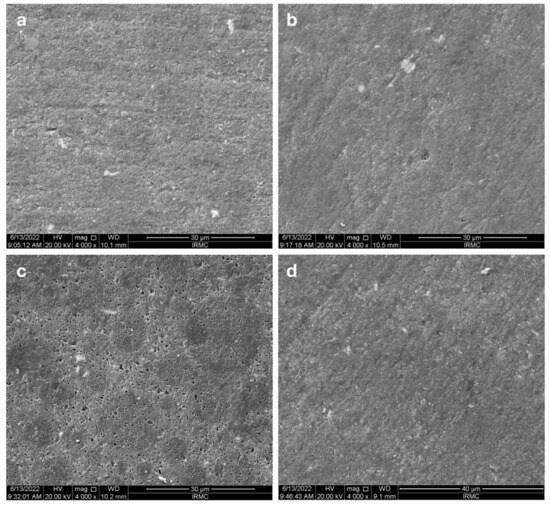
Figure 7.
The SEM images for TPH’s images after immersing in different media: (a) coffee, (b) red wine, (c) soda, (d) distilled water.
The SEM images of Omnichroma composite were followed by all the media, and afterwards were bleached with Opalescence Whitening 10% (Figure 8a,b) and Opalescence Boost PF 40% (Figure 8c,d). Figure 8a shows a coffee sample that underwent the revised bleaching treatment, which showed minor irregularities and slightly visible etching, while Figure 8b shows the soda sample, which also underwent the same bleaching treatment, showing a noticeable roughness and minor pitting and fine grooves compared to the coffee sample. Figure 8c,d, RW, and D/W samples receptively also bleached with the agent. Both showed rough surfaces with irrigation, and Figure 8d shows severely etched surfaces.
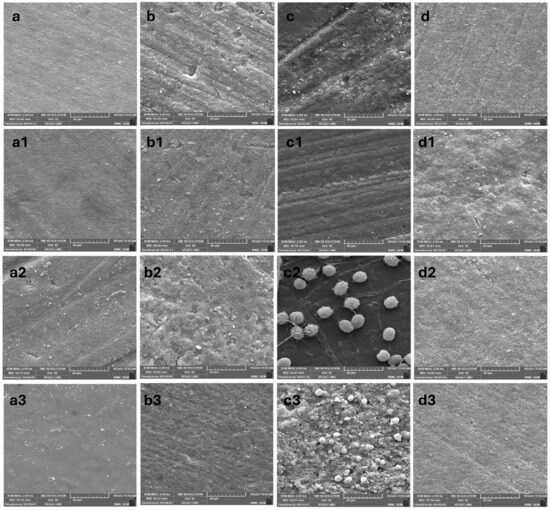
Figure 8.
SEM images of composite disc samples immersed in all the media. (a–d) Omnichroma composite after immersion in different media and subsequent in-office bleaching treatments: (a) coffee, (b) soda, (c) red wine, and (d) distilled water. (a1–d1) Charisma composite after immersion in different media and subsequent in-office bleaching treatments: (a1) coffee, (b1) soda, (c1) red wine, and (d1) distilled water. (a2–d2) Z-350 composite after immersion in different media and subsequent in-office bleaching treatments: (a2) coffee, (b2) soda, (c2) red wine, and (d2) distilled water. (a3–d3) TPH composite after immersion in different media and subsequent in-office bleaching treatments: (a3) coffee, (b3) soda, (c3) red wine, and (d3) distilled water.
The SEM images of the Charisma composite after immersion in different media and exposure to various concentrations of bleaching materials are shown in Figure 8(a1–d1). The appearance of Charisma showed rough surfaces across all the bleached samples. As shown in Figure 8(a1), the coffee sample that received in-office bleaching exhibited clear, visible grooves and irregularities, likely indicative of significant surface erosion. As shown in Figure 8(b1), the soda sample with the same bleaching treatment also showed roughness, though slightly less pronounced than the coffee disc, with visible pits and microstructural disruptions. Figure 8(c1) displays a disc immersed in RW and bleached, where the SEM showed a rough surface with irregularities, pits, and partial exposure of filler particles. On the other hand, the D/W sample that received the bleaching treatment appeared relatively smooth compared to all other samples, with minimal pitting and filler exposure (Figure 8(d1)).
The SEM images of Filtek™ Z350 composite after immersion in coffee and soda, respectively, and after being bleached with Opalescence Boost PF 40%, are shown in Figure 8(a2,b2). Figure 8(a2) shows the coffee disc sample exhibiting an eroded rough surface with visible undulations and voids, with possible filler exposure. In contrast, the bleached soda sample appeared smoother than the coffee sample, with fewer irregularities and a more uniform texture (Figure 8(b2)). The SEM images of bleached composite samples followed by RW and D/W are presented in Figure 8(c2) and 8(d2), respectively. The samples followed by RW samples were not affected much by the bleaching agent and were comparatively smoother in appearance; however, the D/W-immersed samples appeared with visible and generalized pits with irregular surface appearance.
The SEM images of TPH’s composite after immersion in different media and bleaching with Opalescence Boost PF 40% are shown in Figure 8(a3–d3). Figure 8(a3) shows a bleached coffee sample with slight irregularities and minor roughness, exhibiting subtle pits or fine texture. Figure 8(b3) shows a sample immersed in RW and bleached, with more pronounced textural disruptions, visible pits, cracks, and areas of unevenness. Figure 8(c3) shows a soda disc exposed to the bleaching material, exhibiting pronounced roughness and visible pits. Similarly, the bleached D/W sample Figure 8(d3) showed significant roughness and unevenness, displaying the most pronounced irregularities among the groups.
4. Discussion
Tooth whitening has gained a lot of popularity. Because of its extensive use, it is necessary to consider how this technique may affect the aesthetic appearance of resin composites that may be present in teeth. Specifically, the acidic component of bleaching chemicals can cause chemical changes in the organic matrix of resin composites. This could subsequently make it more difficult for resin composite restorations to match the surrounding tooth structure in terms of color, which would justify replacing them [29,38]. This study examined the effects of bleaching and staining on the color, roughness, and surface microhardness of different composite resins.
During the bleaching procedure, the anterior restoration is exposed to the bleaching gel, and it might alter the surface characteristics of resin composite restoration [7]. Composite restoration inside the oral cavity is exposed to many types of stains that might change the color of the restoration [10,11]. So, to get an excellent aesthetic look, the composite should maintain its original color and not have the susceptibility to be stained [10].
Surface hardness is one of the restorative material’s most significant physical features [17]. Surface microhardness is the ability of a substance to resist being penetrated or identified [17]. Contradictory findings have been reported by several studies that examined how bleaching agents affected the microhardness of resin-based restorative materials. In this present study, there was no significant effect of solutions on microhardness within each group. Omnichroma and Charisma diamonds were affected significantly by coffee, which decreased their hardness. Soda caused a decrease in the microhardness of Omnichroma and Filtek Z350. Moreover, RW caused a decrease in the microhardness of Filtek Z350 and TPH spectra. In one study, the microhardness of the composite materials was unaffected by the bleaching agent [18]. On the other hand, when compared to the micro-hybrid type, a bleaching agent negatively affected the microhardness of resin-based composite materials that were nanofilled and hybrid [17]. Moreover Mohammadi et al. reported that both 15% carbamide peroxide and 40% hydrogen peroxide produced significant reductions in Vickers microhardness, approximately 15% and 25% loss, respectively, in a microhybrid composite, yet extending light-curing from 40 s to 60 s recovered about 40% of that hardness loss, suggesting that enhanced polymer conversion can substantially mitigate bleaching-related softening [39]. Another study showed that bleaching agents can affect the microhardness and color of composite restoration [21]. Also, the composite restoration was darker as a result of being immersed either in RW or coffee, regardless of the bleaching agent [21].
In this present study, there was no significant effect of solutions on surface roughness within each group. RW had a significant effect on the Charisma diamond (p < 0.018) and Filtek Z350 (p < 0.039). TPH spectra were affected by coffee, RW, soda, and D/W after the bleaching procedure, which caused an increase in the surface roughness of these samples. A study by de Andrade et al. (2011) [20] showed that there is a significant difference between the two bleaching agents. The 35% hydrogen peroxide caused a higher roughness than the other group, which was bleached with 10% carbamide peroxide. Moreover, no significance was found of bleaching on the immersion solution [20]. Hafez et al.’s environmental SEM analysis showed that bleaching elevated the surface roughness of both Durafil VS and TPH3 composites by roughly 20–30%, with the most pronounced Ra increases occurring in specimens of shade A2 treated with LumaWhite-Plus and Opalescence Boost; these two agents drove roughness gains approaching the upper end of that range, whereas other shades and bleaching systems exhibited more moderate surface alterations [40].
In this present study, Omnichroma was significantly stained by RW among the other immersion solutions, similarly to the Charisma diamond, but it was not significantly affected by bleaching. Moreover, Filtek Z350 composite material showed a significant color change in the coffee-immersed group after immersion and after bleaching. A study conducted by de Andrade et al. (2011) showed that RW caused significantly more color change than coffee [20].
Furthermore, Malekipour et al. similarly observed that Z100 microhybrid specimens subjected to daily 3 h immersions in tea and coffee for 14 days exhibited ΔE values surpassing 3.7, whereas those stored in distilled water under the same protocol remained below ΔE = 1.5, indicating that both filler particle size and the BIS-GMA/TEGDMA resin matrix markedly influence stain uptake [41]. Also, Pruthi et al. further demonstrated that application of 15% carbamide peroxide reduced the ΔE of stained Filtek Z350XT and Esthet-X specimens to below 3.3, whereas the Ormocer-based Admira material showed only a negligible ΔE change (~0.2); SEM images also revealed that Esthet-X developed the most pronounced surface irregularities post-bleach, followed by Admira and then Z350XT, underscoring material-specific vulnerability to peroxide-induced topographical alterations [42]. Finally, ElSayad et al. compared polished versus unpolished nano-composite and giomer discs after coffee staining and 40% hydrogen peroxide bleaching, finding that polished samples retained significantly greater translucency and exhibited lower post-treatment ΔE (p < 0.05), which emphasizes the critical role of fine-grit finishing in preserving composite optical properties under combined staining and bleaching challenges [43].
5. Conclusions
Within the constraints of this in vitro investigation, the evaluated composites’ surface characteristics and color stability were greatly impacted by the staining chemicals and bleaching techniques that were investigated. Interestingly, red wine (RW) significantly increased the surface roughness of Filtek™ Z350 XT. This is probably because of its high tannin content and low pH (~3.5), which can break down the resin matrix and reveal filler particles [44]. Additionally, RW caused a significant hue shift (ΔE > 3.3) in Omnichroma, which is in line with earlier research that attributes these changes to anthocyanin adsorption into the polymer network of the composite [45].
Due to its acidic nature (pH ~ 5) and organic pigments (such melanoidins), which speed up hydrolytic degradation at the resin–filler interface, coffee considerably improved Omnichroma’s surface roughness [46]. In TPH spectra, coffee also produced a color shift that was clinically undesirable (ΔE > 5.5), supporting the idea that microhybrid composites with a higher resin content are more prone to pigment absorption [47].
According to [48], the combination of phosphoric acid erosion and chromogen penetration caused soda (pH ~ 2.5) to worsen TPH spectra’s roughness and color instability. Since extended acid exposure weakens the Bis-GMA/TEGDMA matrix, the low pH caused by carbonation may also account for the observed microhardness drop in FiltekTM Z350 XT across all media after bleaching [49].
The microhardness of FiltekTM Z350 XT was further weakened by the bleaching process, which was probably based on hydrogen peroxide. This is consistent with findings that nanofilled composites are attacked by oxidative radicals, which results in polymer chain scission [50]. This effect was consistent across all media, indicating that the chemical effects of bleaching have a greater effect on hardness reduction than environmental interactions.
6. Future Recommendations
Notwithstanding considerable progress in dental composite materials, obstacles persist in guaranteeing long-term deterioration resistance in clinical settings, including bleaching and extended fluid exposure. Future research should concentrate on creating composites with improved chemical stability via innovative monomer systems, perhaps minimizing hydrolytic breakdown. Furthermore, adding cutting-edge nanofillers may lessen water sorption and increase mechanical durability. By reducing secondary caries and microcrack propagation, smart composites with self-repairing or pH-responsive remineralization qualities may further increase service life.
Author Contributions
Formal analysis, S.Z.A., S.A.-Q., H.A.-M., and N.H.A.-Q.; methodology, S.Z.A., S.A.-Q., H.A.-M., M.A.-Q., and A.A.; investigation, S.Z.A., H.A.-M., M.A.-Q., S.A., and A.A.; data curation, S.Z.A., S.A.-Q., M.A.-Q., A.A., S.A., and N.H.A.-Q.; roles/writing—original draft, S.Z.A., S.A.-Q., and A.A.; conceptualization, S.A.-Q.; supervision, S.Z.A.; project administration, S.Z.A.; validation, S.Z.A.; visualization, S.Z.A.; writing—review and editing, S.Z.A., S.A.-Q., S.A., and N.H.A.-Q. All authors have read and agreed to the published version of the manuscript.
Funding
This research received no external funding.
Institutional Review Board Statement
Since the study was conducted on composite resin material discs, following all the rules and regulations set forth by the regional human subjects’ oversight committee and the IAU-ethical committee, no ethical approval was mandatory for this research work.
Data Availability Statement
Data are already available in the manuscript, and there is nothing to share separately.
Acknowledgments
The authors would like to acknowledge Intisar Ahmad Siddiqi and Faraz Ahmed Farooqi (College of Dentistry, Imam Abdulrahman Bin Faisal University, Dammam, Saudi Arabia) for statistical analysis.
Conflicts of Interest
There are no conflicts of interest from any of the authors.
Abbreviations
The following abbreviations are used in this manuscript:
| ROS | Reactive oxygen species |
| RW | Red wine |
| D/W | Distilled water |
| SD | Standard deviation |
| VHN | Vickers microhardness |
| SEM | Scanning electron microscopy |
References
- Antonucci, J.M.; Dickens, S.H.; Fowler, B.O.; Xu, H.H.; McDonough, W.G. Chemistry of silanes: Interfaces in dental polymers and composites. J. Res. Natl. Inst. Stand. Technol. 2005, 110, 541. [Google Scholar] [CrossRef] [PubMed]
- Ferracane, J.L. Resin composite—State of the art. Dent. Mater. 2011, 27, 29–38. [Google Scholar] [CrossRef] [PubMed]
- Ilie, N.; Hickel, R. Resin composite restorative materials. Aust. Dent. J. 2011, 56, 59–66. [Google Scholar] [CrossRef]
- Khvostenko, D.; Hilton, T.; Ferracane, J.; Mitchell, J.; Kruzic, J. Bioactive glass fillers reduce bacterial penetration into marginal gaps for composite restorations. Dent. Mater. 2016, 32, 73–81. [Google Scholar] [CrossRef]
- Althaqafi, K.A.; Satterthwaite, J.; Silikas, N. A review and current state of autonomic self-healing microcapsules-based dental resin composites. Dent. Mater. 2020, 36, 329–342. [Google Scholar] [CrossRef]
- Size, P.M. Share & Trends Analysis Report by Product (PE, PP, PU, PVC, PET, Polystyrene, ABS, PBT, PPO, Epoxy Polymers, LCP, PC, Polyamide). Appl. End Use Segm. Forecast. 2022, 2030, 31. [Google Scholar]
- Celik, C.; Yüzügüllü, B.; Erkut, S.; Yazici, A.R. Effect of bleaching on staining susceptibility of resin composite restorative materials. J. Esthet. Restor. Dent. 2009, 21, 407–414. [Google Scholar] [CrossRef]
- PILLAY, S.R.; SUGUMARAN, S.; VARGHESE, R. Preference And Frequency Of Commonly Performed Bleaching Techniques. Int. J. Pharm. Res. 09752366 2020, 17, 2125. [Google Scholar] [CrossRef]
- Dal Picolo, M.Z. Uso de LED Voleta Associado ao Peróxido de Hidrogênio 35% No Clareamento Dental: Relato de Caso. [sn]. 2021. Available online: https://repositorio.unicamp.br/acervo/detalhe/1235941 (accessed on 4 October 2021).
- Bagheri, R.; Burrow, M.; Tyas, M. Influence of food-simulating solutions and surface finish on susceptibility to staining of aesthetic restorative materials. J. Dent. 2005, 33, 389–398. [Google Scholar] [CrossRef]
- Yew, H.; Berekally, T.; Richards, L. A laboratory investigation of colour changes in two contemporary resin composites on exposure to spices. Aust. Dent. J. 2013, 58, 468–477. [Google Scholar] [CrossRef]
- Yu, H.; Zhang, C.-y.; Wang, Y.-n.; Cheng, H. Hydrogen peroxide bleaching induces changes in the physical properties of dental restorative materials: Effects of study protocols. J. Esthet. Restor. Dent. 2018, 30, E52–E60. [Google Scholar] [CrossRef] [PubMed]
- Pecho, O.E.; Martos, J.; Pinto, K.V.; Pinto, K.V.; Baldissera, R.A. Effect of hydrogen peroxide on color and whiteness of resin-based composites. J. Esthet. Restor. Dent. 2019, 31, 132–139. [Google Scholar] [CrossRef] [PubMed]
- Cengiz, E.; Kurtulmus-Yilmaz, S.; Ulusoy, N.; Deniz, S.T.; Yuksel-Devrim, E. The effect of home bleaching agents on the surface roughness of five different composite resins: A SEM evaluation. Scanning 2016, 38, 277–283. [Google Scholar] [CrossRef]
- Turker, Ş.B.; Biskin, T. Effect of three bleaching agents on the surface properties of three different esthetic restorative materials. J. Prosthet. Dent. 2003, 89, 466–473. [Google Scholar] [CrossRef]
- Sever, E.K.; Simenc, N.; Rakic, M.; Skenderovic, H.; Sever, I.; Tarle, Z. Effects of bleaching agent on physical and aesthetic properties of restorative materials. Dent. Mater. J. 2016, 35, 788–795. [Google Scholar] [CrossRef]
- AlQahtani, M. The effect of a 10% carbamide peroxide bleaching agent on the microhardness of four types of direct resin-based restorative materials. Oper. Dent. 2013, 38, 316–323. [Google Scholar] [CrossRef]
- Mujdeci, A.; Gokay, O. Effect of bleaching agents on the microhardness of tooth-colored restorative materials. J. Prosthet. Dent. 2006, 95, 286–289. [Google Scholar] [CrossRef]
- Plá Rizzolo Bueno, R.; Salomone, P.; Terezinha Pozzobon, R. Effect of bleaching agents on the fluorescence of composite resins. Eur. J. Esthet. Dent. 2013, 8, 582. [Google Scholar]
- de Andrade, I.C.G.B.; Basting, R.T.; Lima-Arsati, Y.B.d.O.; do Amaral, F.L.B.; Rodrigues, J.A.; França, F.M.G. Surface roughness evaluation and shade changes of a nanofilled resin composite after bleaching and immersion in staining solutions. Am. J. Dent. 2011, 24, 254–259. [Google Scholar]
- Yu, H.; Pan, X.; Lin, Y.; Li, Q.; Hussain, M.; Wang, Y. Effects of carbamide peroxide on the staining susceptibility of tooth-colored restorative materials. Oper. Dent. 2009, 34, 72–82. [Google Scholar] [CrossRef][Green Version]
- Fay, R.; Servos, T.; Powers, J. Color of restorative materials after staining and bleaching. Oper. Dent. 1999, 24, 292–296. [Google Scholar] [PubMed]
- Torres, C.; Ribeiro, C.; Bresciani, E.; Borges, A.B. Influence of hydrogen peroxide bleaching gels on color, opacity, and fluorescence of composite resins. Oper. Dent. 2012, 37, 526–531. [Google Scholar] [CrossRef]
- Saini, S.; Meena, A.; Yadav, R.; Patnaik, A. Investigation of physical, mechanical, thermal, and tribological characterization of tricalcium phosphate and zirconia particulate reinforced dental resin composite materials. Tribol. Int. 2023, 181, 108322. [Google Scholar] [CrossRef]
- Yap, A.; Wattanapayungkul, P. Effects of in-office tooth whiteners on hardness of tooth-colored restoratives. Oper. Dent. 2002, 27, 137–141. [Google Scholar]
- Attin, T.; Hannig, C.; Wiegand, A.; Attin, R. Effect of bleaching on restorative materials and restorations—A systematic review. Dent. Mater. 2004, 20, 852–861. [Google Scholar] [CrossRef]
- Polydorou, O.; Hellwig, E.; Auschill, T.M. The effect of different bleaching agents on the surface texture of restorative materials. Oper. Dent. 2006, 31, 473–480. [Google Scholar] [CrossRef]
- Mor, C.; Steinberg, D.; Dogan, H.; Rotstein, I. Bacterial adherence to bleached surfaces of composite resin in vitro. Oral Surg. Oral Med. Oral Pathol. Oral Radiol. Endodontology 1998, 86, 582–586. [Google Scholar] [CrossRef]
- Hannig, C.; Duong, S.; Becker, K.; Brunner, E.; Kahler, E.; Attin, T. Effect of bleaching on subsurface micro-hardness of composite and a polyacid modified composite. Dent. Mater. 2007, 23, 198–203. [Google Scholar] [CrossRef]
- Li, Y. Safety controversies in tooth bleaching. Dent. Clin. 2011, 55, 255–263. [Google Scholar] [CrossRef]
- Ahmed, S.Z.; Khan, A.S.; Aljeshi, N.M.; Md Sabri, B.A.; Akhtar, S.; Abu Hassan, M.I. A Comparative In Vitro Physicochemical Analysis of Resin Infiltrants Doped with Bioactive Glasses. Cureus 2024, 16, e64500. [Google Scholar] [CrossRef]
- Pegado, R.E.; do Amaral, F.L.; Flório, F.M.; Basting, R.T. Effect of different bonding strategies on adhesion to deep and superficial permanent dentin. Eur. J. Dent. 2010, 4, 110–117. [Google Scholar] [CrossRef] [PubMed]
- Harris, L.K.; Theriot, J.A. Surface Area to Volume Ratio: A Natural Variable for Bacterial Morphogenesis. Trends Microbiol. 2018, 26, 815–832. [Google Scholar] [CrossRef]
- Ahmed, S.Z.; Khan, A.S.; Nasser, W.W.; Alrushaid, M.A.; Alfaraj, Z.M.; Aljeshi, M.M.; Shah, A.T.; Sabri, B.A.M.; Akhtar, S.; Hassan, M.I.A. Physio-Mechanic and Microscopic Analyses of Bioactive Glass-Based Resin Infiltrants. Microsc. Res. Tech. 2025, 88, 595–610. [Google Scholar] [CrossRef]
- Okte, Z.; Villalta, P.; García-Godoy, F.; Lu, H.; Powers, J.M. Surface Hardness of Resin Composites After Staining and Bleaching. Oper. Dent. 2006, 31, 623–628. [Google Scholar] [CrossRef]
- Ozer, S.; Sen Tunc, E.; Tuloglu, N.; Bayrak, S. Solubility of two resin composites in different mouthrinses. BioMed Res. Int. 2014, 2014, 580675. [Google Scholar] [CrossRef]
- Fernandes, R.A.; Strazzi-Sahyon, H.B.; Suzuki, T.Y.U.; Briso, A.L.F.; Dos Santos, P.H. Effect of dental bleaching on the microhardness and surface roughness of sealed composite resins. Restor. Dent. Endod. 2020, 45, e12. [Google Scholar] [CrossRef]
- Miguel, L.C.; Baratieri, L.N.; Jr, S.M.; Ritter, A.V. In Situ Effect of 10% Carbamide Peroxide on Resin-Dentin Bond Strengths: A Novel Pilot Study. J. Esthet. Restor. Dent. 2004, 16, 235–241. [Google Scholar] [CrossRef]
- Mohammadi, N.; Alavi, F.N.; Rikhtehgaran, S.; Chaharom, M.E.E.; Salari, A.; Kimyai, S.; Bahari, M. Effect of Bleaching Method and Curing Time on the Surface Microhardness of Microhybrid Composite Resin. Maedica 2020, 15, 359–364. [Google Scholar] [CrossRef]
- Hafez, R.; Ahmed, D.; Yousry, M.; El-Badrawy, W.; El-Mowafy, O. Effect of in-office bleaching on color and surface roughness of composite restoratives. Eur. J. Dent. 2010, 4, 118–127. [Google Scholar] [CrossRef]
- Malekipour, M.R.; Sharafi, A.; Kazemi, S.; Khazaei, S.; Shirani, F. Comparison of color stability of a composite resin in different color media. Dent. Res. J. 2012, 9, 441–446. [Google Scholar] [CrossRef]
- Pruthi, G.; Jain, V.; Kandpal, H.C.; Mathur, V.P.; Shah, N. Effect of bleaching on color change and surface topography of composite restorations. Int. J. Dent. 2010, 2010, 695748. [Google Scholar] [CrossRef] [PubMed][Green Version]
- ElSayad, I.I. Color and translucency of finished and unfinished esthetic restorative materials after staining and bleaching. Saudi Dent. J. 2018, 30, 219–225. [Google Scholar] [CrossRef] [PubMed]
- Alshali, R.Z.; Salim, N.A.; Satterthwaite, J.D.; Silikas, N. Long-term sorption and solubility of bulk-fill and conventional resin-composites in water and artificial saliva. J. Dent. 2015, 43, 1511–1518. [Google Scholar] [CrossRef]
- Ersöz, B.; Karaoğlanoğlu, S.; Oktay, E.A.; Aydin, N. Resistance of single-shade composites to discoloration. Oper. Dent. 2022, 47, 686–692. [Google Scholar] [CrossRef]
- Hajdu, A.I.; Dumitrescu, R.; Balean, O.; Lalescu, D.V.; Buzatu, B.L.R.; Bolchis, V.; Floare, L.; Utu, D.; Jumanca, D.; Galuscan, A. Enhancing Esthetics in Direct Dental Resin Composite: Investigating Surface Roughness and Color Stability. J. Funct. Biomater. 2024, 15, 208. [Google Scholar] [CrossRef]
- de Almeida, L. Efeito de Resinas Modeladoras Sobre as Propriedades de Superfície de um Compósito Resinoso. Master’s Thesis, Universidade Estadual do Oeste do Paraná, Cascavel, Brazil, 2023. [Google Scholar]
- De Souza, G.M. Nanoparticles in restorative materials. In Nanotechnology in Endodontics: Current and Potential Clinical Applications; Springer: Cham, Switzerland, 2015; pp. 139–171. [Google Scholar]
- Gad, M.M.; Ali, M.S.; Al-Thobity, A.M.; Al-Dulaijan, Y.A.; El Zayat, M.; Emam, A.-N.M.; Akhtar, S.; Khan, S.Q.; Al-Harbi, F.A.; Fouda, S.M. Polymethylmethacrylate incorporating nanodiamonds for denture repair: in vitro study on the mechanical properties. Eur. J. Dent. 2022, 16, 286–295. [Google Scholar] [CrossRef]
- Scotti, C.K.; Velo, M.M.d.A.C.; Rizzante, F.A.P.; de Lima Nascimento, T.R.; Mondelli, R.F.L.; Bombonatti, J.F.S. Physical and surface properties of a 3D-printed composite resin for a digital workflow. J. Prosthet. Dent. 2020, 124, 614.e1–614.e5. [Google Scholar] [CrossRef]
Disclaimer/Publisher’s Note: The statements, opinions and data contained in all publications are solely those of the individual author(s) and contributor(s) and not of MDPI and/or the editor(s). MDPI and/or the editor(s) disclaim responsibility for any injury to people or property resulting from any ideas, methods, instructions or products referred to in the content. |
© 2025 by the authors. Licensee MDPI, Basel, Switzerland. This article is an open access article distributed under the terms and conditions of the Creative Commons Attribution (CC BY) license (https://creativecommons.org/licenses/by/4.0/).