

Minimally Invasive versus Conventional Approaches in Total Hip Arthroplasty: A Systematic Review and Meta-Analysis of 47 Randomized Controlled Trials


Abstract
1. Introduction
2. Materials and Methods
2.1. Data Sources and Search Strategies
2.2. Study Screening and Selection
2.3. Inclusion Criteria
- Only RCTs.
2.3.1. Types of Participants
- Human participants with hip disorders such as osteoarthritis, femoral neck fracture, dysplasia or avascular necrosis of the femoral head.
2.3.2. Types of Interventions
- MI THA or CA THA
2.3.3. Types of Outcome Measures
2.4. Exclusion Criteria
- Robotic assistance and computer navigation;
- Revision operation;
- Dual-mobility THA;
- Hemiarthroplasty;
- Comparison of MI and CA THA simultaneously in the same patients.
2.5. Data Extraction
2.6. Quality Assessment of RCTs
2.7. Missing Data
2.8. Measures of Treatment Effect
3. Results
3.1. Surgical Outcome
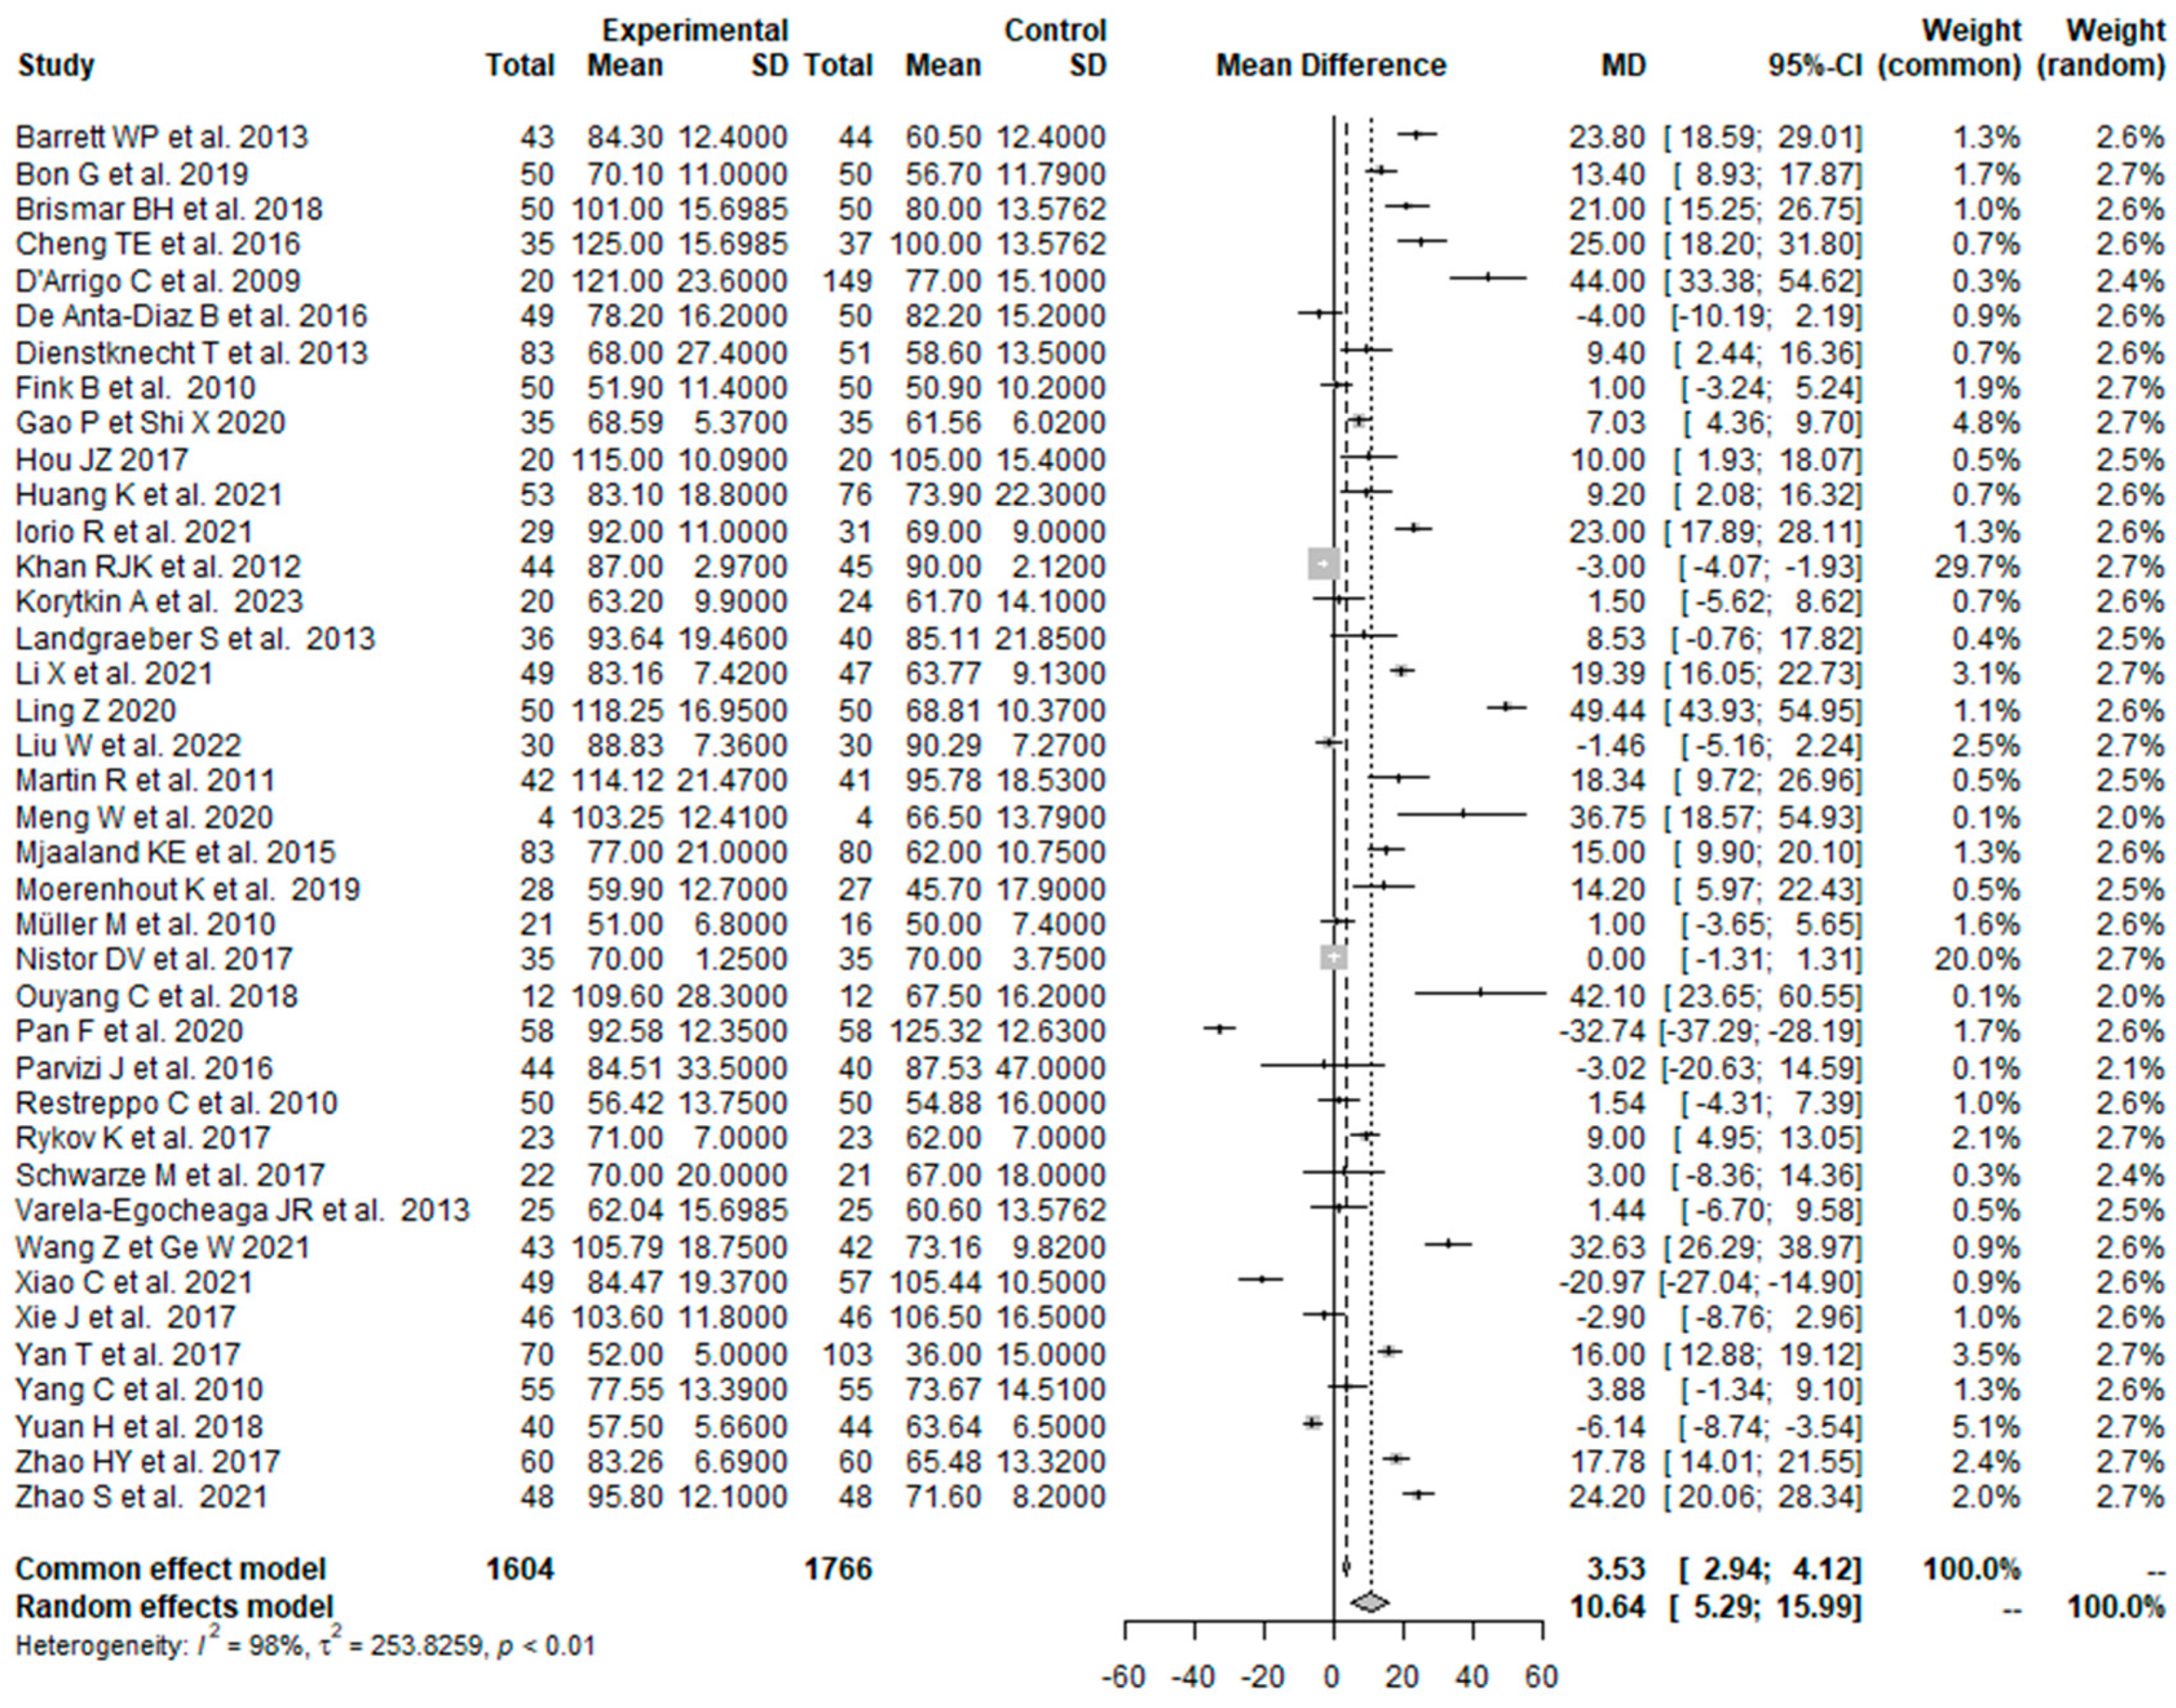
3.1.1. Operation Time: MI THA vs. CA THA
3.1.2. Incision Length: MI THA vs. CA THA
3.1.3. Intraoperative Blood Loss: MI THA vs. CA THA
3.1.4. Pain VAS 1 Day Postoperatively: MI THA vs. CA THA
3.1.5. Pain VAS 3 Days Postoperatively: MI THA vs. CA THA
3.2. Functional Outcome
3.2.1. HHS 0–1.5 Months Postoperatively: MI THA vs. CA THA
3.2.2. HHS 3 Months Postoperatively: MI THA vs. CA THA
3.2.3. HHS 6 Months Postoperatively: MI THA vs. CA THA
3.2.4. HHS ≥12 Months Postoperatively: MI THA vs. CA THA
3.3. Radiological Outcome
3.3.1. Acetabular Cup Anteversion Angle: MI THA vs. CA THA
3.3.2. Acetabular Cup Inclination Angle: MI THA vs. CA THA
3.4. Postoperative Complications
3.4.1. Overall Postoperative Complications: MI THA vs. CA THA
3.4.2. Dislocation: MI THA vs. CA THA
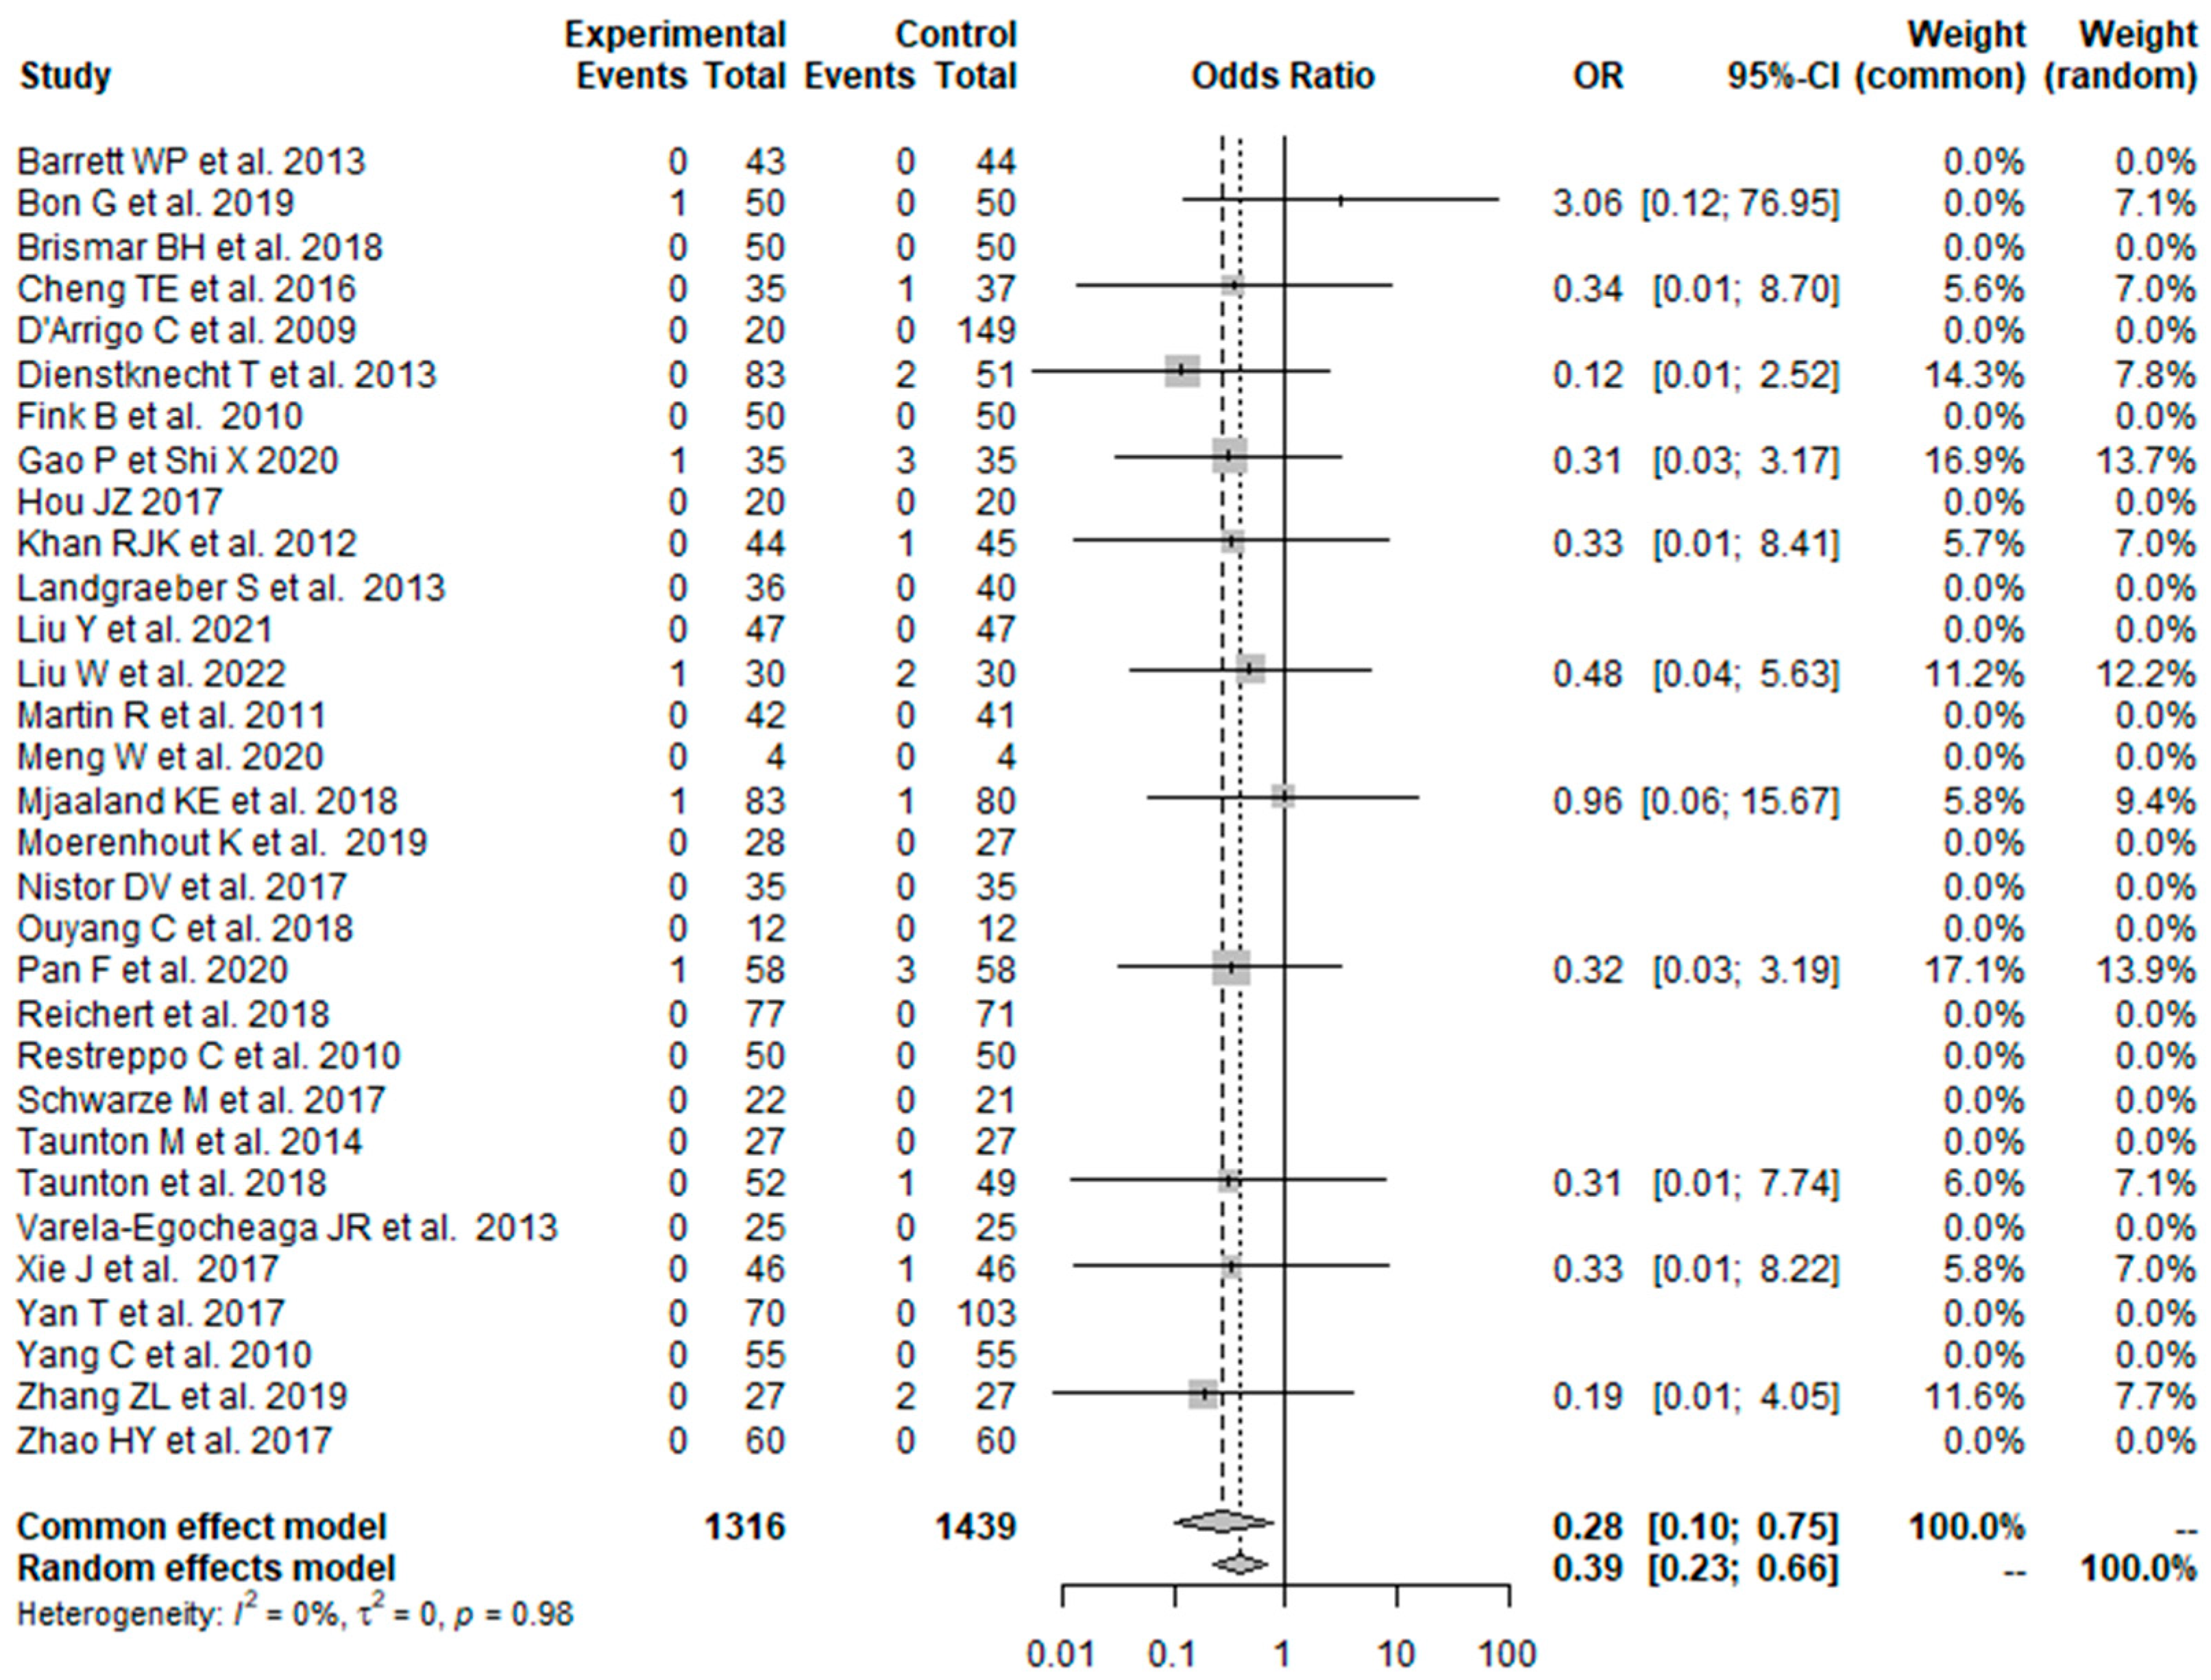
3.4.3. Infection: MI THA vs. CA THA
3.4.4. Periprosthetic Fracture: MI THA vs. CA THA
3.4.5. Deep Vein Thrombosis: MI THA vs. CA THA
3.4.6. Hematoma: MI THA vs. CA THA
3.5. Reoperation: MI THA vs. CA THA
4. Discussion
4.1. Surgical Outcomes
4.2. Functional Outcome
4.3. Radiological Outcome
4.4. Overall Postoperative Complications
5. Limitations
6. Conclusions
Supplementary Materials
Author Contributions
Funding
Institutional Review Board Statement
Informed Consent Statement
Data Availability Statement
Conflicts of Interest
Abbreviations
| CA | conventional approach |
| CI | confidence interval |
| CNKI | China National Knowledge Infrastructure |
| HHS | Harris Hip Score |
| ITT | intention to treat |
| MCID | minimal clinically important difference |
| MD | mean difference |
| OR | odds ratio |
| MI | minimally invasive |
| PP | per protocol |
| RCT | randomized controlled trials |
| THA | total hip arthroplasty |
References
- Moldovan, F.; Moldovan, L.; Bataga, T. A Comprehensive Research on the Prevalence and Evolution Trend of Orthopedic Surgeries in Romania. Healthcare 2023, 11, 1866. [Google Scholar] [CrossRef] [PubMed]
- Cameron, H.U. Mini-Incisions: Visualization is Key. Orthopedics 2002, 25, 473–498. [Google Scholar] [CrossRef] [PubMed]
- Teet, J.S.; Skinner, H.B.; Khoury, L. The Effect of the “Mini” Incision in Total Hip Arthroplasty on Component Position. J. Arthroplast. 2006, 21, 503–507. [Google Scholar] [CrossRef] [PubMed]
- Chimento, G.F.; Pavone, V.; Sharrock, N.; Kahn, B.; Cahill, J.; Sculco, T.P. Minimally Invasive Total Hip Arthroplasty: A Prospective Randomized Study. J. Arthroplast. 2005, 20, 139–144. [Google Scholar] [CrossRef]
- Cheng, T.; Feng, J.G.; Liu, T.; Zhang, X.L. Minimally invasive total hip arthroplasty: A systematic review. Int. Orthop. 2009, 33, 1473–1481. [Google Scholar] [CrossRef] [PubMed][Green Version]
- Shigemura, T.; Murata, Y.; Yamamoto, Y.; Shiratani, Y.; Hamano, H.; Wada, Y. Minimally invasive anterolateral approach versus lateral transmuscular approach for total hip arthroplasty: A systematic review and meta-analysis. Surgeon 2021, 20, e254–e261. [Google Scholar] [CrossRef]
- Clesham, K.; Sheridan, G.A.; Greidanus, N.V.; Masri, B.A.; Garbuz, D.S.; Duncan, C.P.; Howard, L.C. Minimally Invasive Intermuscular Approaches Versus Conventional Approaches in Total Hip Arthroplasty: A Systematic Review and Meta-Analysis. J. Arthroplast. 2022, 37, 1658–1666. [Google Scholar] [CrossRef]
- Vavken, P.; Kotz, R.; Dorotka, R. Der minimalinvasive Hüftersatzeine Metaanalyse [Minimally invasive hip replacement—A meta-analysis]. Z Orthop. Unfall. 2007, 145, 152–156. [Google Scholar] [CrossRef]
- Migliorini, F.; Biagini, M.; Rath, B.; Meisen, N.; Tingart, M.; Eschweiler, J. Total hip arthroplasty: Minimally invasive surgery or not? Meta-analysis of clinical trials. Int. Orthop. 2018, 43, 1573–1582. [Google Scholar] [CrossRef]
- Smith, T.O.; Blake, V.; Hing, C.B. Minimally invasive versus conventional exposure for total hip arthroplasty: A systematic review and meta-analysis of clinical and radiological outcomes. Int. Orthop. 2010, 35, 173–184. [Google Scholar] [CrossRef]
- Ramadanov, N. An Updated Meta-Analysis of Randomized Controlled Trials on Total Hip Arthroplasty through SuperPATH versus Conventional Approaches. Orthop. Surg. 2022, 14, 807–823. [Google Scholar] [CrossRef]
- Ramadanov, N.; Bueschges, S.; Liu, K.; Lazaru, P.; Marintschev, I. Direct anterior approach vs. SuperPATH vs. conventional approaches in total hip replacement: A network meta-analysis of randomized controlled trials. Orthop. Traumatol. Surg. Res. 2021, 107, 103058. [Google Scholar] [CrossRef]
- Page, M.J.; McKenzie, J.E.; Bossuyt, P.M.; Boutron, I.; Hoffmann, T.C.; Mulrow, C.D.; Shamseer, L.; Tetzlaff, J.M.; Akl, E.A.; Brennan, S.E.; et al. The PRISMA 2020 statement: An updated guideline for reporting systematic reviews. BMJ 2021, 372, 71. [Google Scholar] [CrossRef] [PubMed]
- Ramadanov, N.; Marinova-Kichikova, P.; Hable, R.; Dimitrov, D.; Becker, R. Comparison of Postoperative Serum Biomarkers after Total Hip Arthroplasty through Minimally Invasive versus Conventional Approaches: A Systematic Review and Meta-Analysis of Randomized Controlled Trials. Prosthesis 2023, 5, 694–710. [Google Scholar] [CrossRef]
- Gould, D.; Kelly, D.; Goldstone, L.; Gammon, J. Visual Analogue Scale. J. Clin. Nurs. 2001, 10, 697–706. [Google Scholar] [CrossRef]
- Harris, W.H. Traumatic Arthritis of the Hip after Dislocation and Acetabular Fractures: Treatment by mold arthroplasty. An end-result study using a new method of result evaluation. J. Bone Jt. Surg. 1969, 51, 737–755. [Google Scholar] [CrossRef]
- Sterne, J.A.C.; Savović, J.; Page, M.J.; Elbers, R.G.; Blencowe, N.S.; Boutron, I.; Cates, C.J.; Cheng, H.Y.; Corbett, M.S.; Eldridge, S.M.; et al. RoB 2: A revised tool for assessing risk of bias in randomised trials. BMJ 2019, 366, l4898. [Google Scholar] [CrossRef]
- Guyatt, G.H.; Oxman, A.D.; Vist, G.E.; Kunz, R.; Falck-Ytter, Y.; Alonso-Coello, P.; Schünemann, H.J.; GRADE Working Group. GRADE: An emerging consensus on rating quality of evidence and strength of recommendations. BMJ 2008, 336, 924–926. [Google Scholar] [CrossRef]
- Higgins, J.P.T.; Deeks, J.; Altman, D. Special topics in statistics. In Cochrane Handbook for Systematic Reviews of Interventions Version 5.1.0; Higgins, J.P.T., Green, S., Eds.; The Cochrane Collaboration: London, UK, 2011; Chapter 16; Available online: https://handbook-5-1.cochrane.org/chapter_16/16_1_3_1imputing_standard_deviations.htm (accessed on 15 September 2022).
- Higgins, J.P.T.; Thompson, S.G. Quantifying heterogeneity in a meta-analysis. Stat. Med. 2002, 21, 1539–1558. [Google Scholar] [CrossRef]
- Barrett, W.P.; Turner, S.E.; Leopold, J.P. Prospective Randomized Study of Direct Anterior vs Postero-Lateral Approach for Total Hip Arthroplasty. J. Arthroplast. 2013, 28, 1634–1638. [Google Scholar] [CrossRef]
- Bon, G.; Ben Kacem, E.; Lepretre, P.M.; Weissland, T.; Mertl, P.; Dehl, M.; Gabrion, A. Does the direct anterior approach allow earlier recovery of walking following total hip arthroplasty? A randomized prospective trial using accelerometry. Orthop. Traumatol. Surg. Res. 2019, 105, 445–452. [Google Scholar] [CrossRef]
- Brismar, B.H.; Hallert, O.; Tedhamre, A.; Lindgren, J.U. Early gain in pain reduction and hip function, but more complications following the direct anterior minimally invasive approach for total hip arthroplasty: A randomized trial of 100 patients with 5 years of follow up. Acta Orthop. 2018, 89, 484–489. [Google Scholar] [CrossRef] [PubMed]
- Cheng, T.E.; Wallis, J.A.; Taylor, N.F.; Holden, C.T.; Marks, P.; Smith, C.L.; Armstrong, M.S.; Singh, P.J. A Prospective Randomized Clinical Trial in Total Hip Arthroplasty—Comparing Early Results Between the Direct Anterior Approach and the Posterior Approach. J. Arthroplast. 2017, 32, 883–890. [Google Scholar] [CrossRef]
- D’arrigo, C.; Speranza, A.; Monaco, E.; Carcangiu, A.; Ferretti, A. Learning curve in tissue sparing total hip replacement: Comparison between different approaches. J. Orthop. Traumatol. 2009, 10, 47–54. [Google Scholar] [CrossRef] [PubMed]
- De Anta-Díaz, B.; Serralta-Gomis, J.; Lizaur-Utrilla, A.; Benavidez, E.; López-Prats, F.A. No differences between direct anterior and lateral approach for primary total hip arthroplasty related to muscle damage or functional outcome. Int. Orthop. 2016, 40, 2025–2030. [Google Scholar] [CrossRef]
- Dienstknecht, T.; Lüring, C.; Tingart, M.; Grifka, J.; Sendtner, E. A minimally invasive approach for total hip arthroplasty does not diminish early post-operative outcome in obese patients: A prospective, randomised trial. Int. Orthop. 2013, 37, 1013–1018. [Google Scholar] [CrossRef] [PubMed]
- Fink, B.; Mittelstaedt, A.; Schulz, M.S.; Sebena, P.; Singer, J. Comparison of a minimally invasive posterior approach and the standard posterior approach for total hip arthroplasty A prospective and comparative study. J. Orthop. Surg. Res. 2010, 5, 46. [Google Scholar] [CrossRef] [PubMed]
- Gao, P.; Shi, X. The effect of total hip replacement with minimally invasive SuperPATH approach in the treatment of femoral neck fractures in the elderly. Henan Med. Res. 2020, 29, 3715–3717. (In Chinese) [Google Scholar]
- Hou, J.Z.; Bao, H.; Cheng, Y. Early effect observation of total hip arthroplasty by using SuperPATH technique. J. Clin. Orthop. 2017, 20, 50–53. (In Chinese) [Google Scholar]
- Huang, K.; Xie, K.; Shi, Y.; Lu, X.; Chen, J.; Lu, L.; Liu, J.; Lu, M.; Pan, S.; Tang, Y. Analysis of early clinical efficacy of SuperPATH approach and lateral approach for initial total hip arthroplasty. Youjiang Med. J. 2021, 49, 646–651. (In Chinese) [Google Scholar] [CrossRef]
- Iorio, R.; Viglietta, E.; Mazza, D.; Iannotti, F.; Nicolosi, I.; Carrozzo, A.; Speranza, A.; Ferretti, A. Do serum markers correlate with invasiveness of the procedure in THA? A prospective randomized study comparing direct anterior and lateral approaches. Orthop. Traumatol. Surg. Res. 2021, 107, 102937. [Google Scholar] [CrossRef] [PubMed]
- Khan, R.J.K.; Maor, D.; Hofmann, M.; Haebich, S. A comparison of a less invasive piriformis-sparing approach versus the standard posterior approach to the hip: A randomised controlled trial. J. Bone Jt. Surg. Br. 2012, 94, 43–50. [Google Scholar] [CrossRef] [PubMed]
- Korytkin, A.A.; El Moudni, Y.M.; Novikova, Y.S.; Kovaldov, K.A.; Morozova, E.A. A prospective randomised comparison of earlier function after total hip arthroplasty with a mini posterior approach or supercapsular percutaneously-assisted total hip approach: A gait analysis study. HIP Int. 2023, 33, 169–177. [Google Scholar] [CrossRef]
- Landgraeber, S.; Quitmann, H.; Guth, S.; Haversath, M.; Kowalczyk, W.; Kecskeméthy, A.; Heep, H.; Jager, M. A prospective randomized peri- and post-operative comparison of the minimally invasive anterolateral approach versus the lateral approach. Orthop. Rev. 2013, 5, e19. [Google Scholar] [CrossRef][Green Version]
- Li, X.; Ma, L.; Wang, Q.; Rong, K. Comparison of total hip arthroplasty with minimally invasive SuperPath approach vs. conventional posterolateral approach in elderly patients: A one-year follow-up randomized controlled research. Asian J. Surg. 2020, 44, 531–536. (In Chinese) [Google Scholar] [CrossRef] [PubMed]
- Li, L. SuperPATH minimally invasive total hip replacement surgery treatment: Analysis of clinical efficacy of aseptic necrosis of femoral head. Chin. J. Mod. Drug Appl. 2020, 14, 84–86. (In Chinese) [Google Scholar] [CrossRef]
- Ling, Z.; Zhou, P.; Fu, Y. Analysis of the effect of total hip replacement via SuperPATH approach on the prognosis of elderly patients with femoral neck fracture. Chin. J. Front. Med. Sci. 2020, 12, 66–70. (In Chinese) [Google Scholar]
- Liu, Y.; Hu, P.; Zhu, J.; She, H.; Zhang, Y. Efficacy of minimally invasive total hip arthroplasty in the treatment of elderly femoral neck fractures. Prac. J. Med. Pharm. 2021, 38, 226–231. (In Chinese) [Google Scholar]
- Liu, W.; Liu, X.; Gao, H.; Wang, G.; Li, J. Comparison of the curative effect, pain degree, and hip joint function between SuperPATH hip replacement and total hip replacement. Mod. Chin. Doc. 2022, 60, 78–84. (In Chinese) [Google Scholar]
- Martin, R.; Clayson, P.E.; Troussel, S.; Fraser, B.P.; Docquier, P.-L. Anterolateral Minimally Invasive Total Hip Arthroplasty: A Prospective Randomized Controlled Study with a Follow-Up of 1 Year. J. Arthroplast. 2011, 26, 1362–1372. [Google Scholar] [CrossRef]
- Meng, W.; Huang, Z.; Wang, H.; Wang, D.; Luo, Z.; Bai, Y.; Gao, L.; Wang, G.; Zhou, Z. Supercapsular percutaneously-assisted total hip (SuperPath) versus posterolateral total hip arthroplasty in bilateral osteonecrosis of the femoral head: A pilot clinical trial. BMC Musculoskelet. Disord. 2019, 21, 2. [Google Scholar] [CrossRef] [PubMed]
- Mjaaland, K.E.; Kivle, K.; Svenningsen, S.; Pripp, A.H.; Nordsletten, L. Comparison of markers for muscle damage, inflammation, and pain using minimally invasive direct anterior versus direct lateral approach in total hip arthroplasty: A prospective, randomized, controlled trial. J. Orthop. Res. 2015, 33, 1305–1310. [Google Scholar] [CrossRef] [PubMed]
- Mjaaland, K.E.; Kivle, K.; Svenningsen, S.; Nordsletten, L. Do Postoperative Results Differ in a Randomized Trial Between a Direct Anterior and a Direct Lateral Approach in THA? Clin. Orthop. Relat. Res. 2019, 477, 145–155. [Google Scholar] [CrossRef] [PubMed]
- Moerenhout, K.; Derome, P.; Laflamme, G.Y.; Leduc, S.; Gaspard, H.S.; Benoit, B. Direct anterior versus posterior approach for total hip arthroplasty: A multicentre, prospective, randomized clinical trial. Can. J. Surg. 2020, 63, E412–E417. [Google Scholar] [CrossRef]
- Müller, M.; Tohtz, S.; Springer, I.; Dewey, M.; Perka, C. Randomized controlled trial of abductor muscle damage in relation to the surgical approach for primary total hip replacement: Minimally invasive anterolateral versus modified direct lateral approach. Arch. Orthop. Trauma Surg. 2011, 131, 179–189. [Google Scholar] [CrossRef]
- Nistor, D.-V.; Caterev, S.; Bolboacă, S.-D.; Cosma, D.; Lucaciu, D.O.G.; Todor, A. Transitioning to the direct anterior approach in total hip arthroplasty. Is it a true muscle sparing approach when performed by a low volume hip replacement surgeon? Int. Orthop. 2017, 41, 2245–2252. [Google Scholar] [CrossRef]
- Ouyang, C.; Wang, H.; Meng, W.; Luo, Z.; Wang, D.; Pei, F.; Zhou, Z. [Randomized controlled trial of comparison between the SuperPATH and posterolateral approaches in total hip arthroplasty]. Zhongguo Xiu Fu Chong Jian Wai Ke Za Zhi 2018, 32, 1500–1506. (In Chinese) [Google Scholar] [CrossRef]
- Pan, Y.; Zhang, J.; Yan, X.; Chang, X.; Li, J.; Tang, B. Comparison of SuperPATH and posterolateral total hip replacement. Orthop. J. China 2020, 28, 1176–1180. (In Chinese) [Google Scholar]
- Parvizi, J.; Restrepo, C.; Maltenfort, M.G. Total Hip Arthroplasty Performed Through Direct Anterior Approach Provides Superior Early Outcome: Results of a Randomized, Prospective Study. Orthop. Clin. N. Am. 2016, 47, 497–504. [Google Scholar] [CrossRef] [PubMed]
- Reichert, J.C.; von Rottkay, E.; Roth, F.; Renz, T.; Hausmann, J.; Kranz, J.; Rackwitz, L.; Nöth, U.; Rudert, M. A prospective randomized comparison of the minimally invasive direct anterior and the transgluteal approach for primary total hip arthroplasty. BMC Musculoskelet. Disord. 2018, 19, 241. [Google Scholar] [CrossRef]
- Ren, D.; Yang, G.; Zhao, H.; Zha, J.; Lu, S.; Xu, Y. Effect of SuperPath minimally invasive incision total hip arthroplasty on femoral head necrosis and the quality of life. J. Hebei Med. Univ. 2016, 37, 1416–1419. (In Chinese) [Google Scholar]
- Restrepo, C.; Parvizi, J.; Pour, A.E.; Hozack, W.J. Prospective Randomized Study of Two Surgical Approaches for Total Hip Arthroplasty. J. Arthroplast. 2010, 25, 671–679.e1. [Google Scholar] [CrossRef] [PubMed]
- Rykov, K.; Reininga, I.H.; Sietsma, M.S.; Knobben, B.A.; Have, B.L.T. Posterolateral vs Direct Anterior Approach in Total Hip Arthroplasty (POLADA Trial): A Randomized Controlled Trial to Assess Differences in Serum Markers. J. Arthroplast. 2017, 32, 3652–3658.e1. [Google Scholar] [CrossRef]
- Schwarze, M.; Budde, S.; von Lewinski, G.; Windhagen, H.; Keller, M.C.; Seehaus, F.; Hurschler, C.; Floerkemeier, T. No effect of conventional vs. minimally invasive surgical approach on clinical outcome and migration of a short stem total hip prosthesis at 2-year follow-up: A randomized controlled study. Clin. Biomech. 2018, 51, 105–112. [Google Scholar] [CrossRef] [PubMed]
- Taunton, M.J.; Mason, J.B.; Odum, S.M.; Springer, B.D. Direct Anterior Total Hip Arthroplasty Yields More Rapid Voluntary Cessation of All Walking Aids: A Prospective, Randomized Clinical Trial. J. Arthroplast. 2014, 29 (Suppl. S9), 169–172. [Google Scholar] [CrossRef]
- Taunton, M.J.; Trousdale, R.T.; Sierra, R.J.; Kaufman, K.; Pagnano, M.W. John Charnley Award: Randomized Clinical Trial of Direct Anterior and Miniposterior Approach THA: Which Provides Better Functional Recovery? Clin. Orthop. Relat. Res. 2018, 476, 216–229. [Google Scholar] [CrossRef]
- Varela-Egocheaga, J.R.; Suárez-Suárez, M.A.; Fernández-Villán, M.; González-Sastre, V.; Varela-Gómez, J.R.; Murcia-Mazón, A. Minimally invasive hip surgery: The approach did not make the difference. Eur. J. Orthop. Surg. Traumatol. 2013, 23, 47–52. [Google Scholar] [CrossRef]
- Wang, Z.; Ge, W. SuperPATH approach total hip replacement for elderly patients with femoral neck fracture: Impact of hip function. Clin. Med. 2021, 41, 27–29. (In Chinese) [Google Scholar] [CrossRef]
- Xiao, C.; Gao, Z.; Zhang, S.; Long, N.; Yao, K.; Cai, P.; He, F.; Liu, L.; Jiang, Y. Comparative prospective randomized study of minimally invasive transpiriformis approach versus conventional posterolateral approach in total hip arthroplasty as measured by biology markers. Int. Orthop. 2021, 45, 1707–1717. [Google Scholar] [CrossRef]
- Xie, J.; Zhang, H.; Wang, L.; Yao, X.; Pan, Z.; Jiang, Q. Comparison of supercapsular percutaneously assisted approach total hip versus conventional posterior approach for total hip arthroplasty: A prospective, randomized controlled trial. J. Orthop. Surg. Res. 2017, 12, 138. [Google Scholar] [CrossRef]
- Yan, T.; Tian, S.; Wang, Y.; Yang, X.; Li, T.; Liu, J.; Pan, P.; Wang, R.; Wang, D.; Sun, K. Comparison of early effectiveness between SuperPATH approach and Hardinge approach in total hip arthroplasty. Zhongguo Xiu Fu Chong Jian Wai Ke Za Zhi 2017, 31, 17–24. (In Chinese) [Google Scholar]
- Yang, C.; Zhu, Q.; Han, Y.; Zhu, J.; Wang, H.; Cong, R.; Zhang, D. Minimally-invasive total hip arthroplasty will improve early postoperative outcomes: A prospective, randomized, controlled trial. Ir. J. Med. Sci. 2010, 179, 285–290. [Google Scholar] [CrossRef]
- Yuan, H.; Zhu, J.; Sun, Z.; Zhang, Z. Comparison of effectiveness between SuperPATH approach and posterolateral approach in total hip arthroplasty. Zhongguo Xiu Fu Chong Jian Wai Ke Za Zhi 2018, 32, 14–19. (In Chinese) [Google Scholar]
- Zhang, Z.; Lin, J.; Xia, B. Clinical research on joint function and life quality through SuperPath approach in total hip arthroplasty. China J. Integrated. Trad. Chin. West. Med. 2019, 25, 709–714. (In Chinese) [Google Scholar]
- Zhao, H.-Y.; Kang, P.-D.; Xia, Y.-Y.; Shi, X.-J.; Nie, Y.; Pei, F.-X. Comparison of Early Functional Recovery After Total Hip Arthroplasty Using a Direct Anterior or Posterolateral Approach: A Randomized Controlled Trial. J. Arthroplast. 2017, 32, 3421–3428. [Google Scholar] [CrossRef]
- Zhao, S. Minimally invasive SuperPATH approach for hip replacement in elderly patients. Analysis of clinical efficacy in patients with bone neck fractures. Mod. Diagn. Treat. 2021, 32, 3593. (In Chinese) [Google Scholar]
- Krassnig, R.; Prager, W.; Wildburger, R.; Hohenberger, G.M. Direct anterior versus antero-lateral approach in hip joint hemiarthroplasty. Arch. Orthop. Trauma Surg. 2023, 143, 4141–4148. [Google Scholar] [CrossRef]
- Tang, Y.; Gu, M. The effect of direct anterior approach and minimally invasive SuperPath approach on THA in patients with traumatic femoral neck fracture. J. Clin. Surg. 2022, 30, 272–275. [Google Scholar]
- Yang, Z.; Feng, S.; Guo, K.-J.; Zha, G.-C. Patient-reported results of simultaneous direct anterior approach and posterolateral approach total hip arthroplasties performed in the same patients. J. Orthop. Traumatol. 2021, 22, 46. [Google Scholar] [CrossRef]
- Cantrell, W.A.; Samuel, L.T.; Sultan, A.A.; Acuña, A.J.; Kamath, A.F. Operative Times Have Remained Stable for Total Hip Arthroplasty for >15 Years: Systematic Review of 630,675 Procedures. JBJS Open Access 2019, 4, e0047. [Google Scholar] [CrossRef]
- Wills, B.; Sheppard, E.; Smith, W.; Staggers, J.; Li, P.; Shah, A.; Lee, S.; Naranje, S. Impact of operative time on early joint infection and deep vein thrombosis in primary total hip arthroplasty. Orthop. Traumatol. Surg. Res. 2018, 104, 445–448. [Google Scholar] [CrossRef] [PubMed]
- Surace, P.; Sultan, A.A.; George, J.; Samuel, L.T.; Khlopas, A.; Molloy, R.M.; Stearns, K.L.; Mont, M.A. The Association Between Operative Time and Short-Term Complications in Total Hip Arthroplasty: An Analysis of 89,802 Surgeries. J. Arthroplast. 2019, 34, 426–432. [Google Scholar] [CrossRef] [PubMed]
- Xu, C.-P.; Li, X.; Song, J.-Q.; Cui, Z.; Yu, B. Mini-Incision versus Standard Incision Total Hip Arthroplasty Regarding Surgical Outcomes: A Systematic Review and Meta-Analysis of Randomized Controlled Trials. PLoS ONE 2013, 8, e80021. [Google Scholar] [CrossRef]
- Liu, X.; Liu, J.; Sun, G. A comparison of combined intravenous and topical administration of tranexamic acid with intravenous tranexamic acid alone for blood loss reduction after total hip arthroplasty: A meta-analysis. Int. J. Surg. 2017, 41, 34–43. [Google Scholar] [CrossRef]
- Winkler, M.; Akça, O.; Birkenberg, B.; Hetz, H.; Scheck, T.; Arkiliç, C.F.; Kabon, B.; Marker, E.; Grübl, A.; Czepan, R.; et al. Aggressive Warming Reduces Blood Loss During Hip Arthroplasty. Anesth Analg. 2000, 91, 978–984. [Google Scholar] [CrossRef]
- Yuan, M.; Tao, Q.; Wang, D.; Wang, H.; Zhou, Z. Finding the optimal regimen for short-term daily recombinant human erythropoietin treatment for blood-saving purpose in patients undergoing unilateral primary total hip arthroplasty: A double-blinded randomized placebo-controlled trial. BMC Musculoskelet. Disord. 2022, 23, 243. [Google Scholar] [CrossRef] [PubMed]
- Danoff, J.R.; Goel, R.; Sutton, R.; Maltenfort, M.G.; Austin, M.S. How Much Pain Is Significant? Defining the Minimal Clinically Important Difference for the Visual Analog Scale for Pain After Total Joint Arthroplasty. J. Arthroplast. 2018, 33, S71–S75.e2. [Google Scholar] [CrossRef]
- Marques, E.M.; Jones, H.E.; Elvers, K.T.; Pyke, M.; Blom, A.W.; Beswick, A.D. Local anaesthetic infiltration for peri-operative pain control in total hip and knee replacement: Systematic review and meta-analyses of short- and long-term effectiveness. BMC Musculoskelet. Disord. 2014, 15, 220. [Google Scholar] [CrossRef] [PubMed]
- Nwachukwu, B.U.; Chang, B.; Rotter, B.-Z.; Kelly, B.T.; Ranawat, A.S.; Nawabi, D.H. Minimal Clinically Important Difference and Substantial Clinical Benefit After Revision Hip Arthroscopy. Arthroscopy 2018, 34, 1862–1868. [Google Scholar] [CrossRef]
- Lewinnek, G.E.; Lewis, J.L.; Tarr, R.; Compere, C.L.; Zimmerman, J.R. Dislocations after total hip-replacement arthroplasties. J. Bone Jt. Surg. Am. 1978, 60, 217–220. [Google Scholar] [CrossRef]


| RCT | Year of Publication, Origin | Patients, N | Hips, N | Sex, Male, N | Approach | THA with Bone Cement, N | Table/ Patient Position | Mean Age, Years, SD | Mean BMI, kg/m2, SD | Mean HHS Preoperatively, Points, SD | Osteoarthritis, N | Femoral Neck Fracture, N | Dysplasia, N | ANFH, N |
|---|---|---|---|---|---|---|---|---|---|---|---|---|---|---|
| Barrett WP et al. [21] | 2013, USA | 43 | 43 | 29 | MI DAA | 0 | TT | 61.4 ± 9.2 | 30.7 ± 5.4 | 57.6 ± 10.2 | 43 | 0 | 0 | 0 |
| 44 | 44 | 19 | CA PL | 0 | Lat | 63.2 ± 7.7 | 29.1 ± 5 | 55.1 ± 9.1 | 44 | 0 | 0 | 0 | ||
| Bon G et al. [22] | 2019, France | 50 | 50 | 21 | MI DAA | 7 | TT | 67.3 ± 10 | 26.5 ± 3.6 | 54 ± 15 | 50 | 0 | 0 | 0 |
| 50 | 50 | 23 | CA P | 7 | NR | 69 ± 7.9 | 26.7 ± 3.1 | 52.3 ± 13.1 | 50 | 0 | 0 | 0 | ||
| Brismar BH et al. [23] | 2018, Sweden | 50 | 50 | 18 | MI DAA | 0 | Supine | 66 ± 4 | 27 ± 1.3 | NR | 50 | 0 | 0 | 0 |
| 50 | 50 | 17 | CA L | 0 | Lat | 67 ± 4 | 27 ± 1.5 | NR | 50 | 0 | 0 | 0 | ||
| Cheng TE et al. [24] | 2016, Australia | 35 | 35 | 15 | MI DAA | NR | TT | 59 ± 3.8 | 27.7 ± 1.1 | NR | 35 | 0 | 0 | 0 |
| 37 | 37 | 18 | CA P | NR | Lat | 62.5 ± 3.5 | 28.3 ± 1.6 | NR | 37 | 0 | 0 | 0 | ||
| D’Arrigo C et al. [25] | 2009, Italy | 20 | 20 | 12 | MI DAA | 0 | NR | 64 ± 8 | 22.7 ± 1.5 | 37.7 ± 19 | 20 | 0 | 0 | 0 |
| 149 | 149 | 81 | CA L | 0 | NR | 65 ± 9.8 | 28 ± 1.8 | 39 ± 10.2 | 149 | 0 | 0 | 0 | ||
| De Anta-Diaz B et al. [26] | 2016, Spain | 49 | 49 | 26 | MI DAA | 8 | NR | 64.8 ± 10.1 | 26.6 ± 3.9 | 44.4 ± 13.6 | 49 | 0 | 0 | 0 |
| 50 | 50 | 26 | CA L | 6 | NR | 63.5 ± 12.5 | 26.9 ± 3.1 | 42.9 ± 15.2 | 50 | 0 | 0 | 0 | ||
| Dienstknecht T et al. [27] * | 2013, Germany | 42 | 42 | 14 | MI MH | 2 | Lat | 61 ± 13 | 26.1 ± 3 | 48 ± 15 | 42 | 0 | 0 | 0 |
| 36 | 36 | 12 | CA L | 1 | NR | 62 ± 13 | 24.3 ± 3.6 | 46 ± 16 | 36 | 0 | 0 | 0 | ||
| 41 | 41 | 24 | MI MH | 3 | Lat | 61 ± 11 | 34.3 ± 4.4 | 44 ± 15 | 41 | 0 | 0 | 0 | ||
| 15 | 15 | 10 | CA L | 0 | NR | 61 ± 10 | 34.6 ± 4.1 | 46 ± 16 | 15 | 0 | 0 | 0 | ||
| Fink B et al. [28] | 2010, Germany | 50 | 50 | 25 | MI P | 50 | NR | 71.9 ± 6.1 | 27 ± 4.8 | NR | 44 | 0 | 1 | 5 |
| 50 | 50 | 23 | CA PL | 50 | NR | 71.5 ± 5.6 | 28 ± 3.8 | NR | 44 | 0 | 1 | 5 | ||
| Gao P et Shi X [29] | 2020, China | 35 | 35 | 23 | MI S | NR | Lat | 69.3 ± 3.3 | 23.1 ± 2.6 | 15.4 ± 2.9 | 0 | 35 | 0 | 0 |
| 35 | 35 | 20 | CA P | NR | Lat | 68.8 ± 3.5 | 23.2 ± 2.4 | 15.7 ± 2.7 | 0 | 35 | 0 | 0 | ||
| Hou JZ et al. [30] | 2017, China | 20 | 20 | 13 | MI S | NR | Lat | 54.3 ± 13.7 | 24.5 ± 3.6 | 33.8 ± 5.4 | 6 | 0 | 0 | 14 |
| 20 | 20 | 12 | CA | NR | Lat | 53.8 ± 12.9 | 23.9 ± 4.1 | 31.9 ± 6.1 | 5 | 0 | 0 | 15 | ||
| Huang K et al. [31] ** | 2021, China | 37 | 37 | 31 | MI S | NR | Lat | 56.2 ± 11.5 | NR | 47.3 ± 6.1 | 0 | 0 | 0 | 37 |
| 58 | 58 | 50 | CA L | NR | Lat | 53 ± 10.4 | NR | 45.7 ± 8.1 | 0 | 0 | 0 | 58 | ||
| 16 | 16 | 2 | MI S | NR | Lat | 78.1 ± 7.8 | NR | 40.6 ± 11.5 | 0 | 16 | 0 | 0 | ||
| 18 | 18 | 8 | CA L | NR | Lat | 77.7 ± 10.1 | NR | 40.9 ± 11.6 | 0 | 18 | 0 | 0 | ||
| Iorio R et al. [32] | 2021, Italy | 29 | 29 | 14 | MI DAA | 0 | Supine | 62.7 ± 4.9 | 28.7 ± 3.4 | 49.2 ± 9.0 | 29 | 0 | 0 | 0 |
| 31 | 31 | 14 | CA L | 0 | Lat | 67.2 ± 8.8 | 29.9 ± 3.1 | 46.4 ± 12.6 | 31 | 0 | 0 | 0 | ||
| Khan RJK et al. [33] | 2012, Australia | 44 | 44 | 24 | MI P | 44 | Lat | 72.3 ± 1 | 28.5 ± 0.7 | NR | 42 | 0 | 0 | 2 |
| 45 | 45 | 19 | CA P | 45 | Lat | 72.8 ± 1.1 | 28.9 ± 0.6 | NR | 43 | 0 | 0 | 2 | ||
| Korytkin A et al. [34] | 2023, Russia | 20 | 20 | 10 | MI S | 0 | NR | 56.8 ± 12.9 | 28.2 ± 4.5 | 45.6 ± 11.3 | NR | NR | NR | NR |
| 24 | 24 | 11 | CA P | 0 | NR | 57.0 ± 13.2 | 29.0 ± 4.9 | 46.0 ± 11.0 | NR | NR | NR | NR | ||
| Landgraeber S et al. [35] | 2013, Germany | 36 | 36 | 12 | MI AL | 36 | Lat | 70.3 ± 4.1 | 27 ± 2.8 | NR | 36 | 0 | 0 | 0 |
| 40 | 40 | 14 | CA L | 40 | Supine | 71 ± 5.4 | 26.7 ± 3.8 | NR | 40 | 0 | 0 | 0 | ||
| Li L [36] | 2020, China | 30 | 30 | 16 | MI S | NR | Lat | 70.4 ± 4.3 | NR | 25.4 ± 2.4 | NR | NR | NR | NR |
| 30 | 30 | 18 | CA PL | NR | Lat | 70.1 ± 4.8 | NR | 26.4 ± 2.5 | NR | NR | NR | NR | ||
| Li X et al. [37] | 2021, China | 49 | 49 | 27 | MI S | NR | Lat | 75.5 ± 7.3 | 23 ± 2.9 | NR | 0 | 15 | 0 | 34 |
| 47 | 47 | 24 | CA PL | NR | Lat | 77.2 ± 7.8 | 22.7 ± 3 | NR | 0 | 16 | 0 | 31 | ||
| Ling Z et al. [38] | 2020, China | 50 | 50 | 31 | MI S | NR | NR | 89.1 ± 3.6 | NR | 46.1 ± 3.3 | 0 | 50 | 0 | 0 |
| 50 | 50 | 29 | CA PL | NR | NR | 89 ± 3.7 | NR | 45.9 ± 3.7 | 0 | 50 | 0 | 0 | ||
| Liu Y et al. [39] | 2021, China | 47 | 47 | 26 | MI S | NR | Lat | 68.3 ± 3.7 | NR | 67.7 ± 7.3 | 0 | 47 | 0 | 0 |
| 47 | 47 | 24 | CA PL | NR | Lat | 68.6 ± 3.4 | NR | 68.7 ± 6.2 | 0 | 47 | 0 | 0 | ||
| Liu W et al. [40] | 2022, China | 30 | 30 | 17 | MI S | NR | Lat | 58.6 ± 4.3 | NR | 58.7 ± 4.3 | 3 | 13 | 0 | 14 |
| 30 | 30 | 18 | CA | NR | Lat | 58.3 ± 4.6 | NR | 58.8 ± 4.3 | 6 | 9 | 0 | 15 | ||
| Martin R et al. [41] | 2011, Belgium | 42 | 42 | 12 | MI AL | 42 | Lat | 66.7 ± 10.1 | 30.6 ± 6.1 | 37.4 ± 15.5 | 37 | 0 | 0 | 5 |
| 41 | 41 | 14 | CA L | 41 | NR | 63.1 ± 10.2 | 29.4 ± 5.5 | 40.2 ± 12.9 | 37 | 0 | 0 | 4 | ||
| Meng W et al. [42] | 2020, China | 2 | 4 | 2 | MI S | NR | Lat | 51 ± 4.5 | 21.5 ± 1.7 | 37.9 ± 13.3 | 0 | 0 | 0 | 4 |
| 2 | 4 | 2 | CA PL | NR | Lat | 51 ± 4.5 | 21.5 ± 1.7 | 37.7 ± 7 | 0 | 0 | 0 | 4 | ||
| Mjaaland KE et al. [43] *** | 2015, Norway | 83 | 83 | 25 | MI DAA | 83 | Supine | 67.2 ± 8.6 | 27.7 ± 3.6 | 53.6 ± 13.7 | 83 | 0 | 0 | 0 |
| 80 | 80 | 30 | CA L | 80 | Lat | 65.6 ± 8.6 | 27.6 ± 3.9 | 56 ± 11.2 | 80 | 0 | 0 | 0 | ||
| Mjaaland KE et al. [44] *** | 2018, Norway | 83 | 83 | 25 | MI DAA | 83 | Supine | 67.2 ± 8.6 | 27.7 ± 3.6 | 53.6 ± 13.7 | 83 | 0 | 0 | 0 |
| 80 | 80 | 30 | CA L | 80 | Lat | 65.6 ± 8.6 | 27.6 ± 3.9 | 56 ± 11.2 | 80 | 0 | 0 | 0 | ||
| Moerenhout K et al. [45] | 2019, Canada | 28 | 28 | 11 | MI DAA | 0 | TT | 70.4 ± 9.1 | 27.6 ± 4.4 | 52.1 ± 19.7 | NR | 0 | 0 | NR |
| 27 | 27 | 18 | CA P | 0 | Lat | 69 ± 8.8 | 26.5 ± 4.3 | 48.2 ± 10.1 | NR | 0 | 0 | NR | ||
| Müller M et al. [46] | 2010, Germany | 21 | 21 | 12 | MI AL | 0 | NR | 66 ± 6.8 | 28 ± 4.3 | 55.9 ± 8 | 21 | 0 | 0 | 0 |
| 16 | 16 | 8 | CA L | 0 | NR | 64 ± 13.8 | 26 ± 2.5 | 55.6 ± 12 | 16 | 0 | 0 | 0 | ||
| Nistor DV et al. [47] | 2017, Romania | 35 | 35 | 26 | MI DAA | 0 | Supine | 67 ± 4.8 | 27.5 ± 3.8 | NR | 35 | 0 | 0 | 0 |
| 35 | 35 | 16 | CA L | 0 | Supine | 64 ± 3.3 | 28.6 ± 3.1 | NR | 35 | 0 | 0 | 0 | ||
| Ouyang C et al. [48] | 2018, China | 12 | 12 | 8 | MI S | NR | Lat | 54 ± 6.5 | 23.1 ± 2.3 | 45.7 ± 5.9 | 5 | 0 | 0 | 7 |
| 12 | 12 | 9 | CA PL | NR | Lat | 55 ± 5 | 23.9 ± 3.4 | 46.9 ± 8.9 | 6 | 0 | 0 | 6 | ||
| Pan F et al. [49] | 2020, China | 58 | 58 | 34 | MI S | NR | Lat | 65.2 ± 6.8 | 22.2 ± 4.2 | 83.9 ± 2.7 | 12 | 26 | NR | 15 |
| 58 | 58 | 33 | CA PL | NR | Lat | 65.6 ± 7 | 22.6 ± 4.2 | 84 ± 3.2 | 11 | 25 | NR | 18 | ||
| Parvizi J et al. [50] | 2016, USA | 44 | 44 | 18 | MI DAA | 0 | Supine | NR | NR | NR | 44 | 0 | 0 | 0 |
| 40 | 40 | 14 | CA L | 0 | Supine | NR | NR | NR | 40 | 0 | 0 | 0 | ||
| Reichert et al. [51] | 2018, Germany | 77 | 77 | 45 | MI DAA | 4 | Supine | 63.2 ± 8.2 | 28.1 ± 3.7 | 54 ± 14.2 | 77 | 0 | 0 | 0 |
| 71 | 71 | 39 | CA L | 5 | Supine | 61.9 ± 7.8 | 28.3 ± 3.4 | 53 ± 15.7 | 71 | 0 | 0 | 0 | ||
| Ren D et al. [52] | 2016, China | 21 | 21 | 12 | MI S | NR | NR | 58 ± 6.9 | NR | 35.4 ± 4.9 | 0 | 0 | 0 | 21 |
| 21 | 21 | 13 | CA | NR | NR | 58.5 ± 6.3 | NR | 36.3 ± 3.5 | 0 | 0 | 0 | 21 | ||
| Restreppo C et al. [53] | 2010, USA | 50 | 50 | 17 | MI DAA | 0 | Supine | 62 ± 12.4 | 25.2 ± 11.1 | 51.9 ± 7.9 | 50 | 0 | 0 | 0 |
| 50 | 50 | 22 | CA L | 0 | Supine | 59.9 ± 9 | 25.2 ± 2.5 | 55 ± 5.5 | 50 | 0 | 0 | 0 | ||
| Rykov K et al. [54] | 2017, Netherlands | 23 | 23 | 8 | MI DAA | 23 | Supine | 62.8 ± 6.1 | 29 ± 5.6 | 52 ± 6.7 | 23 | 0 | 0 | 0 |
| 23 | 23 | 11 | CA PL | 23 | Lat | 60.2 ± 8.1 | 29.3 ± 4.8 | 51 ± 9 | 23 | 0 | 0 | 0 | ||
| Schwarze M et al. [55] | 2017, Germany | 22 | 22 | 13 | MI AL | 0 | Supine | 59 ± 9 | 26.7 ± 4.2 | 53 ± 12 | 22 | 0 | 0 | 0 |
| 21 | 21 | 13 | CA L | 0 | Supine | 59 ± 9 | 26.7 ± 4.2 | 59 ± 15 | 21 | 0 | 0 | 0 | ||
| Taunton M et al. [56] | 2014, USA | 27 | NR | 12 | MI DAA | NR | Supine | 62.1 | 27.7 | 55 ± 4.3 | 27 | 0 | 0 | 0 |
| 27 | NR | 13 | CA P | NR | Lat | 66.4 | 29.2 | 51 ± 6 | 27 | 0 | 0 | 0 | ||
| Taunton M et al. [57] | 2018, USA | 52 | 52 | 27 | MI DAA | 0 | NR | 65 ± 10 | 29 ± 22 | 57 ± 13 | 52 | 0 | 0 | 0 |
| 49 | 49 | 25 | CA P | 0 | NR | 64 ± 11 | 30 ± 4 | 56 ± 12 | 49 | 0 | 0 | 0 | ||
| Varela-Egocheaga JR et al. [58] | 2013, Spain | 25 | 25 | 12 | MI L | 0 | NR | 64.8 ± 10.5 | 28.3 ± 3.7 | 52.7 ± 12.9 | 21 | 0 | 0 | 4 |
| 25 | 25 | 12 | CA L | 0 | NR | 63.8 ± 9.7 | 27.8 ± 3.2 | 51.3 ± 14.9 | 22 | 0 | 0 | 3 | ||
| Wang Z et Ge W [59] | 2021, China | 43 | 43 | 26 | MI S | NR | Supine | 71.5 ± 3.8 | 22.5 ± 1.1 | 62.2 ± 5.2 | 0 | 43 | 0 | 0 |
| 42 | 42 | 24 | CA PL | NR | Lat | 71.6 ± 3.8 | 22.5 ± 1.2 | 62.7 ± 6.6 | 0 | 42 | 0 | 0 | ||
| Xiao C et al. [60] | 2021, China | 49 | 49 | 16 | MI P | 0 | Lat | 71.1 ± 10.9 | 26.7 ± 4.2 | NR | 0 | 49 | 0 | 0 |
| 57 | 57 | 26 | CA PL | 0 | Lat | 73.9 ± 10 | 26.4 ± 4.6 | NR | 0 | 57 | 0 | 0 | ||
| Xie J et al. [61] | 2017, China | 46 | 46 | 12 | MI S | 0 | Lat | 66.6 ± 11.9 | 23.6 ± 1.6 | 28.9 ± 11.3 | 46 | 0 | 0 | 0 |
| 46 | 46 | 19 | CA P | 0 | Lat | 64.5 ± 12.1 | 24.1 ± 2.7 | 29.3 ± 17.4 | 46 | 0 | 0 | 0 | ||
| Yan T et al. [62] | 2017, China | 64 | 70 | 29 | MI S | NR | NR | 66 ± 4 | 24.5 ± 3.5 | 33.5 ± 5.3 | 14 | 11 | 0 | 39 |
| 90 | 103 | 42 | CA L | NR | NR | 65 ± 6.5 | 23.6 ± 3.6 | 30.7 ± 7.6 | 12 | 23 | 0 | 55 | ||
| Yang C et al. [63] | 2010, China | 55 | 55 | 26 | MI AL | 0 | Lat | 59.5 ± 13.2 | 23.1 ± 3.2 | 25.9 ± 11.3 | 12 | 11 | 0 | 32 |
| 55 | 55 | 30 | CA PL | 0 | Lat | 55.8 ± 13.9 | 22.4 ± 4 | 28.2 ± 13.7 | 19 | 13 | 0 | 23 | ||
| Yuan H et al. [64] | 2018, China | 40 | 40 | 24 | MI S | 0 | Lat | 74.3 ± 3 | 22.7 ± 1.7 | 33 ± 1.9 | 5 | 21 | 4 | 10 |
| 44 | 44 | 21 | CA PL | 0 | Lat | 75.7 ± 3.3 | 22.4 ± 2.7 | 32.7 ± 1.3 | 6 | 24 | 2 | 12 | ||
| Zhang ZL et al. [65] | 2019, China | 27 | 27 | 10 | MI S | NR | NR | 62.4 ± 6.4 | 24.5 ± 5.3 | 35.6 ± 8.8 | 7 | 0 | 5 | 15 |
| 27 | 27 | 12 | CA PL | NR | NR | 61.3 ± 6.7 | 23.9 ± 4.9 | 36.2 ± 9.2 | 9 | 0 | 4 | 14 | ||
| Zhao HY et al. [66] | 2017, China | 60 | 60 | 24 | MI DAA | NR | Supine | 64.9 ± 12.1 | 24.4 ± 3.1 | 40.2 ± 9.2 | 41 | 0 | 6 | 13 |
| 60 | 60 | 22 | CA PL | NR | Lat | 62.2 ± 14.7 | 25.6 ± 2.8 | 43.1 ± 15.6 | 40 | 0 | 7 | 13 | ||
| Zhao S [67] | 2021, China | 48 | 48 | 28 | MI S | NR | Lat | 70.4 ± 1.5 | 22.6 ± 1.5 | NR | 0 | 48 | 0 | 0 |
| 48 | 48 | 29 | CA L | NR | Lat | 70.5 ± 1.5 | 22.5 ± 1.5 | NR | 0 | 48 | 0 | 0 |
| Study | Bias Arising from the Randomization Process | Bias Due to Deviation from Intended Interventions | Bias Due to Missing Outcome Data | Bias in Measurement of the Outcome | Bias in Selection of the Reported Result | Overall Risk of Bias |
|---|---|---|---|---|---|---|
| Barrett WP et al. [21] | + | − | ? | ? | + | − |
| Bon G et al. [22] | + | + | + | + | + | + |
| Brismar BH et al. [23] | + | + | − | + | + | − |
| Cheng TE et al. [24] | + | + | − | + | + | − |
| D’Arrigo C et al. [25] | + | + | + | + | + | + |
| De Anta-Diaz B et al. [26] | − | + | + | + | + | − |
| Dienstknecht T et al. [27] | − | + | + | + | + | − |
| Fink B et al. [28] | + | + | + | + | + | + |
| Gao P and Shi X [29] | + | ? | − | + | + | − |
| Hou JZ et al. [30] | + | ? | + | + | + | ? |
| Huang K et al. [31] | − | ? | + | + | + | − |
| Iorio R et al. [32] | + | ? | ? | ? | + | ? |
| Khan RJK et al. [33] | + | + | + | + | + | + |
| Korytkin A et al. [34] | + | ? | + | + | + | ? |
| Landgraeber S et al. [35] | + | ? | + | + | ? | ? |
| Li L [36] | + | ? | − | − | + | − |
| Li X et al. [37] | + | + | − | + | + | − |
| Ling Z et al. [38] | ? | + | − | + | + | − |
| Liu Y et al. [39] | + | + | − | + | + | − |
| Liu W et al. [40] | + | + | + | + | + | + |
| Martin R et al. [41] | ? | ? | + | + | ? | ? |
| Meng W et al. [42] | + | + | + | + | + | + |
| Mjaaland KE et al. [43] | + | + | + | + | + | + |
| Mjaaland KE et al. [44] | + | + | + | + | + | + |
| Moerenhout K et al. [45] | + | + | + | + | + | + |
| Müller M et al. [46] | + | + | ? | ? | + | ? |
| Nistor DV et al. [47] | − | + | + | + | + | − |
| Ouyang C et al. [48] | + | + | + | + | + | + |
| Pan F et al. 2020 [49] | + | ? | − | + | + | − |
| Parvizi J et al. [50] | + | + | − | + | + | − |
| Reichert JC et al. [51] | − | + | + | + | + | − |
| Ren D et al. [52] | + | ? | − | ? | ? | − |
| Restreppo C et al. [53] | + | + | + | + | + | + |
| Rykov K et al. [54] | + | + | − | + | + | − |
| Schwarze M et al. [55] | ? | ? | − | − | + | − |
| Taunton M et al. [56] | + | + | ? | + | + | ? |
| Taunton M et al. [57] | + | + | ? | + | + | ? |
| Varela-Egocheaga JR et al. [58] | − | − | + | + | + | − |
| Wang Z and Ge W [59] | + | ? | − | + | + | − |
| Xiao C et al. [60] | ? | + | + | + | + | ? |
| Xie J et al. [61] | + | + | + | + | + | + |
| Yan T et al. [62] | + | ? | ? | + | + | ? |
| Yang C et al. [63] | + | + | + | + | + | + |
| Yuan H et al. [64] | + | ? | − | + | + | − |
| Zhang ZL et al. [65] | + | + | ? | + | + | ? |
| Zhao HY et al. [66] | + | + | + | + | + | + |
| Zhao S [67] | − | ? | + | + | + | − |
| No. of Studies | Design | Risk of Bias | Inconsistency | Indirectness | Imprecision | Other Considerations | Quality of Evidence |
|---|---|---|---|---|---|---|---|
| I. Surgical outcome | |||||||
| 1. Operation time | |||||||
| 39 | RCT | Serious | Serious | No serious indirectness | Serious | In some cases SD was calculated via imputation | Very low |
| 2. Incision length | |||||||
| 28 | RCT | Serious | No serious inconsistency | No serious indirectness | Serious | In some cases SD was calculated via imputation | Very low |
| 3. Intraoperative blood loss | |||||||
| 26 | RCT | Serious | Serious | No serious indirectness | Serious | In some cases SD was calculated via imputation | Very low |
| 4. VAS 1 day postoperatively | |||||||
| 9 | RCT | Serious | No serious inconsistency | No serious indirectness | No serious imprecision | - | Low |
| 5. VAS 3 days postoperatively | |||||||
| 8 | RCT | Serious | No serious inconsistency | No serious indirectness | No serious imprecision | - | Low |
| II. Functional outcome | |||||||
| 1. HHS 0–1.5 months postoperatively | |||||||
| 26 | RCT | Serious | No serious inconsistency | No serious indirectness | Serious | In some cases SD was calculated via imputation | Very low |
| 2. HHS 3 months postoperatively | |||||||
| 22 | RCT | Serious | Serious | No serious indirectness | No serious imprecision | - | Very low |
| 3. HHS 6 months postoperatively | |||||||
| 13 | RCT | Serious | No serious inconsistency | No serious indirectness | No serious imprecision | - | Low |
| 4. HHS 12 months postoperatively | |||||||
| 16 | RCT | Serious | No serious inconsistency | No serious indirectness | Serious | In some cases SD was calculated via imputation | Very low |
| III. Radiological outcome | |||||||
| 1. Acetabular cup anteversion angle | |||||||
| 17 | RCT | Serious | Serious | No serious indirectness | Serious | In some cases SD was calculated via imputation | Very low |
| 2. Acetabular cup inclination angle | |||||||
| 22 | RCT | Serious | Serious | No serious indirectness | Serious | In some cases SD was calculated via imputation | Very low |
| IV. Postoperative complications | |||||||
| 1. Overall postoperative complications | |||||||
| 34 | RCT | Serious | Serious | No serious indirectness | No serious imprecision | - | Very low |
| 2. Dislocation | |||||||
| 31 | RCT | Serious | No serious inconsistency | No serious indirectness | No serious imprecision | - | Low |
| 3. Infection | |||||||
| 31 | RCT | Serious | No serious inconsistency | No serious indirectness | No serious imprecision | - | Low |
| 4. Periprosthetic fracture | |||||||
| 31 | RCT | Serious | No serious inconsistency | No serious indirectness | Serious | - | Very low |
| 5. Deep vein thrombosis | |||||||
| 31 | RCT | Serious | No serious inconsistency | No serious indirectness | No serious imprecision | - | Low |
| 6. Hematoma | |||||||
| 27 | RCT | Serious | No serious inconsistency | No serious indirectness | No serious imprecision | - | Low |
| 7. Reoperation | |||||||
| 25 | RCT | Serious | No serious inconsistency | No serious indirectness | No serious imprecision | - | Low |
| Number of RCTs | Egger.p.Value | Begg.p.Value | |
|---|---|---|---|
| I. Surgical outcome | |||
| 1.Operation time | 39 | 0.0038 ** | 0.5779 |
| 2.Incision length | 28 | 0.5494 | 0.7670 |
| 3.Intraoperative blood loss | 26 | 0.1562 | 0.4806 |
| 4.Pain VAS 1 day postoperatively | 9 | 0.7491 | 0.7545 |
| 5. Pain VAS 3 days postoperatively | 8 | 0.9212 | 0.7105 |
| II. Functional outcome | |||
| 1. HHS 0–1.5 months postoperatively | 26 | 0.4812 | 0.0778 * |
| 2. HHS 3 months postoperatively | 22 | 0.1843 | 0.6118 |
| 3. HHS 6 months postoperatively | 13 | 0.4700 | 0.7603 |
| 4. HHS ≥ 12 months postoperatively | 16 | 0.2160 | 0.2604 |
| III. Radiological outcome | |||
| 1. Cup anteversion | 17 | 0.3168 | 0.5923 |
| 2. Cup inclination | 22 | 0.0057 ** | 0.6519 |
| IV. Postoperative complications | |||
| 1.Overall postoperative complications | 34 | 0.8312 | 0.7098 |
| 2. Dislocation | 31 | 0.5516 | 0.6404 |
| 3. Infection | 31 | 0.1585 | 0.3359 |
| 4. Periprosthetic fracture | 31 | 0.2566 | 0.7603 |
| 5. Deep vein thrombosis | 31 | 0.8549 | 0.2758 |
| 6. Hematoma | 27 | 0.2438 | 1.0000 |
| 7. Reoperation | 25 | 0.0244 * | 0.0375 * |
| Outcome Parameter | MI THA | CA THA |
|---|---|---|
| I. Surgical outcome | ||
| 1. Operation time (min.) | 82.3 | 72.8 |
| 2. Incision length (cm) | 9.0 | 13.1 |
| 3. Intraoperative blood loss (mL) | 262.3 | 435.3 |
| 4. VAS 1 day postoperatively (points) | 3.5 | 4.9 |
| 5. VAS 3 days postoperatively (points) | 2.6 | 3.7 |
| II. Functional outcome | ||
| 1. HHS 0–1.5 months postoperatively (points) | 83.2 | 79.1 |
| 2. HHS 3 months postoperatively (points) | 88.6 | 86.3 |
| 3. HHS 6 months postoperatively (points) | 91.5 | 89.9 |
| 4. HHS 12 months postoperatively (points) | 93.5 | 92.4 |
| III. Radiological outcome | ||
| 1. Acetabular cup anteversion angle (degrees) | 20.4 | 20.5 |
| 2. Acetabular cup inclination angle (degrees) | 42.3 | 42.6 |
| IV. Postoperative complications | ||
| 1. Overall postoperative complications (%) | 5.72 | 4.21 |
| 2. Dislocation (%) | 0.68 | 0.76 |
| 3. Infection (%) | 0.53 | 0.90 |
| 4. Periprosthetic fracture (%) | 1.06 | 0.62 |
| 5. Deep vein thrombosis (%) | 0.38 | 1.18 |
| 6. Hematoma (%) | 0.09 | 0.61 |
| 7. Reoperation (%) | 1.47 | 1.04 |
Disclaimer/Publisher’s Note: The statements, opinions and data contained in all publications are solely those of the individual author(s) and contributor(s) and not of MDPI and/or the editor(s). MDPI and/or the editor(s) disclaim responsibility for any injury to people or property resulting from any ideas, methods, instructions or products referred to in the content. |
© 2023 by the authors. Licensee MDPI, Basel, Switzerland. This article is an open access article distributed under the terms and conditions of the Creative Commons Attribution (CC BY) license (https://creativecommons.org/licenses/by/4.0/).
Share and Cite
Ramadanov, N.; Marinova-Kichikova, P.; Hable, R.; Dimitrov, D. Minimally Invasive versus Conventional Approaches in Total Hip Arthroplasty: A Systematic Review and Meta-Analysis of 47 Randomized Controlled Trials. Prosthesis 2023, 5, 962-991. https://doi.org/10.3390/prosthesis5030067
Ramadanov N, Marinova-Kichikova P, Hable R, Dimitrov D. Minimally Invasive versus Conventional Approaches in Total Hip Arthroplasty: A Systematic Review and Meta-Analysis of 47 Randomized Controlled Trials. Prosthesis. 2023; 5(3):962-991. https://doi.org/10.3390/prosthesis5030067
Chicago/Turabian StyleRamadanov, Nikolai, Polina Marinova-Kichikova, Robert Hable, and Dobromir Dimitrov. 2023. "Minimally Invasive versus Conventional Approaches in Total Hip Arthroplasty: A Systematic Review and Meta-Analysis of 47 Randomized Controlled Trials" Prosthesis 5, no. 3: 962-991. https://doi.org/10.3390/prosthesis5030067
APA StyleRamadanov, N., Marinova-Kichikova, P., Hable, R., & Dimitrov, D. (2023). Minimally Invasive versus Conventional Approaches in Total Hip Arthroplasty: A Systematic Review and Meta-Analysis of 47 Randomized Controlled Trials. Prosthesis, 5(3), 962-991. https://doi.org/10.3390/prosthesis5030067