Article

Human Walking Gait Classification Utilizing an Artificial Neural Network for the Ergonomics Study of Lower Limb Prosthetics

1
Mechanical Engineering Department, Politeknik Negeri Semarang, Semarang 50275, Indonesia
2
Center for Bio-Mechanics Bio-Material Bio-Mechatronics and Bio-Signal Processing (CBIOM3S), Semarang 50275, Indonesia
3
Faculty of Integrated Technologies, Universiti Brunei Darusalam, Jalan Tungku Link, Gadong BE1410, Brunei
4
Faculty of Mechanical Engineering, Opole University of Technology, 76 Proszkowska St., 45-758 Opole, Poland
5
Department of Automatic Control and Robotics, Faculty of Electrical Engineering, Automatics, Computer Science and Biomedical Engineering, AGH University of Science and Technology, Al. A. Mickiewicza 30, 30-059 Krakow, Poland
6
Mechanical Engineering Department, Universitas Diponegoro, Semarang 50275, Indonesia
*
Author to whom correspondence should be addressed.
Prosthesis 2023, 5(3), 647-665; https://doi.org/10.3390/prosthesis5030046
Submission received: 24 April 2023 / Revised: 23 June 2023 / Accepted: 29 June 2023 / Published: 12 July 2023
(This article belongs to the Special Issue Sensorimotor Prostheses and Powered Exoskeletons for Movement Control)

Abstract

:
Prosthetics and orthotics research, studies, and technologies have been evolving through the years. According to World Health Organization (WHO) data, it is estimated that, globally, 35–40 million people require prosthetics and orthotics usage in daily life. Prosthetics and orthotics demand is increasing due to certain factors. One of the factors is vascular-related disease, which leads to amputation. Prosthetic usage can increase an amputee’s quality of life. Therefore, studies of the ergonomic design of prosthetics are important. The ergonomic factor in design delivers prosthetic products that are comfortable for daily use. One way to incorporate the ergonomic design of prosthetics is by studying the human walking gait. This paper presents a multiclassification of human walking gait based on electromyography (EMG) signals using a machine learning method. An EMG sensor was attached to the bicep femoris longus and gastrocnemius lateral head to acquire the EMG signal. The experiment was conducted by volunteers during normal walking activity at various speeds and the movements were segmented as initial contact, which was labeled as initial gait; loading response to the terminal stance, which was labeled as mid-gait; and pre-swing to terminal swing, which was labeled as final gait. The EMG signal was then characterized using an artificial neural network (ANN) and compared to six training accuracy methods, i.e., the Levenberg–Marquardt backpropagation training algorithm, quasi-Newton training method, Bayesian regulation backpropagation training method, gradient descent backpropagation, gradient descent with adaptive learning rate backpropagation, and one-step secant backpropagation. The machine learning study performed well in the classification of three classes of human walking gait with an overall accuracy (training, testing, and validation) of 96% for Levenberg–Marquardt backpropagation. The gait data will be used to explore the design of lower limb prosthetics in future research.

1. Introduction

Lower limb amputation, whether due to accidents or illnesses such as diabetes, peripheral vascular disease, and gangrene [1], can be traumatic both for the patient and caregiver. Lower limb amputation affects physical, psychological, emotional, and social aspects of individuals’ lives, especially activities related to the human leg, which is an important limb. The use of lower limb prosthesis for amputation can help increase life quality for patients. Previous studies showed higher scores in quality of life for amputation patients who used prostheses than patients who did not use prosthetics in the physical, psychological, and environmental domains [2]. Amputation patients in Indonesia, where this study was conducted, mainly used conventional, low-cost, below-limb prosthetics [3]. These conventional lower limb prosthetics commonly consist of fixed and passive structures where the ability to walk is still possible, although patients must overcome certain difficulties [4]. This study mentions that the ability to successfully walk using prosthetics was an important factor contributing to amputation patients’ quality of life [5]. Thus, it is very important to develop active lower limb prosthetics with ergonomic considerations to increase amputation patients’ quality of life. Motorized lower limb prosthetics can be achieved by using a bionic lower limb, incorporating a motor as the driving force. Motor control using signal measurement from electromyography (EMG) has been widely used for upper limb prosthesis. On the contrary, EMG control for bionic lower limb prosthesis is still in the early stage of research due to the practical use of motorized robotic lower limbs [6].
This research was a preliminary study on the development of a bionic below-limb prosthesis. An EMG sensor called Myomes was used to record research participants’ muscle signals while walking on a treadmill at different speeds. EMG signals were obtained, then separated into three gaits and classified using the ANN machine learning method. Six training algorithms were used in this ANN method for gait classification. The preliminary results of this study will help researchers understand how the human gait works, and the best training method and classification results. In a future project, the best training method will be used for amputation patients training for bionic below-limb prosthetic customization. Patient signals will be recorded using Myomes and then fed back into the motor.
Research related to EMG signal recording and classification has been carried out extensively using different variations, methods, and purposes, i.e., rehabilitation and EMG data collections for various gaits [7,8,9,10,11,12]. Some of these studies recorded below-limb EMG signals statically where the participants were not moving or walking [7,8]. The current study contributes to the literature on EMG measurements that were conducted while participants were walking at various speeds on a treadmill. Another study [9,10,12] collected EMG signals where all the participants were of the male gender. This research collected EMG samples from both male and female genders. A recent study noted that EMG recording activities were conducted during a ground-walking experiment in five environments, i.e., flat ground, upstairs, downstairs, uphill, and downhill [12]; another study recorded EMG signals while participants walked on level ground [11]. This study contributes to the knowledge of EMG signal recordings where participants walk in a controlled environment in which a treadmill runs at different speeds. Most of the previous research classified gait into two classes: stance and swing phase [7,8,9,10,11,12]. This study classified gait into three classes. Several methods were applied to human gait classification, including deep learning [11,12], utilizing an ANN combined with Levenberg–Marquardt as a training algorithm. This study classified other training algorithms (quasi-Newton method, Bayesian regulation backpropagation, gradient descent backpropagation, gradient descent with adaptive learning rate backpropagation, and one-step secant backpropagation), indicating that different algorithms result in different levels of accuracy.

2. Experimental Setup and Data Acquisition

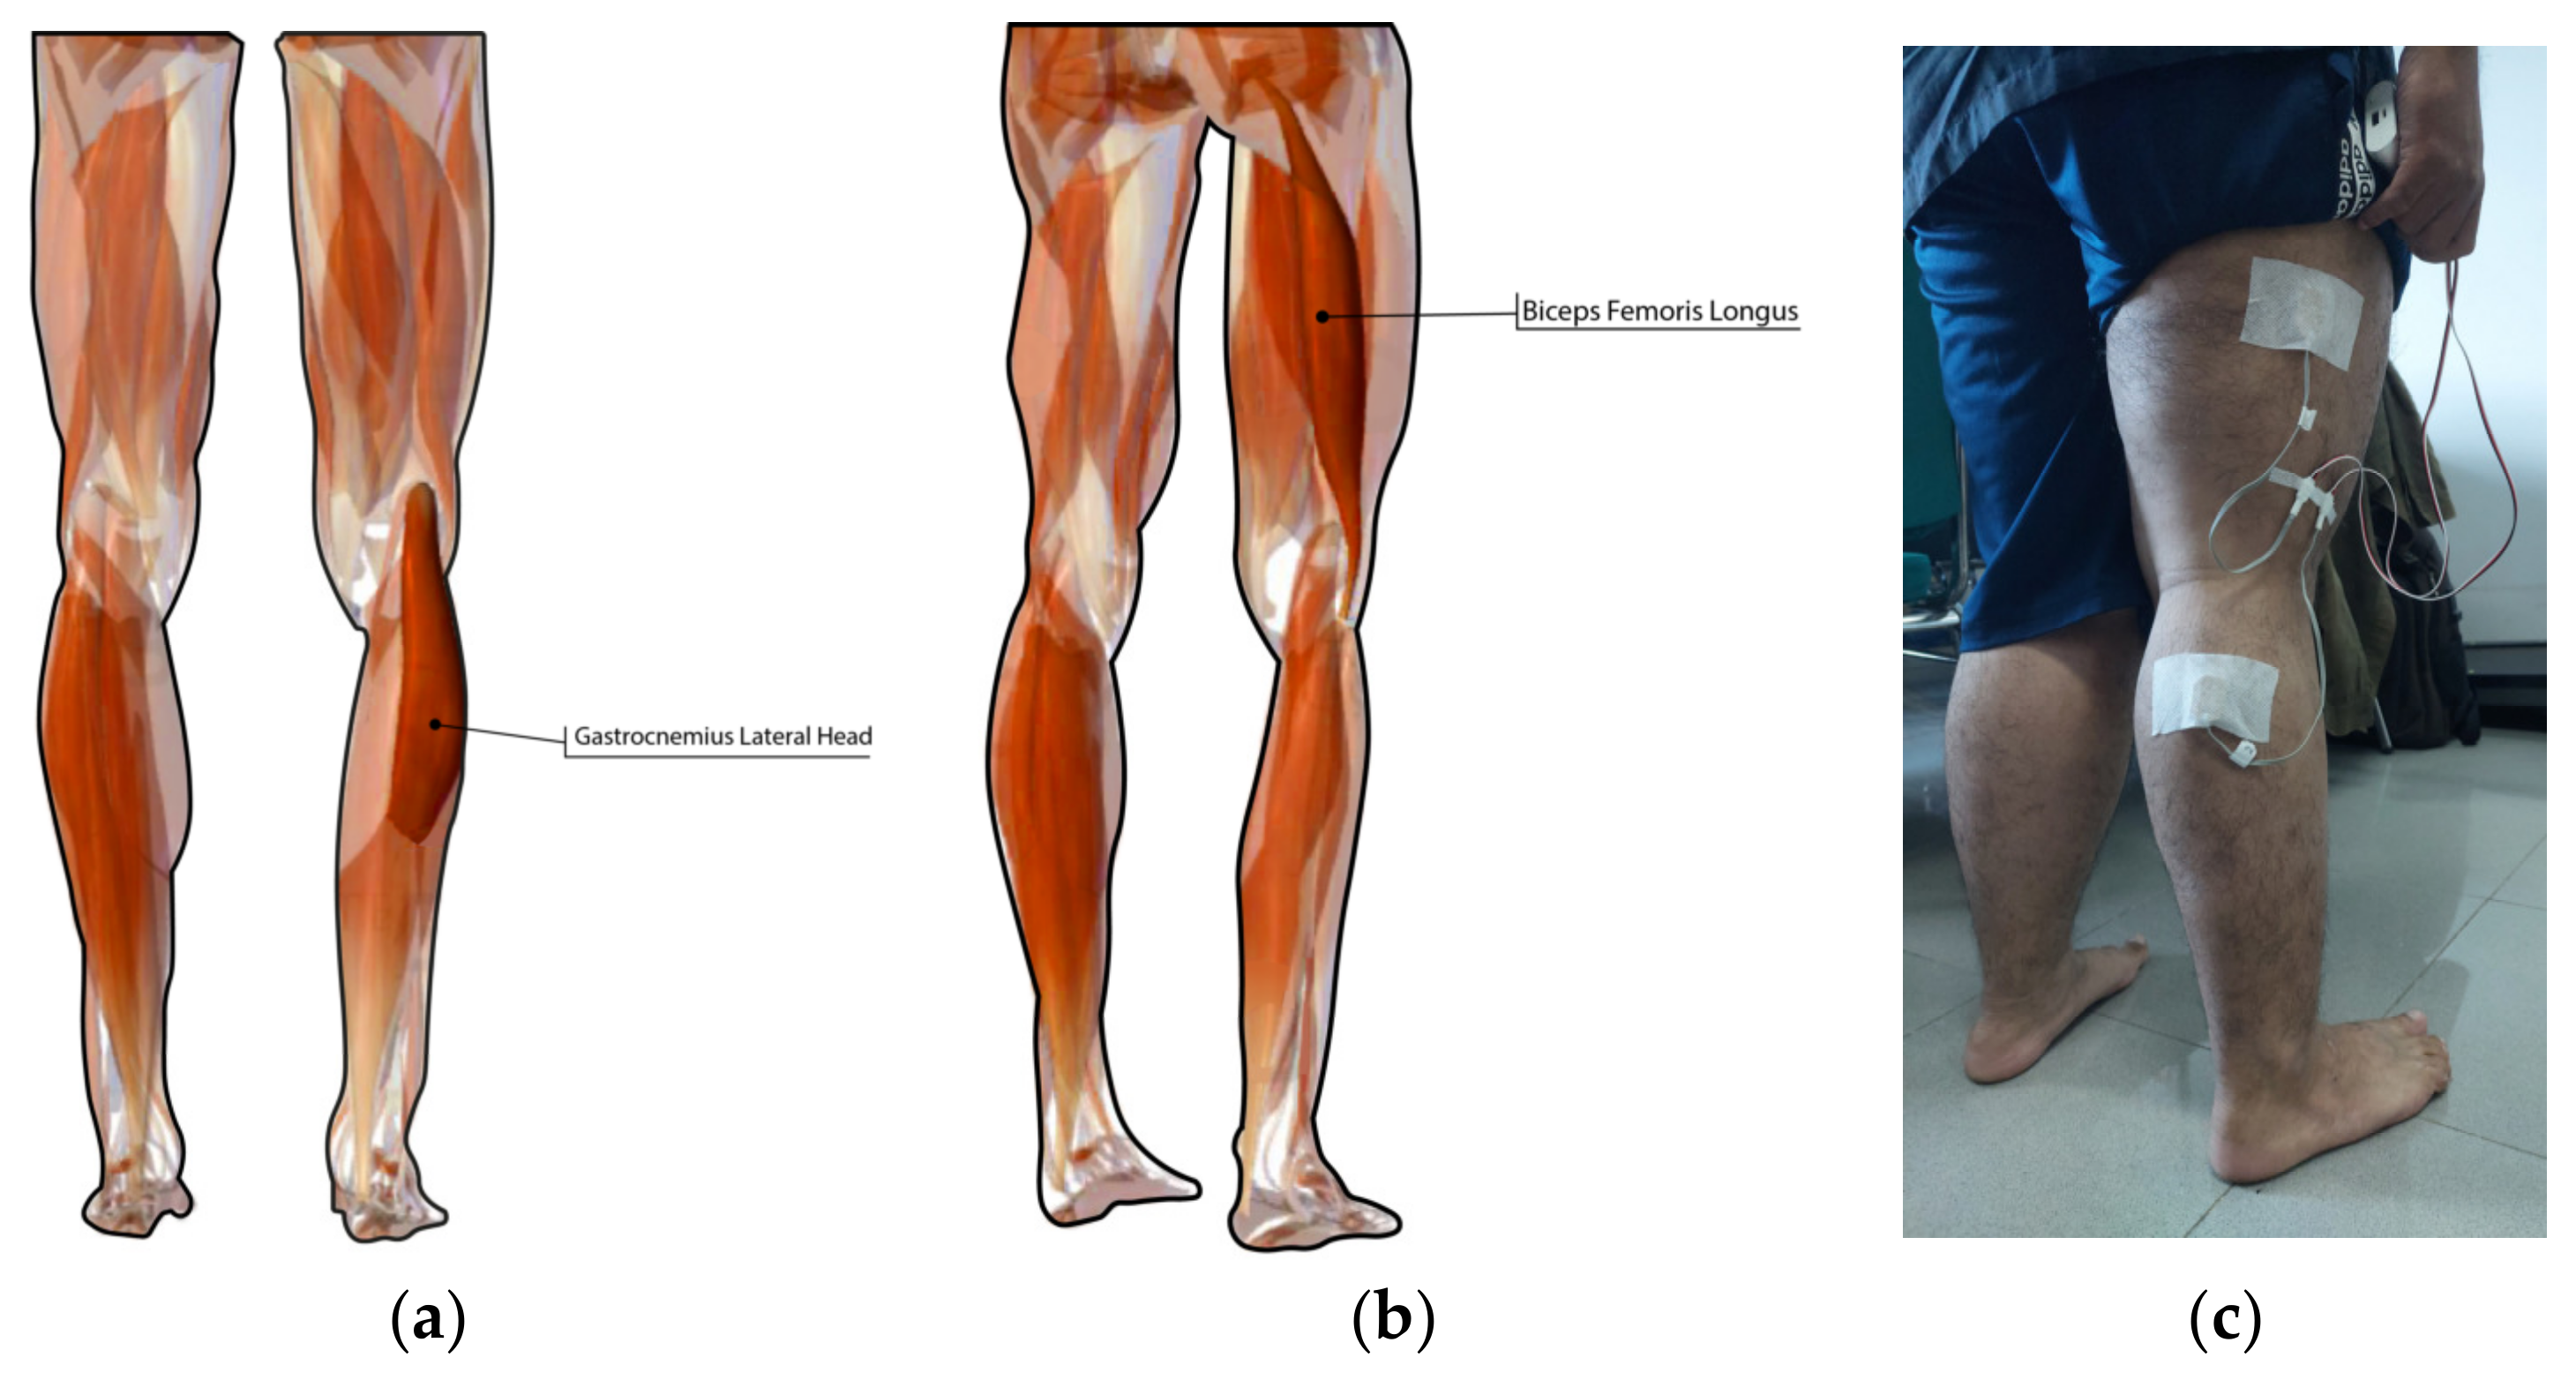
2.1. Experimental Setup

EMG signal acquisition was carried out utilizing Myomes, an EMG meter that was developed at the Center for Biomechanics, Biomaterial, Biomechatronics, and Biosignal processing (CBIOM3S) laboratory of Universitas Diponegoro located in Semarang City, Central Java, Indonesia. CBIOM3S is a research center in the field of biomedical engineering. The researchers in the CBIOM3S carried out diversity research related to health technologies such as artificial hip joint [13], voice-based Parkinson’s disease diagnosis kit [14], low-cost bionic hand [15], prosthesis material [16], orthotic shoes [17], biomaterial implant [18] and an EMG-research-based Myomes sensor [19].
Myomes is a non-invasive, compact, and mobile EMG meter. Myomes is a compact EMG sensor kit with 220 mm length, 115 mm width, and 65 mm height dimensions. Myomes works at a range of 50–150 Hz frequency; this value suits the consideration of several authors, who suggest that the highest-frequency component of EMG was between 400 and 500 Hz [20,21,22]. The EMG signal amplitude of Myomes ranges between 1 and 10 mv when converted into percentage units. The frequency sampling used in this research was 1000 Hz. This frequency sampling number is selected to avoid signal distortion [22,23].
The Myomes sensor kit used in this study is presented in Figure 1a. 1. EMG electrode (label number 5) is attached to the patient’s skin using a rubber band (label number 1). The extended cable (label number 4) is added to the sensor when necessary. The signal recording and communication with the computer is carried out using a cable (label number 2), transmitter is used to transmit the EMG signal (label number 3), and EMG electrode presented in Figure 1b.
The diameter and size of the EMG sensor affect the inter−electrode distance as presented in the previous study [24]. The larger the EMG’s diameter and size, the more the inter-electrode distance increases. This size results in large EMG signals and volume detected. This can cause crosstalk phenomena, where a signal is detected on a targeted muscle, which is generated by the other unit of muscle. This potentially leads to misinterpretation and incorrect analysis. The Myomes used a 1 × 3 surface array electrode, which recorded muscle potential for the 1–2 cm range, which is the best selection to avoid crosstalk phenomena.

2.2. Data Acquisition

The present study consists of three main procedures: (i) data acquisition, (ii) feature extraction, and (iii) gait classification using the ANN method. The first procedure, i.e., gait data acquisition, comprises four sequential steps: first, myomes are connected to the computer; second, myomes are attached to the participant’s feet; third, participants are requested to walk on the treadmill at a speed ranging from 1 to 5, i.e., speed 1 (7.26 m/min), speed 2 (20.80 m/min), speed 3 (35.76 m/min), speed 4 (50.61 m/min) and speed 5 (65.32 m/min); and fourth, EMG data acquisition begins and a video is recorded while the participant walks on the treadmill.
EMG data collection was carried out on healthy subjects. The first subjects were males aged between 20 and 30 years old, the second subjects were males aged between 30 and 40 years old, the third subject was a female aged 20–30 years old, and the last subject was females aged 30–40 years old. The selection of the participants was based on the subjects’ daily activity and health level. All non-smokers and non-alcohol-drinker subjects were selected and completed physical activities during their daily routine. None of the participants have undergone surgery or suffered below-limb joint pain or a pathological condition that affects the mechanics and gait of the lower limb. Details of the subjects involved in the study are presented in Table 1. The subjects’ data, such as height, weight, Body Mass Index (BMI), and age, are also presented.
A myomes electrode was attached on the gastrocnemius lateral head and biceps femoris longus muscle, as presented in Figure 2a,b, using a hypafix, as illustrated in Figure 2c. Electrode placement was based on the suggestion of surface electromyography for the non-invasive assessment of muscles (SENIAM) and the results presented in the previous study [25]. The authors in [25] reported that the signal quality and global muscle classification is excellent when the EMG electrode is attached to gastrocnemius lateral head muscle and biceps femoris longus muscle.

3. Feature Extraction and Classification Method

The feature extraction step is carried out utilizing 12 features: 8 time-domain features and 4 frequency-domain features. The time domain features include the integrated EMG (IEMG), mean absolute value (MAV), the variance of EMG (VAR), root mean square (RMS), log detector (LOG), waveform length (WL), kurtosis, and skewness. The frequency-domain features include mean frequency (MNF), median frequency (MF), total power (TTP), and mean power (MNP).
Data collection videos were played and the raw EMG signal was segmented into three signals based on the selected phases. An illustration of the three phase categories of gait cycle for ANN classification is presented in Figure 3 [26]. Many previous studies adopted two phases of human gait partition, i.e., stance and swing phase [7,8,9,10,11,12]. However, other studies adopted a larger number of phases, such as three [27,28,29,30,31], four [32], five, and more [33,34,35]. Future work will investigate the possible use of a motor control feedback signal for bionic below-limb prosthetics in which the EMG signals are segmented into three classes [27].
Figure 4 shows the segmented EMG Myomes signals into three categories, i.e., (i) Initial contact, which is labeled as initial gait, (ii) Loading response to the terminal stance which is labeled as mid−gait and (iii) Preswing to terminal swing which is labeled as final gait.
Figure 4a presents the segmented EMG signal on initial contact phase. It represents a gait cycle initiation and contact point that the gravity body center is maximum in this phase which shows an existence of the muscle activity. In addition, Figure 4a shows the Myomes EMG signal amplitude of approximately 18%. Figure 4b presents the segmented EMG signal from loading response to a terminal stance where the foot plantar surface touched the treadmill. There were minimal activities to the muscle due to the single limb stance. The highest EMG activities were recorded from preswing to terminal swing which amplitude approximately of 35% as presented in Figure 4c. The segmentation EMG signal is also based on previous research [27] that used an adaptive controller for active ankle foot prosthetics signals.
In ANN gait classification, the EMG data are divided as follows: 70% for training, 15% for validation, and 15% for testing. The present study used two layers: a feed-forward network with a tangent−sigmoid transfer function for the hidden layer and a softmax transfer function for the output layer, as presented in Figure 5.
According to Figure 5, the hidden layer can be presented in Equation (1), as follows:
a1 = tf1 (IWx + b1)
where a1 denotes the output vector in the hidden layer, x is an n-length input vector, and IW denotes the weight matrix input layer. The transfer function of the input layer and hidden layer bias vector is stated in tf1 and b1. Equation (2) illustrates the output layer of the first output neuron.
a2 = tf2(LW(tf1(IWx + b1)) + b2)
where a2 is the hidden layer output vector, LW is weight matrix output layer.
There are six training methods used as the training algorithm, i.e., Levenberg−Marquardt back propagation with the second-order training speed approach, the quasi-Newton method, Bayesian regulation backpropagation, gradient descent backpropagation, gradient descent with adaptive learning rate backpropagation and one-step secant backpropagation. The prediction error was calculated using mean square error (MSE). A smaller MSE value indicates that the ANN classification accuracy is higher.
Figure 6 illustrated the ANN model with 12 features calculated as input, 25 neurons in the hidden layer, and 3 outputs which represent each class, i.e., the initial gait, mid-gait and final gait.

4. Results

4.1. Myomes EMG Signal Acquisition

EMG signal was acquired using Myomes EMG sensor kit with 1000 sampling frequency and gain set at 3. Data acquisition was carried out while participants walked on the treadmill at various paces. Figure 7 shows the EMG signals of one participant acquired at different paces using different EMG sensor attachments. The EMG signal was recorded based on the different pace setups of the treadmill. The signal was recorded from subject 1, a male participant with an age range of 20–30 years old on the gastrocnemius lateral head and biceps femoris longus muscle. The unit of the y-axis in Figure 7 is denoted into percentage units because Myomes output EMG signals were already being processed into percentage values, which can be notated with defined upper and lower limits.
The maximum amplitude of the EMG signal when the participant walks on a treadmill at a normal pace (pace 1) was 87% on the gastrocnemius lateral head muscle, as presented in Figure 7a, and 49% on the biceps femoris longus, as presented in Figure 7b. The maximum EMG signal amplitude increased to 100% on the gastrocnemius lateral head muscle, as presented in Figure 7c, and increased to 55% on the biceps femoris longus, as presented in Figure 7d, when the participant walks at pace 2. For pace 3, the maximum EMG signal amplitude showed 100% for the gastrocnemius lateral head muscle, as presented in Figure 7e, and 48% for the biceps femoris longus, as presented in Figure 7f. In general, Figure 7 indicates that the faster the treadmill pace, the higher the EMG signals acquired for both muscles. A higher EMG signal amplitude represents the muscle activity on the gastrocnemius lateral head muscle and biceps femoris longus.

4.2. Classification Result of EMG Signals Using ANN

EMG signals that are processed in the feature calculation stage consist of 360 pieces of data. For ANN classification model calculation, the EMG signals are divided as follows: 70% for training, consisting of 252 pieces of data, and 15% for both testing and validation, consisting of 54 pieces of data. Table 2 shows the training accuracy and confusion matrix for each participant, using different training algorithms. The Levenberg−Marquardt backpropagation training algorithm is labeled as LM, the quasi−Newton training method is labeled as QN, the Bayesian regulation backpropagation training method is labeled as BY, gradient descent backpropagation is labeled as GD, gradient descent with adaptive learning rate backpropagation is labeled as GDA, and one-step secant backpropagation is labeled as OSS. For the classification label, initial gait is labeled as IG, midpgait is labeled as MG, and final gait is labeled as FG.
Table 2 shows the classification accuracy and confusion matrix of each participant. It shows that the Levenberg−Marquardt backpropagation training algorithm and gradient descent backpropagation were consistent, with the highest accuracy for individual participants.
Table 3 presents the training accuracy for all participants. The result shows that Levenberg−Marquardt backpropagation and gradient descent backpropagation for the training model have a higher accuracy than other methods. This result is consistent with the result from Table 2.
Table 4 denotes the overall accuracy (training, testing, and validation) for all six training algorithm methods and each research participant. The overall accuracy (training, testing, and validation) shown in Table 4 indicate that the Levenberg−Marquardt backpropagation resultsoutperform other methods.
Table 5 shows the overall accuracy (training, testing, and validation) for all six training algorithm methods. Table 5 shows that Levenberg−Marquardt backpropagation had the best result for overall accuracy.

4.3. Mean Square Error

ANN performance is represented by the MSE value of the training, validation, and testing steps. Figure 8 shows the MSE value for the Levenberg−Marquardt backpropagation training algorithm, quasi-Newton training method, Bayesian regulation backpropagation training method, gradient descent backpropagation, gradient descent with adaptive learning rate backpropagation, and one-step secant backpropagation.
The best training, validation, and testing performance can be measured using the MSE value. Lower MSE values indicate that the model has the best accuracy performance. Figure 8a shows the best accuracy performance for the Levenberg−Marquardt backpropagation algorithm, at 0.10733 MSE value. This value can be compared to Figure 8b−f with the quasi-Newton method training algorithm, which has the best performance results with a 0.20509 MSE value; Bayesian regulation backpropagation training method with 0.20251 MSE value; gradient descent backpropagation with 0.20222 MSE value; gradient descent with adaptive learning rate backpropagation with 0.2045 MSE value; and one-step secant backpropagation with 0.22234 MSE value.

4.4. Testing Set Regression Diagram

In order to provide a visualization of the ANN classification, a regression plot is presented in Figure 9. The purpose of the regression diagram is to illustrate the correlation between predicted output and target output. Figure 9 shows the regression diagram for all training methods using a testing sample.
Testing sets were collected for 10 samples in each class. Figure 9a,c,d shows that three samples were not classified correctly into true (targeted) class. Meanwhile, Figure 9e shows four samples that were misclassified into another class, and in Figure 9b,f, five samples were not classified correctly into true (target) class. This regression plot is a visualization of the overall accuracy presented in Table 5

5. Discussion

Gait classification and pattern recognition was conducted with different machine learning methods and different types of sensor. Some research used gait analysis to detect people with gait disorders [36], understand the biomechanics of muscle for pre-disease diagnosis, and design lower limb prosthetics [37]. The present study analyzed human gait with the aim of obtaining a better understanding and a better design for lower limb prosthetics. Various sensors were used as data acquisition kits, such as accelerometers [36,37,38]. In the present study, an EMG meter named Myomes was used to collect the participant data. Table 6 summarizes previous research in EMG signal classification compared to the present study. Most studies using gait signals from EMG measurements classified the signals into two classes using various machine learning methods [10,11]; meanwhile, another study classified human gait into eight classes using only one machine learning method, linear discriminant analysis (LDA), with Bayesian information criteria as the optimization method [39]. The present study classified human gait into three classes using ANN with various training algorithms to find which training algorithm had the best result. A comparison of previous research in Table 6 could be a consideration in future improvements to the research.
The paper [11] showed that ANN, with a number of architectural variations, affected the system accuracy. This was consistent with this study, where variations in the training algorithm affected the system accuracy, although both studies utilized different variations in the experiment. Paper [11] showed the accuracy of unseen subjects (US) consisting of a single subject and learned subject (LS), with 22 unlearned subjects. According to the accuracy results, LS subjects have a better value, at 94.49% (further information regarding this accuracy result can be found in Ref. [11]). This is also consistent with this study, where overall accuracy was higher than each subject’s accuracy and both studies suggest that walking patterns might be unique, as presented in Table 6. Table 6 also shows that a number of machine learning methods have been used in EMG pattern recognition studies. The machine learning model with fewer classes has higher accuracy compared to those with a higher number of classes.
Study [10] showed higher accuracy than previous research [11]; however, the research [10] only classified below-limb EMG signals into two classes. A further consideration of this study could be to improve data in the future by embedding a number of muscles where EMG signals are recorded. Another machine learning method could also be considered. However, the ANN has been proven as a potential embedded machine learning method for hardware implementation. This is the main reason why the ANN is selected in present study. The future work of the present study is to develop an embedded system in which the ANN will be embedded into a certain microcontroller for bionic below-limb prosthesis. In previous research, the EMG signals were segmented into eight classes where the human gait was identified [39]. This will be taken into consideration for future studies, as more classes for human gait might result in a better ergonomic design.
A previous study concluded that the ANN training algorithm’s determination depends on many factors, such as the complexity of problems, amount of data in the training set, weight and biases in the networks, the error goal, and machine learning purposes, i.e., for pattern recognition or approximation [40]. Table 5 showed that the Levenberg−Marquardt backpropagation training algorithm resulted in the best and higher accuracy among other training algorithms, at 96% overall accuracy. This result is consistent with a previous study [41] that concluded that the Levenberg−Marquardt backpropagation training algorithm showed good potential in gait mechanics’ estimation. The Levenberg−Marquardt backpropagation training algorithm performed well with a low weight because convergent results can be obtained in a short time and a lower error rate can be generated [40].
ANN training algorithm variations were used in other studies, as presented in Table 7. Table 7 shows a comparison between the other studies that used the ANN training algorithm variation and the present study. According to Table 7, it can be concluded that different datasets and classes result in different accuracies for ANN classification. Further details of the classification accuracy can be found in the references presented in Table 7. Table 7 shows the ANN method machine learning method used in various dataset, including non-biomedical datasets such as car evaluation [42] and biomedical datasets, i.e., Parkinson’s, cardiotography I, cardiotography II [42], length of stay (LOS) for hospitalized patients with COVID-19 [40], and heart disease patients [43].
Some research [40,42] found that the Bayesian regulation backpropagation training algorithm has the highest accuracy. The results related to how the Bayesian regulation backpropagation training algorithm updates the weights and biases in ANN networks using the Levenberg−Marquardt backpropagation training algorithm as optimisation method. The Bayesian regulation backpropagation training algorithm leads to a high-generalizability model [40] that is suitable for function approximation and did not perform well in classification or pattern recognition. This finding is consistent with the results of the present study, where the Bayesian regulation backpropagation training algorithm had a lower accuracy than other training algorithm, at 89% overall accuracy, which can be seen in Table 5.
Previous research [43] is consistent with the present study, and study [41] reached the same conclusion, that the Levenberg−Marquardt backpropagation training algorithm performed best when used in the ANN model for classification and pattern recognition, although study [43] used a different dataset to the present study and study [41].
The Levenberg−Marquardt backpropagation training algorithm used a second-order training speed without Hessian matrix computation so that the algorithm is fast and efficient. However, the Levenberg−Marquardt backpropagation training algorithm is not suitable for a very large number of data. One of the setbacks of the Levenberg−Marquardt backpropagation training algorithm is that the algorithm needs a large amount of storage for the derived matrices, which can be quite large for some complex problems and data [43]. To date, the Levenberg−Marquardt backpropagation training algorithm has performed well in pattern recognition [41,43].
In the future, this study will be used as the basis for the development of a robotic lower limb prosthesis conducted in CBIOM3S, Universitas Diponegoro, in collaboration with a neurosurgeon affiliated with Dr. Kariadi General Hospital, Central Java, Indonesia. The signal results for muscle strength measurements using Myomes will be recorded to train the robotic lower limb prosthesis user and customize them to create an ergonomic product. Comfortable prosthesis may increase amputees’ quality of life.

6. Conclusions

A study on EMG signal pattern recognition, acquired from three general lower limb human gait movements, was presented. A two-layer feed-forward ANN network was selected as the machine learning method to classify three classes. Three classes, i.e., initial contact, which is labeled as initial gait, loading response to the terminal stance, which is labeled as mid-gait, and pre-swing to terminal swing, which is labeled as final gait, were associated with the segmented EMG signals. The ANN algorithm used and compared six training accuracy methods, i.e., the Levenberg−Marquardt backpropagation training algorithm, quasi−Newton training method, Bayesian regulation backpropagation training method, gradient descent backpropagation, gradient descent with adaptive learning rate backpropagation and one-step secant backpropagation. The machine learning study performs well, classifying three classes of human walking gait with an overall accuracy (training, testing, and validation) of 96% for Levenberg−Marquardt backpropagation, respectively. According to the accuracy results, Levenberg-Marquardt backpropagation outperformed other methods. This result can be used as a preliminary study for lower-limb prosthesis to improve its ergonomic factor. In future works, other machine learning methods will be examined and compared with the presently proposed method.
Human gait classification using EMG signals, as presented in this study, has potential application as a form of motor control related to robotic lower limb prosthesis. Gait classification and EMG signal measurement can be used to develop a customized lower limb prosthesis for each subject, as people walk at different speeds.
Future works related to this research will include another means of gait measurement using myomes, such as ease of walking, climbing up and down the stairs and walking on an uphill terrain. This study will also evaluate myomes using the future myomes channel and filter, aiming to perfect these so they can be used as a measurement tool for robotic lower limb prosthetics. These have been developing in CBIOM3S.

Author Contributions

Conceptualization, F.T.P. and W.C.; methodology, F.T.P. and W.C.; software, F.T.P. and W.C.; validation, F.T.P. and W.C.; formal analysis, F.T.P. and W.C.; investigation F.T.P. and H.P.; resources, H.P. and R.I.; data curation, F.T.P. and H.P.; writing—original draft preparation, F.T.P. and W.C.; writing—review and editing, F.T.P., W.C., G.K., A.G. and R.I.; visualization, F.T.P.; supervision, W.C.; project administration, R.T.I. and W.C.; funding acquisition, W.C., G.K. and A.G. All authors have read and agreed to the published version of the manuscript.

Funding

The authors acknowledge the Polish National Agency for Academic Exchange (NAWA) No. BPN/ULM/2022/1/00139/U/00001 for financial support.

Informed Consent Statement

Informed consent was obtained from all subjects involved in the study.

Data Availability Statement

Data is available upon request.

Conflicts of Interest

The authors declare no conflict of interest.

References

  1. Garg, U.; Sharma, R.G.; Bansal, K.; Goel, K.; Brahmbhatt, H. Lower Limb Amputations- A Necessary Evil- An Observational Study from a North Indian Tertiary Care Hospital. J. Evol. Med Dent. Sci. 2020, 9, 995–999. [Google Scholar] [CrossRef]
  2. Priyadharshan, K.P.; Kumar, N.; Shanmugam, D.; Kadambari, D.; Kar, S.S. Quality of life in lower limb amputees: A cross-sectional study from a tertiary care center of South India. Prosthet. Orthot. Int. 2022, 46, 246–251. [Google Scholar] [CrossRef] [PubMed]
  3. Giesberts, B.; Ennion, L.; Hjelmstrom, O.; Karma, A.; Lechler, K.; Hekman, E.; Bergsma, A. The modular socket system in a rural setting in Indonesia. Prosthet. Orthot. Int. 2017, 42, 336–343. [Google Scholar] [CrossRef] [PubMed] [Green Version]
  4. Latif, T.; Ellahi, C.M.; Rabbani, K.S.; Choudury, T.A. Design of A Cost Effective EMG Driven Bionic Leg. In Proceedings of the International Conference on Electrical and Computer Engineering (ICECE), Dhaka, Bangladesh, 20–22 December 2008. [Google Scholar] [CrossRef]
  5. Davie-Smith, F.; Coulter, E.; Kennon, B.; Wyke, S.; Paul, L. Factors influencing quality of life following lower limb amputation for peripheral arterial occlusive disease. Prosthet. Orthot. Int. 2017, 41, 537–547. [Google Scholar] [CrossRef] [Green Version]
  6. Fleming, A.; Stafford, N.; Huang, S.; Hu, X.; Ferris, D.P.; Huang, H. Myoelectric Control of Robotic Lower Limb Prostheses: A Review of Electromyography Interfaces, Control Paradigms, Challenges and Future Directions. J. Neural Eng. 2021, 18, 041004. [Google Scholar] [CrossRef]
  7. Mokri, C.; Bamdad, M.; Abolghasemi, V. Muscle force estimation from lower limb EMG signals using novel optimised machine learning techniques. Med. Biol. Eng. Comput. 2022, 60, 683–699. [Google Scholar] [CrossRef]
  8. Sengchuai, K.; Kanjanaroat, C.; Jaruenpunyasak, J.; Limsakul, C.; Tayati, W.; Booranawong, A.; Jindapetch, N. Development of a Real-Time Knee Extension Monitoring and Rehabilitation System: Range of Motion and Surface EMG Measurement and Evaluation. Healthcare 2022, 10, 2544. [Google Scholar] [CrossRef]
  9. Kaur, M.; Mathur, S.; Bhatia, D.; Verma, S. EMG Analysis for Identifying Walking Patterns in Healthy Males. In Proceedings of the 11th Conference on PhD Research in Microelectronics and Electronics (PRIME), Glasgow, UK, 29 June–2 July 2015. [Google Scholar] [CrossRef]
  10. Ghalyan, M.F.; A Alher, M.; Jweeg, M.J. Human Gait Cycle Classification Improvements Using Median and Root Mean Square Filters Based on EMG Signals. In Proceedings of the 4th International Conference on Engineering Sciences (ICES), Kerbala, Iraq, 5–6 December 2020. [Google Scholar] [CrossRef]
  11. Morbidoni, C.; Cucchiarelli, A.; Fioretti, S.; Di Nardo, F. A Deep Learning Approach to EMG-Based Classification of Gait Phases during Level Ground Walking. Electronics 2019, 8, 894. [Google Scholar] [CrossRef] [Green Version]
  12. Kim, P.; Lee, J.; Shin, C.S. Classification of Walking Environments Using Deep Learning Approach Based on Surface EMG Sensors Only. Sensors 2021, 21, 4204. [Google Scholar] [CrossRef]
  13. Lestari, W.D.; Ismail, R.; Danaryanto, A.T.; Jamari, J.; Bayuseno, A.P.; Nugroho, A. The Effect of The Machining Process UHMWPE on the Wear Behaviour of Acetabular Cups for Hip Implants. JMechE 2022, 19, 19–32. [Google Scholar] [CrossRef]
  14. Caesarendra, W.; Putri, F.T.; Ariyanto, M.; Setiawan, J.D. Pattern recognition methods for multi stage classification of parkinson’s disease. In Proceedings of the 2015 IEEE International Conference on Advanced Intelligent Mechatronics (AIM), Busan, Republic of Korea, 7–11 July 2015. [Google Scholar]
  15. Setiawan, J.D.; Ariyanto, M.; Nugroho, S.; Munadi, M.; Ismail, R. A soft exoskeleton glove incorporating motor-tendon actuator for hand movements assistance. Int. Rev. Autom. Control 2020, 13, 1–11. [Google Scholar] [CrossRef]
  16. Widhata, D.; Ismail, R. Water hyacinth (eceng gondok) as fibre reinforcement composite for prosthetics socket. IOP Conf. Ser. Mater. Sci. Eng. 2019, 598, 012127. [Google Scholar] [CrossRef]
  17. Fergiawan, P.; Anggoro, P.; Ismail, R.; Jamari, J.; Bayuseno, A. Application of computer-aided reverse engineering system in the design of orthotic boots for clubfoot patients. J. Southwest Jiaotong Univ. 2021, 56, 405–418. [Google Scholar] [CrossRef]
  18. Fitriyana, D.F.; Nugraha, F.W.; Laroybafih, M.B.; Ismail, R.; Bayuseno, A.P.; Muhamadin, R.C.; Ramadan, M.B.; Qudus, A.R.; Siregar, J.P. The effect of hydroxyapatite concentration on the mechanical properties and degradation rate of biocomposite for biomedical applications. IOP Conf. Ser. Earth Environ. Sci. 2022, 969, 012045. [Google Scholar] [CrossRef]
  19. Ismail, R. Muscle Power Signal Acquisition Monitoring Using Surface EMG. J. Biomed. Res. Env. Sci. 2022, 3, 665–668. [Google Scholar] [CrossRef]
  20. Clancy, E.; Morin, E.; Merletti, R. Sampling, noise-reduction and amplitude estimation issues in surface electromyography. J. Electromyogr. Kinesiol. 2002, 12, 1–6. [Google Scholar] [CrossRef]
  21. Winter, D.A. Biomechanics and Motor Control of Human Movement; John Wiley and Sons: Hoboken, NJ, USA, 2009. [Google Scholar] [CrossRef]
  22. Cheng, H.F.; Zhang, Y.; Zhang, Z.; Fang, Y.; Liu, H. Exploring the relation between EMG sampling frequency and hand motion recognition accuracy. In Proceedings of the 2017 IEEE International Conference on Systems, Man, and Cybernetics (SMC), Banff, AB, Canada, 5–8 October 2017. [Google Scholar] [CrossRef]
  23. Hermens, H.; Freriks, B.; Merletti, R.; Stegeman, D.; Blok, J.; Rau, G.; Disselhorst-Klug, C.; Hägg, G. European Recommendations for Surface ElectroMyoGraphy. SENIAM Project. 1999. Available online: http://www.seniam.org/pdf/contents8.PDF (accessed on 20 January 2023).
  24. Merlo, A.; Bò, M.C.; Campanini, I. Electrode Size and Placement for Surface EMG Bipolar Detection from the Brachioradialis Muscle: A Scoping Review. Sensors 2021, 21, 7322. [Google Scholar] [CrossRef]
  25. Rainoldi, A.; Melchiorri, G.; Caruso, I. A method for positioning electrodes during surface EMG recordings in lower limb muscles. J. Neurosci. Methods 2004, 134, 37–43. [Google Scholar] [CrossRef]
  26. Vaughan, C.L.; Davis, B.L.; O’Conner, J.C. Dynamics of Human Gait, 2nd ed.; Kiboho Publishers: Cape Town, South Africa, 1999. [Google Scholar]
  27. Blaya, J.; Herr, H. Adaptive control of a variable-impedance ankle-foot orthosis to assist drop-foot gait. IEEE Trans. Neural Syst. Rehabil. Eng. 2004, 12, 24–31. [Google Scholar] [CrossRef]
  28. Kotiadis, D.; Hermens, H.; Veltink, P. Inertial Gait Phase Detection for control of a drop foot stimulator: Inertial sensing for gait phase detection. Med Eng. Phys. 2010, 32, 287–297. [Google Scholar] [CrossRef]
  29. Preece, S.J.; Kenney, L.P.; Major, M.J.; Dias, T.; Lay, E.; Fernandes, B.T. Automatic identification of gait events using an instrumented sock. J. Neuroeng. Rehabil. 2011, 8, 32. [Google Scholar] [CrossRef] [PubMed] [Green Version]
  30. Gouwanda, D.; Gopalai, A.A. A robust real-time gait event detection using wireless gyroscope and its application on normal and altered gaits. Med Eng. Phys. 2015, 37, 219–225. [Google Scholar] [CrossRef] [PubMed]
  31. Pappas, I.P.I.; Keller, T.; Mangold, S.; Popovic, M.R.; Dietz, V.; Morari, M. A reliable gyroscope-based gait-phase detection sensor embedded in a shoe insole. IEEE Sens. J. 2004, 4, 268–274. [Google Scholar] [CrossRef]
  32. Ghoussayni, S.; Stevens, C.; Durham, S.; Ewins, D. Assessment and validation of a simple automated method for the detection of gait events and intervals. Gait Posture 2003, 20, 266–272. [Google Scholar] [CrossRef] [PubMed]
  33. Srivises, W.; Nilkhamhang, I.; Tungpimolrut, K. Design of a smart shoe for reliable gait analysis using state transition theory. In Proceedings of the 9th International Conference on Electrical Engineering/Electronics, Computer, Telecommunications and Information Technology, Phetchaburi, Thailand, 16–18 May 2012; pp. 1–4. [Google Scholar] [CrossRef]
  34. Bae, J.; Tomizuka, M. Gait phase analysis based on a hidden Markov model. Mechatronics 2011, 21, 961–970. [Google Scholar] [CrossRef]
  35. Lauer, R.T.; Smith, B.T.; Betz, R.R. Application of a neuro-fuzzy network for gait event detection using electromyography in the child with cerebral palsy. IEEE Trans. Biomed. Eng. 2005, 52, 1532–1540. [Google Scholar] [CrossRef]
  36. Babu, S.S.; Nutakki, C.; Diwakar, S. Classification of Human Gait: Swing and Stance Phases using Sum-Vector Analysis. Procedia Comput. Sci. 2020, 171, 403–409. [Google Scholar] [CrossRef]
  37. Hulleck, A.A.; Mohan, D.M.; Abdallah, N.; El Rich, M.; Khalaf, K. Present and future of gait assessment in clinical practice: Towards the application of novel trends and technologies. Front. Med. Technol. 2022, 4, 901331. [Google Scholar] [CrossRef]
  38. Patil, P.; Kumar, K.; Gaud, N.; Semwal, V.B. Clinical Human Gait Classification: Extreme Learning Machine Approach. In Proceedings of the 1st International Conference on Advances in Science, Engineering and Robotics Technology, Dhaka, Bangladesh, 3–5 May 2019. [Google Scholar] [CrossRef]
  39. Joshi, C.D.; Lahiri, U.; Thakor, N.V. Classification of Gait Phases from Lower Limb EMG: Application to Exoskeleton Orthosis. In Proceedings of the Point of Care Healthcare Technologies, Bangalore, India, 16–18 January 2013. [Google Scholar] [CrossRef]
  40. Orooji, A.; Shanbehzadeh, M.; Mirbagheri, E.; Kazemi-Arpanahi, H. Comparing artificial neural networktraining algorithms to predict length of stay in hospitalized patients with COVID-19. BMC Infect. Dis. 2022, 22, 923. [Google Scholar] [CrossRef]
  41. Narayan, J.; Jhunjhunwala, S.; Mishra, S.; Dwivedy, S.K. A comparative performance analysis of backpropagation training optimizers to estimate clinical gait mechanics. In Predictive Modeling in Biomedical Data Mining and Analysis; Academic Press: Cambridge, MA, USA, 2022; pp. 83–104. [Google Scholar] [CrossRef]
  42. Baptista, F.D.; Rodrigues, S.; Morgado-Dias, F. Performance comparison of ANN training algorithm for classification. In Proceedings of the Intelligent Signal Processing, Funchal, Portugal, 16–18 September 2013. [Google Scholar] [CrossRef]
  43. Karim, H.; Niakan, S.R.; Safidari, R. Comparison of neural network training algorithms for classification of heart disease. Int. J. Artif. Intell. 2018, 7, 185–189. [Google Scholar] [CrossRef] [Green Version]
Figure 1. Myomes, EMG meter: (a) Parts and (b) electrode.
Prosthesis 05 00046 g001
Figure 2. Muscle location of myomes’ attachment: (a) gastrocnemius lateral head; (b) biceps’ femoris longus; (c) electrode attachment.
Prosthesis 05 00046 g002
Figure 3. Three gait segmentation for classification.
Prosthesis 05 00046 g003
Figure 4. EMG signal gait partition: (a) initial contact to mid stance (initial gait), (b) terminal stance to preswing (mid−gait), and (c) initial swing to terminal swing (final gait).
Prosthesis 05 00046 g004
Figure 5. ANN network structure [17].
Prosthesis 05 00046 g005
Figure 6. ANN model and network structure used in this study.
Prosthesis 05 00046 g006
Figure 7. EMG signal recorded from male study participant (Subject 1), gastrocnemius lateral head: (a) Pace 1, (c) Pace 2, (e) Pace 3, (g) Pace 4, (i) Pace 5; and biceps femoris longus: (b) Pace 1, (d) Pace 2, (f) Pace 3, (h) Pace 4, (j) Pace 5.
Prosthesis 05 00046 g007aProsthesis 05 00046 g007b
Figure 8. MSE value: (a) Levenberg−Marquardt backpropagation training algorithm, (b) quasi−Newton training method, (c) Bayesian regulation backpropagation training method, (d) gradient descent backpropagation, (e) gradient descent with adaptive learning rate backpropagation and (f) one-step secant backpropagation.
Prosthesis 05 00046 g008
Figure 9. Regression diagram: (a) Levenberg−Marquardt backpropagation training algorithm; (b) quasi−Newton training method; (c) Bayesian regulation backpropagation training method; (d) gradient descent backpropagation; (e) gradient descent with adaptive learning rate backpropagation; (f) one-step secant backpropagation.
Prosthesis 05 00046 g009
Table 1. Participants’ data.
ParticipantsSexAge
(Years Old)
Height (cm)Weight (kg)BMI
Subject 1Male2516871.525
Subject 2Male3217073.324
Subject 3Female2216061.4424
Subject 4Female3415553.522
Table 2. Training accuracy and confusion matrix comparison between research participants.
Subject 1
Training AlgorithmLMQNBYGDGDAOSS
Actual ClassIGMGFGIGMGFGIGMGFGIGMGFGIGMGFGIGMGFG
IG6007111033302225222144
MG121290070027102313235
FG005109007012755276321
Accuracy (%)851008370909010030301009090837790707770
Total accuracy (%)938380938374
Subject 2
Training algorithmLMQNBYGDGDAOSS
Actual classIGMGFGIGMGFGIGMGFGIGMGFGIGMGFGIGMGFG
IG29102820231229112511529813
MG027022534293029031931220
FG123003273025102920220017
Accuracy (%)9790100938390779783979797836373977357
Total accuracy (%)968986977376
Subject 3
Training algorithmLMQNBYGDGDAOSS
Actual classIGMGFGIGMGFGIGMGFGIGMGFGIGMGFGIGMGFG
IG271120212731282227772443
MG029122522252127032303205
FG302883271227112800233622
Accuracy (%)909793678390908390939093907790806773
Total accuracy (%)938088928673
Subject 4
Training algorithmLMQNBYGDGDAOSS
Actual classIGMGFGIGMGFGIGMGFGIGMGFGIGMGFGIGMGFG
IG271123312823261123962582
MG229372652262427062023224
FG102601240225222911222024
Accuracy (%)909787778780938783879097776773837380
Total accuracy (%)918188917279
Table 3. Training accuracy and confusion matrix comparison for all participants.
Training AlgorithmLMQNBYGDGDAOSS
Actual ClassIGMGFGIGMGFGIGMGFGIGMGFGIGMGFGIGMGFG
IG11235108861101071000310511690149
MG511774100841026911540991169911
FG30108812106681071151131510113147100
Accuracy (%)939890908388928589839694888394758383
Total accuracy (%)948789918880
Table 4. Overall accuracy (training, testing, and validation) and confusion matrix comparison between each participant.
Subject 1
Training AlgorithmLMQNBYGDGDAOSS
Actual ClassIGMGFGIGMGFGIGMGFGIGMGFGIGMGFGIGMGFG
IG700611810232115101914
MG041170072015241421140
FG008003016011810160317
Accuracy (%)1001008975887510078751008386759389957881
Total accuracy (%)958084908585
Subject 2
Training algorithmLMQNBYGDGDAOSS
Actual classIGMGFGIGMGFGIGMGFGIGMGFGIGMGFGIGMGFG
IG212118711400181119201821
MG020121503281120101551184
FG001701184026101903180315
Accuracy (%)100918990659567100969095901007578957875
Total accuracy (%)948289928482
Subject 3
Training algorithmLMQNBYGDGDAOSS
Actual classIGMGFGIGMGFGIGMGFGIGMGFGIGMGFGIGMGFG
IG192218202422201017341311
MG018151320234117312131193
FG002002200120011901126216
Accuracy (%)10090877876911008877958986948463658680
Total accuracy (%)928288908177
Subject 4
Training algorithmLMQNBYGDGDAOSS
Actual classIGMGFGIGMGFGIGMGFGIGMGFGIGMGFGIGMGFG
IG213116202011182117311712
MG019122032243119121713160
FG101611181123101910201220
Accuracy (%)958689849186879285909090858591818491
Total accuracy (%)908788908785
Table 5. Overall accuracy (training, testing and validation) and confusion matrix comparison for all participants.
Training AlgorithmLMQNBYGDGDAOSS
Actual ClassIGMGFGIGMGFGIGMGFGIGMGFGIGMGFGIGMGFG
IG750278148427462705870512
MG1981664610988785478416721
FG33792187363874169356971069
Accuracy (%)959796917788859390879292888988848384
Total accuracy (%)968589908884
Table 6. Comparison between this research and previous research regarding EMG signal classification using the machine learning method.
ResearchMuscle MeasurementClassMachine Learning MethodAccuracy
Morbidoni, et al. [11]Tibialis anterior, gastrocnemius lateralis, hamstring, and vastus lateralis2 classes (stance and swing phase)ANN with architectures variation94.9%
Ghalyan, et al. [10]Soleus, tibialis anterior, gastrocnemius lateralis, vastus lateralis, rectus femoris, biceps femoris and gluteus maximus2 classes (stance and swing phase)SVM with a median filter95.3%
Logistic regression with RMS filter72.9%
KNN with a median filter99.8%
Decision tree with median filter98.4%
Random forest with median filter 97.2%
Joshi, et al. [39]Quadriceps, hamstring, tibialis anterior, gastrocnemius8 classes (initial contact, loading response, mid stance, terminal stance, preswing, initial swing, mid swing, and terminal swig)LDA with Bayesian information criteria (BIC)93.83%
This studyGastrocnemius lateral head and biceps femoris longus3 classes (initial contact, which is labeled as initial gait, loading response to the terminal stance, which is labeled as mid-gait, and preswing to terminal swing, which is labelled as final-gaitANN with various training algorithm methods96%
Table 7. ANN training algorithm variation for classification.
ResearchDatasetClassesBest Training AlgorithmAccuracy
Baptista, et al. [42]Parkinson’s1Bathp (recursive version of backpropagation)84%
Car Evaluation4Trainoss (one-step secant backpropagation)90%
Cardiotography I3Conjugate gradient95%
Cardiotography II10Trainbr (Bayesian regulation backpropagation)80%
Orooji [40]Length of stay in hospitalized patients with COVID 191Trainbr (Bayesian regulation backpropagation)98.7%
Karim, et al. [43]Heart disease patients3Trainlm (Levenberg−Marquardt backpropagation)91.75%
This studyBelow-limb EMG signals3Trainlm (Levenberg−Marquardt backpropagation)96%
Disclaimer/Publisher’s Note: The statements, opinions and data contained in all publications are solely those of the individual author(s) and contributor(s) and not of MDPI and/or the editor(s). MDPI and/or the editor(s) disclaim responsibility for any injury to people or property resulting from any ideas, methods, instructions or products referred to in the content.

