Article

Front Bumper Inclination on Vehicle Aerodynamic Performance: A Parametric Optimization Analysis

1
Research Laboratory in Science and Engineering, Faculty of Sciences and Techniques of Fez, Sidi Mohamed Ben Abdellah University, Fez 30000, Morocco
2
Department of Mechanical Engineering, Faculty of Mechanical Engineering, Transylvania University of Brasov, B-dul Eroilor 29, 500036 Brasov, Romania
3
Solid Mechanics Institute of Romanian Academy, Str C Mille, nr.15, 71342 Bucharest, Romania
*
Authors to whom correspondence should be addressed.
Vehicles 2025, 7(4), 130; https://doi.org/10.3390/vehicles7040130
Submission received: 20 September 2025 / Revised: 4 November 2025 / Accepted: 7 November 2025 / Published: 11 November 2025

Abstract

The study focuses on an advanced numerical framework designed to optimize an electric car’s aerodynamic efficiency through the slanting front bumper. The study begins with a comparative analysis of four angular configurations (−4°, 0°, 4°, and 8°) using computational fluid dynamics (CFD). It concludes that an angle of 4° improves resource productivity and dynastic balance by reducing drag (Cd = 0.26) and guaranteeing controlled lift (Cl = 0.030). In order to further this research, ANSYS DesignXplorer 2019 R3 was used for parametric optimization, which included direct parameterization of the angle in the simulation process. A quadratic response surface was constructed using the CFD findings, and an optimality point with a Cd value of 0.2601 and a Cl value of 0.0302 was found at 3.9998°. Because this solution is part of the Pareto front, its use demonstrates the significance of the chosen geometric configuration. The approach is innovative because it combines a simple geometric transformation with an automated, repeatable simulation method to a degree appropriate for an industrial setting. The results show that modifying the front bumper in a particular way is a successful way to improve the aerodynamic performance of electric vehicles, with the added potential to function at other required locations on the vehicle body.

1. Introduction

In automotive technology, increasing the energy performance of vehicles has become a substantial challenge, whether the powertrain is internal combustion or otherwise. Aerodynamic optimization is one of the primary levers to arrive at this, as the drag explains a substantial part of resistance to movement, particularly at high accelerations. Ensuring reduced drag results in a direct reduction in energy or fuel consumption, stability, and general performance of the vehicle. Therefore, the performance of a vehicle is determined mostly by its aerodynamic performance, especially the drag and lift coefficients. Various research studies have been carried out to examine different approaches that can be used to reduce these unwanted outcomes and maximized overall efficiency.
Various research works have identified various methods to reduce the unwanted effects and enhance the aerodynamic efficiency of vehicles. These optimization and simulation tools are commonly applied to engineering such as genetic algorithms in production and maintenance planning [1], mixed finite element methods in fluid dynamics [2], and isogeometric analysis [3]. Rear diffusers have been effective in the previous case, in recovery of pressure and reduction of drag, when the angle and length of the rear diffuser are well managed to reduce the frequency of the wake turbulence [4,5]. The rear shape and pillar geometry of the vehicle also affect the stability in crosswind conditions [6], and optimization schemes with a combination of statistical, neural network, and genetic algorithms have been demonstrated to minimize aerodynamic drag and noise reduction at the same time [7].
Active aerodynamic systems including dynamic spoilers and blowing control are introduced to reduce the drag and increase energy efficiency [8,9]. The underbody design with fairings and curved diffusers improves the lift behavior and reduces drag [4,8]. The flow stabilization and pressure distribution are enhanced by the optimal positioning of wheels and the application of deflectors [10,11,12] has shown that the specific CFD model to be used (in this case the type of mesh and turbulence model) affects the aerodynamic outcome to a great extent, and that a good trade-off of accuracy to computational cost is a hybrid RANS-LES model. Experiments in wind tunnels confirm that an appropriate mix of underbody diffusers, active systems, and front-end optimizations can dramatically decrease drag and increase stability [4,13,14,15], and small things like exhaust pipe placement can affect aerodynamic performance by up to 41% [16], the significance of the overall optimization of the vehicle.
Other researchers have focused on the front part of the vehicle. Ref. [17] optimized the nose shape of a Formula Student car using the adjoint method such that the drag of the vehicle was reduced by 27% as well as reducing the fuel consumption by 27%. Experimental data confirm their work, which indicates dramatic enhancement in aerodynamic performance because of their decreased wake. Also, ref. [18] suggests an organization of parametric optimization of aerodynamic shapes in ANSYS DesignXplorer and Fluent. Modifiable parameters of geometric properties are defined through quantification of the individual properties and construction of response models is performed by simulating various configurations with the use of a design of experiments (DoE). This multi-objective-based method is most effective in terms of reducing drag and managing lift and fewer simulations are needed in this compared to the conventional way of doing it and so the overall performance of the aerodynamics is also optimized.
Researchers have applied their investigation to sports vehicles and race cars (such as Formula SAE) for proving the significance of front-installed aerodynamic features like front wings and spoilers in controlling lift and drag [19,20]. Vehicle energy efficiency benefits substantially from both changes made to windshield angles at front and rear positions [21] and the application of frontal deflectors [22].
The application of deflectors under the front bumper has been examined using both scaled models and Kriging optimization techniques to prove their capability of guiding airflow and decreasing drag [23]. Vehicle drag decreased by 13.18% while lift decreased by 13.93% after testing multiple passenger vehicle configurations through bumper modification [24]. Various recent studies show that the front windshield angle together with the hood slope plays a vital function in wake development and vehicle performance [25,26].
Finally, researchers have conducted multiple investigations into different shapes which minimize aerodynamic losses. The research investigates the front vehicle area by analyzing the bumper together with the hood and windshield regions. The investigation conducted by [27] discovered that elevating front bumper incline angles together with modifying hood curvature diameters leads to decreases in drag coefficient values. Scientists have achieved significant improvements in the aerodynamics by optimizing the lateral design of the front bumper according to research [28]. The influence of front shape upon drag has also been shown in experimental work upon agricultural vehicles, although the maximum difference is a comparatively small 3 percent [29].
Numerous past research studies on the issue of vehicle aerodynamic have been dedicated towards the enhancement of airflow in the rear and underbody of the vehicle, including the optimization of the rear diffuser, the underfloor flow, and the rear spoiler. As an illustration, a number of studies on front grille and hood geometry have shown that it is possible to potentially reduce the value of the drag coefficient to as low as 26% by redesigning the frontal area and profile of the bonnet.
The vast majority of these investigations, however, were based on simplified geometries or focused on one aerodynamic goal (usually reducing drag), without a systematic examination of how front-end shape distortions affect the total vehicle stability, specifically using the lift coefficient (Cl) in realistic driving. The merits of such works are that it clearly shows the possibility of drag reduction. However, they also have significant drawbacks such as limited coverage of parameters, they do not consider front bumper inclination effects, and simultaneous consideration of both drag and lift performance, and need to be applicable only to modern vehicle design.
Judging by this review, the gap in the research can be defined as the lack of a comprehensive and systematic study on the impact of front bumper inclination angle, which would combine both indicators of aerodynamic performance, drag and lift, in the framework of multi-objective optimization that would be appropriate in the aerodynamics of electric vehicles. Whereas a few studies have examined the hood or bumper lip individually due to structural or styling considerations, it has not been used in studies to examine the combined aerodynamic effect of front bumper tilt on Cd and Cl at the same time.
Here, the current work suggests an efficient and repeatable methodology comprising parametric geometrical modeling of the front bumper, fully automated CFD, response surface analysis (RSM), and multi-objective optimization by ANSYS DesignXplorer. Such a strategy successfully fills in the gap in research as it allows for the improvement of drag and lift ratios simultaneously, offers a framework that is directly applicable to the automotive industry, and suggests improving the general picture of the aerodynamic impact of the front-end geometry in electric vehicles.
The article is divided into the following sections: Section 2 provides the geometric model, namely, a brief description of the vehicle model, and describes the different types of bumpers used at the front. The simulation methodology as described in Section 3 consists of two methods: the basic analysis of a typical CFD simulation conducted in ANSYS Fluent, and a parametric optimization run carried out with DesignXplorer. In Section 4, the findings of the two phases are discussed and the aerodynamic performance of the various configurations are compared with the best solution indicated. Section 5 also closes the study and provides some possible future research directions.

2. Geometrical Model

2.1. Vehicle Model Presentation

Our study employed Catia V5 for building a vehicle model to perform aerodynamic testing and optimize front bumper design properties. The chosen vehicle type represents a sedan which maintains basic modern electric vehicle features through a simplified geometric design. The vehicle body follows a streamlined design which decreases aerodynamic drag through its angled windshield and minimal side mirrors and body configuration optimized for minimal airflow disruptions, as shown in Figure 1.
The visual representation in Figure 2 shows that the sedan model has dimensions of 4600 mm in length, 2300 mm in width, and 1345 mm in height, with 200 mm ground clearance.

2.2. Presentation of Front Bumper Configurations

To analyze the impact of this inclination, four configurations were defined and studied using Ansys Fluent, as shown in Figure 3. The first configuration corresponds to the baseline model with a bumper positioned without inclination. The second configuration features a 4° forward inclination. The third configuration evaluates an inclination angle set to 8 degrees. The last configuration establishes a −4° reverse rotational angle.
The four angles (−4°, 0°, 4°, and 8°) were selected as a realistic range of front bumper angles commonly employed in the design of vehicles, so that the angle that minimizes drag without loss of stability could be determined. This choice gives the chance to study both positive and negative inclined directions to enable a complete parametric study in a physically realistic range of front-end vehicle geometry.

3. Simulation Methodology

  • Part 1—Initial Analysis Using Conventional Simulations in ANSYS Fluent
Analysis of front bumper inclination effects on vehicle aerodynamics was performed through numerical simulations under Ansys Fluent 2019 R3. Industry and research institutions heavily depend on this software because it provides exceptional solutions for Navier–Stokes equation modeling.

3.1. Mesh Description

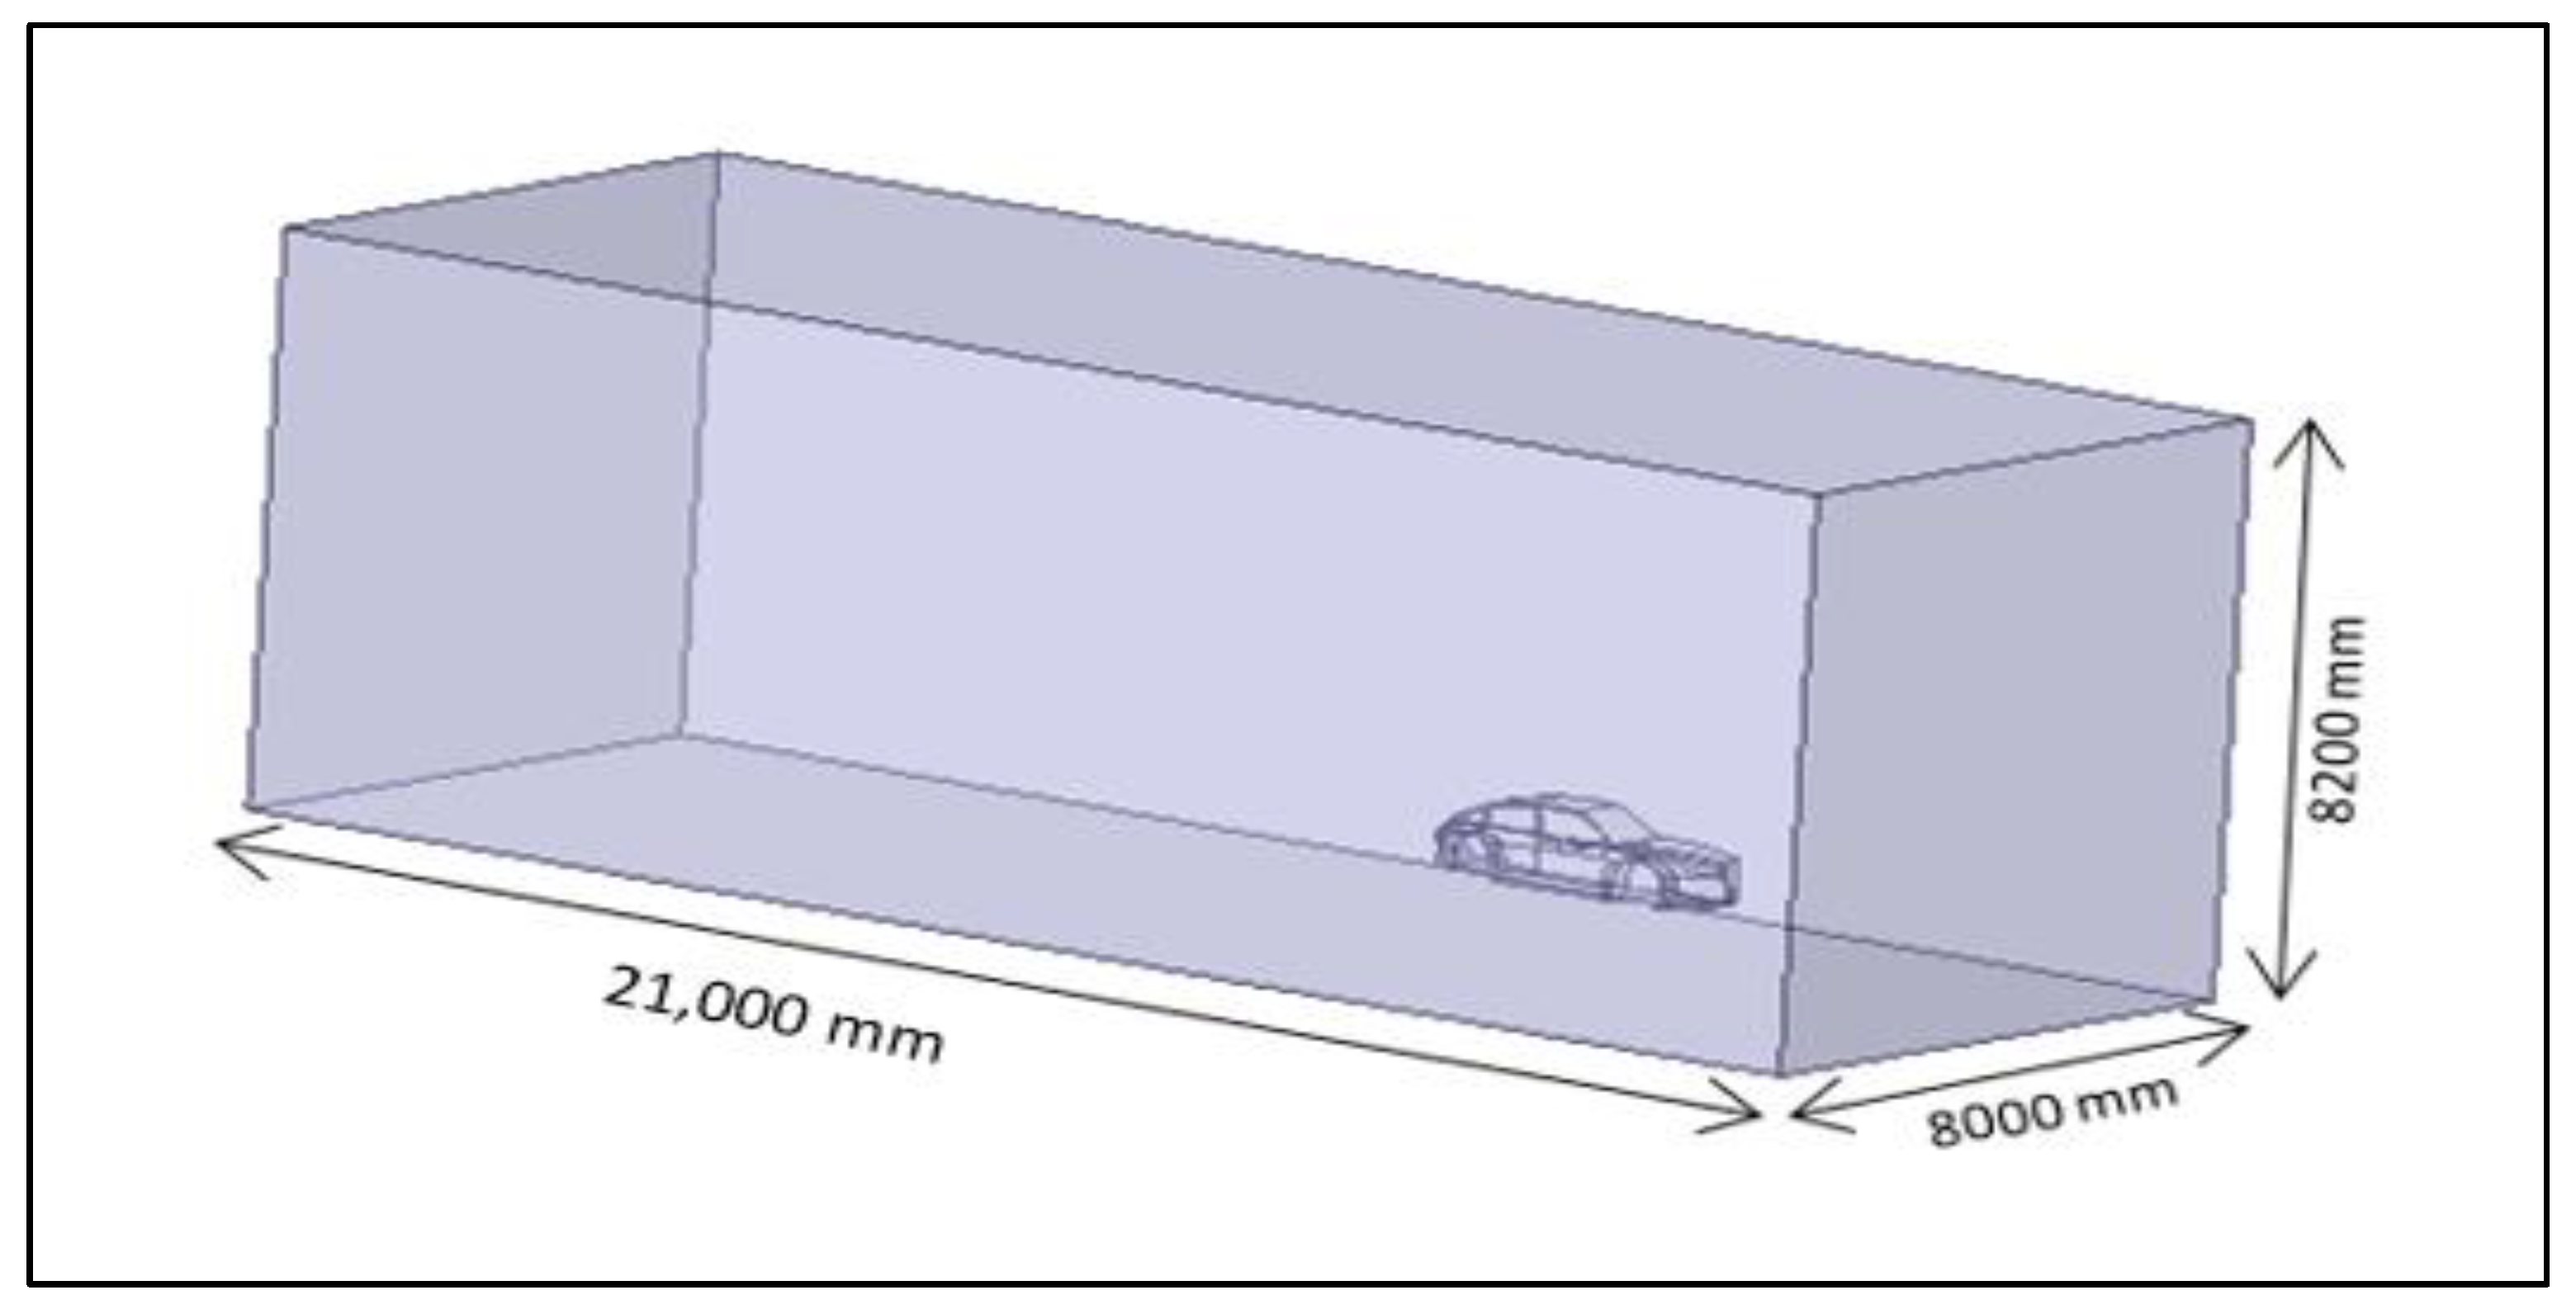
The numerical studies employed an idealized computational domain featuring identical rectangular dimensions throughout its cross-section. The dimensions for this model measure 21,000 mm for length alongside 8000 mm for width and 8200 mm for height (Figure 4). The model simulation of just half the vehicle cut down both running time and mesh resolution enhancement. Research validity is established because the symmetric vehicle designs permit symmetric flow analysis during simulations which run without crosswind conditions [30,31,32].
The development of an appropriate mesh occurred through ANSYS Mesh Tool operations. The simulation revealed the mesh displayed larger elements at the inner domain yet displayed smaller elements close to the vehicle as apparent in Figure 5. The mesh produced 715,973 nodes alongside 2,142,191 elements after completion.
To confirm that the aerodynamic results are not influenced by the mesh refinement, a mesh independence (convergence) study was conducted. Mesh densities (coarse, medium, and fine) were evaluated and aerodynamic coefficients Cd and Cl were found to be varied by less than 1.5% which proved mesh independence (Table 1). The computation domain was fine-grained with tetrahedra that had inflation layers that were near the vehicle surface in a bid to resolve the boundary layer correctly. All main simulations were with the medium mesh, which gave an adequate combination of accuracy and computation time.

3.2. Boundary Conditions

The research selected the realizable k-epsilon with an enhanced wall function turbulence model for analysis. The selected model functioned to enhance boundary layer performance which in turn increased predictive accuracy of aerodynamic forces including drag and lift. Such complex turbulent flows that surround vehicles are handled effectively by this model which demonstrates advanced capabilities to simulate flow separation and recirculation conditions.
Realistic airflow around the vehicle was replicated through a precise definition of the boundary conditions. The velocity inlet condition of the domain constitutes a speed of 30 m/s to represent vehicle motion. A decision to take an inlet velocity of 30 m/s (around 108 km/h) was made to represent a typical highway driving condition for a standard electric vehicle. With this speed, aerodynamic forces overtake energy performance, especially drag, which can explain 60 to 80 percent of the total resistance to a vehicle in motion. This speed can then be used to simulate realistic conditions in which the optimal shape of the front bumper can be optimized to have a detectable influence on the energy consumption and stability of the vehicle.
The specified boundary condition defines the outlet as a pressure outlet, as shown in Figure 6. To eliminate fluid–solid friction and represent moving ground conditions, the road surface was modeled as a moving wall which attained the same speed as air velocity (30 m/s). The computational domain minimizes boundary influences and reduces its friction effects through symmetry conditions that act on the top and side domains. The car body represents a static wall surface in this model, as shown in Table 2.
The simulation uses 1.608 m2 as characteristic area together with 4600 mm as reference length. The simulation models air as an incompressible flow which has a density set at 1.225 kg/m3 together with a dynamic viscosity value of 1.7894 × 10⁻⁵ kg/m.s. Regarding the Reynolds number, it is equal 9.45 × 10⁶ ≈ 1.0 × 10⁷. The Reynolds number at this level represents a fully developed regime of turbulent flow, which explains the applicability of realizable k-epsilon turbulence model, which has demonstrated effective predictions of the phenomena of separation, recirculation, and detachment of the boundary layer in the case of ground vehicles. Simulation experts define air temperature to be 288.16 K combined with a specific heat ratio of 1.4. Experimental test conditions and vehicle simulation standards are supported through these input parameters, as shown in Table 3.
  • Part 2—Parametric Optimization with DesignXplorer

3.3. Numerical Integration in ANSYS DesignXplorer

3.3.1. Objective of the Optimization

This step will lead to expanding the basic aerodynamic study by including a sophisticated numerical method to generate the effect of front bumper angle on the vehicle aerodynamic efficiency automatically. With the DesignXplorer tool (part of ANSYS Workbench), one can use a sophisticated numerical modeling process to explore a design space having many configurations in an automated way, because a design is parameterized and the parameterization is connected to the entire simulation process.
Whereas DesignXplorer simply enables the input and output parameters to be defined, what DesignXplorer also does is automatically rather than manually generate a design of experiments, build statistical models often called response surfaces, and determine performance optimum regions. This type of searching allows for exploring the design space rapidly, reliably, and completely compared to conventional limited-case testing.
It also institutionalizes a method which is suited to industrial scenes, where geometric optimization requirements must rest on the incorporation of tools that can be used to successfully process decisions. In this paper, this ability would be used to achieve the following aim of obtaining the optimal front bumper angle using a numerical technique in a reproducible, automated manner which is validated by CFD simulation.

3.3.2. Parameterization in ANSYS Workbench

In order to incorporate the geometric parameter into the optimization, parameterization was directly performed in the ANSYS Workbench. The vehicle geometry which had been created in a CATIA V5 system was exported in STEP format and subsequently imported to the ANSYS space claim.
During this module, the front bumper was submitted to a local rotation. The parameter manager of Workbench defined the slope angle as an input parameter. The parameter was then automatically connected to the other modules within the simulation workflow (Meshing, Fluent, and DesignXplorer) in order to keep up a consistency of propagation when automatic variation was completed, as shown in Figure 7.
Therefore, in every workflow of the design of experiments, Workbench will vary the bumper angle, refill the mesh, simulate the CFD analysis, and automatically import the output values of Cd and Cl. This complete coupling of the parameterized geometry and the Fluent solver with the optimization engine is the basis of the digital workflow that is used in the present study.

4. Results and Discussion

4.1. Comparative Analysis of the Four Manually Simulated Cases

4.1.1. Case One: 0° (Reference Configuration)

The 0° configuration functions as the reference point for all measurements. Such design provides a balanced drag coefficient at 0.27 because its perpendicular front surface enables consistent pressure distribution. The attached airflow in case two stays attached for a longer period which decreases overall separation losses. The underbody suction improved due to a lift coefficient value of 0.029, as shown in Table 4.
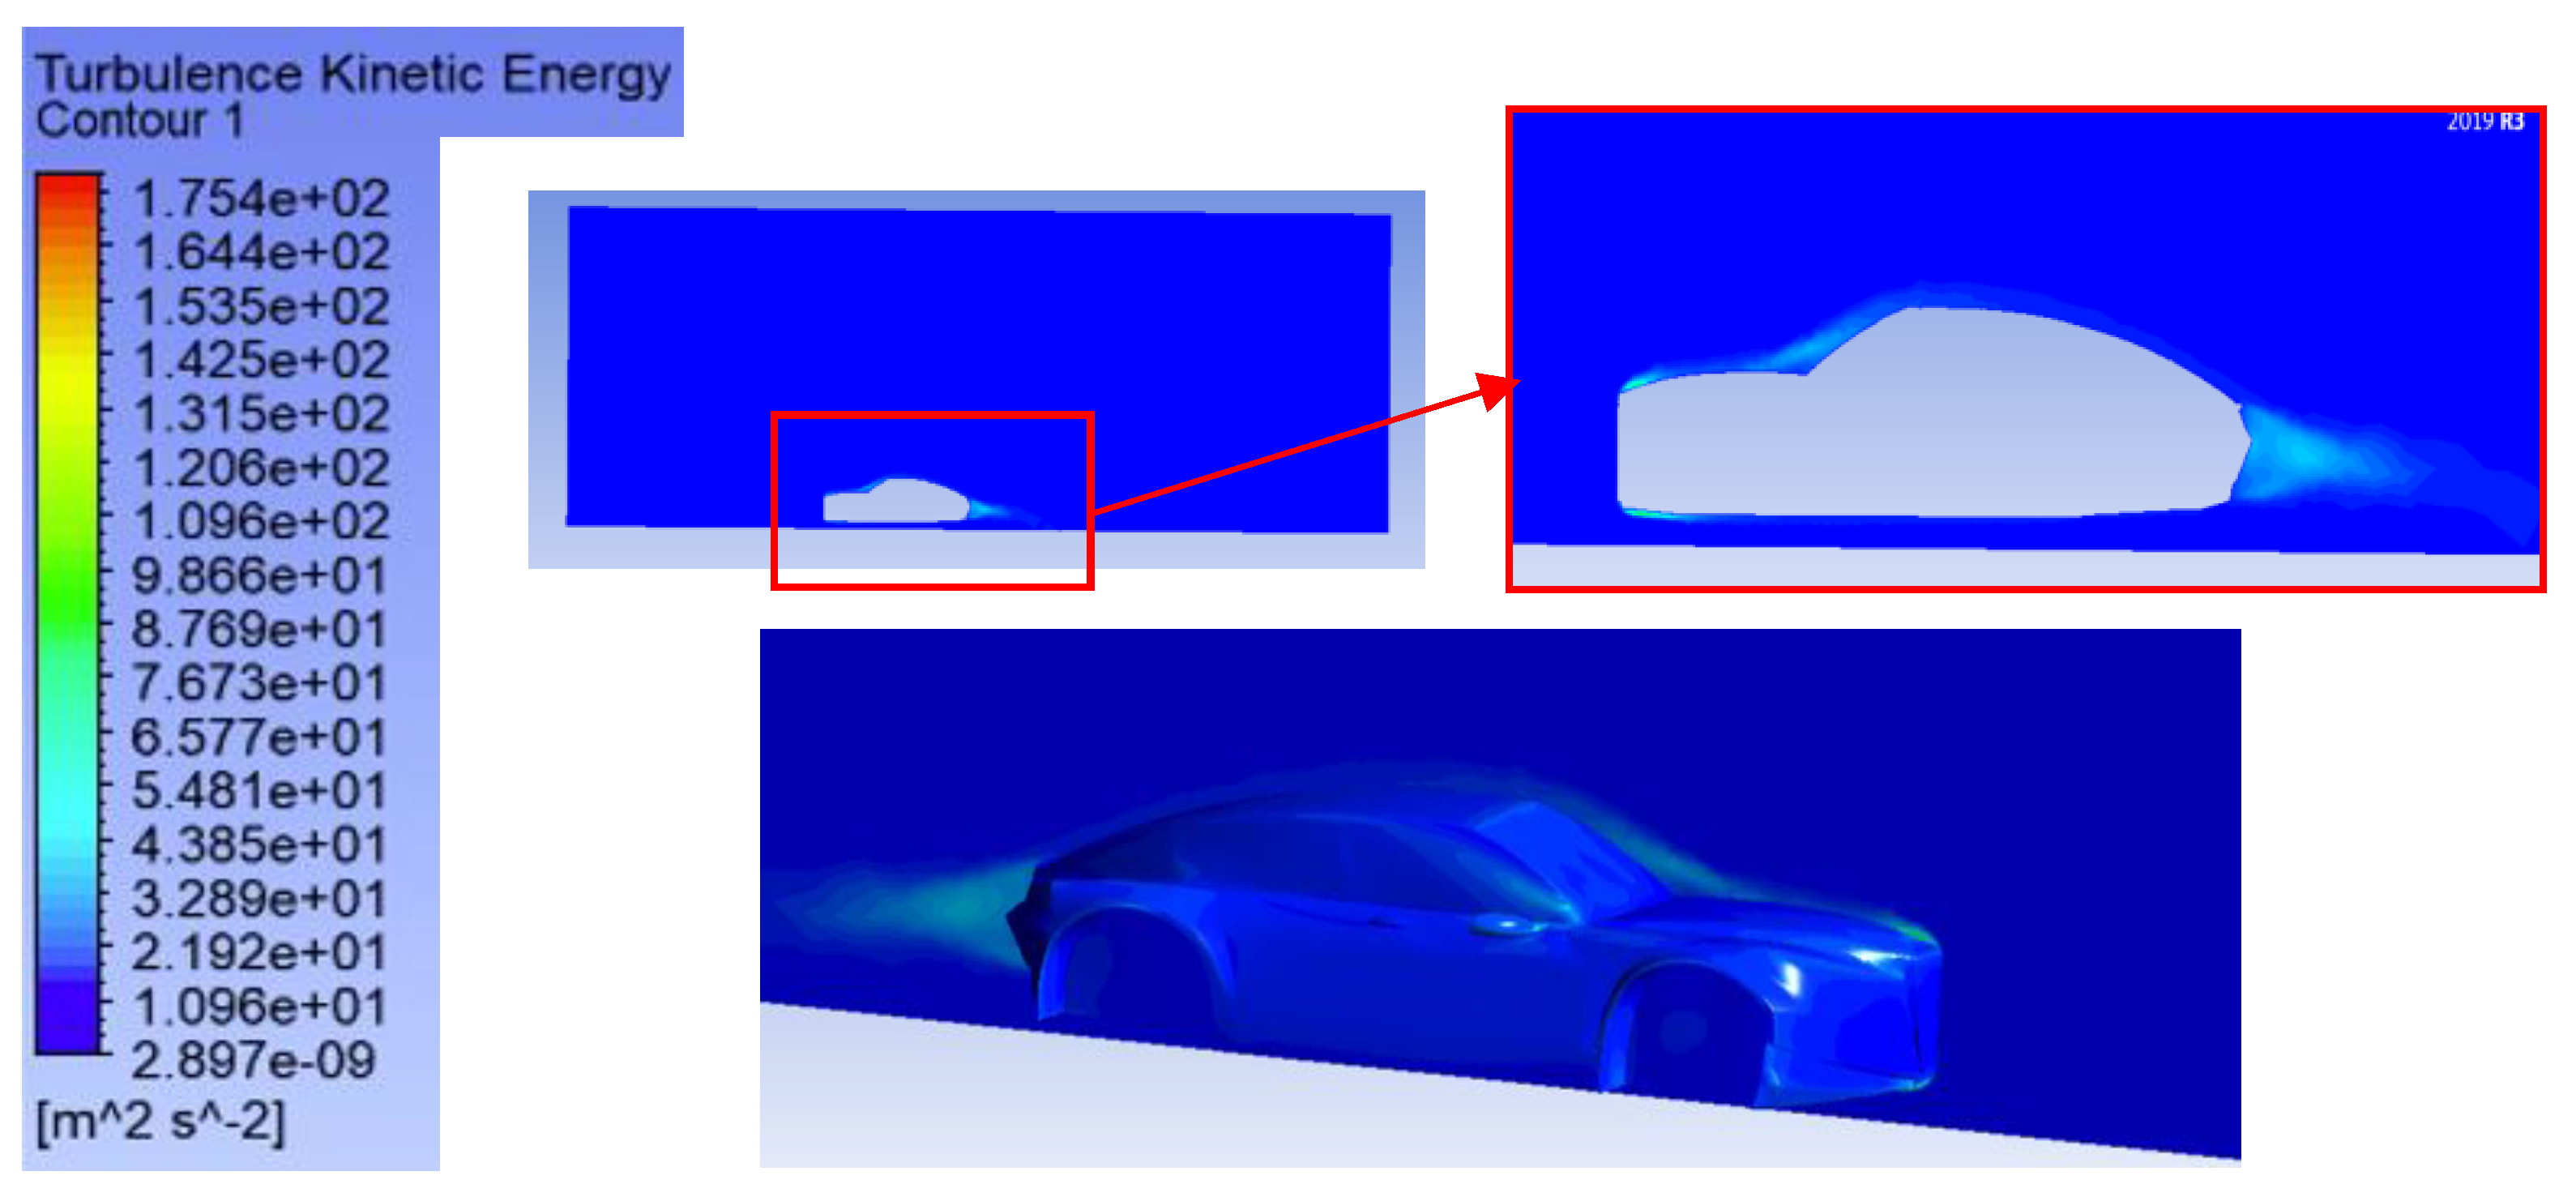
The airflow maintains a maximum velocity of 53.23 m/s, and the turbulent kinetic energy TKE, as shown in Figure 8, reaches 174.88 m2/s2. This demonstrates a powerful yet unoptimized airflow pattern. The current flow configuration stands as a stable symmetric system, although additional optimization measures are needed to reduce drag while controlling lift performance.

4.1.2. Case Two: 4° Bumper Angle

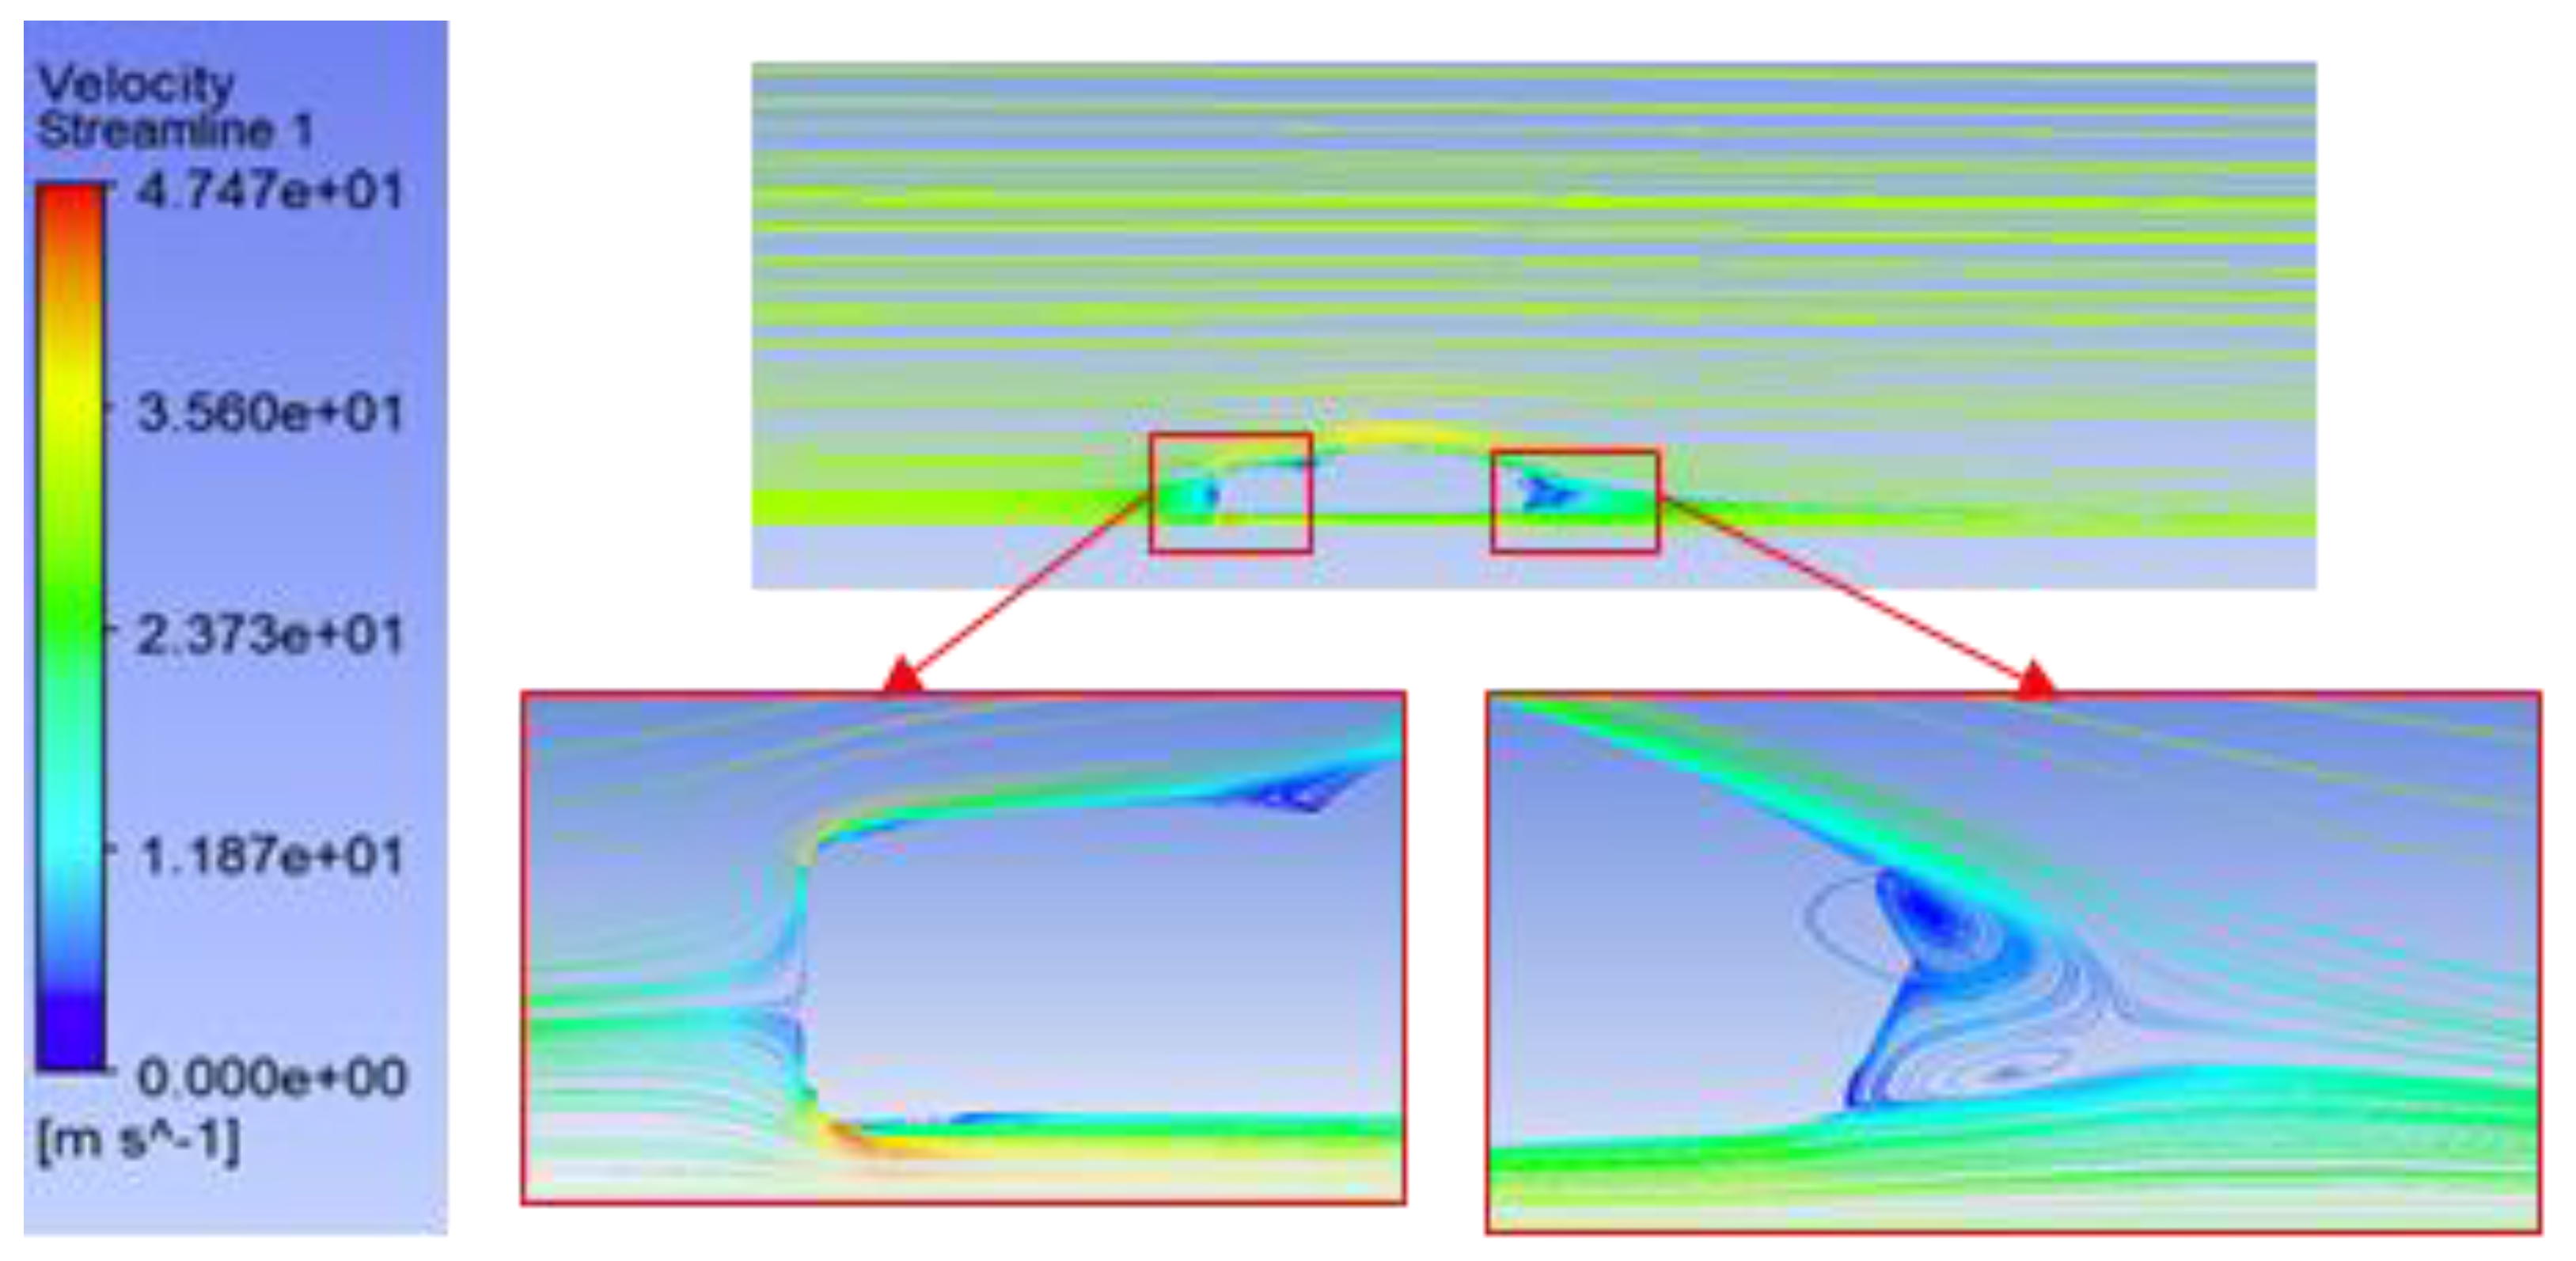
Among the studied cases, the 4° inclination demonstrates optimal aerodynamic performance. The front body receives optimized streamlining that delays flow separation while lowering pressure drag which results in a drag coefficient value of Cd = 0.26. A slight boost in lift coefficient (Cl = 0.030) occurs but stays within acceptable safety margins, thus maintaining the aerodynamic stability of the vehicle. The accelerating airflow located beneath the bumper creates low-pressure zones which results in a marginally increased lift.
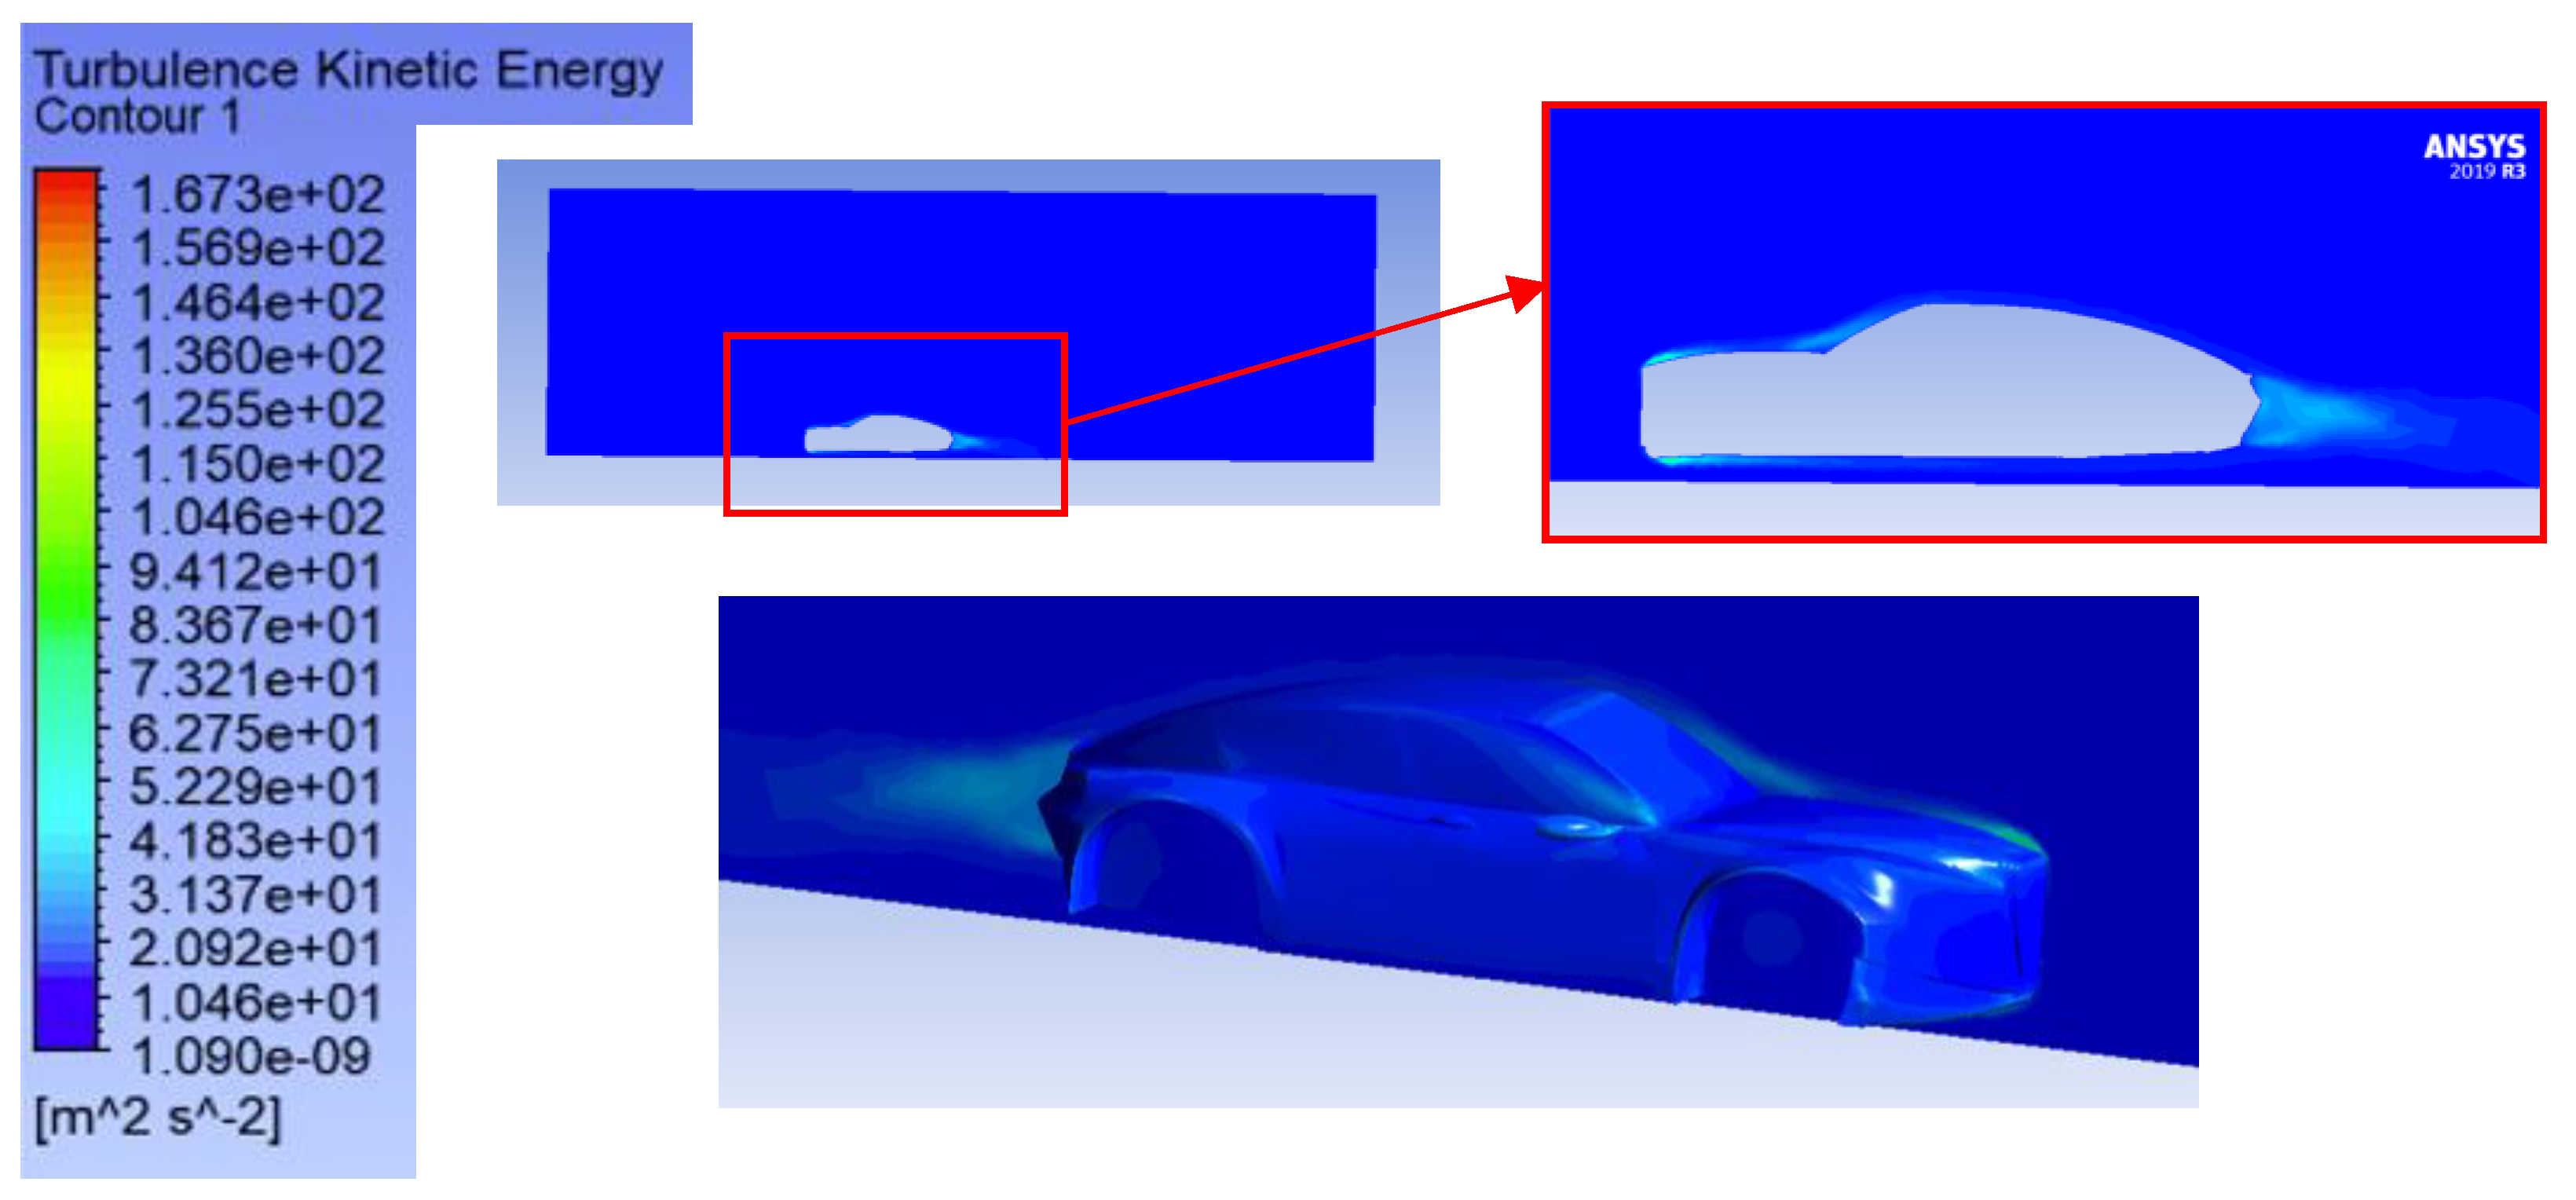
The flow structure demonstrates a balanced relationship between attachment and turbulence because total kinetic energy reaches 179.04 kg.m2/s2, which indicates controlled vortices. The vehicle reaches its maximum velocity of 51.07 m/s, which indicates that optimal energy conversion happens. The 4° orientation strikes the best equilibrium between aerodynamic drag improvement and platform stability performance.

4.1.3. Case Three: 8° Bumper Angle

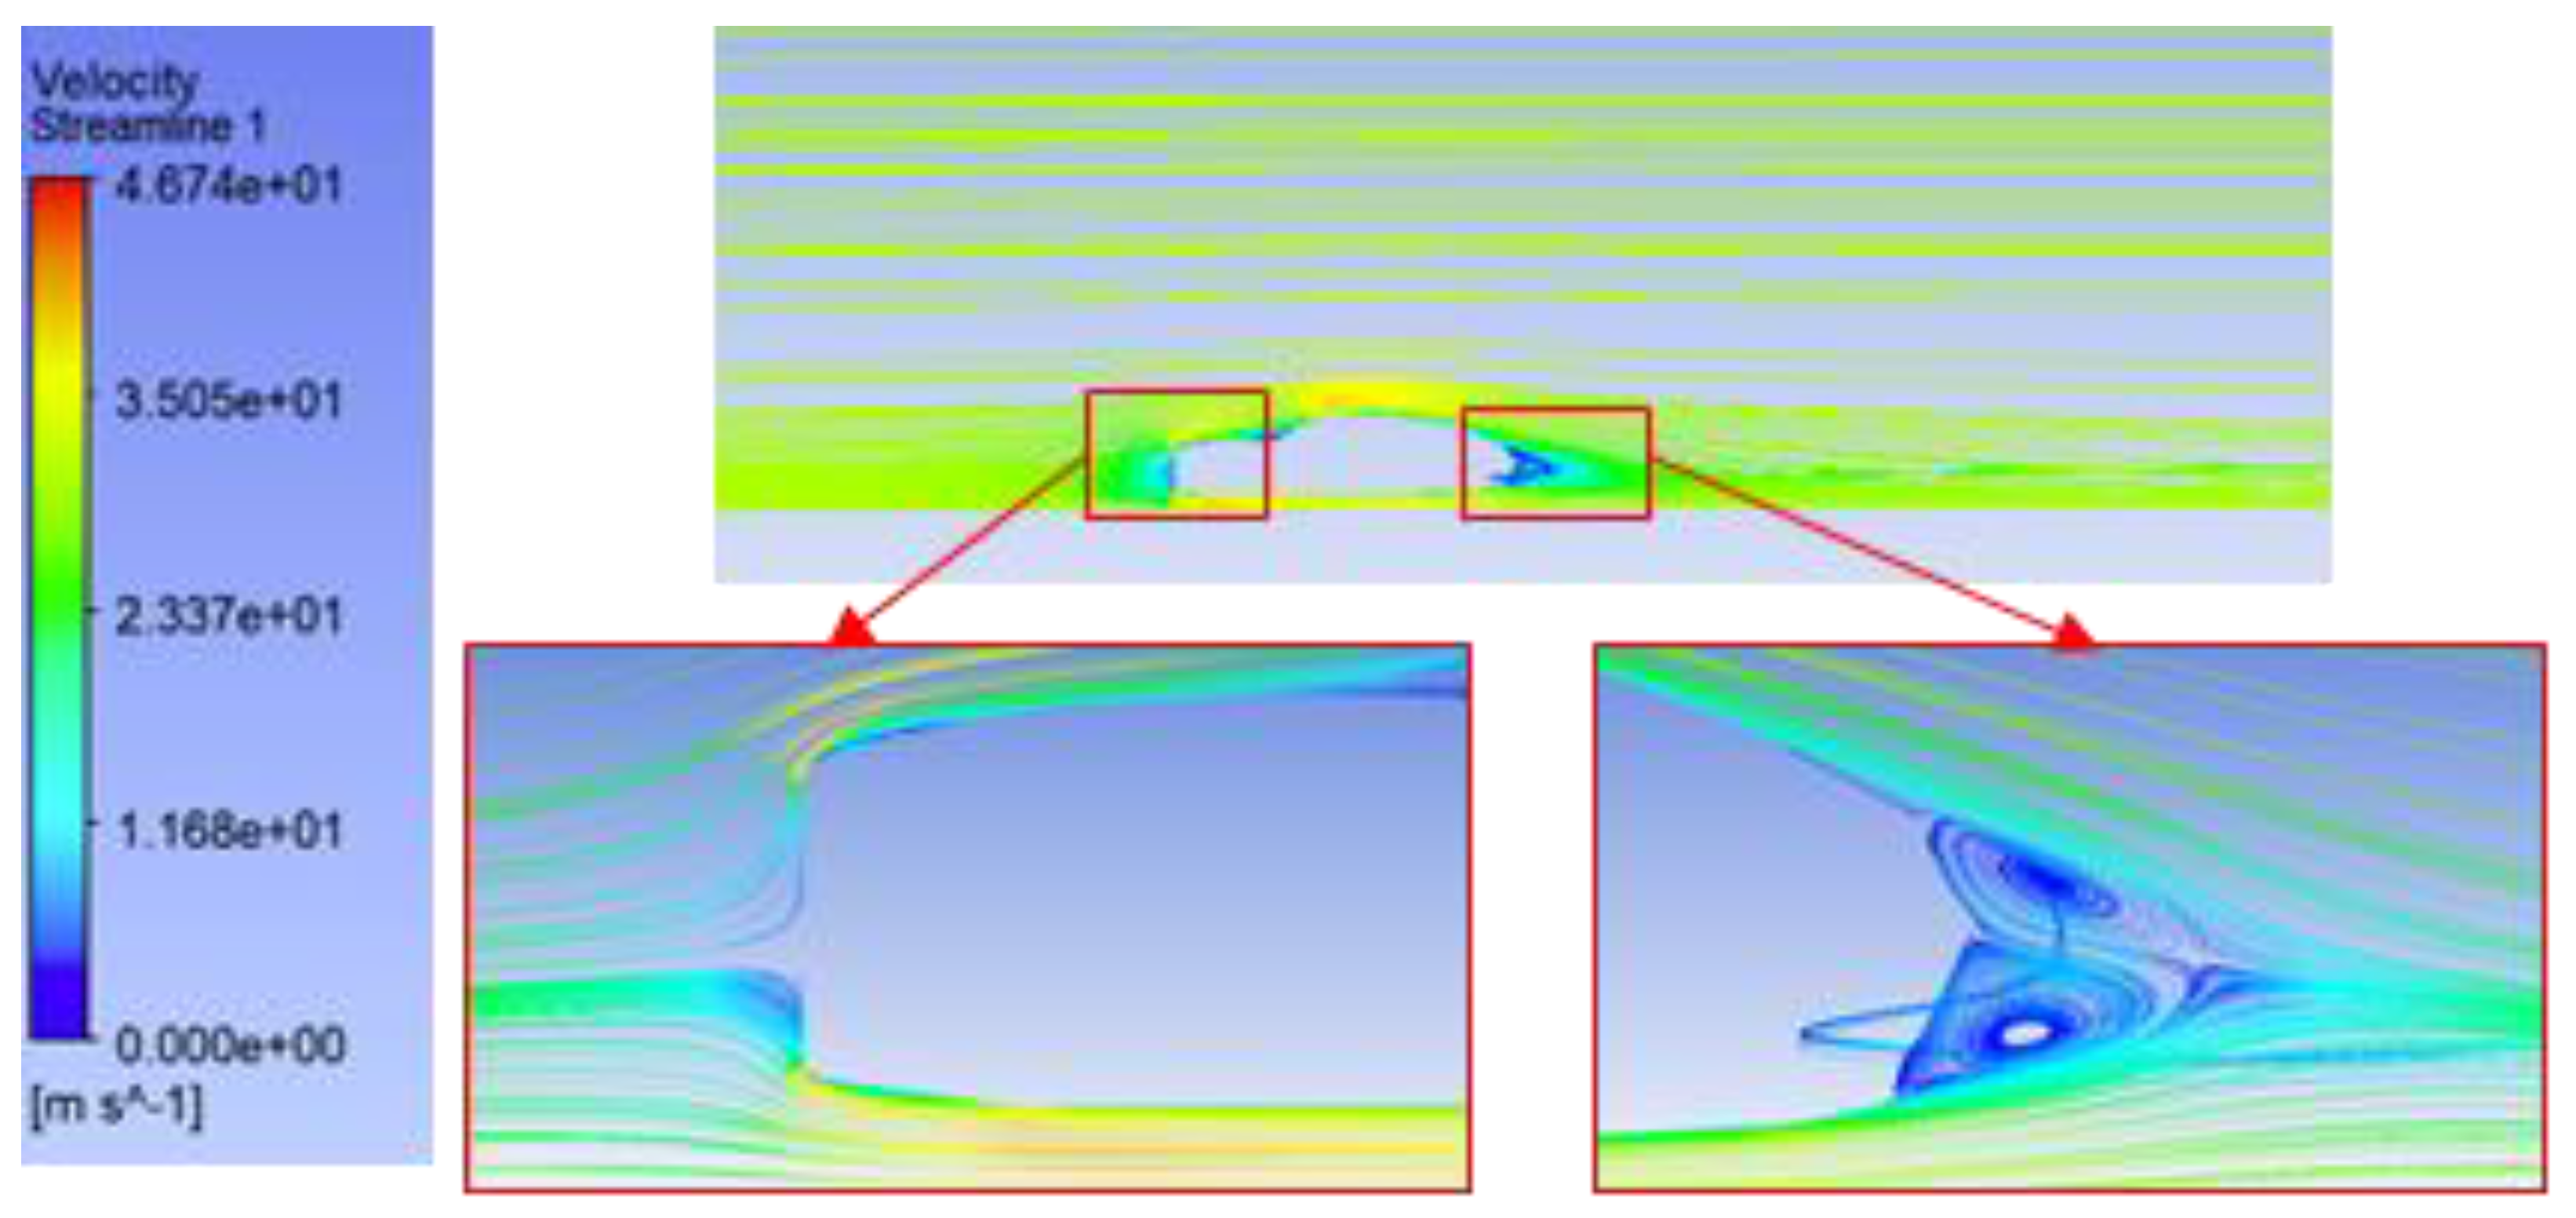
The 8° inclined bumper produces a drag coefficient of Cd = 0.28, which falls slightly behind the reference case because airflow detaches prematurely from the bumper edge. The strong slope of the bumper produces a pronounced abrupt surface that breaks down the natural airflow boundary layer. The configuration produces the most elevated lift coefficient value (Cl = 0.032) through powerful suction forces that act beneath the vehicle. The downforce-enhancing potential is beneficial yet stability issues affect lighter electric cars when using this design.
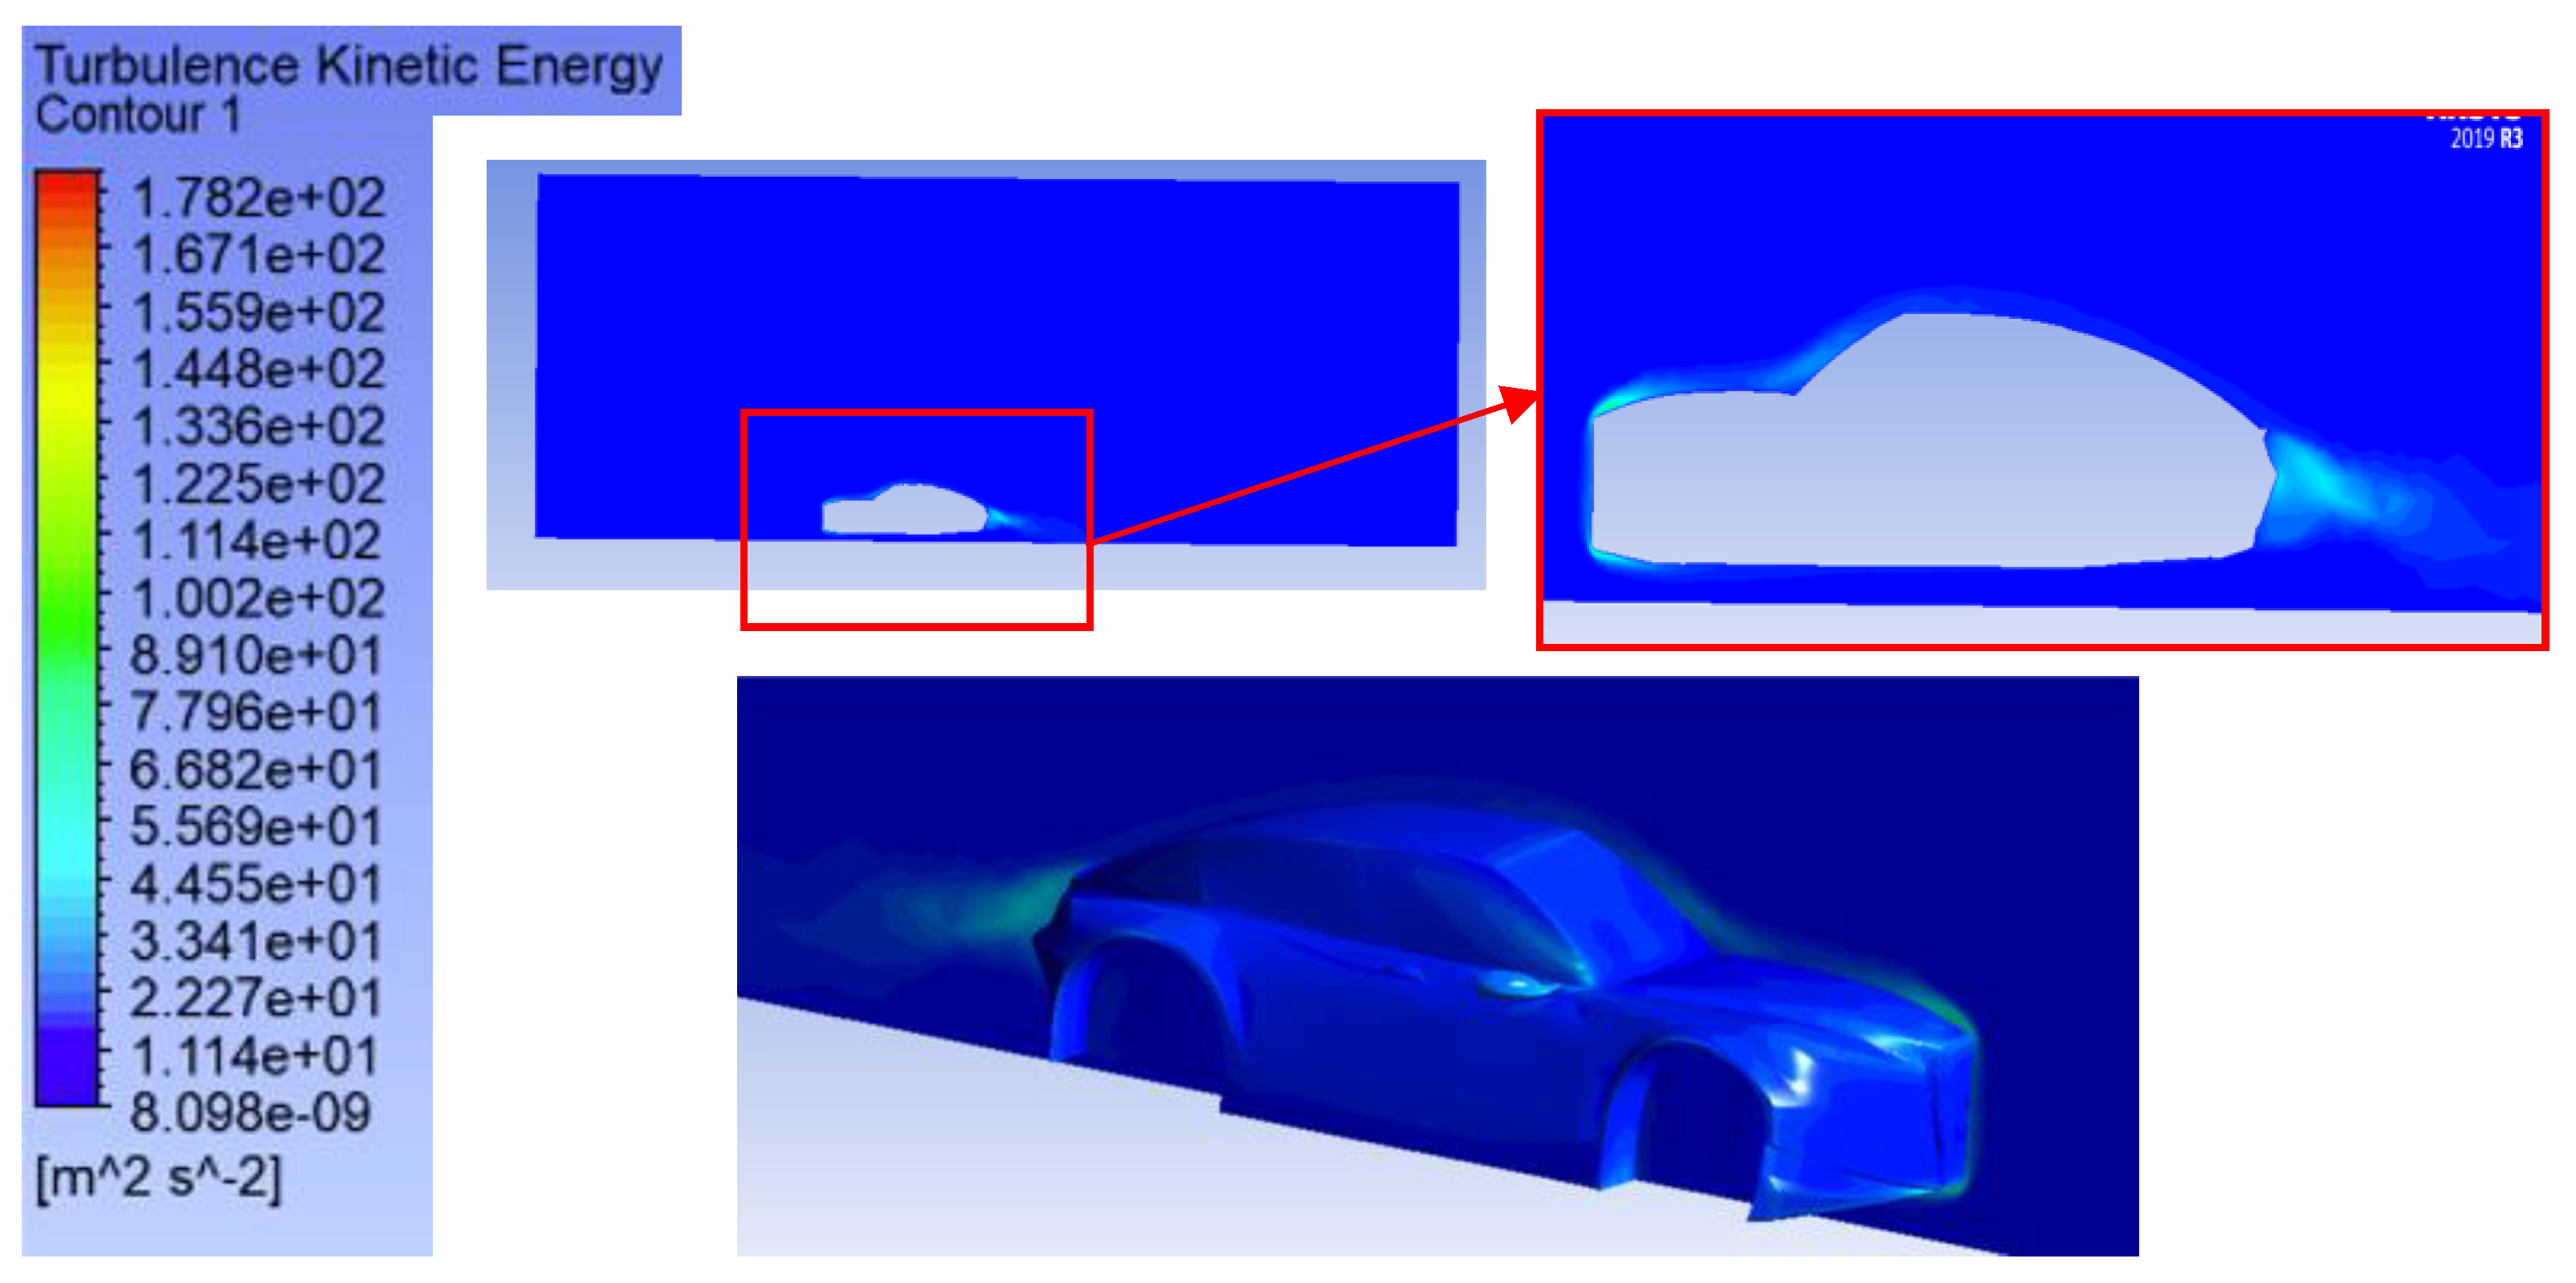
The measured maximum velocity is 46.73 m/s, which indicates weak acceleration capacity. The maximum value of TKE reached 181.91 m2/s2 in this configuration which indicates that turbulence in the wake region boosts instability. The lift improvement of this arrangement comes at the cost of reduced effectiveness for drag reduction and flow stabilization, as shown in Table 4.

4.1.4. Case Four: −4° Bumper Angle

The front shape that inclines its bumper at −4° has the highest drag coefficient (Cd = 0.29) because unfavorable airflow pressure occurs along the vehicle’s lower front area. The forward slope of the bumper surface stops airflow at the outset, creating premature separation of the boundary layer. Boundary layer separation happens after a pressure drag increase which leads to flow disturbances throughout the downstream region. A decrease in underbody suction caused the lift coefficient (Cl = 0.022) to become the lowest among the tested cases. The flow acceleration under the vehicle becomes weaker which causes the upper surface pressure to balance out with the lower surface pressure so their difference becomes minimal.
The measured maximum velocity (47.46 m/s) remains at a low level, which shows how the flow acceleration remains restricted. The turbulent mixing remains weak, based on the TKE measurement of 170.81 m2/s2, as shown in Figure 8; however, the overall effect is not advantageous. The alternative case produces unstable aerodynamic systems that cause drag increase and diminished lift capabilities.

4.1.5. Visualization of Pressures, Flow Velocities, Turbulent Kinetic Energy, and Streamlines

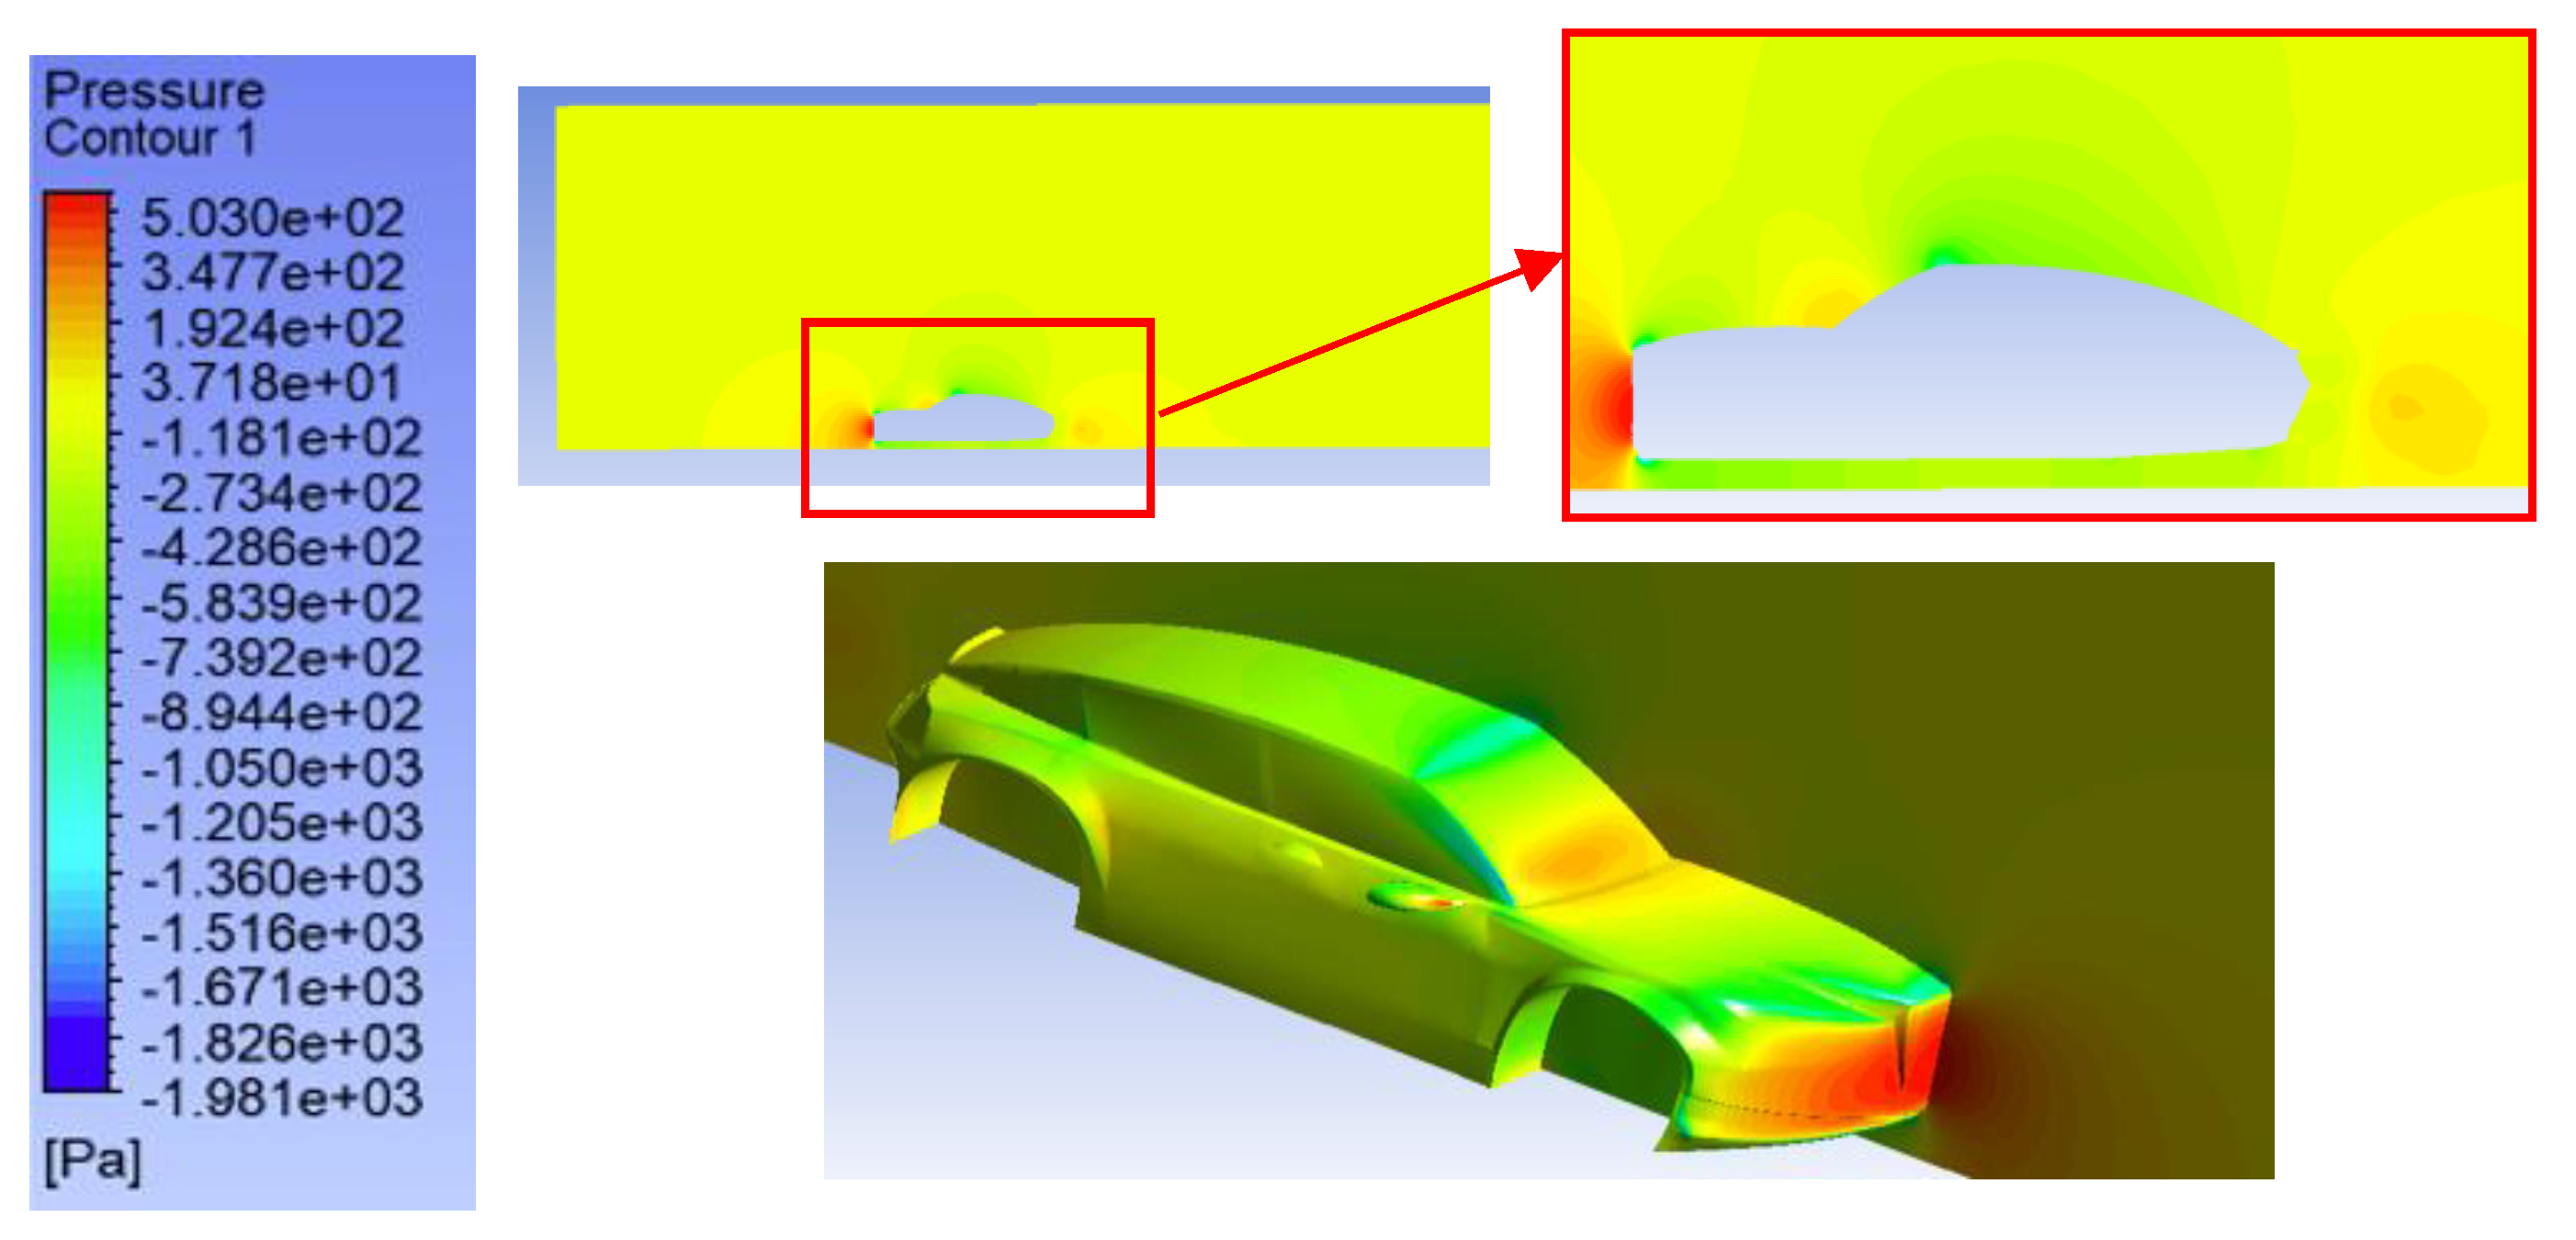
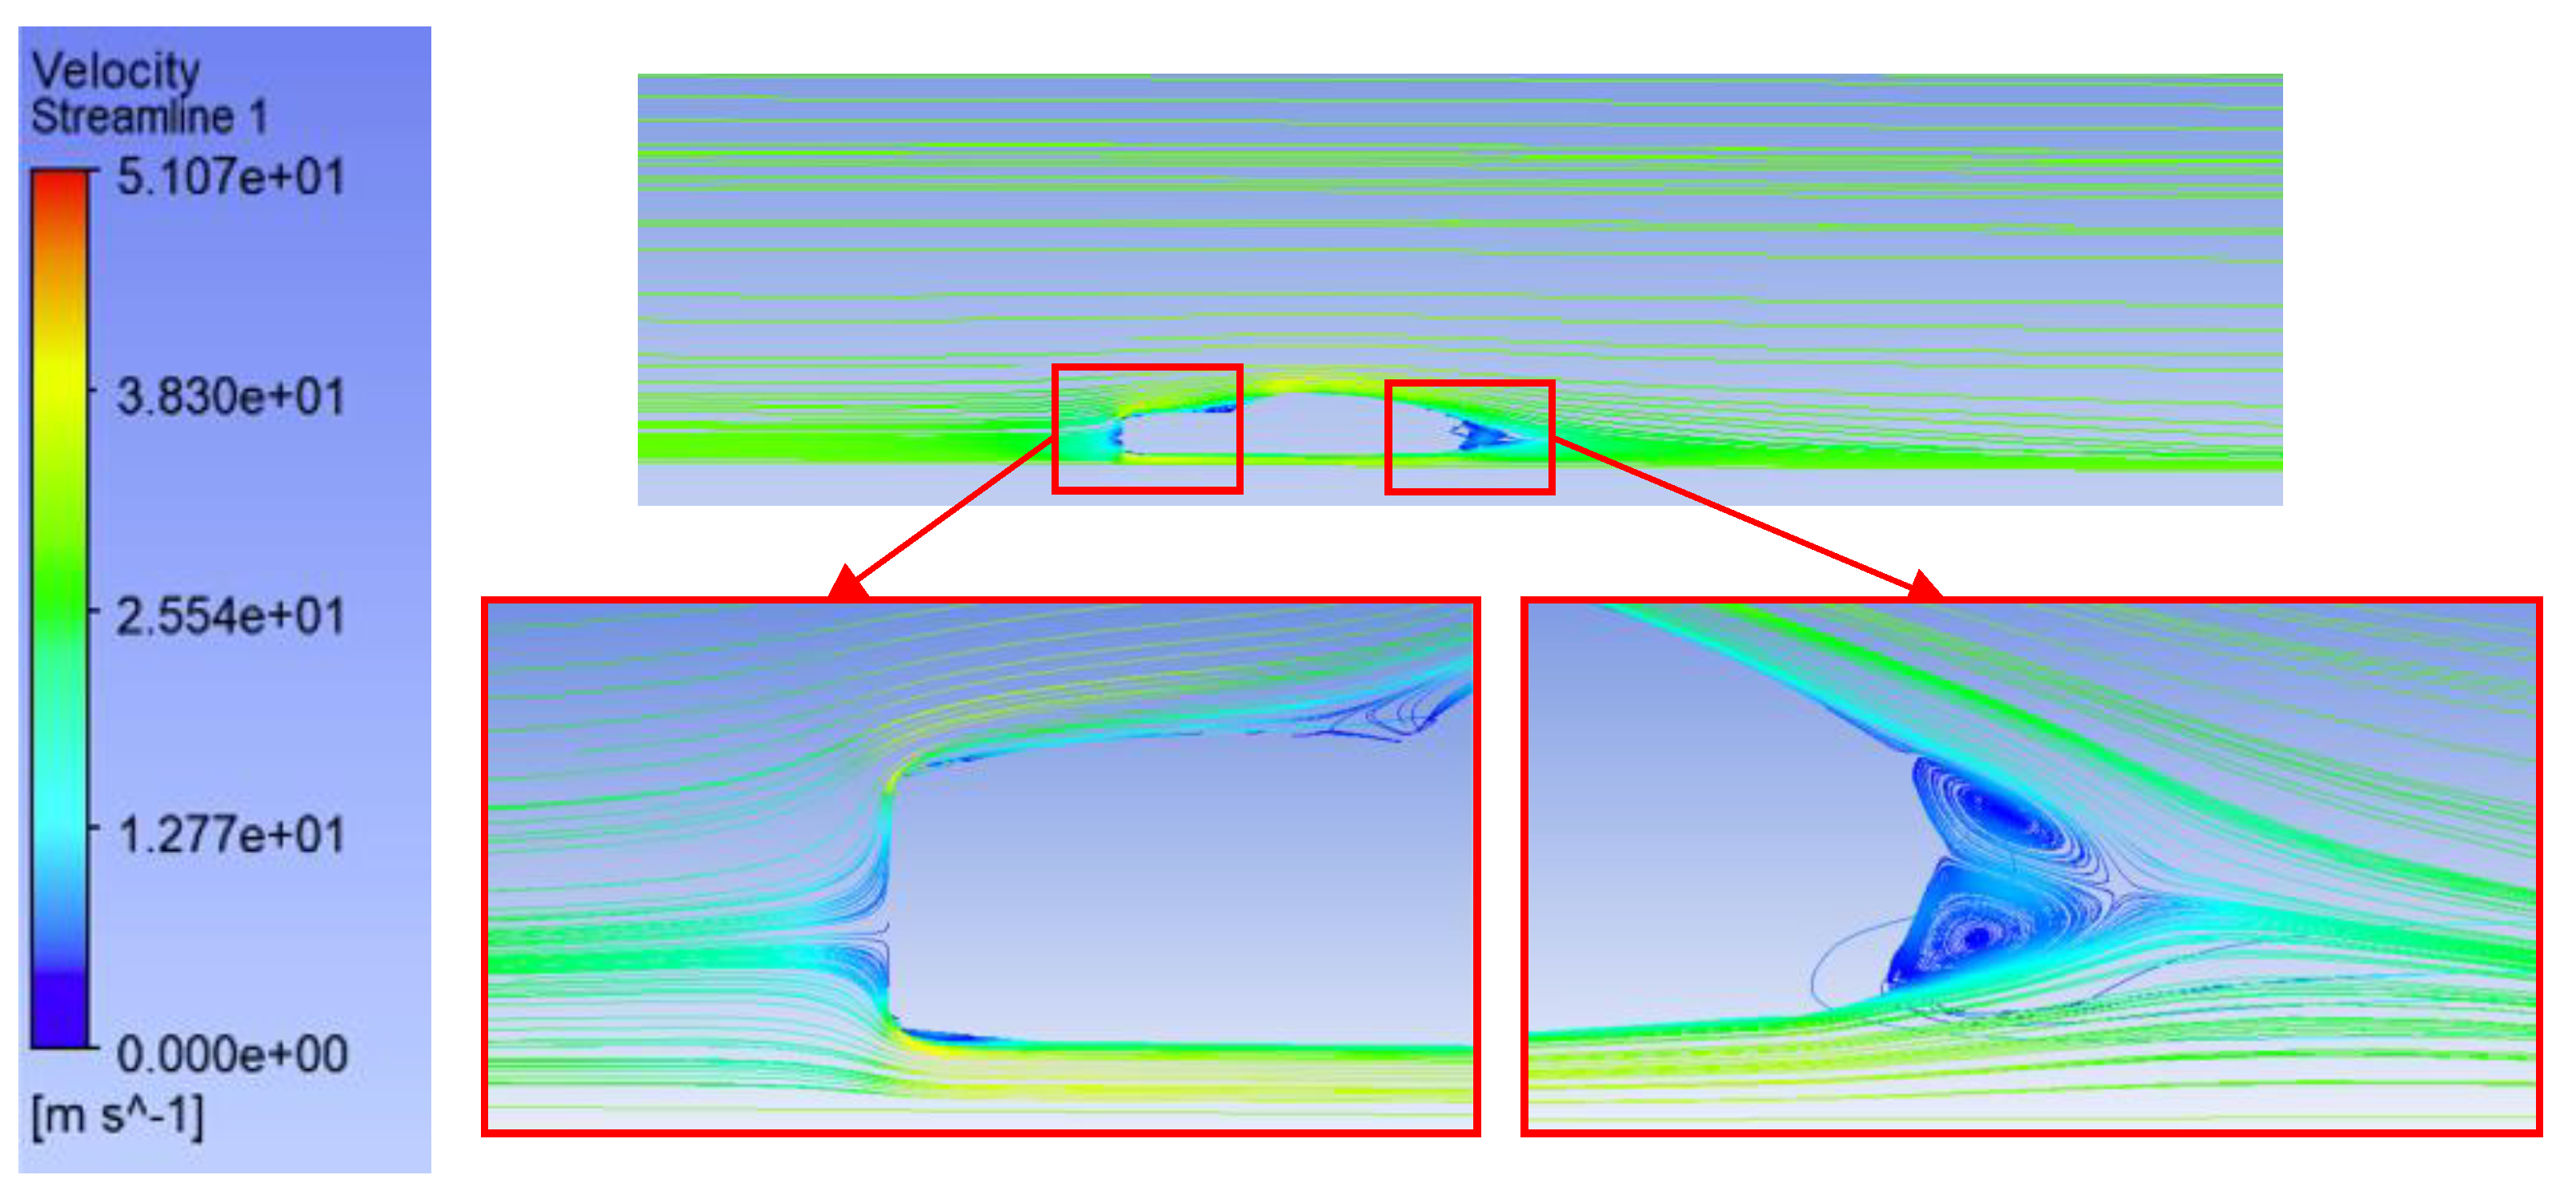
At 0° reference configuration, the pressure distribution achieves greater balance which produces a medium-strength high-pressure spot on the bumper face, and this is illustrated in Figure 9. The velocity contours, shown in Figure 10, demonstrate better airflow acceleration while the vehicle travels under the airflow. The streamlines remain better attached to the surface, yet separation affects the corners, as shown in Figure 11. The wake section functions more effectively and turbulence forces remain manageable. The turbulent flow maintains orderly structures as indicated by TKE distribution results. The aerodynamic behavior from this case presents enhanced characteristics despite not optimizing drag reduction to its maximum potential, as shown in Figure 12. The reviewed flow pattern tracks the vehicle’s shape better, thus reducing slow-moving flow zones and enhancing aerodynamic characteristics.
The 0° case is an aerodynamic equilibrium on the other bumper angle configurations: negative inclination leads to an increase in the concentration of pressure on the front face, and hence, an increase in pressure drag, and positive inclination directly affects the wake structure, resulting in premature separation of flows. Conversely, the reference configuration allows easier passage of air around the bumper and less non-uniform velocity field in the back of the car. This flow stability justifies the middle values of the drag and lift coefficients of the overall results. Moreover, the equal distribution of pressure field across the plane cuts turbulence fluctuations in the wake area, which prove the regularity of the flow regime and the credibility of the CFD model.
Among the four testing scenarios, the 4° configuration result is the most optimal aerodynamic condition. Aspect pressure contours displayed a lower front bumper high-pressure zone which signifies smoother airflow connections; this is shown in Figure 13. Figure 14 illustrates that the velocity flow field demonstrates that the airflow experiences significant acceleration right beneath the car body which helps create advantageous low-pressure zones to minimize drag. Every section of the vehicle maintains secured attachment with the streamlines which decreases flow separation, as shown in Figure 15. Mathematical analysis of wake turbulence reveals its narrow shape and minimal turbulence through observations of the TKE field organization. Turbulence presents higher levels yet creates strong stable vortex structures because of its impact, as presented in Figure 16.
The resulting stability of the flow is reflected in an aero-dynamical efficacity not only by a low coefficient of drag (Cd = 0.26) but also by a balanced portance. The +4° inclination would also seem to be a compromise that is optimal between the management of the frontal pressure and the control of the flow beneath the vehicle. This outcome corroborates the fact that even minor positive changes in the angle of the pare-chocs in front allow for improving the overall flow without creating undue disturbances at the same time. In addition, the wake structure that is both narrow and regular increases the treatment of pressure, and it is in this direction that it contributes to the overall stability, as well as performance, of the vehicle in the air.
The 8° case produces an intensified low-pressure area under the bumper that results in a substantial lift increase. At this angle, the pressure gradients become adverse, causing flow detachment to occur prematurely; this is shown in Figure 17. The velocity contours reveal regions of flow slowing down at the same time as the streamlines mark higher areas of recirculation and wider wake zones, as shown in Figure 18 and Figure 19. The TKE field contains the strongest turbulence among all configuration types, which appears mainly in the wake area as well as the vehicle’s rear section, as presented in Figure 20. The irregular and disordered flow structures become apparent throughout this region. Even though the lift coefficient reaches its highest value (Cl = 0.033), this configuration suffers from undesirable drag elements (Cd = 0.28) while maintaining unstable flow patterns. The measured flow dynamics present an upstream speed increase against downstream separation behavior which causes elevated turbulence levels and unstable flow condition.
This positive inclination increases the upward movement below the vehicle and creates a suction effect on the front face. This effect enhances the lift (Cl = 0.033) and aerodynamic drag (Cd = 0.28). Compared to the reference configuration 0° when the flow is more associated with the surface, the 8° configuration alters the aerodynamic balance and results in a general aerodynamic efficiency loss. The lift increase indicates that there is excess pressure drop under the chassis that can influence stability of the vehicle during the high-speed mode. In addition, the wake structure becomes more disordered and is highly turbulent with disordered vortices. These experiments prove that overly positive bumper angles worsen recirculation effects and decrease the ability to control air flow in the vehicle body. Therefore, although the 8° inclination can benefit the flow locally on some of the upper surface, its net effects are undesirable because of the lack of offsets between increased lift and increased drag. This action shows that aerodynamic performance is very sensitive to geometric changes in the front end of the vehicle and it makes sense to seek a very good trade-off between stability and drag minimization.
At the −4° incline, the pressure distribution concentrates its highest values on the lower front bumper segment. A high-pressure area forms on the lower part due to the flowing air encountering sharp resistance from the surface, as shown in Figure 21. In Figure 22, the velocity field shows airflow stagnation occurs beneath the bumper while the airflow speed remains slow in that area. During the effects of streamlines one can observe early flow detachment and large recirculation zones that develop at the rear of the bumper and along the vehicle’s undersection; this is shown in Figure 23. The effects generate additional pressure drag and minimize the aerodynamic efficiency. The total kinetic energy measurements show that turbulence reaches moderate levels in flow areas that have separated, as illustrated in Figure 24. The disrupted airflow causes higher drag and reduced lift control effectiveness in such configurations. Aerodynamic instability occurs because of this arrangement which results in substantial increases in drag.
The orientation of the reference configuration 0° results in a worsening of the aerodynamic behavior: the front of the vehicle serves like a shield to the airflow, increasing the force of drag and changing the pressure field under the vehicle. This effect is also associated with an undesirable change in lift, which may lead to an augmentation of the pressure of the contact on the front part. The high frontal resistance together with an unstable turbulent wake, explains the increased drag coefficients experienced in this set up. These findings underscore the fact that the negative bumper angles affect the aerodynamic performance of a vehicle in a negative way since they disorganize the flow of air around the vehicle.

4.1.6. Summary of Aerodynamic Effects and Physical Interpretation

The influence of front bumper inclination on the aerodynamic performance of the electric vehicle is summarized in the following table (Table 5). Each configuration is analyzed in terms of flow behavior, pressure distribution, and resulting aerodynamic coefficients. This analysis provides a physical interpretation of how each angle impacts drag and lift forces by observing flow separation, recirculation zones, and pressure effects. This table complements the CFD visualizations and supports the selection of the optimal geometry.

4.2. Multi-Objective Parametric Optimization with DesignXplorer

A parametric study was thus conducted in order to determine, automatically, the optimum front bumper angle that would allow for an optimum aerodynamic performance of the vehicle using the ANSYS DesignXplorer module. The input parameter was defined as the angle, the stability range which can vary between −6° and 10° was given, and the angle could be explored more than it could be with the initial version through the manual way.
A set of results was received, wholly, at the end of this parametric modeling stage and at the automatic producing of simulation cases through ANSYS DesignXplorer. At every design point, a validated CFD simulation was carried out and the values of drag coefficient (Cd), and the lift coefficient (Cl) were obtained.

4.2.1. Design of Experiments

ANSYS DesignXplorer automatically generated its design table (Table 6). It combines all the settings analyzed, characterized by a change in the angle of inclination of the front bumper −6 and +10, and shows, on each occasion, the calculated values of Cd and Cl coefficient of drag and lift, respectively.
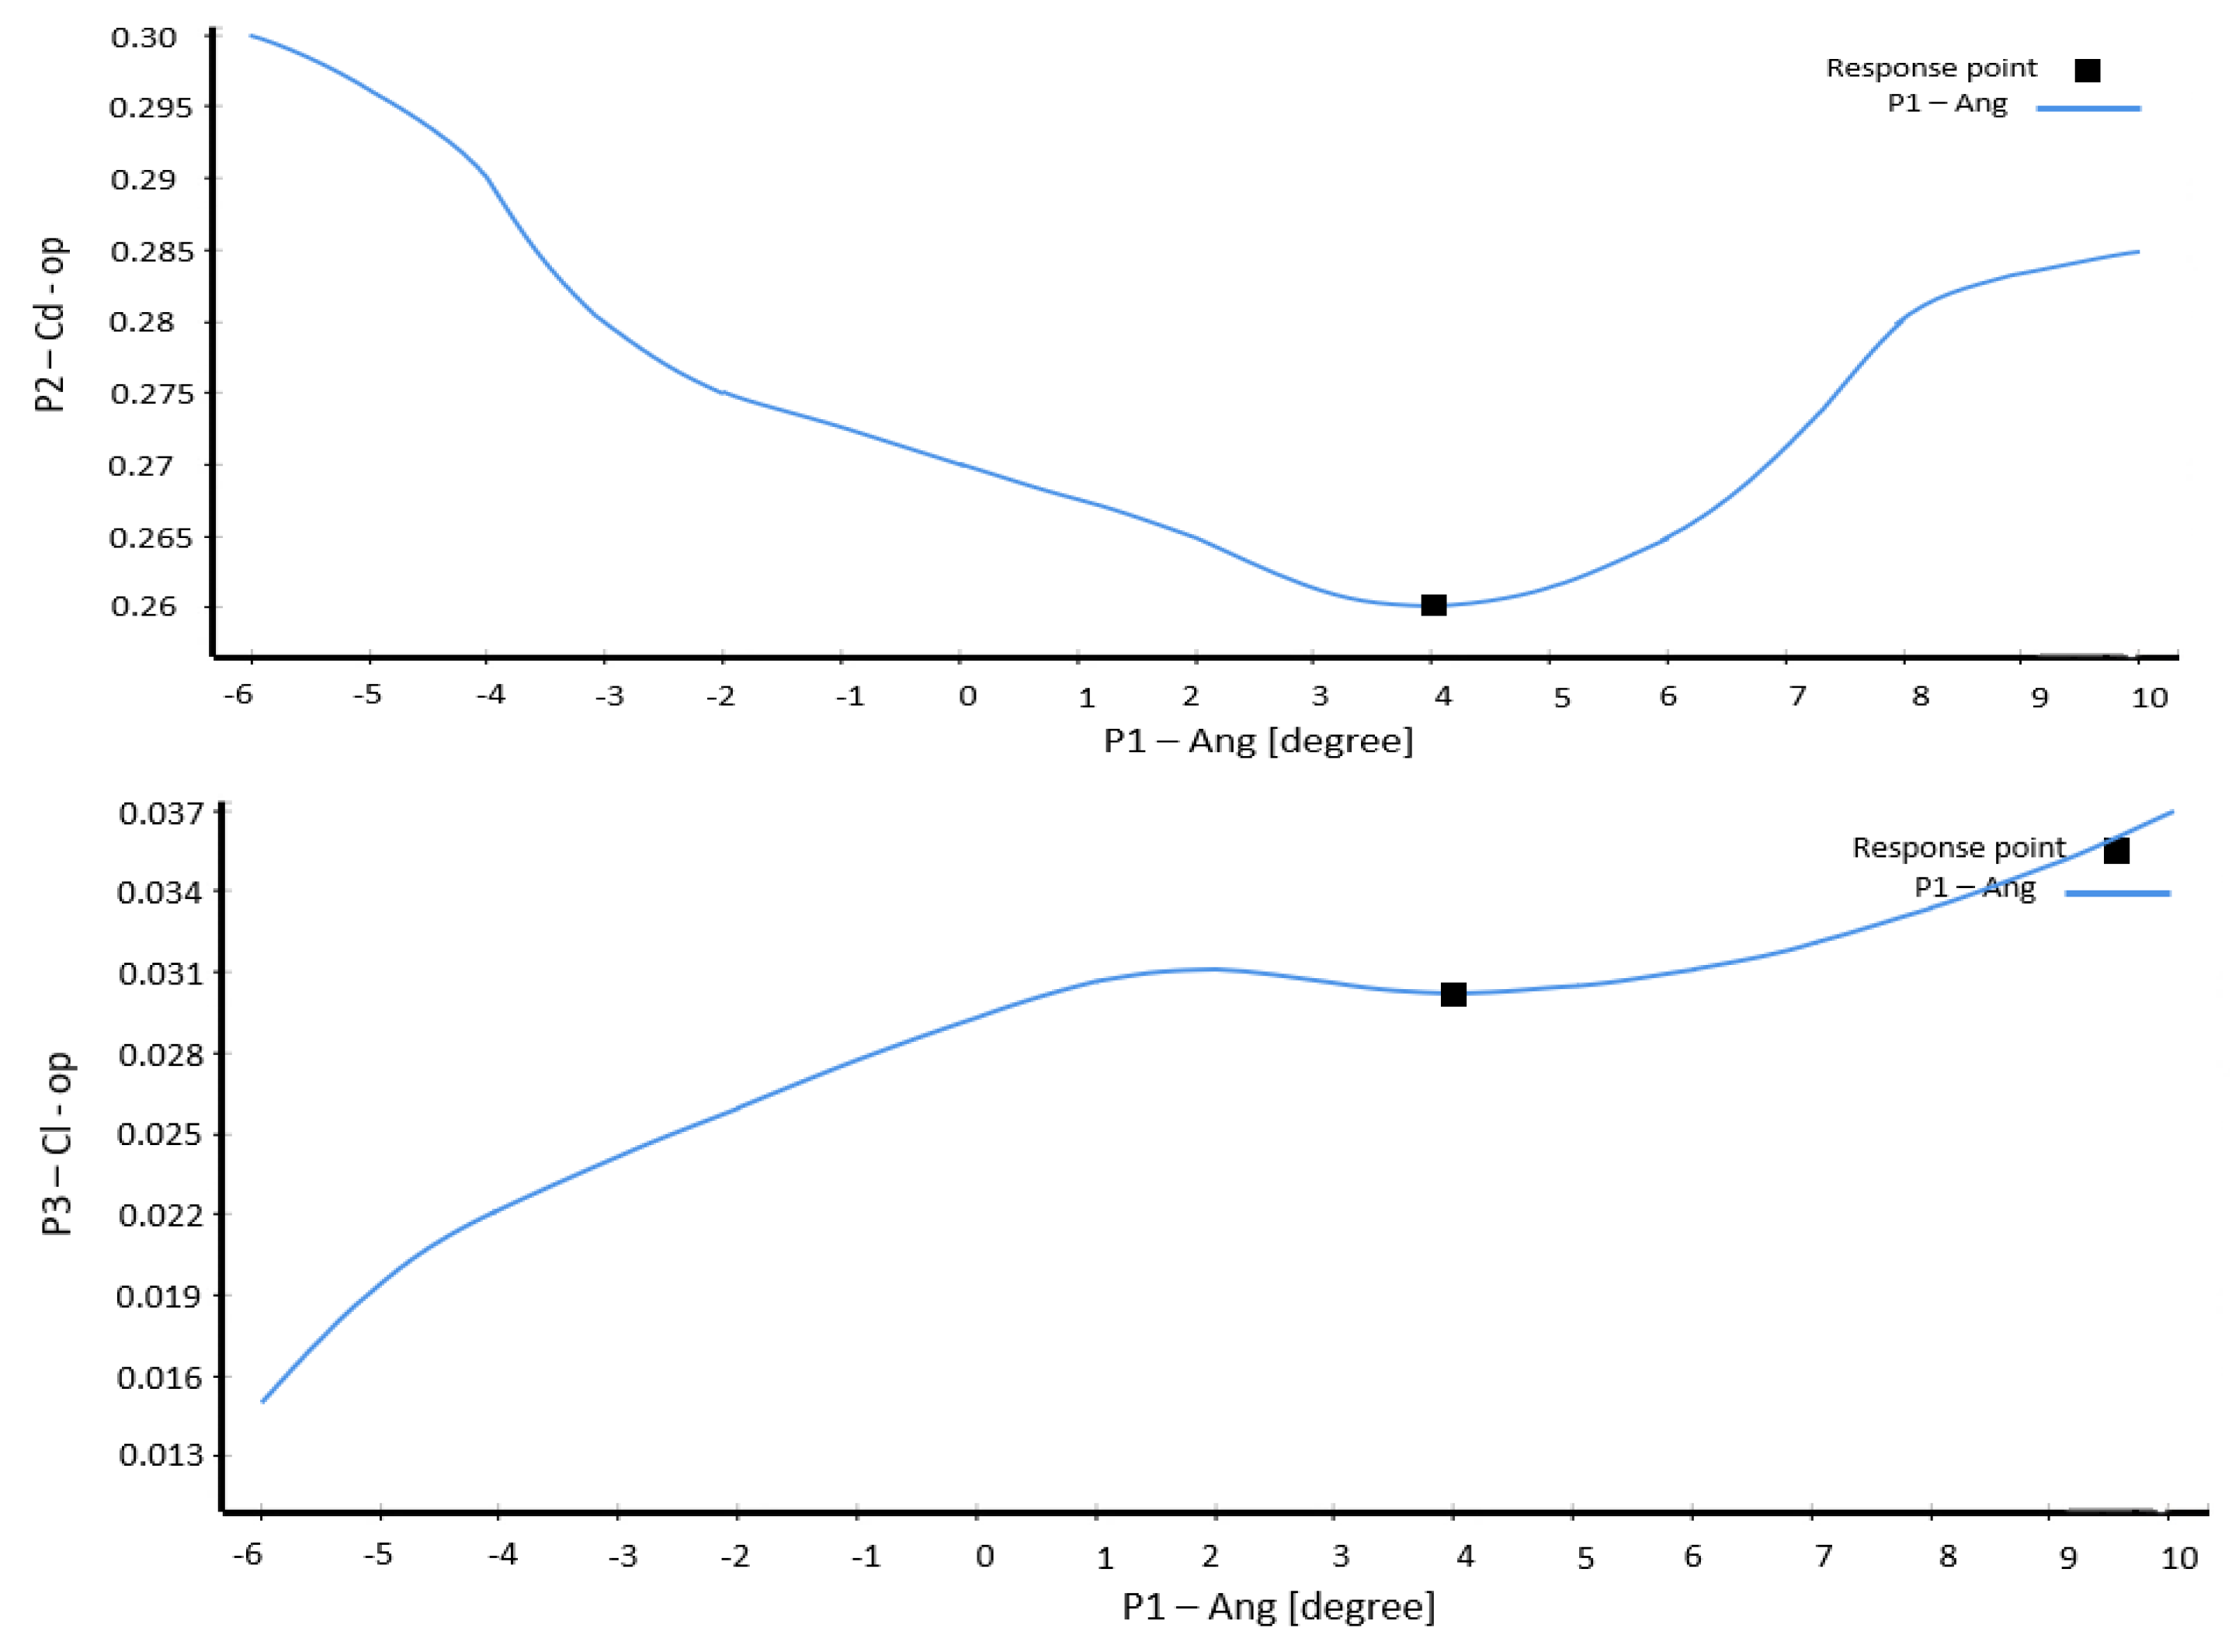
These results allow for analysis of the direct effect of the angle on the aerodynamic performance. On the negative inclinations (−6°, −4°, −2°), the drag coefficients are not so small (0.30, 0.29, and 0.275, correspondingly), and the lift values are so low, that it means that the stability is good, but the aerodynamic efficiency is poor. Conversely, with the angles starting to get higher (8° and 10°), Cd also undergoes a slight increase (0.280 and 0.285, respectively), as shown in Figure 25; however, Cl is increasing progressively, which can hint at the tendency of aerodynamic destabilization, as shown in Figure 26.
The most favorable compromise is the one that was placed at a 4° angle, as it has the smallest Cd value (0.260) which demonstrates high aerodynamic performance, and a median lift (Cl = 0.030). The neighboring back-to-back configurations at 2° and 6° are very similar, although they are worse in one or both of the measures, as illustrated in Table 6.
The package of these results thus is a good base on which to build a response surface and to validate the optimization. The parametric approach clearly shows how one can be able to identify the best angle that is most effective in regard to the overall aerodynamic performance.

4.2.2. Response Surface

The results of the design of experiments were used to perform a modeling technique that would model how Cd and Cl changed with the bumper angle. This method allows us to execute smooth response surfaces based on discrete data achieved by simulations. It helps to determine the best zones and identifies general trends in aerodynamic performance. In total, it offers a strong predictive element to inform design decisions. Such modeling can therefore permit a more detailed examination, and give accurate information about the effect of the parameter under study.
Response Surface of the Drag Coefficient and Lift Coefficient
The change in the drag coefficient (Cd) depending on the angle of the bumper shows the best performance range at about 4°. The built-up response surface using DesignXplorer identifies a sharp downward level of Cd in the range of −6° followed by a flat response surface to a little over 4° with a distinct minimum at Cd = 0.260. Outside this plane, Cd will be rising again just a little, to 0.285 at 10°, as shown in Figure 27. This variation proves that a 4° configuration can effectively reduce drag, making it a huge difference in energy consumption of electric vehicles. This is the finding of one statistical process modeling procedure that automatically identifies the most optimal instead of the mundane and easy search of available configurations.
Figure 28 represents the lift coefficient (Cl) versus the same angle parameter as an element of the response surface. As opposed to Cd, Cl rises virtually linearly with the angle. Cl = 0.029 at 0°, and 0.030 at 4°, and 0.036 at 10°. This kind of behavior means that when the angle is too high, then the vehicle might become unstable as a result of over-lifting. The angle of 4° stands out not only because it minimizes Cd, but also maintains Cl at a moderate level, which is also a source of dynamic stability. This value therefore affirms that the optimal point fulfills two fundamental requirements at the same time.
Model Validation Using Residual Plots
Figure 29 shows the residual validation plots of the response surface model (RSM) of the aerodynamic coefficients Cd and Cl. The scatter plot is used to compare the values predicted by the RSM and the ones that are calculated directly using the CFD simulations.
The points are closely clustered on the 45° diagonal which is the ideal line of correlation between observed and predicted values. This graphical fit is an assurance that the statistical accuracy of the developed model is high, meaning that the residuals are small and randomly distributed, meaning that the model is very powerful. The fact that the red squares (Cd) and blue squares (Cl) have a close agreement demonstrates that the RSM models the same physical tendencies in the CFD database.
Quantitatively, the predicted and observed values show a correlation coefficient (R2) of near 0.99 and this proves the high predictive ability of the model constructed. This model has been able to replicate the nonlinear aerodynamic behavior that is related to variation in the front bumper inclination, that both drag and lift are affected by the complex interaction of the flows like the separation of the boundary layer, the change in the stagnation pressure, and the wake behind the vehicle.
Thus, the response surface that is obtained is statistically significant but physically consistent so that it can be relied upon to predict aerodynamic responses of intermediate or untested geometries in the specified design space.
Using ANSYS DesignXplorer, this validated model can be used to thoroughly explore the design domain and optimize and carry out a sensitivity analysis of the design, without having to conduct additional high-cost CFD simulations. This goes a long way in improving the efficiency of the aerodynamic design process and at the same time keeping the reliability of predictions down to the level of industrial use.
Local Sensitivity Analysis and Model Robustness
The local sensitivity analysis and the radar chart representation confirm the strength of the statistical model as well. As illustrated on the local sensitivity curves, the bumper angle is the prevailing force which affects Cd and Cl. At a change of an angle where it varies to be between −2° and 6°, a considerable dip occurs in Cd at an angle of 4°. This makes optimization very sensitive in this range and that the exact angle of choice is what matters most in performance, as illustrated in Figure 30.
And as far as the radar chart is concerned, in Figure 31, it shows the strength of the best solution graphically. The fact that it is in a tight form around the origin of the diagram proves the idea that the responses (Cd and Cl) are locally stable close to the most-preferred angle, which proves the reliability of this configuration. This aspect defined by visualization in DesignXplorer proves that as well as being mathematically better, the identified solution is robust to geometric perturbations which is an essential industrial application.

4.2.3. Results and Validation of the Optimization

The last step of this work is the optimization process. The design of experiments was employed to generate a set of simulated data on which ANSYS DesignXplorer was applied as a multi-objective optimization engine. The aim was to ensure that there was an optimal drag coefficient (Cd) which would ensure that there would be an optimal aerodynamic drag to aid in increasing the range of the electric vehicle.
A bumper angle on the front bumper was used as the principal design parameter. The developed response surfaces allowed DesignXplorer to automatically test a number of configurations and come up with the most sensible combination of settings to meet the specified objectives. This method makes the use of manual analysis obsolete and the exploration is systematic, reliable, and can be carried out in a very short time.
Assessment of Multi-Objective Optimization Convergence
The optimization was observed with two internal gauges: the percentage of points on the Pareto front (red) and the percentage of stability between iterations (green). The two curves sharply decline and this proves that the algorithm has converged to a stable optimal solution where no improvement could be achieved by a different configuration, as shown in Figure 32. Compared to the conventional study where only specified cases are used based on ANSYS Fluent, this parametric optimization method allows a methodical search of the design parameter and finding an optimized configuration that yields optimal value to the drag coefficient (Cd) with managing the lift coefficient (Cl).
This consideration not only makes the article a more efficient aerodynamic solution to the electric vehicle, but also increases the scientific rigor and originality of the article. This kind of mathematical convergence study surpasses a descriptive way of conducting the study and offers an industry applicable method of manipulation that could be applied at higher stages of designs.
Selection of the Optimal Angle Based on Aerodynamic Performance
The last step towards optimization involved a number of configurations that were almost identical to the optimum angle in order to provide better analysis on the optimum solution. Three of the candidate points that are given on the table are nearly close to each other within the very small scope of 4° (between 3.9974° and 3.9998°). The values of the drag coefficient (Cd) are almost similar (0.26017 to 0.26018) according to each configuration, which indicates that the discovered zone is the strong local minimum. Meanwhile, this lift coefficient (Cl) is between 0.03020 and 0.03023; thus, the vehicle has good aerodynamic stability, as shown in Table 7.
Consequently, candidate point 1 is the best candidate because it is the combination of minimum drag and the minimum lift value; hence, it can be confirmed that it is both energy efficient and guarantees vehicle stability. This is to locally test the strength of the optimization and it gives scientific confidence towards the final decision. It also shows the worth of an automated parametric approach as opposed to a basic manual study.
Analysis of the Local Pareto Front for Optimal Selection
Figure 33 shows the Pareto front of the local optimization of the drag coefficient (Cd) and the lift coefficient (Cl) at a multi-objective level. The front was also created using three ideal candidate points that were distributed in the vicinity of the optimum inclination angle as determined by the response surface methodology. The points on the plot correspond to possible design configurations that are considered in the optimization process, with Cd plotted along the x-axis and Cl along the y-axis.
The Pareto front is given as the non-dominated solution, i.e., there is no design in this area that can enhance one goal (e.g., increasing Cd) and deteriorate the other (e.g., increasing Cl). This diagrammatic display distinctly draws out a trade-off between aerodynamic efficiency and dynamic stability which are necessary and competing design goals of vehicles.
The design point, which is an inclination angle of 3.9998°, is in the lower-left part of the Pareto front. This orientation is a sign of an optimal aerodynamic compromise, where both the drag and lift are minimized at the same time in the explored design space. This arrangement also makes the use of less energy consumption possible because it reduces the aerodynamic resistance at minimal vehicle stability loss.
The cyclical change in the colors between blue and red in the figure presents the metamorphosis of the viable solutions in the Pareto area, where the nearer the point is to the lower-left corner, the more efficient and balanced the design is. The convergence and strength of the multi-objective optimization process in ANSYS DesignXplorer is verified by the smooth progression.
In general, the demonstration of the Pareto front enables the increase in the scientific validity and engineering applicability of the study as it proves that the chosen design does not rely on one particular simulation finding but rather a sound multi-objective decision-making paradigm that meets the actual aerodynamic optimization approaches in the automotive business environment.

4.3. The Value of Integrating an Optimization Tool into the Simulation Process

First was an analysis performed in a manual way of testing four constant transients of the angle of the front bumper in ANSYS Fluent. It is a possibility to see a general tendency in Cd and Cl; however, this method is still confined by the crude discretization of the design space; beyond this fact, it cannot be claimed that it will lead to the identification of the optimal solution.
As a countermeasure to this weakness, it replaced ANSYS DesignXplorer to allow a further designed exploration of potential options, and then a statistical modeling process was achieved to optimize from multi-objective optimization. DesignXplorer can be used in a predictive, continuous fashion, as compared to Fluent alone, which allows implementations in an industrial setting, which are more reliable and mathematically explainable, as shown in Table 8.
This hybrid approach, therefore, gives a stringent scheme—shifting between a descriptive analysis and parametric optimization—to augment the aerodynamic efficiency of the electric-based vehicles.

4.4. Comparative Study on Aerodynamic Design Optimization

The current study compares its findings with the previous research which used different design modifications to optimize aerodynamics; Table 9. Studies in this work series on front bumper inclination angles led to Cd = 0.2601 and Cl = 0.0302 outcomes that match contemporary research standards. Ref. [13] conducted research on spoiler and fin configurations which produced Cd values that were exceeded in the range from 0.2872 to 0.4715. Their results demonstrated increased aerodynamic drag. Some configurations employing diffusers according to [13] presented diminished lift but increased aerodynamic drag as their main outcome.
Ref. [33] presented lower drag rates (Cd = 0.2517) alongside lifted values (Cl = 0.3922) that introduced instability to the vehicle system. The study outcome demonstrates balanced performance through low drag combined with moderate lift, thus showing that modifying bumper angles offers a straightforward alternative to advanced approaches like diffusers and deflectors or underbody slices. The current method provides practical and efficient aerodynamic enhancement compared to [34], with an adjustable rear wing strategy that produced a maximal drag–lift combination. The present study demonstrates that the front bumper inclination operates as an innovative method that efficiently enhances electric vehicle aerodynamics.
Table 9. Comparative study on aerodynamic design optimization.
ResearchersMain IdeaCdClDifferent Cd to This Study (%)
[11]Effect of deflectors on Ahmed body0.3430.29131.88
[13]Spoiler influence0.29180.317712.18
[13]Fins influence0.33870.617130.23
[13]Wing with diffuser0.4715−0.115181.24
[13]Fins with diffuser0.33380.60528.34
[13]Spoiler with diffuser0.28720.317410.43
[30]Influence of diffuser angle on drag0.24870.2656−4.37
[35]Influence of the rounding of the rear part0.2980.25414.58
[33]Rear under-body sliced0.2517-−3.23
[34]Study on adjustable rear wings0.454−0.33174.52
Current studyEffect of front bumper inclination angles0.26010.0302-

5. Conclusions

The paper presented an organized and thorough approach to studying the impact of front bumper inclination on electric vehicle aerodynamics performance and how it can be improved. The novelty of the work consists in such an experiment that it establishes an elementary but characteristic geometry and attention to a frontal area that is highly critical to drag.
A first set of CFD calculations was performed on four different front bumper set-ups of the angle (−4°, 0°, 4°, 8°). Every configuration had characteristic aerodynamic tendencies. The −4° gradient decreased the lift but gave increased drag (Cd = 0.29), whereas the 0° angle gave a neutral but less than ideal flow (Cd = 0.27, Cl = 0.029). The angle (4°) became best because it has the least amount of drag (Cd = 0.26) and controlled lift (Cl = 0.030). On the other hand, the 8° angle produced an increased lift (Cl = 0.033) and drag (Cd = 0.28), which adds compromise to vehicle stability.
This has to do directly with the aerodynamic influence of the front bumper shape: by altering the angle of inclination, the airflow is directed around the body in a more desirable formation, eliminating areas of separation and the voluminous gap behind the car. The 4° case is an optimum distribution that reduces front pressure and minimizes backward turbulence. Therefore, an easy geometric modification to accomplish a considerable drag decrease has been found beneficial in the study, which could mean saving on energy or gaining on the range with the use of electric vehicles.
To validate the scientific accuracy of observations made in the fixed cases and extending the analysis to a larger variety of configurations, a parametric optimization strategy was also incorporated by means of ANSYS DesignXplorer. To this end, it was decided that the geometric parameterization could be applied in ANSYS Workbench directly, so that once a certain angle on the front bumper has been achieved, it can be continually varied, without the need to use the CAD environment again. The angle of inclination was set as an input parameter in the geometry module and mapped onto a meshing module on one hand and on the other as an alternate parameter to the CFD simulation module. Transparent simulations in Fluent were prepaid to each automatically produced configuration and aerodynamic outputs were captured after each simulation. The information was then applied in constructing a quadratic response surface of a relationship between angle value and the aerodynamic performances (Cd, Cl in anticipation to predict and optimize future settings).
The quality of this statistical model was confirmed by residual analysis, local sensitivity, and global robustness diagnostics. The multi-objective optimization gave an optimal solution through 3.9998° at a drag coefficient of 0.2601 and a lift coefficient of 0.0302. This solution is also Pareto optimal; this proves that it is a trade-off non-dominated between the two objectives: drag and aerodynamic stability.
This work represents a twofold contribution in the sense that it shows that a local geometric change to the bumper can make a measurable difference in the overall aerodynamic efficiency of an electric vehicle, and second, that a reproducible computational procedure should be proposed to provide a workflow through parametric modeling of geometry, an automatic simulation, and optimization. This can easily be translated to other parts of the body like the hood, grille, or underbody.
Moreover, the results of this study surpass the scientific interest and indicate the practical prospects of real-world optimization of the aerodynamics of electric vehicles. The created methodology can be directly adopted by the automotive engineers to optimize the front-end geometry, reduce the aerodynamic drag, and improve the overall energy efficiency. To ensure that the numerical result is verified in future work, it is proposed to use wind tunnel testing and experiments with scaled models to verify the accuracy of the presented CFD-based predictions. Such viewpoints open the way to the industrial implementation of the suggested aerodynamic optimization solution in the actual design of a vehicle.
Finally, future work will focus on including the impact of crosswind and unsteady conditions will need to be included, as well as a range gain being assessed directly using a standardized driving cycle, the development of a simplified digital twin of the vehicle which can be tested swiftly on a numerical platform, and extrapolation of the method to more realistic industrial design applications that must take into consideration manufacturing or styling limits.

Author Contributions

Conceptualization, L.B.M., A.E.K. and A.S.; methodology, L.B.M., A.E.K. and A.S.; software, L.B.M., A.E.K. and A.S.; validation, L.B.M., A.E.K., A.S., S.V. and M.L.S.; formal analysis, L.B.M., A.E.K., A.S., S.V. and M.L.S.; investigation, L.B.M., A.E.K. and A.S.; resources, A.E.K. and A.S. writing—original draft preparation, L.B.M., A.E.K. and A.S.; writing—review and editing, A.E.K., A.S., S.V. and M.L.S.; visualization, A.E.K., S.V. and M.L.S.; supervision, A.E.K., S.V. and M.L.S.; project administration, A.E.K. and S.V.; funding acquisition, S.V. and M.L.S. All authors have read and agreed to the published version of the manuscript.

Funding

This research received no external funding. The APC was paid by Transilvania University of Brasov, HBS 3125/2025.

Data Availability Statement

The original contributions presented in this study are included in the article. Further inquiries can be directed to the corresponding author.

Acknowledgments

The authors express their gratitude to the Research Laboratory in Science and Engineering at the Faculty of Science and Technology, University of Sidi Mohamed Ben Abdallah in Fes, Morocco, for their fundamental support of the research facilities and the academic environment. The PhD-Associate Scholarship—PASS program provided support for this research through the Centre National pour la Recherche Scientifique et Technique (CNRST).

Conflicts of Interest

The authors declare no conflicts of interest.

Abbreviations

The following abbreviations are used in this manuscript:
CFDComputational Fluid Dynamics
CADComputer-Aided Design
CLLift Coefficient
CDDrag Coefficient
TKETurbulent Kinetic Energy

References

  1. Ettaye, G.; El Barkany, A.; Jabri, A.; El Khalfi, A. Optimizing the integrated production and maintenance planning using genetic algorithm. Int. J. Eng. Bus. Manag. 2018, 10, 1–9. [Google Scholar] [CrossRef]
  2. El-Mekkaoui, J.; Elkhalfi, A.; Elakkad, A. Resolution of stokes equations with the Ca,b boundary condition using mixed finite element method. WSEAS Trans. Math. 2013, 12, 586–597. [Google Scholar]
  3. El Fakkoussi, S.; Moustabchir, H.; Elkhalfi, A.; Pruncu, C.I. Application of the extended isogeometric analysis (X-IGA) to evaluate a pipeline structure containing an external crack. J. Eng. 2018, 2018, 4125765. [Google Scholar] [CrossRef]
  4. Huminic, A.; Huminic, G. Aerodynamics of curved underbody diffusers using CFD. J. Wind. Eng. Ind. Aerodyn. 2020, 205, 104300. [Google Scholar] [CrossRef]
  5. Naidu, S.R.M.; Madhavan, V.; Chinta, S.; Manikandan, R.; Premkumar, A.; Girimurugan, R. Analysis of aerodynamic characteristics of car diffuser for dissimilar diffuser angles on Sedan’s using CFD. Mater. Today Proc. 2023, 92, 240–248. [Google Scholar] [CrossRef]
  6. Rossitto, G.; Sicot, C.; Ferrand, V.; Borée, J.; Harambat, F. Aerodynamic performances of rounded fastback vehicle. Proc. Inst. Mech. Eng. Part D J. Automob. Eng. 2017, 231, 1211–1221. [Google Scholar] [CrossRef]
  7. Beigmoradi, S.; Hajabdollahi, H.; Ramezani, A. Multi-objective aero acoustic optimization of rear end in a simplified car model by using hybrid Robust Parameter Design, Artificial Neural Networks and Genetic Algorithm methods. Comput. Fluids 2014, 90, 123–132. [Google Scholar] [CrossRef]
  8. Connolly, M.G.; Ivankovic, A.; O’Rourke, M.J. Drag reduction technology and devices for road vehicles—A comprehensive review. Heliyon 2024, 10, e33757. [Google Scholar] [CrossRef]
  9. Keirsbulck, L.; Cadot, O.; Lippert, M.; Boussemart, D.; Basley, J.; Delprat, S.; Paganelli, S. Underbody flow control for base drag reduction of a real car model. J. Wind Eng. Ind. Aerodyn. 2024, 252, 105822. [Google Scholar] [CrossRef]
  10. Bao, D.; Borée, J.; Sicot, C.; Roebroeck, C. Salient features of wheel-vehicle aerodynamic interactions: Consequences for drag. J. Wind. Eng. Ind. Aerodyn. 2023, 236, 105366. [Google Scholar] [CrossRef]
  11. Hung Tran, T.; Hijikuro, M.; Anyoji, M.; Uchida, T.; Nakashima, T.; Shimizu, K. Surface flow and aerodynamic drag of Ahmed body with deflectors. Exp. Therm. Fluid Sci. 2023, 145, 110887. [Google Scholar] [CrossRef]
  12. Qin, P.; Ricci, A.; Blocken, B. CFD simulation of aerodynamic forces on the DrivAer car model: Impact of computational parameters. J. Wind. Eng. Ind. Aerodyn. 2024, 248, 105711. [Google Scholar] [CrossRef]
  13. Nath, D.S.; Pujari, P.C.; Jain, A.; Rastogi, V. Drag reduction by application of aerodynamic devices in a race car. Advances in Aerodynamics 2021, 3, 4. [Google Scholar] [CrossRef]
  14. Sudin, M.N.; Abdullah, M.A.; Shamsuddin, S.A.; Ramli, F.R.; Tahir, M.M. Review of research on vehicles aerodynamic drag reduction methods. Int. J. Mech. Mechatron. Eng. 2014, 14, 35–47. [Google Scholar]
  15. Loução, R.; Duarte, G.O.; Mendes, M.J.G.C. Aerodynamic Study of a Drag Reduction System and Its Actuation System for a Formula Student Competition Car. Fluids 2022, 7, 309. [Google Scholar] [CrossRef]
  16. Zaareer, M.N.M.; Mourad, A.H.I.; Darabseh, T.; Khan, S.H.; Elgendi, M. Impact of a vehicle exhaust pipe position on the lift and drag coefficients: 2D and 3D simulations. Int. J. Thermofluids 2023, 18, 100321. [Google Scholar] [CrossRef]
  17. Hoque, M.A.; Rahman, M.S.; Rimi, K.N.; Alif, A.R.; Haque, M.R. Enhancing formula student car performance: Nose shape optimization via adjoint method. Results Eng. 2023, 20, 101636. [Google Scholar] [CrossRef]
  18. Costa, E.; Biancolini, M.E.; Groth, C.; Cella, U.; Veble, G.; Andrejasic, M. RBF-based aerodynamic optimization of an industrial glider. In Proceedings of the International CAE Conference, Verona, Italy, 27–28 October 2014. [Google Scholar]
  19. Hetawal, S.; Gophane, M.; Ajay, B.K.; Mukkamala, Y. Aerodynamic study of formula SAE car. Procedia Eng. 2014, 97, 1198–1207. [Google Scholar] [CrossRef]
  20. Szudarek, M.; Piechna, J. Cfd analysis of the influence of the front wing setup on a time attack sports car’s aerodynamics. Energies 2021, 14, 7907. [Google Scholar] [CrossRef]
  21. Elrawemi, M.; Ibrahim Aburawey, I. The effect of front and rear windscreen angles on the aerodynamic drag force of a simplified car model. Int. J. Energy Appl. Technol. 2019, 6, 83–88. [Google Scholar] [CrossRef]
  22. Malça, C.; Alves, N.; Mateus, A. Aerodynamic Analysis of a Frontal Deflector for Vehicles. Int. J. Mech. Mechatron. Eng. 2015, 9, 60–64. [Google Scholar]
  23. Erdem, C.; Eulalie, Y.; Gilotte, P.; Harries, S.; Nayeri, C.N. Aerodynamic Optimization of a Reduced Scale Model of a Ground Vehicle with a Shape Morphing Technique. Fluids 2022, 7, 166. [Google Scholar] [CrossRef]
  24. Piratla, S. Evaluating the aerodynamics of different passenger vehicle configurations. Automot. Engine Technol. 2023. [Google Scholar] [CrossRef]
  25. Abdellah, E.; Wang, B. CFD analysis on effect of front windshield angle on aerodynamic drag. In Proceedings of the IOP Conference Series: Materials Science and Engineering, Singapore, 28–30 July 2017; Volume 231. [Google Scholar] [CrossRef]
  26. Yan, C.; Lai, C.; Wang, Q.; Hu, B.; Deng, L. Aerodynamic drag reduction in a vehicle based on efficient global optimisation. J. Eng. 2019, 2019, 384–391. [Google Scholar] [CrossRef]
  27. Sahay, A.; Kumar, G.; Shivvedic, K. CFD Analysis on the Effect of the Change in Profile Geometry on Drag Reduction of a Sedan Car. Int. J. Curr. Eng. Technol. 2021, 10, 723–729. [Google Scholar] [CrossRef]
  28. Wu, B.; Chen, L.; Guan, Q.; Xiao, L.; Yuan, X. Aerodynamic optimization analysis of the front bumper side of the vehicle. J. Phys. Conf. Ser. 2023, 2441, 012006. [Google Scholar] [CrossRef]
  29. Kücüksariyildiz, H.; Canli, E.; Carman, K. Experimentally detected aerodynamic drag coefficient of the agricultural tractor form considering effects of windshield angle and hood front shape. Energy 2024, 296, 131167. [Google Scholar] [CrossRef]
  30. Hu, X.; Zhang, R.; Ye, J.; Yan, X.; Zhao, Z. Influence of different diffuser angle on Sedan’s aerodynamic characteristics. Phys. Procedia 2011, 22, 239–245. [Google Scholar] [CrossRef]
  31. Xingjun, H.; Bo, Y.; Jing-Yu, W.; Ting, L. Research on Influences of Rear-View Mirror on Aerodynamic Drag Characteristics of Truck. In: Journal of Hunan University Natural Sciences. 2010. Available online: https://www.researchgate.net/publication/290730860_Research_on_influences_of_rear-view_mirror_on_aerodynamic_drag_characteristics_of_truck (accessed on 25 March 2025).
  32. Hu, X.J.; Qin, P.; Guo, P.; An, Y. Effect of Turbulence Parameters on Numerical Simulation of Complex Automotive External Flow Field. Appl. Mech. Mater. 2011, 52–54, 1062–1067. [Google Scholar] [CrossRef]
  33. Rakibul Hassan, S.M.; Islam, T.; Ali, M.; Islam, M.Q. Numerical study on aerodynamic drag reduction of racing cars. Procedia Eng. 2014, 90, 308–313. [Google Scholar] [CrossRef]
  34. Kurec, K.; Remer, M.; Piechna, J. The influence of different aerodynamic setups on enhancing a sports car’s braking. Int. J. Mech. Sci. 2019, 164, 105140. [Google Scholar] [CrossRef]
  35. Rossitto, G.; Sicot, C.; Ferrand, V.; Borée, J.; Harambat, F. Influence of afterbody rounding on the pressure distribution over a fastback vehicle. Exp. Fluids 2016, 57, 43. [Google Scholar] [CrossRef]
Figure 1. Geometric model of the car.
Vehicles 07 00130 g001
Figure 2. Dimensions of a car.
Vehicles 07 00130 g002
Figure 3. Tested front bumper configurations (0°; 4°; 8°; −4°).
Vehicles 07 00130 g003
Figure 4. Overall dimensions of computational domain (unit: mm).
Vehicles 07 00130 g004
Figure 5. Meshed model.
Vehicles 07 00130 g005
Figure 6. Boundary conditions (airflow inlet and outlet).
Vehicles 07 00130 g006
Figure 7. Diagram of the parametric workflow.
Vehicles 07 00130 g007
Figure 8. Evolution of turbulent kinetic energy (TKE) with bumper angle.
Vehicles 07 00130 g008
Figure 9. Pressure distribution for 0° front bumper angle.
Vehicles 07 00130 g009
Figure 10. Velocity distribution for 0° front bumper angle.
Vehicles 07 00130 g010
Figure 11. Streamlines for 0° front bumper angle.
Vehicles 07 00130 g011
Figure 12. Turbulence kinetic energy distribution for 0° front bumper angle.
Vehicles 07 00130 g012
Figure 13. Pressure distribution for 4° front bumper angle.
Vehicles 07 00130 g013
Figure 14. Velocity distribution for 4° front bumper angle.
Vehicles 07 00130 g014
Figure 15. Streamlines for 4° front bumper angle.
Vehicles 07 00130 g015
Figure 16. Turbulence kinetic energy distribution for 4° front bumper angle.
Vehicles 07 00130 g016
Figure 17. Pressure distribution for 8° front bumper angle.
Vehicles 07 00130 g017
Figure 18. Velocity distribution for 8° front bumper angle.
Vehicles 07 00130 g018
Figure 19. Streamlines for 8° front bumper angle.
Vehicles 07 00130 g019
Figure 20. Turbulence kinetic energy distribution for 8° front bumper angle.
Vehicles 07 00130 g020
Figure 21. Pressure Distribution for −4° Front Bumper Angle.
Vehicles 07 00130 g021
Figure 22. Velocity distribution for −4° front bumper angle.
Vehicles 07 00130 g022
Figure 23. Streamlines for −4° front bumper angle.
Vehicles 07 00130 g023
Figure 24. Turbulence kinetic energy distribution for −4° front bumper angle.
Vehicles 07 00130 g024
Figure 25. Evolution of the drag coefficient (Cd) as a function of the bumper angle.
Vehicles 07 00130 g025
Figure 26. Evolution of the lift coefficient (Cl) as a function of the bumper angle.
Vehicles 07 00130 g026
Figure 27. Response surface Cd = f(angle).
Vehicles 07 00130 g027
Figure 28. Response surface Cl = f(angle).
Vehicles 07 00130 g028
Figure 29. Residual plots for model validation.
Vehicles 07 00130 g029
Figure 30. Local sensitivity curves.
Vehicles 07 00130 g030
Figure 31. Reliability radar.
Vehicles 07 00130 g031
Figure 32. Optimization convergence criteria.
Vehicles 07 00130 g032
Figure 33. Pareto curve.
Vehicles 07 00130 g033
Table 1. Mesh convergence results (Cd and Cl).
Mesh DensityNumber of NodesNumber of ElementsCdClVariation Cd vs. MediumVariation Cl vs. Medium
Coarse500,0001,500,0000.2730.022+1.11%+4.76%
Medium715,9732,142,1910.2700.021
Fine1,000,0003,000,0000.2690.021−0.37%0.00%
Table 2. Boundary conditions.
RegionBoundary Conditions
InletVelocity inlet: speed magnitude of 30 m/s
OutletPressure outlet
RoadMoving wall: speed magnitude of 30 m/s
Top + Symmetry + SideSymmetry (eliminating fluid/wall friction)
BodyStationary wall
Table 3. Reference values.
PropertyValue
Area (m2)1.608
Density (kg/m3)1.225
Length (mm)4600
Pressure (Pascal)0
Temperature (K)288.16
Velocity (m/s)30
Viscosity (kg/m·s)1.7894 × 10−5
Ratio of specific heats1.4
Reynolds number9.45 × 106
Table 4. Effect of bumper angle variation on Cd, Cl, velocity, pressure, and turbulence.
Case NameFront Bumper AnglesCdClMax Velocity (m/s)Max Pressure (Pa)TKE (m2/s2)
Case one−4°0.290.02247.46545.74170.81
Case two (the reference state)0.270.02953.23554.74174.88
Case three0.260.03051.07565.73179.04
Case four0.280.03346.73555.73181.91
Table 5. Summary of physical flow behavior and its aerodynamic impact for each configuration.
Front Bumper AngleFlow BehaviorPressure ZonesEffect on Drag (Cd)Effect on Lift (Cl)
0° (reference)Stable and symmetric flowModerate front surface pressureMedium (Cd = 0.27)Medium (Cl = 0.029)
Well-attached flow, optimized deviationLower pressure peaks, smoothLow (Cd = 0.26)Slightly increased (Cl = 0.030)
Flow deflected upward, high-speed underbodyStrong underbodyIncreased (Cd = 0.28)High (Cl = 0.033)
−4°Flow deflected downward, recirculation zoneStrong overpressure under the vehicleHigh (Cd = 0.29)Low (Cl = 0.022)
Table 6. Results table automatically generated from the simulations performed using ANSYS DesignXplorer.
NameP1—AngP2—CdP3—Cl
1−60.300150.01598
2−40.290560.02224
3−20.275430.02676
400.270670.02993
520.265730.03113
6          DP040.260210.03010
760.265980.03196
880.280350.03336
9100.285270.03627
Table 7. Optimal candidate result.
ReferenceNameP1-AngP2—CdP3—Cl
Parameter ValueVariation Relative to ReferenceParameter ValueVariation Relative to Reference
Candidate point 13.99980.260170.00%0.030200.00%
Candidate point 23.99870.260170.00%0.030210.01%
Candidate point 33.99740.260180.00%0.030230.01%
Table 8. Comparative analysis of CFD methods: manual simulation vs. parametric optimization.
CriterionANSYS Fluent (Manual Simulation)ANSYS DesignXplorer (Parametric Optimization)
ObjectiveEvaluate fixed casesAutomatically identify an optimal configuration
MethodDescriptive study on 4 manually defined anglesDesign of Experiments (DoE) + statistical modeling + multi-objective optimization
Number of cases exploredLimited (4 cases: −4°, 0°, 4°, 8°)Extended (e.g., 9+ cases between −6° and 10°, automatically generated)
Nature of the approachDiscrete and manualContinuous, automated, and systematic
Results obtainedDirect comparison of Cd and Cl coefficientsResponse surfaces, sensitivity curves, validated optimal point
LimitationsLocal results, no guarantee of optimalityGlobal exploration of the design space with convergence validation
Added valuePhysical flow visualizationReproducible and robust optimal prediction for engineering
Industrial relevanceUseful study but not sufficient for design officesDirectly applicable approach in industrial optimization processes
Disclaimer/Publisher’s Note: The statements, opinions and data contained in all publications are solely those of the individual author(s) and contributor(s) and not of MDPI and/or the editor(s). MDPI and/or the editor(s) disclaim responsibility for any injury to people or property resulting from any ideas, methods, instructions or products referred to in the content.