Article

Revealing the Impact Factors of the Electric Bike Riders’ Violation Riding Behaviors in China: Integrating SEM with RP-Logit Model

1
Department of Civil Engineering, Tsinghua University, Beijing 100084, China
2
Key Laboratory of Transport Industry of Big Data Application Technologies for Comprehensive Transport, Beijing Jiao Tong University, Beijing 100044, China
*
Author to whom correspondence should be addressed.
Vehicles 2025, 7(4), 122; https://doi.org/10.3390/vehicles7040122 (registering DOI)
Submission received: 24 September 2025 / Revised: 18 October 2025 / Accepted: 23 October 2025 / Published: 26 October 2025

Abstract

The purpose of this study was to investigate how environmental judgments and psychological factors jointly influence self-reported violation riding behaviors among e-bike riders in China, with attention to sociodemographic heterogeneity. To achieve this, the e-bike violation riding behavior questionnaire was designed. Additionally, a hybrid approach integrating the Structural Equation Model (SEM) with the Random Parameters Logit (RP-Logit) model was constructed to reveal the impact factors of e-bike riders’ violation riding behaviors, in which demographic information and latent variables were comprehensively considered. This methodology simultaneously analyzed the complex relationships among latent variables (measured by SEM) and captured the heterogeneous effects of demographic factors on discrete violation tendencies (modeled by RP-Logit). The following two main findings emerged: (1) Experienced riders and those who use e-bikes as operating tools tend to exhibit a higher tendency to engage in violation riding. (2) Perceived Risk has the greatest impact on the performance of high-violation tendencies. Specifically, the probability of choosing high-violation riding behaviors decreases by 0.18 for each unit increase in the rider’s Perceived Risk. (3) Similarly, for each unit increase in riders’ Perceived Law Enforcement, the probability of choosing high-violation riding behaviors decreases by 0.15. The findings suggest that relevant authorities should address e-bike violation behaviors through enhanced safety education and strengthened enforcement measures, particularly targeting high-risk rider groups.

1. Introduction

With the continuous expansion of the cityscape, the daily travel distance of residents is also increasing, and electric bikes (e-bikes), by virtue of their flexible, economic, and fast characteristics, have become one of the preferred modes of transportation for many travelers [1]. Additionally, e-bikes may further enhance cyclist mode satisfaction [2]. Defined by the China Bicycle Association, e-bikes are electrically propelled bicycles, a feature which is available till the maximum designed speed [3]. Consequently, the high-risk behaviors of e-bike riders in the process of riding have become important factors leading to the frequent occurrence of traffic accidents, and these violations of traffic laws show a high degree of correlation with the occurrence of accidents [4,5]. In many Chinese cities, the average number of daily riding violations, as shown by data, for e-bikes is high, and e-bike fatalities due to rider violations account for as much as two-thirds of all e-bike fatalities nationwide.
In order to improve traffic law compliance among e-bikes, Structural Equation Model (SEM) has been extensively employed in prior studies due to its capacity to simultaneously analyze latent variables and observed variables, and to test complex causal pathways, including mediating and moderating effects, among the multi-dimensional factors influencing riding behavior. Using Structural Equation Modeling (SEM), studies have thoroughly analyzed risky riding behaviors, revealing that internal attitudes towards safety [6], and external attitudes, were the main influencing factors [7]. Furthermore, some of the existing literature indicates that a rider’s perception of the external environment plays a significant role in shaping their behavioral decisions. Some studies have shown that people’s Perceived Legal Norm (PLN) [8,9,10] and Perceived Social Compliance (PSC) [11] can affect their driving behaviors. Perceived Legal Norm is the perception of road users regarding the level of consequences for violating traffic rules [8]. Perceived Social Compliance is the perception of road users regarding the level at which cyclists, in general society, comply with traffic regulations [11]. In addition, enforcing traffic laws is highlighted by existing studies as potentially pertinent alternatives to increasing risk perception, and reducing risky behaviors, road conflicts and crash likelihood among e-bike riders [12]. These perceptions form the basis of riders’ judgments concerning the ‘regulatory constraint’ and ‘prevailing behavioral norms’ within their riding environment. To concisely encapsulate this core external cognitive dimension, this study proposes the integrative construct of ‘Environmental Judgment’. This construct systematically encompasses riders’ subjective assessments of both the intensity of law enforcement and the general level of traffic rule compliance within society. Its conceptual definition and operational measurement dimensions will be elaborated upon in subsequent sections.
With the development of the research, many scholars have further incorporated demographic information into the scope of consideration, and have comprehensively analyzed how the demographic information and the latent variable factors work together to influence riders’ riding behaviors. Liu and Chen [13] analyzed college students’ phone behavior while riding, using a hierarchical regression model, which considered demographic factors and psychological factors from the extended theory of planned behavior. Useche et al. [14] utilized a Structural Equation Model (SEM) to establish that riders’ accident rates are influenced by hazardous riding behaviors, perceived risk, and safety knowledge, with age serving as a key factor that reveals the structural differences in the model. In a related study, Zhang et al. [15] employed SEM with mediation analysis to examine the impact of latent variables on violation riding behavior (VRB); they also used Pearson’s correlation analysis to determine the relationship between VRB and demographic factors, finding that gender, age, and the frequency of shared e-bike use were negatively correlated with VRB. Similarly, a mediation analysis based on SEM confirmed that descriptive norms, conformity tendency, and past behavior significantly influence violation riding behavior and accident proneness [16]. Furthermore, Qian and Shi [17] applied both SEM and ANOVA to analyze illegal lane-transgressing behaviors across different types of two-wheelers.
In summary, scholars have explored the characteristics of violation riding behavior by incorporating more expanded latent variables. However, the current research focuses on the psychological latent variable factors, and seldom includes the demographic information factors, environmental judgment factors, and psychological factors in the analytical framework, which restricts the comprehensiveness of their causal analyses. To address these gaps in the current research, this study constructed a hybrid approach integrating the SEM and Random Parameters Logit (RP-Logit) model to reveal the impact factors of e-bike violation riding behaviors, taking into account demographic information, environmental judgments and psychological latent variable factors. SEM will be utilized to analyze the complex causal pathways among latent variables, specifically the Environmental Judgment and Psychological Factors. Concurrently, RP-Logit will be employed to effectively capture the heterogeneous impact of Demographic Variables on discrete behavioral choices. The model aimed to deeply explore the complex relationship between these factors and the violation riding behavior.

2. Methodology

This study aims to investigate how environmental judgments and psychological factors jointly influence self-reported violation riding behaviors among e-bike riders in China, with attention to sociodemographic heterogeneity. The Theory of Planned Behavior (TPB) provides a foundational theoretical framework for understanding the formation of behavioral intentions [18], but its core constructs may not fully capture the complex decision-making landscape of e-bike violation riding, and particularly the influence of the immediate environmental context. To address this, rather than strictly adhering to the framework, this study proposes a more comprehensive integrated framework. This framework synergistically combines psychological factors (including the well-established TPB constructs of Subjective Norm (SN) and Perceived Behavioral Control (PBC), alongside extended variables such as Conformity Tendency (CT) and Perceived Risk (PR)) with environmental judgments (Perceived Legal Norm and Perceived Social Compliance). This approach allows for a holistic examination of how both internal cognitions and external perceptions jointly influence riders’ behavioral choices. Previous studies have integrated Conformity Tendency and Perceived Risk into the TPB framework, demonstrating their effectiveness in predicting behavioral outcomes [15,16,19,20]. Conformity Tendency reflects riders’ tendency to imitate the violating behaviors of others, while Perceived Risk refers to their subjective assessment of the potential risks associated with such behaviors.
Furthermore, although Perceived Legal Norm and Perceived Social Compliance have been relatively understudied in the context of e-bike riding behavior, they serve as important environmental judgment variables that contribute significantly to understanding behavioral decision-making [8,11]. Perceived Social Compliance is of particular interest, as it captures riders’ perception of the broader social normative atmosphere, which may directly influence their intention to comply with traffic rules.
In summary, this study develops a theoretical model (Figure 1) incorporating Subjective Norm, Perceived Behavioral Control, Conformity Tendency, Perceived Risk, Perceived Legal Norm, and Perceived Social Compliance. Among these, Perceived Legal Norm and Perceived Social Compliance are treated as environmental judgments, while the others represent psychological factors. Together, these factors provide a comprehensive framework for examining their relationships with e-bike violation behaviors. The psychological factors include Subjective Norm and Perceived Behavioral Control, alongside extended variables such as Conformity Tendency and Perceived Risk. The environmental dimension comprises Perceived Legal Norm and Perceived Social Compliance. This holistic approach aims to provide a more complete understanding of the determinants of e-bike violation behaviors (Figure 1). This figure illustrates the hypothesized relationships between psychological factors (Subjective Norm, Perceived Behavioral Control, Conformity Tendency, and Perceived Risk), environmental judgments (Perceived Law Enforcement and Perceived Social Compliance), and violation riding behaviors (VRBs).
This study establishes the path assumptions (Table 1).

2.1. Model Structure

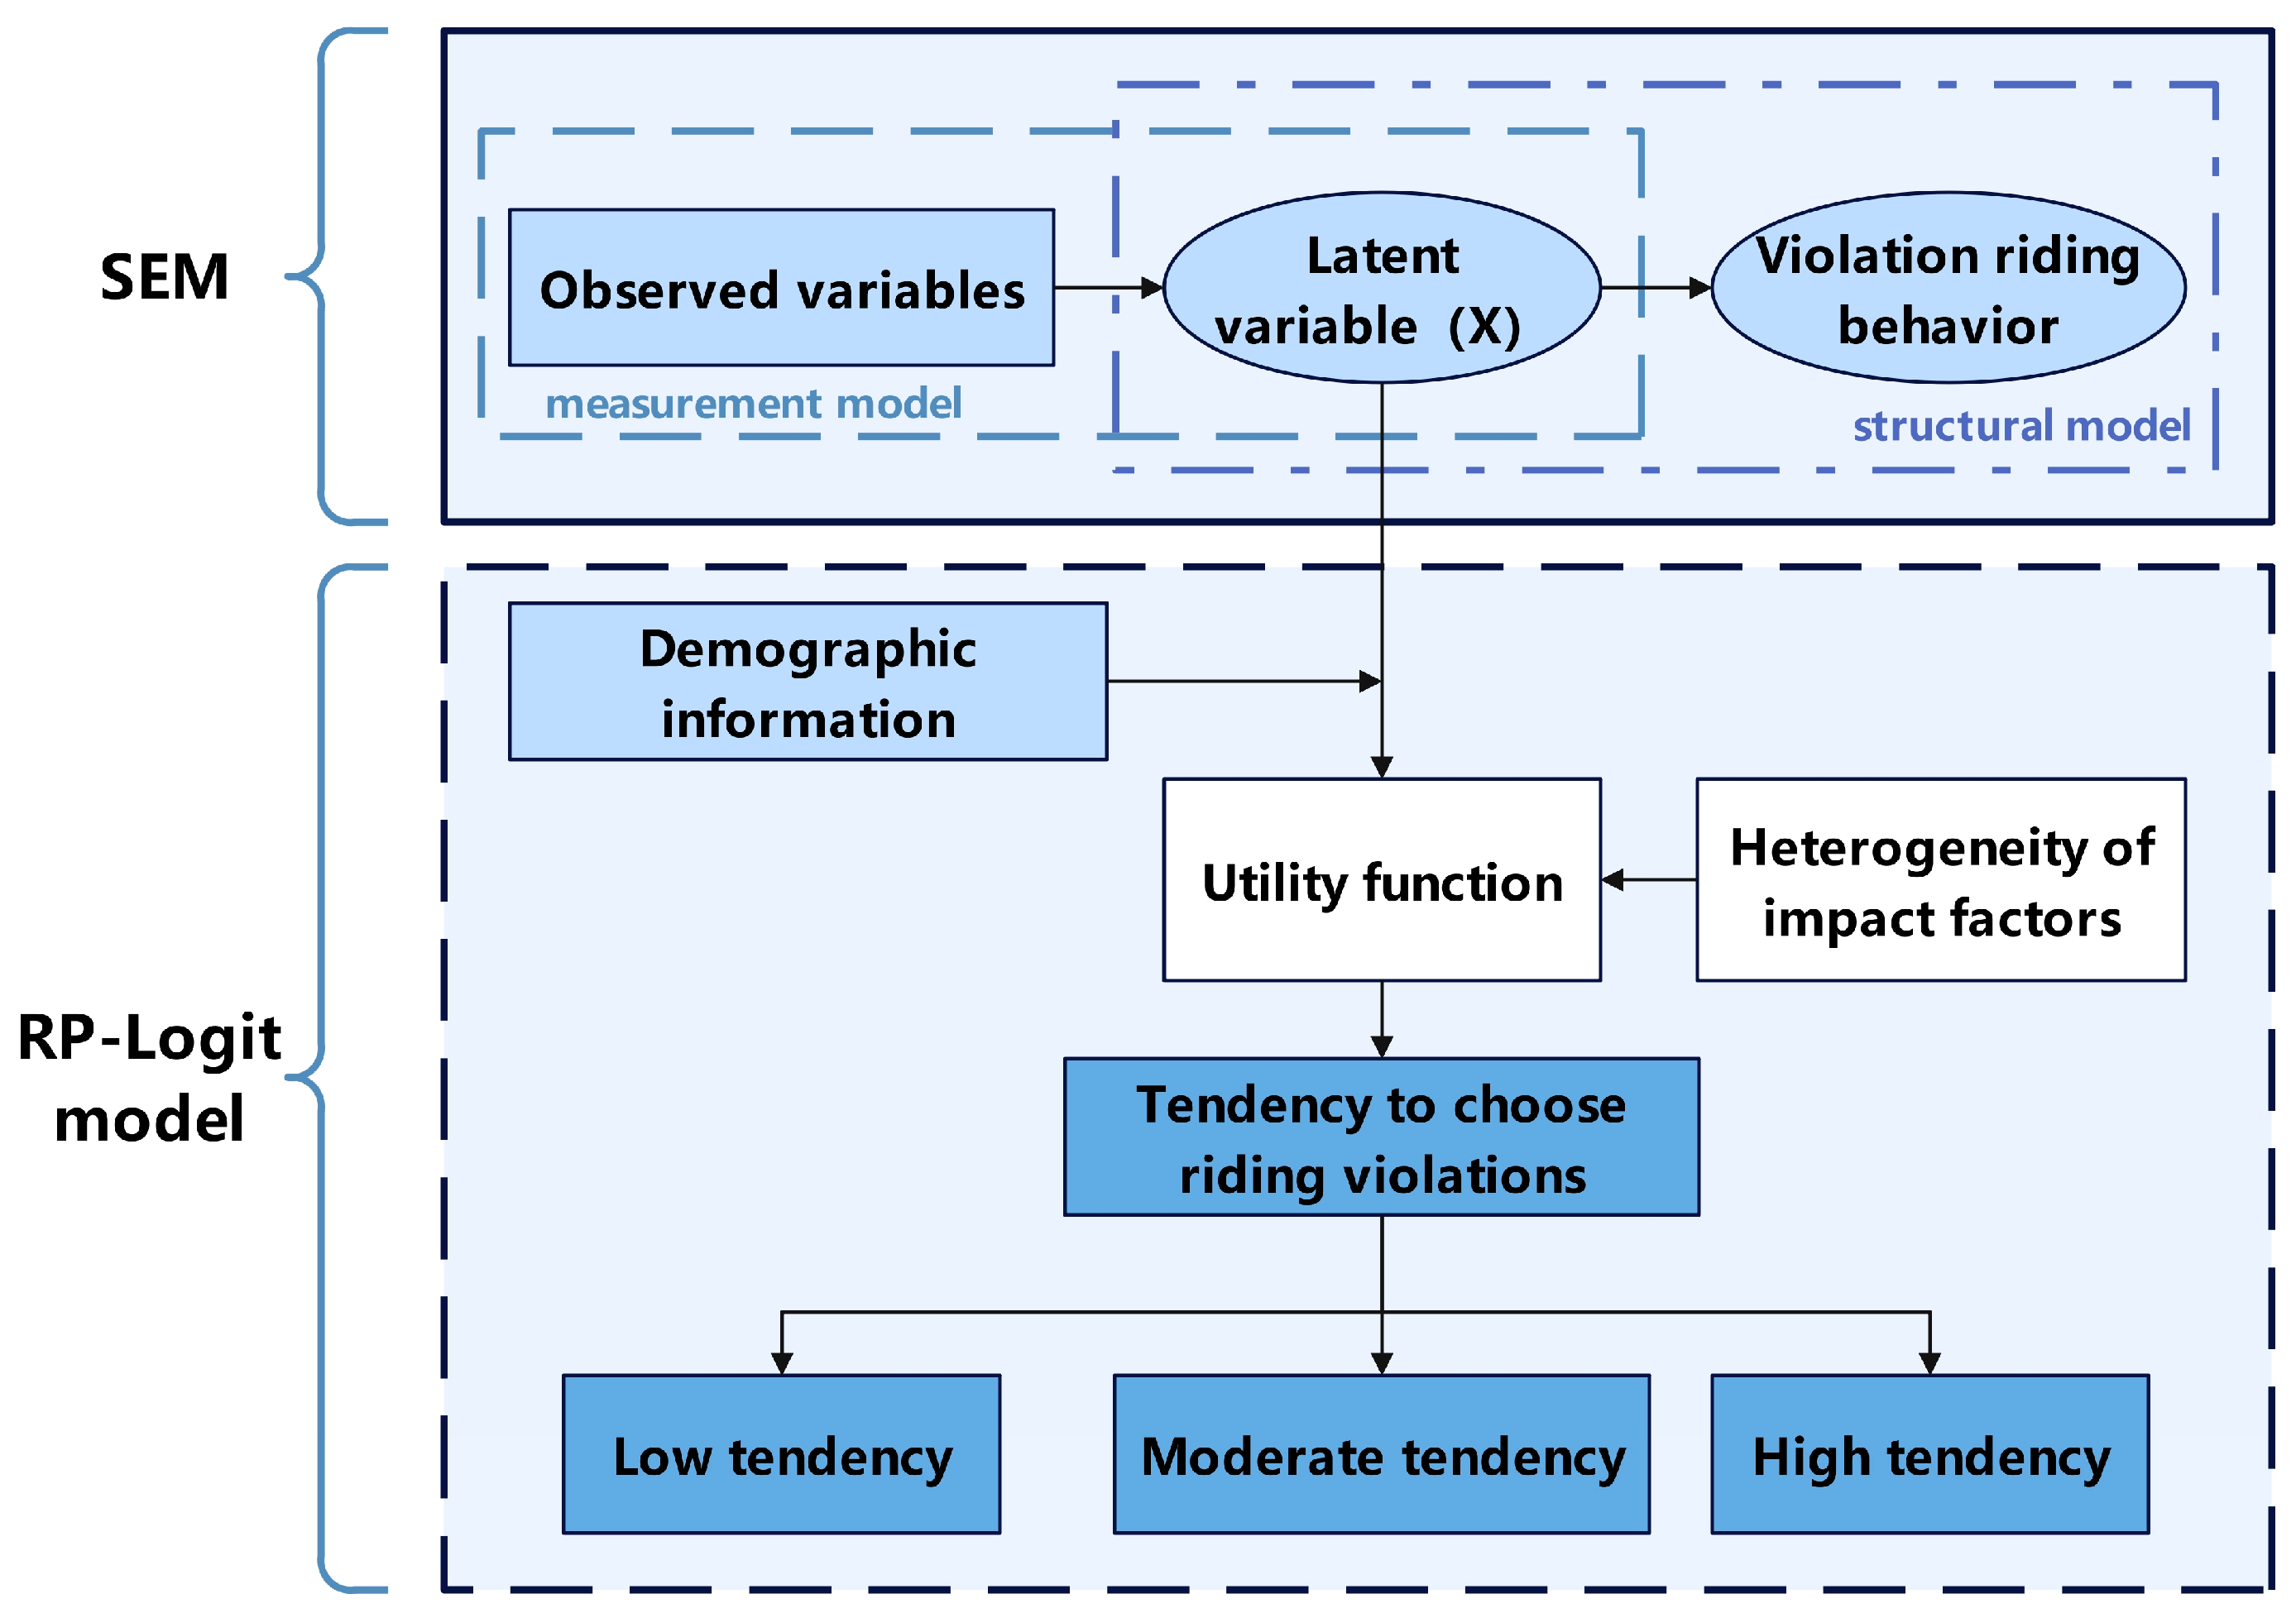
In behavioral choice research, considering both explicit variables that are easy to measure directly and latent variables that are difficult to quantify directly, many studies integrated the SEM with the Logit model and proposed a hybrid model based on SEM and Logit for the study of choice behavior [21,22,23,24,25,26]. Therefore, this study integrates the SEM with the RP-Logit model (SEM-RP-Logit model) to analyze violation riding behavior. In this hybrid approach (Figure 2), SEM is used to characterize the relationship between latent variables and observed variables. Then, using parameter estimation results for SEM, the psychological latent variables are incorporated into the RP-Logit model [27]. The RP-Logit model is used to analyze the impact factors of violation riding behavior, i.e., to explain riders’ violation riding behavior by analyzing the magnitude of the utility of various psychological latent variables and demographic information on riders’ different tendencies with regard to violation riding behavior.

2.2. Latent Variable Fitness Values

The SEM-RP-Logit model constructed in this study not only takes into account demographic information, but also explores the mechanisms of psychological latent variables affecting violation riding behavior, so it is necessary to calculate the fitness value of each latent variable. By calculating the fitness value of each latent variable, as shown in Equation (1), the latent variables can be transformed into variables that can be added to the RP-Logit model. Assume that there are n observed variables for the exogenous latent variable η , and they are x 1 , x 2 , …, x n .
x 1 x 2 x n = Λ x 1 Λ x 2 Λ x n η
where Λ x 1 Λ x n is the regression coefficient between the observed variable and the latent variable.
Normalizing the factor loadings Λ x 1 Λ x n as weights of the observed variables yields a the following fitness index:
τ x i = Λ x i / i = 1 n Λ x i
Therefore, the fitness value of each latent variable is:
η i = τ x 1 x 1 + τ x 2 x 2 + + τ x n x n

2.3. Construction of the Effect Function and Analysis of Marginal Effects

The utility function of the SEM-RP-Logit model is as Equation (4).
V i n = a i n M i n + ε i n
where V i n denotes the utility function of a rider’s tendency to ride in violation of i , i = 1 , 2 , 3 represents low, medium and high tendencies to ride in violation, respectively; n indicates rider code; M i n denote the impact factor set; a i n are vectors of parameters influencing the tendency to violate among riders; and ε i n is the error term, assuming ε i n generalized extreme values distribute [28].
a i n = α i + A i ω i n
where A i are the standard deviations of α i , which indicate the interaction of the influences on the tendency to violate; and ω i n is the variance parameter for the tendency to violate as i , which has a mean of 0 and a standard deviation of 1 [29].
Heterogeneity is considered in the SEM-RP-Logit model, and the probability function of the model is as Equation (6).
P i n = exp a i M i n exp a I M i n f a i M i n | ω i n d ω i n
where f a i M i n | ω i n is the probability density function of the parameter a i n , which is generally considered to follow a multivariate normal distribution; and I is the set of all possible values of the violation tendency.
The marginal effect describes the extent to which a rider’s extent of offending riding tendency changes when there is a unit change in a variable:
M Q n k P i n = P i n / Q n k
where Q n k denotes the k impact factor in the set rider influences.

3. Data and Analysis

3.1. Questionnaire Design and Data Testing

3.1.1. Questionnaire Design

Since the latent variables such as Subjective Norm, Perceived Risk, and Violation Riding Behavior cannot be obtained by means of intuitive measurement or observation, in order to obtain the measured values of the latent variables, the observational variables corresponding to them should be designed to ensure that they truly reflect the actual conditions of the latent variables. Therefore, when conducting the questionnaire design, in addition to the questions of the basic information scale, we referred to previous studies to put the riders in a hypothetical scenario [6,16,19,20,30], which was as follows: assume that you are riding an e-bike on your way to work, school, or out of the office and are in a great hurry; you can now choose a variety of violations of the ride in order to improve the efficiency of the ride. The questionnaire is shown in Table A1.

3.1.2. Data Collection and Reliability Verification

The questionnaire survey for this study was conducted between March and April 2024. For data collection, both on-site and online research were conducted, and it was determined that the minimum sample size should be greater than 10 times the number of questionnaire questions [31], so at least 150 questionnaires needed to be collected. In total, 226 questionnaires were collected, of which 11 were invalid, and 215 qualified questionnaires were finally used for analysis.
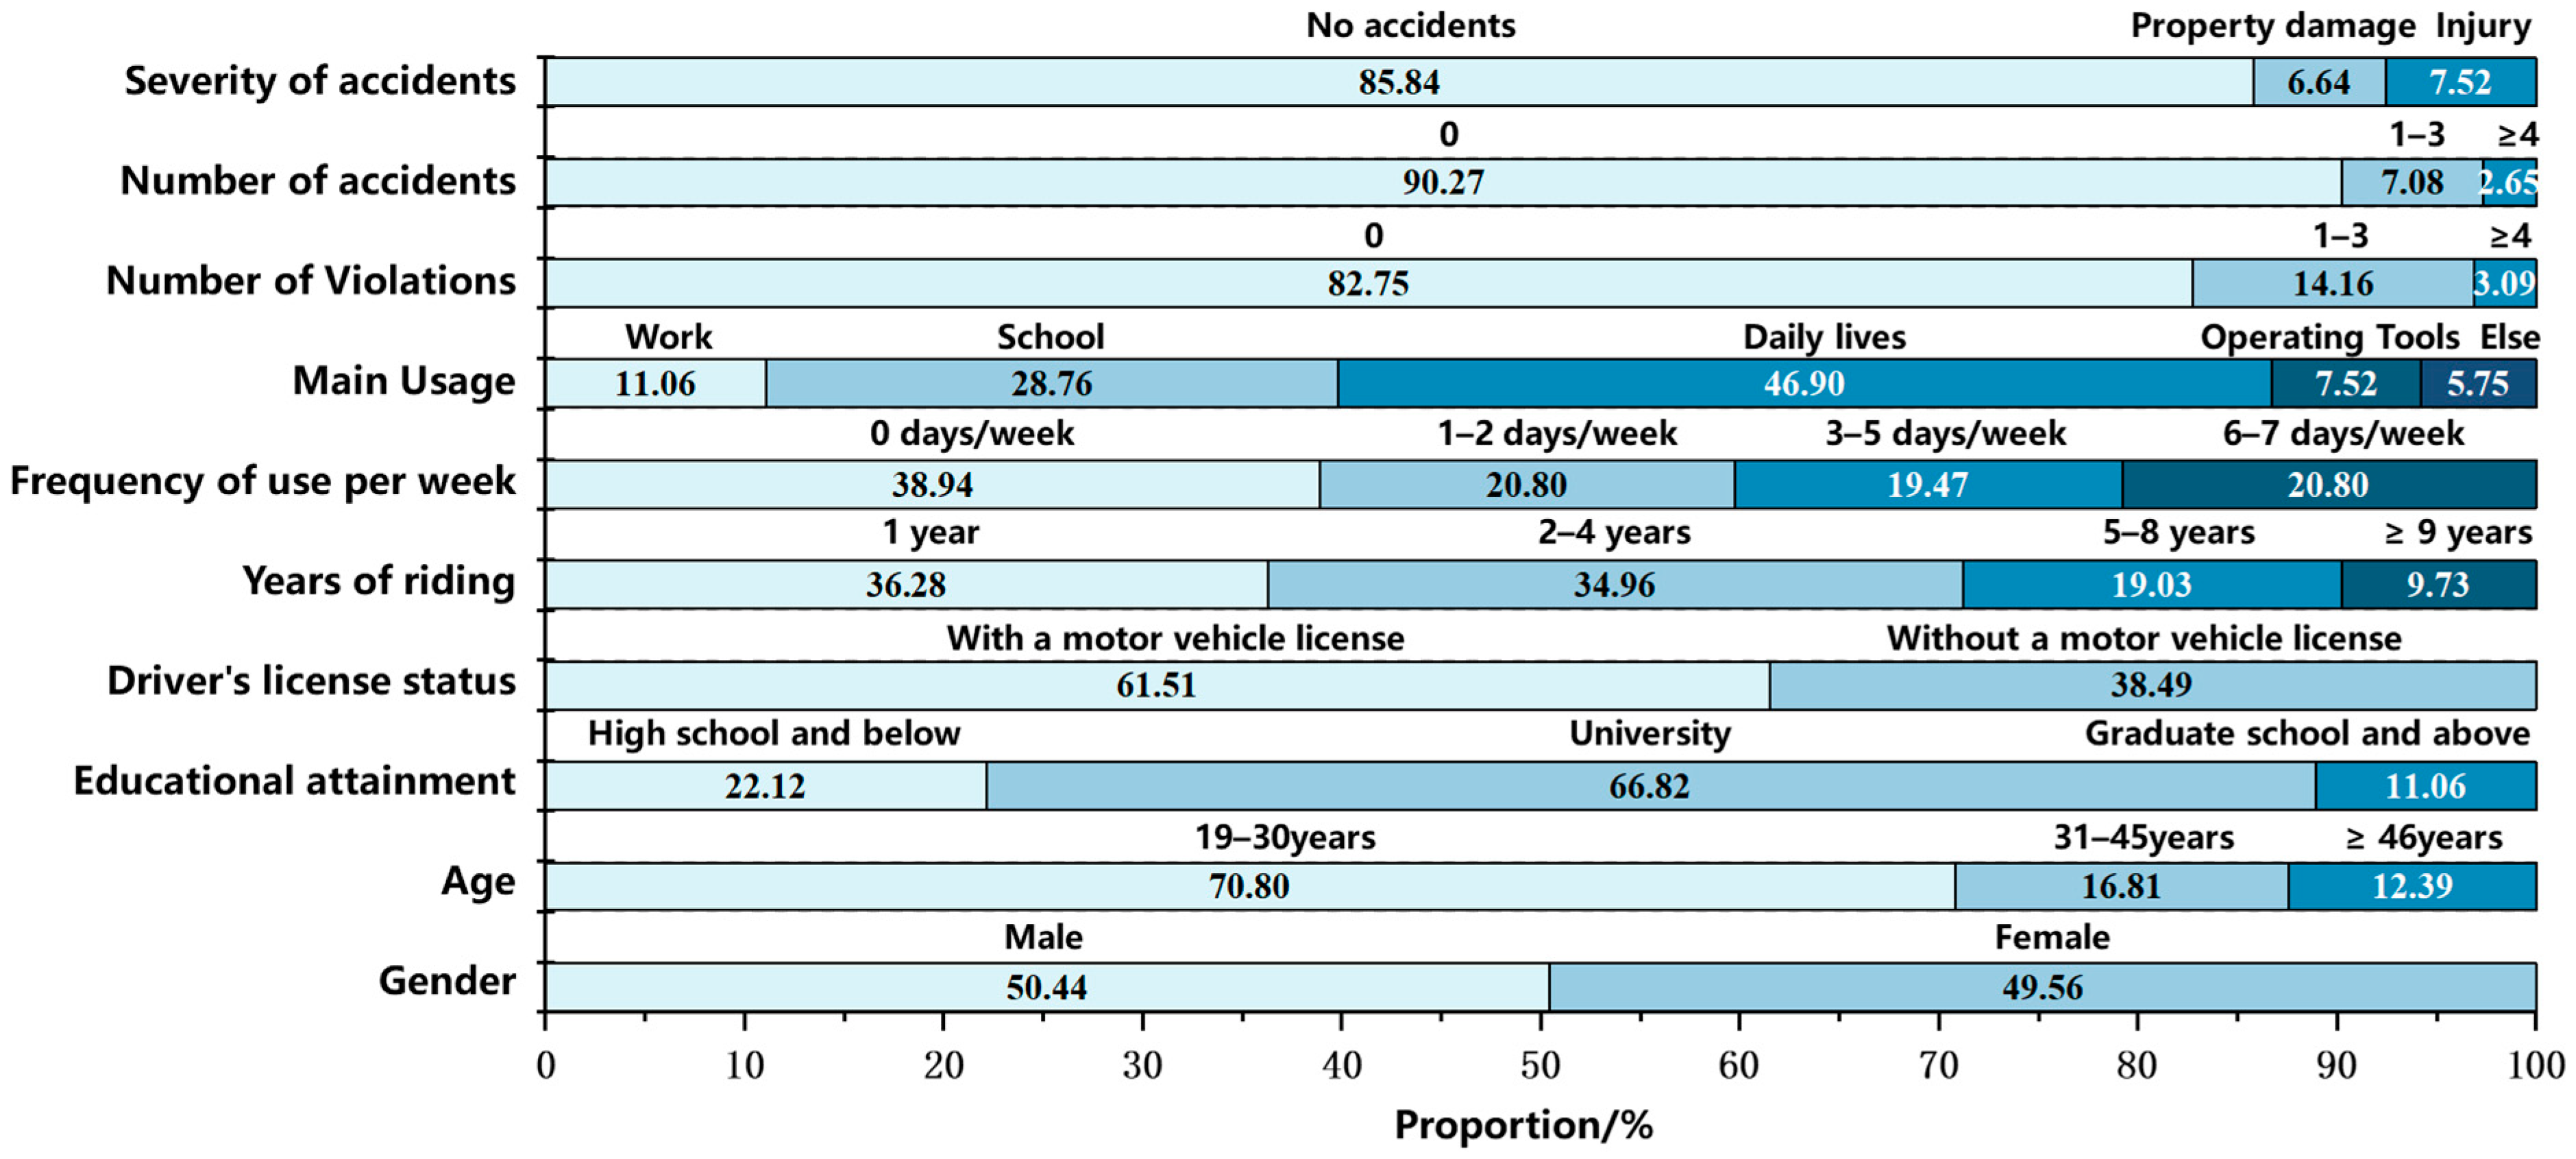
The relevant demographic information in the sample group of this study is shown in Figure 3. This figure shows the demographic and riding-related profile of the 215 valid survey respondents, including gender, age, education level, driver’s license ownership, riding experience, and accident involvement. The gender ratio of male-to-female remains balanced, the age distribution is mainly between 19 and 45 years old, the level of education is generally high, with 77.88% having a university degree or above, the vast majority of them hold motor vehicle driver’s licenses, and the number of years of riding e-bikes is generally 4 years or less, and nearly 90% of the participants have not been involved in any traffic accidents. In addition, the mean value of delivery riders who tend towards violation riding behavior is high, reaching 4.13 (out of 5 points).
In this study, scale reliability and validity tests are conducted using IBM SPSS Statistics 26 software. The results of structural validity are acceptable ( χ 2 / d f = 1.309 < 3, RMSEA = 0.041 < 0.05, CFI = 0.986 > 0.9, GFI = 0.926 > 0.9, AGFI = 0.889 > 0.85). The results of factor analysis show that all factor loadings are higher than 0.5, Cronbach’s value is higher than 0.7, AVE is higher than 0.6, and CR is higher than 0.8, as shown in Table A2, which indicate that the reliability and validity of the factors are good [32].

3.2. Analysis of Violation Riding Behavior of E-Bikes Based on SEM-RP-Logit Model

3.2.1. Calculation of Fitness and Setting of Variables

In order to complete the estimation of the SEM-RP-Logit model, this study calculates the fitness based on SEM results. Part of the study is constructed and solved by SEM using IBM SPSS Amos 26 Graphics software, which is a powerful structural equation modeling software.
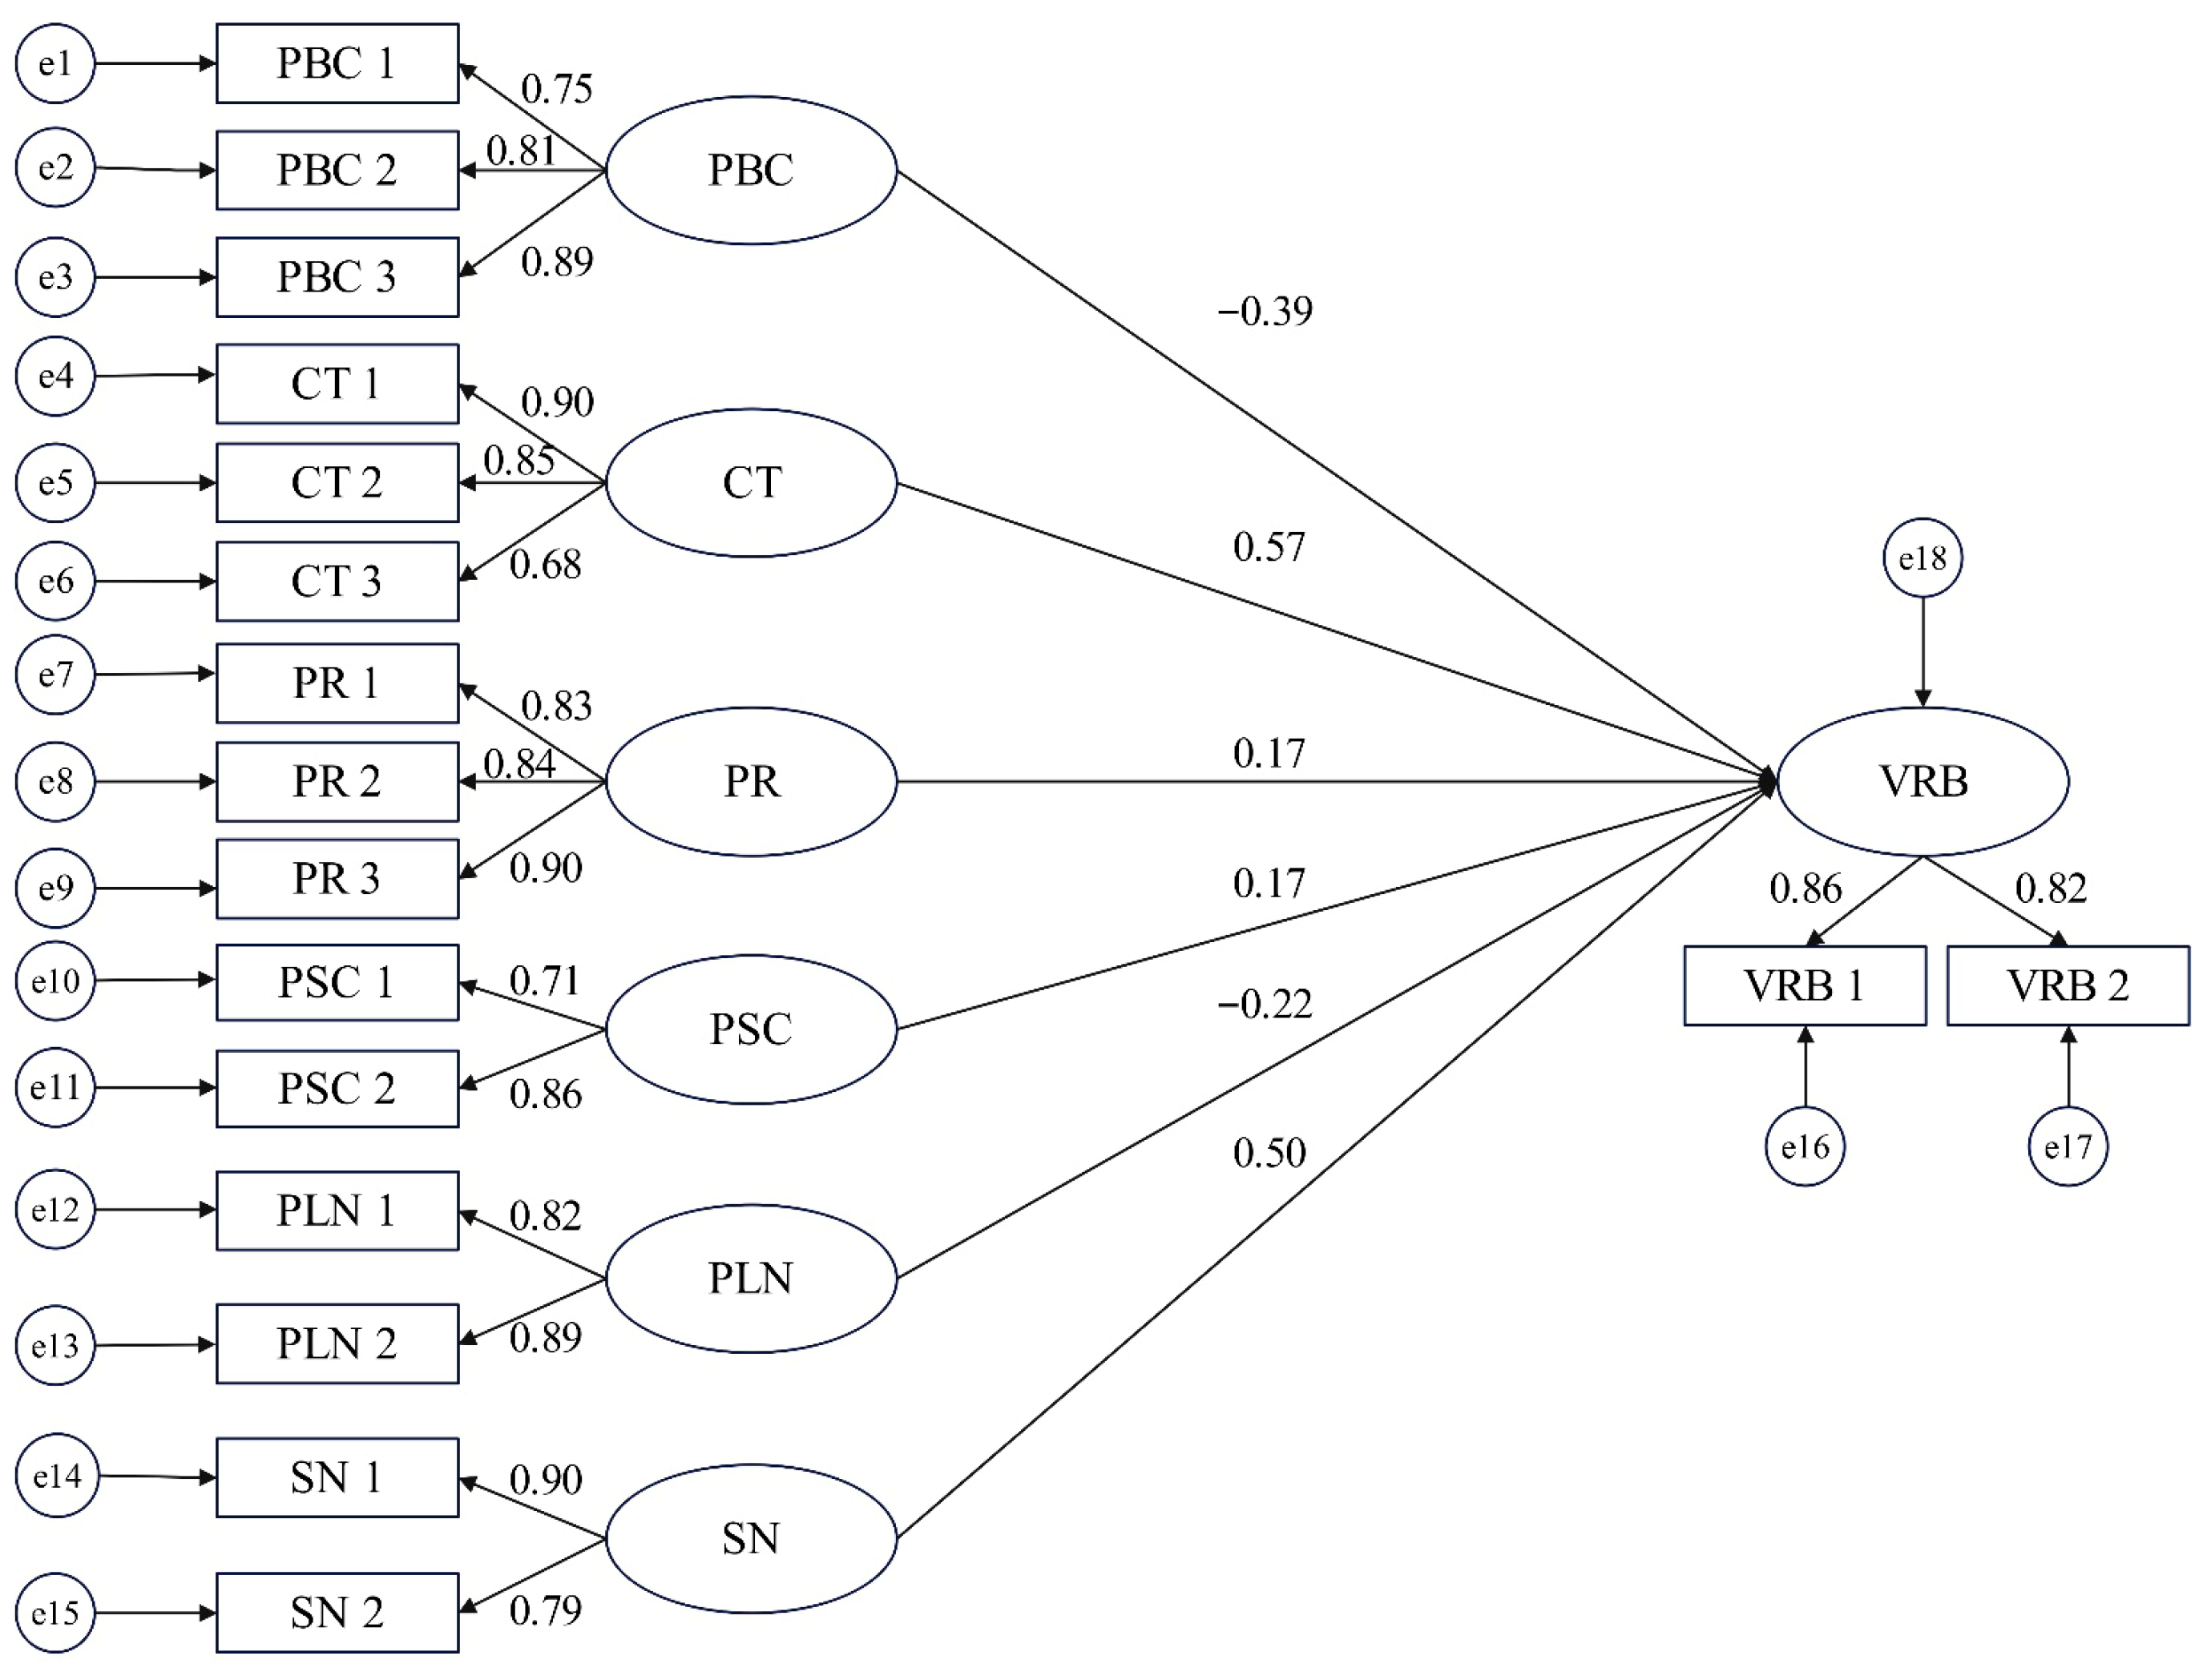
Based on the assumptions (Table 1), the result establishes that violation riding behavior is significantly affected by six factors: Subjective Norm, Perceived Behavioral Control, Conformity Tendency, Perceived Risk, Perceived Legal Norm, and Perceived Social Compliance (Figure 4). This figure presents the standardized path coefficients for the relationships between latent variables and violation riding behavior (VRB), as estimated by the SEM. According to Equations (1)–(3), the fitness of each latent variable is calculated (Table 2).
Based on the results of the questionnaire survey and the calculation results of latent variable fitness, this study organizes the variables of demographic information attributes and latent variable attributes as shown in Table A3. Additionally, the dummy variables are set for the categorical variables with the number of categories greater than two in the table to complete the estimation of the model.

3.2.2. Results and Analysis of Impact Factors

Part of this study used NLogit 6.0 software, which provides procedures for the evaluation, simulation, and analysis of polynomial choice data. The calibration results of the SEM-RP-Logit model are shown in Table 3, using the high tendency to ride in violation as the reference category.
As can be seen in Table 3, in terms of rider attributes, riders in the age group of 19 to 45 years demonstrated a lower tendency to ride in violation. In terms of riding usage information, the number of years of riding, weekly riding frequency, and main purpose of use all have a significant impact on the riders’ tendency to violate riding rules. Specifically, riders with less than 1 year of riding have a relatively low tendency to violate the law, while riders who ride 6 to 7 days per week, and those who use their ride primarily for work or as operating tools have an increased likelihood of violating the law. At the violation and accident information level, riders with a history of violations and penalties have a higher tendency to ride in violation again. Compared to riders who have experienced injury from accidents, those who have not experienced accidents or have only experienced property damage accidents have a relatively low tendency to ride in violation. Among the latent variables, the tendency to follow the crowd, perceived risk, and management-side factors all have a significant impact on riders’ tendency to engage in riding behavior.
In terms of heterogeneity analysis, riders in the age group of 19–30 years old show heterogeneity in terms of violation riding behavior, with parameters following a normal distribution, with a mean of 2.896 and a standard deviation of 2.182, indicating that 90.82% of the riders in this age group have a significant tendency to reduce the probability of riding violations compared to other riders, and 9.18% of the riders have a significant tendency to increase the probability of riding violations.

3.2.3. Marginal Effects

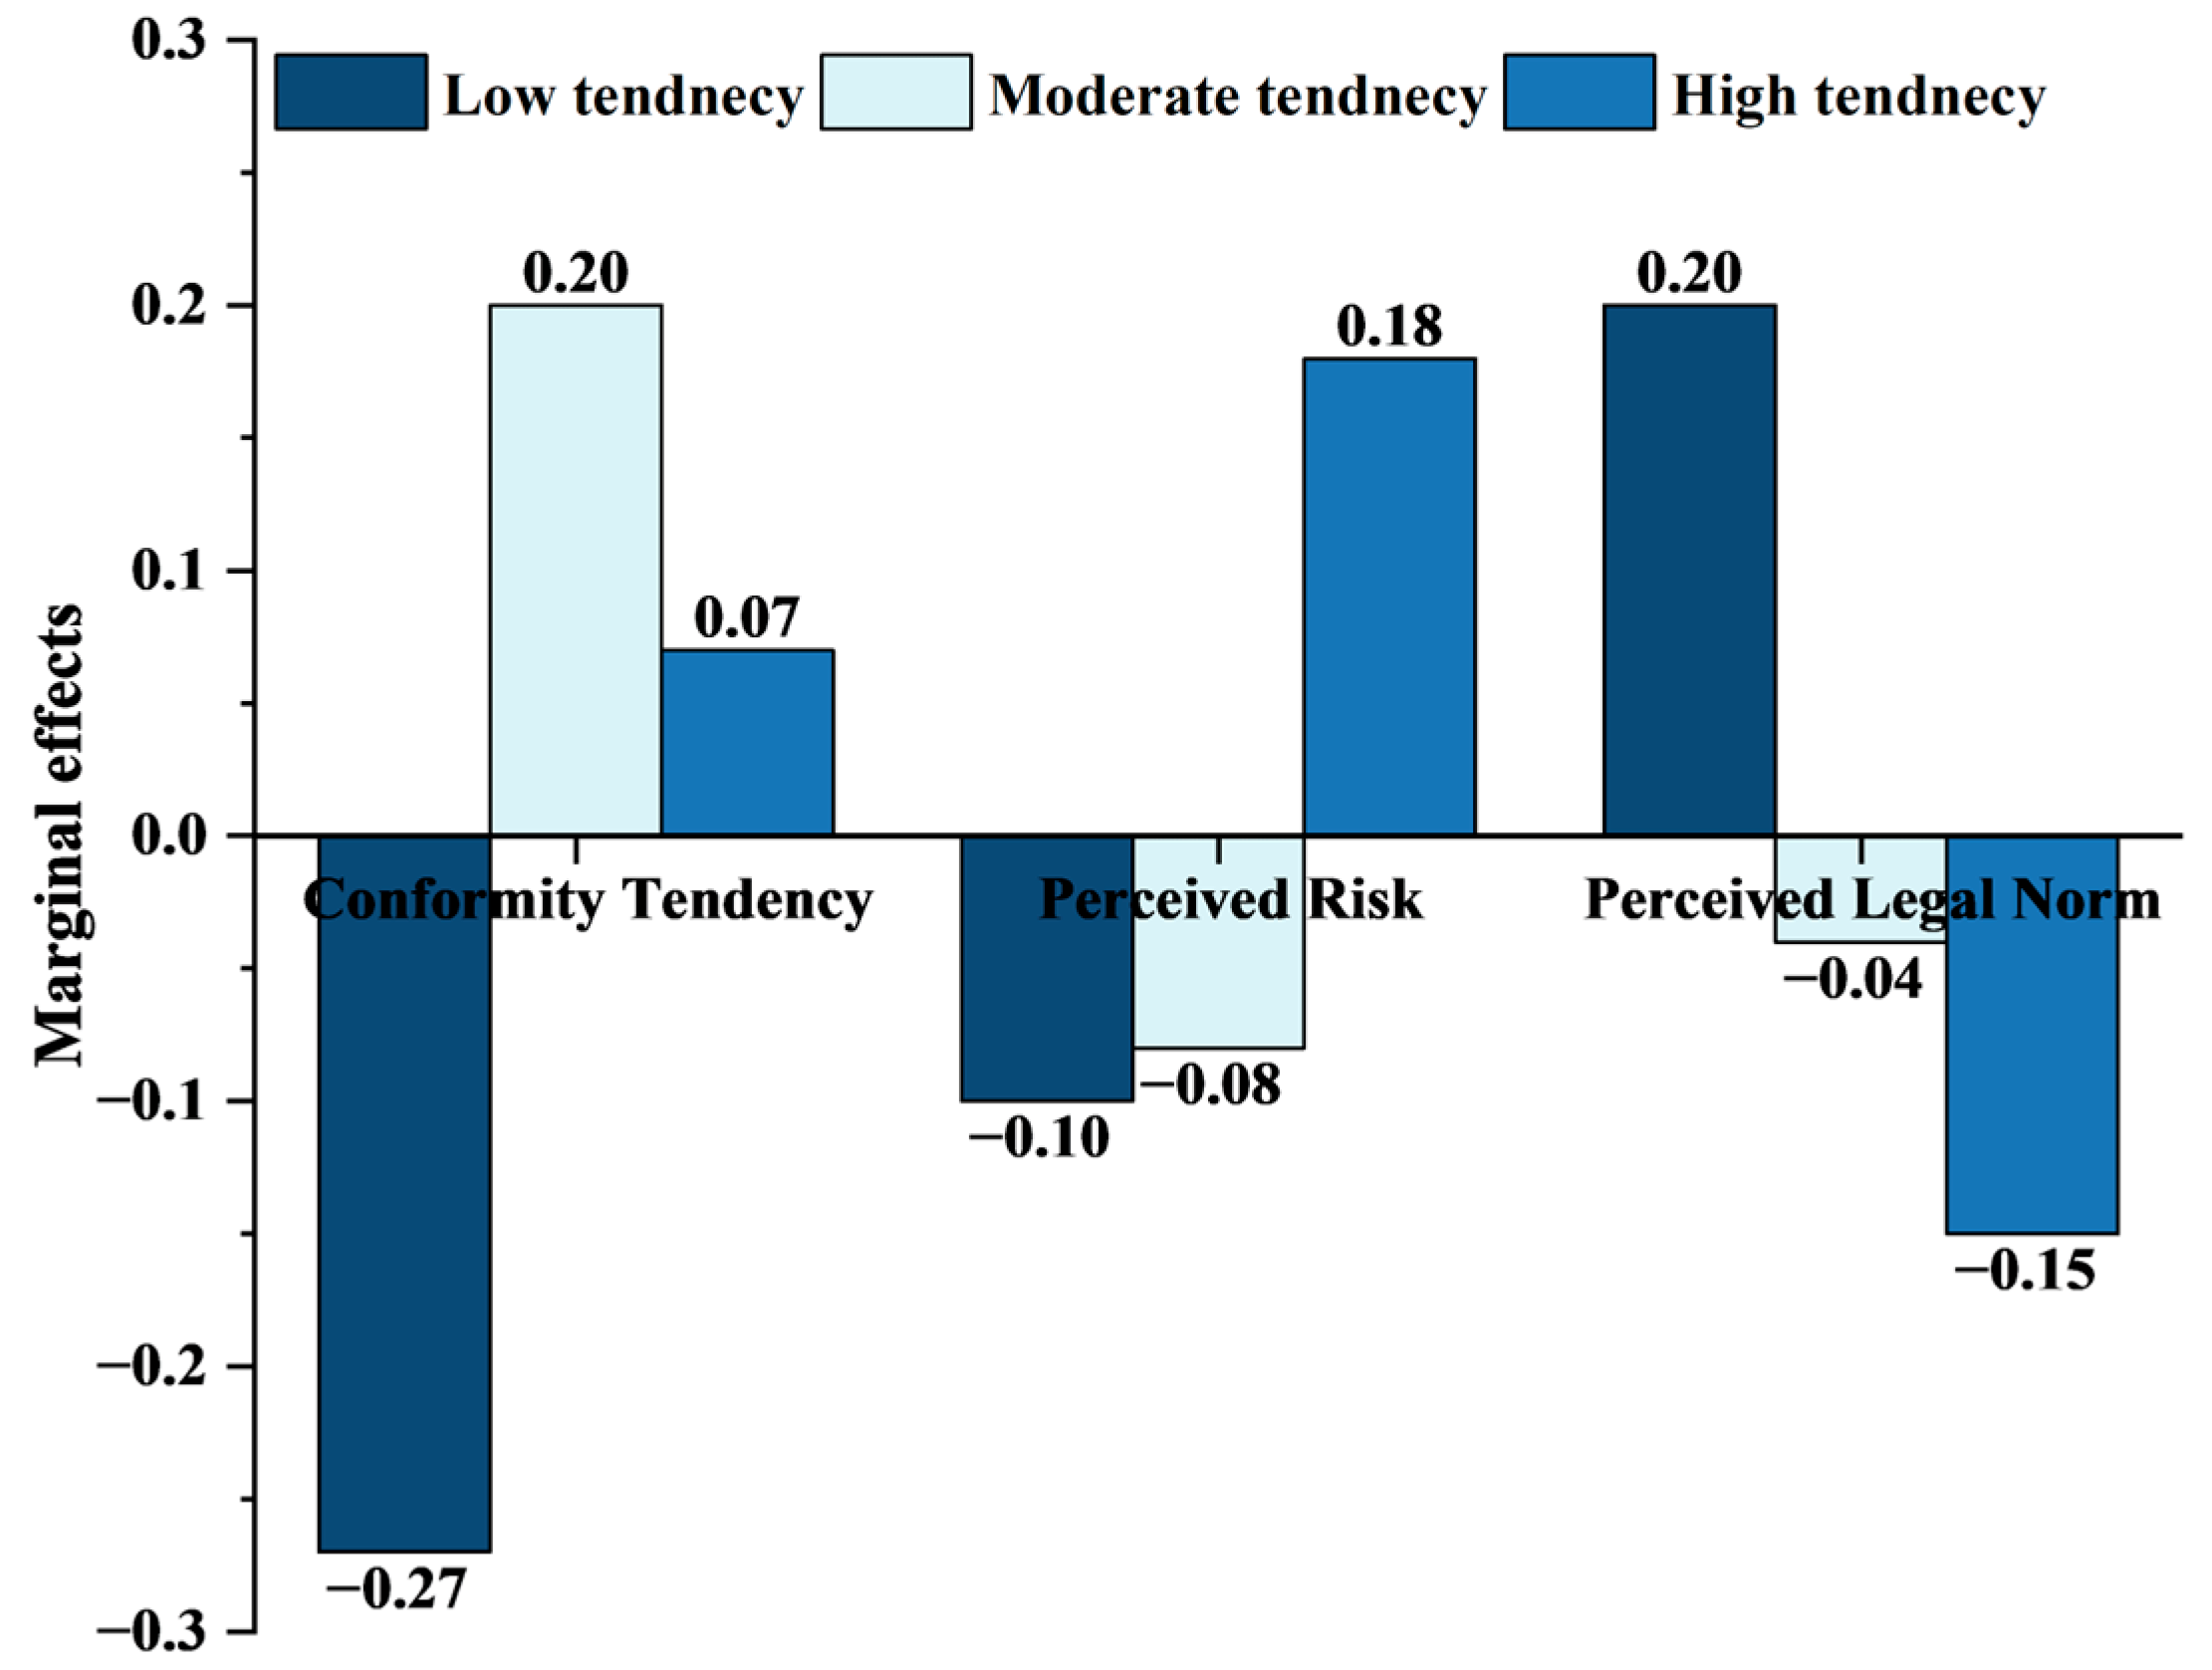
In this study, marginal effects analysis on the significant continuous variables in the model is conducted to analyze the changes in the tendency of violation riding behavior against the changes in impact factors, and the results are shown in Figure 5. This figure illustrates the change in probability of choosing low-, moderate-, or high-violation riding tendencies after a unit change in the significant latent psychological variables (Conformity Tendency, Perceived Risk, and Perceived Law Enforcement). Perceived Risk has the greatest influence on the choice of high-violation tendency, and Perceived Legal Norm is second. This is manifested in the following: for every unit increase in Perceived Risk, the probability of exhibiting a high-violation riding tendency decreases by 0.18, indicating that the less risky a certain violation riding behavior is perceived to be, the more likely it is that the violation riding behavior will occur. For each unit increase in Perceived Legal Norm, the probability of exhibiting a moderate and high tendency to ride in violation decreases by 0.04 and 0.15, indicating that the chance of riding in violation decreases when the stricter traffic management is perceived by the rider.

4. Discussion

4.1. Impact of Latent Variables

Among the latent variables, the Conformity Tendency, Perceived Risk, and Perceived Legal Norm have a significant effect on the riders’ violation riding tendency, which shows that the rider’s tendency to violate riding rules is higher when the herd mentality is stronger, the perceived risk is not dangerous, and the perceived traffic management is relaxed.
  • Perceived Risk has the greatest influence on the choice of high-violation riding behavior tendency, and higher perceived risk reduces the likelihood of high-violation tendencies, suggesting that the insufficient perception of the potential risks of various violation riding behaviors and the perception that their danger is not serious will significantly motivate riders to choose violation riding behaviors to complete their trips. This finding is similar to previous studies [33,34,35]. Therefore, on the one hand, safety education should emphasize the dangers of various types of violation riding and the serious consequences in the event of accidents to riders who do not realize or underestimate the risks associated with violation riding. On the other hand, measures such as traffic management and design can be taken to reduce the likelihood of various types of violation riding behavior.
  • Perceived Legal Norm demonstrated a significant negative impact on violation riding behavior, ranking as the second most influential factor. This finding contrasts with the results of Tang et al. [16], who reported no significant effect, which they attributed to lax regulations, transient fines, and on-site enforcement in their study context. It is understood that the region of interest in this study has continuously introduced relevant policies and regulations in recent years to strengthen the traffic safety management of e-bikes, such as when the municipal government issued the implementation plan to further strengthen the control of the whole chain of e-bikes in the city. The Market Supervision Administration regularly exposes illegal cases and severely cracks down on illegal acts in the e-bike industry. The results of this study show that when riders are in a riding environment with more stringent traffic management measures, they are less likely to choose violation riding behaviors. Therefore, traffic management measures can be adopted to curb violation riding behavior, such as the frequent use of video and other measures to record the phenomenon of violation riding behavior, improve law enforcement efforts, and increase the cost of violation riding behavior.
  • Conformity Tendency has a significant positive influence effect on violation riding behavior, suggesting that the more susceptible a rider is to the influence of neighboring traffic participants, the more likely he or she is to commit a violation, which is in line with the results of the current research [16,19,30]. The potential reason for this may be that many riders may believe that safety is enhanced when violating traffic rules together with other riders. This may be related to a “no one is blamed” mentality [36], i.e., they believe that because of the large number of rule violators, individuals will not be severely punished. Therefore, it is necessary to take measures to deal with the negative social impact caused by the tendency to follow the crowd.

4.2. Impact of Demographic Information

As shown in Table 3, with regard to rider attributes, riders aged 19–45 years old had a lower tendency to ride in violation. It is similar to the findings of Yang et al. [20] and Dong et al. [37], which indicate that middle-aged and older riders have a higher likelihood of violation riding behavior. Meanwhile, this study pointed out that riders in the age group of 19–30 years old showed heterogeneity in violation riding behavior.
In terms of usage information, the number of years of riding, weekly riding frequency, and main usage have significant effects on the tendency of riders to violate riding, specifically, riders with less than 1 year of riding have lower tendency to violate the law, the number of riding days of 6–7 days, and the use of the tool for work and business will increase the chances of riders to violate riding. The potential reason may be that riders with a riding frequency of 6–7 days/week are mostly takeaway riders, those commuting to work, and other people who have higher demands on their time [38,39,40,41,42], and therefore they have a higher tendency to ride in violation, under time pressure. At the same time, this is similar to the findings of Hu and Tang [43], who pointed out that as the number of years of riding increases, the frequency of traffic violations increases. The existence of these effects may be due to the fact that as the number of years of riding increases, riders’ riding skills continue to improve, their perception of their own risk decreases, and their perception of traffic regulations decreases, so the tendency to ride in violation of the law is higher, and ultimately, they are more likely to engage in traffic offenses.
According to the information on violation and accidents, the number of riders punished for violation is higher. The results show that the number of riders punished for violation reflects the degree of compliance with traffic rules to a certain extent, and has a negative correlation. This is consistent with the research results of Hu and Tang [43], who indicated that the more times a rider was punished by the traffic police, the less frequently they violated traffic rules. They believed that the penalties received by the traffic police for violating the law can be regarded as the cost of violating the law, and the more penalties received, the higher the cost of violating the law, which will make the riders feel more strongly legal norms and an awareness of risk, and therefore they will choose to ride cautiously and reduce the occurrence of traffic violations. It shows that the severity of accidents caused by riders due to violations reflects the tendency to violate the law in the process of riding to a certain extent, and also reflects that the higher tendency of violation riding behavior leads to more serious accidents [16].

4.3. Countermeasures to Reduce E-Bike Violation Riding Behavior

Enhancing safety education and implementing training for riders is important. Through the above modeling of e-bike violation riding behavior, it can be seen that factors such as subjective norms, conformity tendency, and perceived risk all affect the chances of riders’ riding violations. What is reflected behind these factors is the lack of awareness of traffic safety, and the lack of in-depth understanding of the dangers of traffic safety. Therefore, it is necessary to strengthen the publicity and education of traffic safety in society to enhance the knowledge, and preventive awareness, of traffic safety throughout our whole society. Additionally, it is necessary to consider the continuous implementation of driver training for riders, and improve riders’ safety knowledge and risk awareness, similarly to the motor vehicle examination system.
In addition, strengthening the enforcement of e-bike violation riding is crucial. Through the modeling analysis, it can be seen that management-level factors play an inhibitory role in riders’ tendency to ride illegally. Therefore, the investigation and handling of e-bike violation riding behavior should be continuously strengthened, not only relying on offline law enforcement, but also relying on RFID technology and video technology to continuously improve the strength of off-site law enforcement. At the same time, the tendency of violation riding is higher when e-bikes are used as operating tools, so such riders should be focused on and necessary measures should be taken to constrain them, such as the adoption of special electronic license plates for takeaway riders in Shanghai, China.
Thirdly, addressing the influence of conformity and social norms is essential. Public awareness campaigns could highlight that most riders do obey the rules, utilizing descriptive norms to positively influence behavior. Additionally, community-based interventions and peer education programs could be developed to foster a culture of self-regulation and positive role-modeling among rider groups, especially for high-risk cohorts like delivery riders.

5. Conclusions

Aiming to address the phenomenon in which riders’ violation riding behavior brings serious harm to traffic safety, this study constructs a hybrid approach to reveal the impact factors of the violation riding behavior. The study shows the following:
  • In terms of demographic information, riders with characteristics such as greater riding experience, using e-bikes as operating tools, and having already been penalized for violating the law tend to exhibit a higher tendency to engage in illegal riding.
  • Among the latent variables, the study revealed that for each unit increase in riders’ perceived risk, the probability of choosing high-violation riding behaviors tendency decreases by 0.18. Similarly, for each unit increase in riders’ perception of the stringency of traffic management, the probability of choosing high-violation riding behaviors tendency decreases by 0.15.
Limitations: Although the current study has revealed a variety of factors that influence e-bike riders’ violation riding behaviors, there are still some limitations to this study. Specifically, the data in this study relied primarily on the self-reports of e-bike riders, but this type of information is often susceptible to social desirability effects [44] and recall bias [30]. Additionally, this study did not account for technical specifications of e-bikes, such as motor power, speed limiters, or throttle mechanisms, which may influence riding behavior. All participants were from a single cultural context (China), maybe limiting the generalizability of findings across different cultural settings.
Despite these limitations, the current research results can help outline several promising approaches for future studies. First, incorporating the objective technical parameters of e-bikes (motor power, speed limiters, and throttle mechanisms) could provide deeper insights into how vehicle characteristics influence riding behaviors. Secondly, a critical and promising direction is the systematic investigation of interactions between e-bikes and other road users, such as conventional bicycles, e-scooters, and pedestrians. Future research should employ naturalistic observation or video-based conflict analysis to quantify how these dynamic interactions influence e-bike riders’ risk perception, decision-making, and propensity for violations. For instance, it remains unclear how a rider’s Conformity Tendency (CT) is triggered by the behavior of surrounding e-scooter riders, or how perceived time pressure (a facet of PBC) leads to aggressive maneuvers around pedestrians. Understanding these micro-level interactions is essential for developing evidence-based infrastructure designs. Thirdly, employing objective behavioral data (e.g., video recordings and GPS tracking) alongside self-reports would strengthen methodological rigor. Finally, cross-cultural comparative studies could elucidate how cultural factors shape the psychological and environmental determinants of e-bike riding behaviors.

Author Contributions

Conceptualization, Y.Z., C.D. and J.S.; Methodology, Y.Z., C.D. and J.S.; Software, Y.Z.; Validation, Y.Z.; Formal analysis, Y.Z.; Investigation, Y.Z., C.D. and J.S.; Resources, C.D. and J.S.; Data curation, C.D. and J.S.; Writing—original draft, Y.Z.; Writing—review & editing, C.D. and J.S.; Visualization, Y.Z.; Supervision, C.D. and J.S.; Project administration, C.D. and J.S.; Funding acquisition, J.S. All authors have read and agreed to the published version of the manuscript.

Funding

This research was supported by the National Natural Science Foundation of China under the project “Research on Road Risk Quantification Method Based on Risk Factor Analysis of Improper Driving Behavior” (Project No.: 51578319).

Data Availability Statement

The data presented in this study are available on request from the corresponding author due to privacy and ethical restrictions related to the confidentiality of the research participants.

Acknowledgments

This research was approved and supported by Tsinghua University and Beijing Jiaotong University. We also want to thank all the electric bicycle riders who participated in this research.

Conflicts of Interest

The authors declare no conflict of interest.

Appendix A

Table A1. Questionnaire on violation riding behaviors.
Latent VariableReferencesCodeQuestion
Subjective Norm a[16,19,30]SN 1In this scenario, someone important to me approves of my traffic violations
SN 2In this scenario, someone important thinks I should violate the traffic rules
Perceived Behavioral Control a[16,19,30]PBC 1I do not think I had enough conditions/opportunities to complete the riding violation
PBC 2I have not successfully completed an offending ride in a similar situation in the past
PBC 3I am not capable of completing speeding, running red lights, and other infractions
Conformity Tendency a[16,19,30]CT 1When most people do not follow the rules of the road, I follow their actions
CT 2Even though it is against the rules of the road, I think it’s safer to ride with other people
CT 3When I ride on the road, my behavior is easily influenced by those around me
Perceived Risk b[15,16,20,30]PR 1Running a red light
PR 2speed
PR 3Ride in the opposite direction
Perceived Legal Norm a[16]PLN 1If you ride illegally, you can be easily detected and penalized
PLN 2The penalties for riding in violation of the law will be severe
Perceived Social Compliance a[16]PSC 1In normal riding, people have riding violations
PSC 2In normal riding, people do not pay a lot of attention to obeying the rules of the road
Violation Riding Behavior c[16]VRB 1In the proposed scenario, how likely are you to violate traffic rules
VRB 2Whether you intend to violate traffic rules in similar situations in the future
a 5-point scale: 1 = Strongly disagree, 2 = Disagree, 3 = Ordinary, 4 = Agree, 5 = Strongly agree. b 5-point scale: 1 = Extremely dangerous, 2 = Quite dangerous, 3 = Relatively dangerous, 4= A little dangerous, 5 = Not dangerous. c 5-point scale: 1 = Never, 2 = Seldom, 3 = Sometimes, 4 = Usually, 5 = Always.
Table A2. Results of questionnaire reliability and validity tests.
Latent VariableCodeFactor LoadingAverage Variance Extraction (AVE)Critical Ratio (CR)Cronbach’s Alpha
Perceived Behavioral ControlPBC10.8530.6750.8920.873
PBC20.815
PBC30.625
Conformity TendencyCT10.7670.6610.8520.844
CT20.741
CT30.856
Perceived RiskPR10.8790.7380.8940.877
PR20.740
PR30.898
Perceived Social ComplianceBS10.8870.7040.8350.729
BS20.788
Perceived Legal NormMS10.8800.7420.8510.765
MS20.795
Subjective NormSN10.6730.7170.8340.749
SN20.855
Table A3. Description of characteristic variables of SEM-RP-Logit model.
CategoryVariableAssignment/Variable Description
RiderGender0: Male, 1: Female
Age1: 19–30 years, 2: 31–45 years, 3: ≥46 years
Educational attainment1: High school and below, 2: University, 3: Graduate school and above
Driver’s license status0: without, 1: with
Usage InformationYears of riding1: 1 year and below, 2: 2–4 years, 3: 5–8 years, 4: 9 years and above
Frequency of use per week1: 0 day, 2: 1–2 days, 3: 3–5 days, 4: 6–7 days
Main usage1: Work, 2: School, 3: Daily lives, 4: Operating tools, 5: Else
Violations and accidentsViolation0: No violations, 1: Have violations
Accidents0: No accidents, 1: Have accidents
Severity of accidents1: No accidents, 2: Property damage, 3: Injury
Latent variablesPerceived Behavioral Control, Conformity Tendency, Perceived Risk, Perceived Social Compliance, Perceived Legal Norm, Subjective NormContinuous variable, the results are shown in Table 2.

References

  1. Ajzen, I. From Intentions to Actions: A Theory of Planned Behavior. In Action Control: From Cognition to Behavior; Kuhl, J., Beckmann, J., Eds.; Springer: Berlin, Heidelberg, 1985; pp. 11–39. [Google Scholar] [CrossRef]
  2. Ben-Akiva, M.; Walker, J.; Bernardino, A.T.; Gopinath, D.A.; Morikawa, T.; Polydoropoulou, A. Integration of Choice and Latent Variable Models. In Perpetual Motion: Travel Behavior Research Opportunities and Application Challenges; Emerald Publishing: Leeds, UK, 2002. [Google Scholar]
  3. Bi, Y.; Ma, Y.; Feng, D.; Li, H.; Ji, M.; Ma, Z. Research on Shared E-Bikes Usage Behavior Based on SEM-Logit Model. Transp. Res. 2023, 9, 119–131. [Google Scholar] [CrossRef]
  4. Bigazzi, A.; Wong, K. Electric bicycle mode substitution for driving, public transit, conventional cycling, and walking. Transp. Res. Part D: Transp. Environ. 2020, 85, 102412. [Google Scholar] [CrossRef]
  5. Chen, J.; Yan, Q.; Yang, F.; Hu, J. SEM-Logit Integration Model of Travel Mode Choice Behaviors. J. South China Univ. Technol. (Nat. Sci. Ed.) 2013, 41, 51–57+65. [Google Scholar]
  6. Chorlton, K.; Conner, M.; Jamson, S. Identifying the psychological determinants of risky riding: An application of an extended Theory of Planned Behaviour. Accid. Anal. Prev. PTW Cogn. Impair. Driv. Saf. 2012, 49, 142–153. [Google Scholar] [CrossRef] [PubMed]
  7. Dong, C.; Lu, Y.; Ma, S.; Li, P.; Zhuang, Y. Analyzing and Modeling of Multi-Class E-Bikes Violation Behaviors at Signalized Intersection. J. South China Univ. Technol. (Nat. Sci. Ed.) 2024, 52, 83–89. [Google Scholar]
  8. Dong, H.; Zhong, S.; Xu, S.; Tian, J.; Feng, Z. The relationships between traffic enforcement, personal norms and aggressive driving behaviors among normal e-bike riders and food delivery e-bike riders. Transp. Policy 2021, 114, 138–146. [Google Scholar] [CrossRef]
  9. Fitzpatrick, C.D.; Samuel, S.; Knodler, M.A. The use of a driving simulator to determine how time pressures impact driver aggressiveness. Accid. Anal. Prev. 2017, 108, 131–138. [Google Scholar] [CrossRef]
  10. Fornell, C.; Larcker, D.F. Evaluating Structural Equation Models with Unobservable Variables and Measurement Error. J. Mark. Res. 1981, 18, 39–50. [Google Scholar] [CrossRef]
  11. Han, Y.; Li, W.; Wei, S.; Zhang, T. Research on Passenger’s Travel Mode Choice Behavior Waiting at Bus Station Based on SEM-Logit Integration Model. Sustainability 2018, 10, 1996. [Google Scholar] [CrossRef]
  12. Hensher, D.A.; Greene, W.H. The Mixed Logit model: The state of practice. Transportation 2003, 30, 133–176. [Google Scholar] [CrossRef]
  13. Holland, C.; Hill, R. The effect of age, gender and driver status on pedestrians’ intentions to cross the road in risky situations. Accid. Anal. Prev. 2007, 39, 224–237. [Google Scholar] [CrossRef] [PubMed]
  14. Hu, B.; Tang, C. Study on the influence of legal ethics on cyclists’ behavior and safety governance. In Proceedings of the Resilient Transport: Quality and Service—China Urban Transport Planning Annual Conference 2023. Urban transportation Planning Committee of Urban Planning Society of China, Xi’an, China, 12 October 2023; pp. 205–216. [Google Scholar] [CrossRef]
  15. Hu, J.; Yao, M.; Liu, Y.; Tang, L.; Chen, J. Research on the Travel Choice Behaviors of Transportation Corridor Based on SEM-MNL Model. J. Railw. Eng. Soc. 2017, 34, 80–85. [Google Scholar]
  16. Jackson, D.L. Revisiting Sample Size and Number of Parameter Estimates: Some Support for the N:q Hypothesis. Struct. Equ. Model. A Multidiscip. J. 2003, 10, 128–141. [Google Scholar] [CrossRef]
  17. Jing, P.; Wang, W.; Jiang, C.; Zha, Y.; Ming, B. Determinants of switching behavior to wear helmets when riding e-bikes, a two-step SEM-ANFIS approach. Math. Biosic. Eng. 2023, 20, 9135–9158. [Google Scholar] [CrossRef]
  18. Jung, S.-Y.; Yoo, K.-E. A study on passengers’ airport choice behavior using hybrid choice model: A case study of Seoul metropolitan area. South Korea J. Air Transp. Manag. 2016, 57, 70–79. [Google Scholar] [CrossRef]
  19. Kim, H.-S. The role of legal and moral norms to regulate the behavior of texting while driving. Transp. Res. Part F Traffic Psychol. Behav. 2018, 52, 21–31. [Google Scholar] [CrossRef]
  20. Lennon, A.; Oviedo-Trespalacios, O.; Matthews, S. Pedestrian self-reported use of smart phones: Positive attitudes and high exposure influence intentions to cross the road while distracted. Accid. Anal. Prev. 2017, 98, 338–347. [Google Scholar] [CrossRef]
  21. Liu, J.; Chen, X. Analysis of college students’ phone call behavior while riding e-bikes: An application of the extended theory of planned behavior. J. Transp. Health 2023, 31, 101635. [Google Scholar] [CrossRef]
  22. McFadden, D. Econometric Models for Probabilistic Choice Among Products. J. Bus. 1980, 53, S13–S29. [Google Scholar] [CrossRef]
  23. Qian, Q.; He, J.; Shi, J. Analysis of factors influencing aberrant riding behavior of food delivery riders: A perspective on safety attitude and risk perception. Transp. Res. Part F Traffic Psychol. Behav. 2024, 100, 273–288. [Google Scholar] [CrossRef]
  24. Qian, Q.; Qi, Y.; Shi, J. Description and analysis of aberrant riding behaviors of pedal cyclists, e-bike riders and motorcyclists: Based on a self-report questionnaire. Transp. Res. Part F Traffic Psychol. Behav. 2024, 107, 969–984. [Google Scholar] [CrossRef]
  25. Qian, Q.; Shi, J. Accustomed or Regulated: Influencing factors of two-wheeler riders’ illegal Lane-Transgressing behavior when overtaking. Accid. Anal. Prev. 2024, 204, 107648. [Google Scholar] [CrossRef]
  26. Qian, Q.; Shi, J. Comparison of injury severity between E-bikes-related and other two-wheelers-related accidents: Based on an accident dataset. Accid. Anal. Prev. 2023, 190, 107189. [Google Scholar] [CrossRef]
  27. Schechtman, E.; Bar-Gera, H.; Musicant, O. Driver views on speed and enforcement. Accid. Anal. Prev. 2016, 89, 9–21. [Google Scholar] [CrossRef] [PubMed]
  28. Shen, X.; Zhang, F.; Lv, H.; Wei, S.; Sun, Z. The application and extension of the theory of planned behavior to an analysis of delivery riders’ red-light running behavior in China. Accid. Anal. Prev. 2020, 144, 105640. [Google Scholar] [CrossRef] [PubMed]
  29. Si, Y.; Guan, H.; Cui, Y. Research on the Choice Behavior of Taxis and Express Services Based on the SEM-Logit Model. Sustainability 2019, 11, 2974. [Google Scholar] [CrossRef]
  30. Tang, T.; Guo, Y.; Zhou, X.; Labi, S.; Zhu, S. Understanding electric bike riders’ intention to violate traffic rules and accident proneness in China. Travel Behav. Soc. 2021, 23, 25–38. [Google Scholar] [CrossRef]
  31. Tang, T.; Zhou, X.; Sheng, D.; Cao, Y. Research on non-motorized vehicle users’ violating riding intention and accident proneness. China Saf. Sci. J. 2020, 30, 128–134. [Google Scholar] [CrossRef]
  32. Useche, S.A.; Alonso, F.; Montoro, L.; Esteban, C. Explaining self-reported traffic crashes of cyclists: An empirical study based on age and road risky behaviors. Saf. Sci. 2019, 113, 105–114. [Google Scholar] [CrossRef]
  33. Useche, S.A.; Gonzalez-Marin, A.; Faus, M.; Alonso, F. Environmentally friendly, but behaviorally complex? A systematic review of e-scooter riders’ psychosocial risk features. PLoS ONE 2022, 17, e0268960. [Google Scholar] [CrossRef]
  34. Wang, C.; Kou, S.; Song, Y. Identify Risk Pattern of E-Bike Riders in China Based on Machine Learning Framework. Entropy 2019, 21, 1084. [Google Scholar] [CrossRef]
  35. Wang, T.; Chen, Y.; Yu, J.; Xie, S. Formation Mechanisms and Clustering Differences in Risky Riding Behaviors of Electric Bike Riders. IEEE Access 2021, 9, 119712–119721. [Google Scholar] [CrossRef]
  36. Wild, K.; Woodward, A. Why are cyclists the happiest commuters? Health, pleasure and the e-bike. J. Transp. Health 2019, 14, 100569. [Google Scholar] [CrossRef]
  37. Xie, J.; Yang, R. Analysis of unsafe behaviors of electric bicycle based on Structural Equation Model. Transp. Energy Conserv. Environ. Prot. 2021, 17, 61–66. [Google Scholar]
  38. Xu, J.; Ji, C.; Li, B.; Jiang, P.; Qin, K.; Ni, Z.; Huang, X.; Zhong, R.; Fang, L.; Zhao, M. Riding practices of e-bike riders after the implementation of electric bike management regulations: An observational study in Hangzhou, China. Heliyon 2024, 10, e26263. [Google Scholar] [CrossRef]
  39. Yang, H.; Liu, X.; Su, F.; Cherry, C.; Liu, Y.; Li, Y. Predicting e-bike users’ intention to run the red light: An application and extension of the theory of planned behavior. Transp. Res. Part F Traffic Psychol. Behav. 2018, 58, 282–291. [Google Scholar] [CrossRef]
  40. Young, D.L.; Goodie, A.S.; Hall, D.B.; Wu, E. Decision making under time pressure, modeled in a prospect theory framework. Organ. Behav. Hum. Decis. Process. 2012, 118, 179–188. [Google Scholar] [CrossRef]
  41. Zhang, W. Generation Mechanisms and Control Strategies for Driving Violations of Motorists. Ph.D. Thesis, China University of Mining and Technology, Xuzhou, China, 2022. [Google Scholar] [CrossRef]
  42. Zhang, W. A Peek into the Spirit of Jurisprudence Behind “The Law Doesn’t Blame the People”. Leg. Syst. Soc. 2017, 3, 11–12. [Google Scholar] [CrossRef]
  43. Zhang, X.; Huang, J.; Bian, Y.; Zhao, X.; Han, T. Shared e-bike riders’ psychology contribution to self-reported traffic accidents: A structural equation model approach with mediation analysis. J. Transp. Saf. Secur. 2023, 15, 895–917. [Google Scholar] [CrossRef]
  44. Zhou, H.; Romero, S.B.; Qin, X. An extension of the theory of planned behavior to predict pedestrians’ violating crossing behavior using structural equation modeling. Accid. Anal. Prev. Traffic Saf. China Chall. Countermeas 2016, 95, 417–424. [Google Scholar] [CrossRef] [PubMed]
Figure 1. Theoretical model of violation riding behavior.
Vehicles 07 00122 g001
Figure 2. SEM-RP-Logit model.
Vehicles 07 00122 g002
Figure 3. Distribution of sample characteristics of rider-related information.
Vehicles 07 00122 g003
Figure 4. SEM parameter estimation results.
Vehicles 07 00122 g004
Figure 5. Marginal effects of tendency to violation riding behavior.
Vehicles 07 00122 g005
Table 1. Path assumptions for violation riding behavior.
AssumptionDetails
H1Subjective Norm positively influences violation riding behavior
H2Perceived Behavioral Control negatively influences violation riding behavior
H3Conformity Tendency positively influences violation riding behavior
H4Perceived Risk positively influences violation riding behavior
H5Perceived Legal Norm negatively influences violation riding behavior
H6Perceived Social Compliance positively influences violation riding behavior
Table 2. Calculation of fitness values for different latent variables.
Latent VariablesResults
Perceived Behavioral Control P B C = 0.31 P B C 1 + 0.33 P B C 2 + 0.36 P B C 3
Conformity Tendency C T = 0.37 C T 1 + 0.35 C T 2 + 0.28 C T 3
Perceived Risk P R = 0.32 P R 1 + 0.33 P R 2 + 0.35 P R 3
Perceived Social Compliance P S C = 0.45 P S C 1 + 0.55 P S C 2
Perceived Legal Norm P L N = 0.48 P L N 1 + 0.52 P L N 2
Subjective Norm S N = 0.53 S N 1 + 0.47 S N 2
Table 3. The SEM-RP-Logit model results.
CategoryMeaningEstimated Parameter
Low Tendency to Ride in ViolationModerate Tendency to Ride in Violation
Rider19–30 years2.896 ***-
30–45 years1.566 *-
Usage InformationLess than 1 year of riding1.554 **1.777 **
Weekly riding frequency 1–2 days-1.436 **
Weekly riding frequency 3–5 days-1.171 *
Usage for work-−1.386 ***
Usage as operating tools (e.g., delivery)-−2.753 ***
Violations and accidentsPenalize for non-compliance−2.806 ***-
No accidents-1.221 *
Property damage-3.172 ***
Latent variablesConformity Tendency−0.929 ***-
Perceived Risk−1.123 ***−0.892 ***
Perceived Legal Norm0.993 ***0.576 **
Heterogeneity19–30 years2.182 **-
Note: *** indicates a significance level of 0.01, ** indicates a significance level of 0.05, and * indicates a significance level of 0.10.
Disclaimer/Publisher’s Note: The statements, opinions and data contained in all publications are solely those of the individual author(s) and contributor(s) and not of MDPI and/or the editor(s). MDPI and/or the editor(s) disclaim responsibility for any injury to people or property resulting from any ideas, methods, instructions or products referred to in the content.