1. Introduction
Polluting emissions from diesel vehicles are a significant source of air pollution due to the toxic substances they release into the environment. Among the polluting emissions with levels that generate global alarm are carbon dioxide (CO
2), carbon monoxide (CO), hydrocarbons (HC), nitric oxides (NOx), and particulate matter (PM), the latter being one of the pollutants that most frequently exceeds the maximum limit set by the Ecuadorian Air Quality Standard [
1]. The polluting gases emitted by diesel vehicles have adverse health effects, particularly on the respiratory and cardiovascular systems. The entire population is exposed, but sensitivity to contamination can vary depending on health, age, and exposure time [
2]. Park et al. studied risk assessment using cerium oxide-based nanoparticles in diesel fuel [
3,
4].
Strategies to reduce polluting emissions in internal combustion engines encompass the following key areas: modifying the engine, optimizing the engine chamber, utilizing post-treatment systems such as catalysts, and refining the fuel by modifying or reformulating its composition [
5]. Diesel engines are designed with high compression ratios, which produce high pressures and consequently very high temperatures in the compressed air within the combustion chamber. In this engine, combustion begins through a self-ignition process of the fuel mixture when sufficiently high temperatures are achieved in the combustion chamber due to the compression process. Only air enters during the intake process to control the ignition moment, and the fuel is injected towards the end of the compression stroke when the air reaches high temperatures to produce self-ignition [
6]. In diesel engines, the air–fuel mixture is significantly heterogeneous; therefore, the combustion process depends spatially and temporally on the injection process and is controlled by the development of the physical processes within the fuel jet, such as penetration, atomization, evaporation, and mixing with air [
7].
Diesel fuel is a liquid hydrocarbon with a density of over 832 kg/m
3. It is composed mainly of paraffin and is used in internal combustion engines, offering high energy efficiency, performance, and mechanical efficiency as a fuel for heating and powering vehicles. Its lower calorific value is around 42.6 MJ/kg, depending on its commercial composition. Petroleum-derived gas oil is composed of approximately 75% saturated hydrocarbons (mainly kinds of paraffin, including isoparaffins and cycloparaffins) and 25% aromatic hydrocarbons (including naphthalenes and alkylbenzenes) [
8]. Diesel fuel comes from a fraction of crude oil called distillate. The hydrocarbon molecules in diesel fuel are more significant than gasoline [
9].
Cerium is a rare-earth lanthanide metal and a potent oxidizing agent. Cerium exists both in the trivalent state (Ce
3+, waxy) and in the very stable tetravalent state (Ce
4+, ceric) as cerium oxide (CeO
2). CeO
2 can also act as a catalyst because it accepts and donates oxygen [
10]. This latter property has led to the widespread use of CeO
2 in the automotive industry, which has increased fuel efficiency and reduced particulate emissions, as studied by several authors [
11,
12,
13,
14]. In
Table 1, some physicochemical characteristics of cerium oxide are indicated.
The efficiency of a catalytic system that provides the vehicle combustion chamber with an adequate amount of cerium oxide (CeO
2) without affecting the engine operating parameters has been studied to reduce polluting emissions [
15]. Once in the combustion chamber, nanoparticulate cerium oxide acts to modify the combustion of diesel fuel, extending and improving fuel efficiency. Additionally, nanoparticulate cerium oxide reduces the temperature at which carbon burns. This feature provides a secondary benefit to the performance of a diesel fuel engine, as it facilitates the removal of hard carbon deposits and soot, thereby further increasing fuel efficiency, reducing engine wear, and most importantly reducing exhaust particulate emissions [
16].
According to Bafghi et al. [
17], cerium oxide nanoparticles can be used as additives in diesel and diesel-biodiesel blends to significantly improve the complete combustion of the fuel. Jung et al. [
18] studied the influence of cerium oxide additive on ultrafine diesel particulate emissions and oxidation kinetics. They found that adding cerium to diesel caused a significant reduction in the number of weighted size distributions, and the quenching temperature and oxidation rate were significantly increased. Ribeiro et al. [
19] critically reviewed the influence of cerium oxide additive on net diesel particulate material emissions and oxidation reaction kinetics. They found that the addition of nano-CeO
2 to diesel resulted in a significant reduction in the number-counted size distributions and an increase in ignition temperature, while also improving the oxidation rate. In a more recent study, Venkatesan and Kadiresh [
20] investigated the addition of 50 mL of cerium oxide in diesel and biodiesel fuels and reported that HC and NOx emissions were reduced compared to pure diesel fuel.
Arul Mozhi Selvan et al. [
21] investigated the performance and emission behavior of diesel engines using cerium nanoparticle additives in diesel, as well as in diesel–biodiesel-ethanol blended fuels. The test results demonstrated that cerium nanoparticles can be used as a fuel additive to improve combustion rate and reduce exhaust emissions. Furthermore, the deposition of non-polar compounds on the engine cylinder wall was prevented by the CeO
2 nanoparticle, and its activation energy burnt the deposited carbon particles at the combustion chamber wall temperature, resulting in lower HC emissions.
Vairamuthu et al. [
22] noted that adding cerium oxide nanoparticles above 40 ppm to the fuel resulted in lower performance compared to diesel fuel. The effects of adding cerium oxide nanoparticles to diesel and diesel–biodiesel–ethanol and their impact on the performance and emission characteristics of an internal combustion engine were studied. The results showed that cerium oxide acts as an oxygen-donating catalyst, providing oxygen for CO oxidation or absorbing oxygen for NOx reduction. The activation energy of cerium oxide burns off carbon deposits within the engine cylinder at the wall temperature, preventing the deposition of non-polar compounds on the cylinder wall and thereby reducing HC emissions. Tests revealed that cerium oxide nanoparticles can be used as an additive in diesel and diesel–biodiesel–ethanol blends to improve complete fuel combustion and significantly reduce exhaust emissions [
23].
A study on the development of driving cycles [
24] obtained actual fuel consumption values by applying a testing protocol that considered the terrain orography, traffic density, and road infrastructure of the Metropolitan District of Quito, Ecuador (MDQ). As a result, the representative cycles for the MDQ were validated through tests in three real-world scenarios with different traffic conditions, which proved to be statistically repeatable and reproducible, yielding a reliability of 99.7% for the measurements obtained in each procedure. The road route cycle obtained in this study was taken for the present investigation.
As stated in several studies [
14,
25,
26,
27], adding a cerium oxide-based additive to diesel fuel improves combustion, reducing CO, CO
2, and PM. Fuel consumption is also reduced due to improved combustion. On the other hand, the NO
X increases because the temperature in the combustion chamber also increases.
This study included an analysis of a loaded vehicle in real-life traffic conditions during a highway driving cycle on high-altitude roads. It analyzed the impact of the cerium oxide-based additive under real-life operating conditions to determine the behavior of pollutant emissions and fuel consumption.
Table 1.
Physicochemical characteristics of cerium oxide [
28].
Table 1.
Physicochemical characteristics of cerium oxide [
28].
| Properties | Description |
|---|
| Chemical composition | CeO2 |
| Density | 7.65 g/cm3 solid; 7.22 g/cm3 fluorite phase |
| Molecular weight | 172.115 g/mol |
| Melting temperature | 2100 °C |
| Boiling temperature | 3500 °C |
| Water solubility | Insoluble |
2. Materials and Methods
This analysis included some studies carried out in a truck tractor loaded at 70% of its capacity, with premium diesel containing sulfur at an average of 462 ppm [
29] and a mixture of diesel additives with a solution based on cerium oxide to measure the levels of polluting emissions, carbon dioxide (CO
2), hydrocarbons (HC), nitrogen oxides (NOx), carbon monoxide (CO), and particulate matter (PM). From the emission data, the variations in emissions of the truck with a mixture of diesel and a solution based on cerium oxide were quantified in percentage terms compared to the same truck running on diesel. This information was used to conduct a series of analyses to determine the effect of using a mixture of diesel additives with a solution based on cerium oxide in a heavy vehicle on its pollutant emissions, the percentage in the fuel mixture, and the phase of the driving cycle.
Five tests were conducted with diesel fuel and five with diesel fuel supplemented with a solution based on cerium oxide. The analysis included measuring pollutant emissions, such as CO, CO
2, HC, NOx, PM, and fuel consumption, under actual operating conditions. The truck was coupled with a 3-axle platform and loaded to 70% of its maximum combined specific vehicle weight, as permitted by Ecuadorian regulations [
30]. The truck was loaded with 23.1 tons of stone. The test vehicle was a Kenworth tractor truck, and the technical specifications are listed in
Table 2.
This study used an external fuel storage system to measure fuel consumption. We also included an Axion R/STM portable emission measurement system (technical specifications listed in
Table 3) to measure air pollutants.
Vehicle mass exhaust emissions were measured during actual road driving conditions. The latter was achieved by using vehicle and engine operation data, as well as pollutant concentrations in the exhaust gases removed from the vehicle. The Axion R/STM provides emission values, including carbon dioxide (CO2), nitrogen oxides (NOX), hydrocarbons (HC), carbon monoxide (CO), oxygen (O2), particulate matter (PM), and ammonia (NH3).
The particulate matter test was conducted using a MAHA particle meter, model MPM-4, which measures the real-time concentration of PM in the exhaust gases of diesel engines. The results were displayed in graphic form through a computer interface.
Table 4 details the technical specifications of the equipment. According to [
33], this equipment demonstrated an accuracy of ±5% for measuring particles within the range of 1 to 100 µm, and a relative particle count tolerance of ±1%.
Considering that trucks of this capacity do not generally circulate on urban circuits, a route was chosen on which this type of vehicle is allowed in the Metropolitan District of Quito according to Metropolitan Ordinance No. 0147 [
35]. This circuit was taken from the study developed by Quinchimbla F. and Solís J [
24]. This driving cycle proved statistically repeatable and reproducible, with a high reliability of 99.7%.
The selected route is described in
Table 5. It begins at the intersection of Av. Simón Bolívar and Panamericana Norte and ends at the intersection of Av. Simón Bolívar and Pompeya, covering 27,410 m.
The highest elevation is located at the height of the Forestal neighborhood (3064 masl) and the point with the lowest elevation is at the Machangara River bridge (2525 masl).
The fuels used in this study were premium diesel and a mixture of premium diesel with a solution based on cerium oxide. A single concentration of the solution based on cerium oxide of 250 ppm was used. This single concentration was chosen because it has yielded the best results in previous studies [
36], exhibiting the same calorific value as the only diesel sample, which maintains fuel efficiency and performance. The amount of solute (cerium oxide-based solution) required in a certain amount of solvent (premium diesel) for the concentration of 250 ppm was calculated using Equation (1), considering the following parameters.
Equation (1), used for the calculation of the additive (cerium oxide-based solution):
For a supply of 50 gallons of diesel, at 250 ppm per 1,000,000 ppm of fuel:
To convert from grams to cm
3, we consider the same diesel density:
The additive was manually mixed in a container and placed in the auxiliary tank. No additional dispersion methods were used. We estimated that the natural flow of the injection system, the return flow to the fuel tank, and the vehicle’s movement during operation ensured a sufficiently homogeneous mixture for this application.
The Axion R/STM was used to measure pollutant emissions of CO
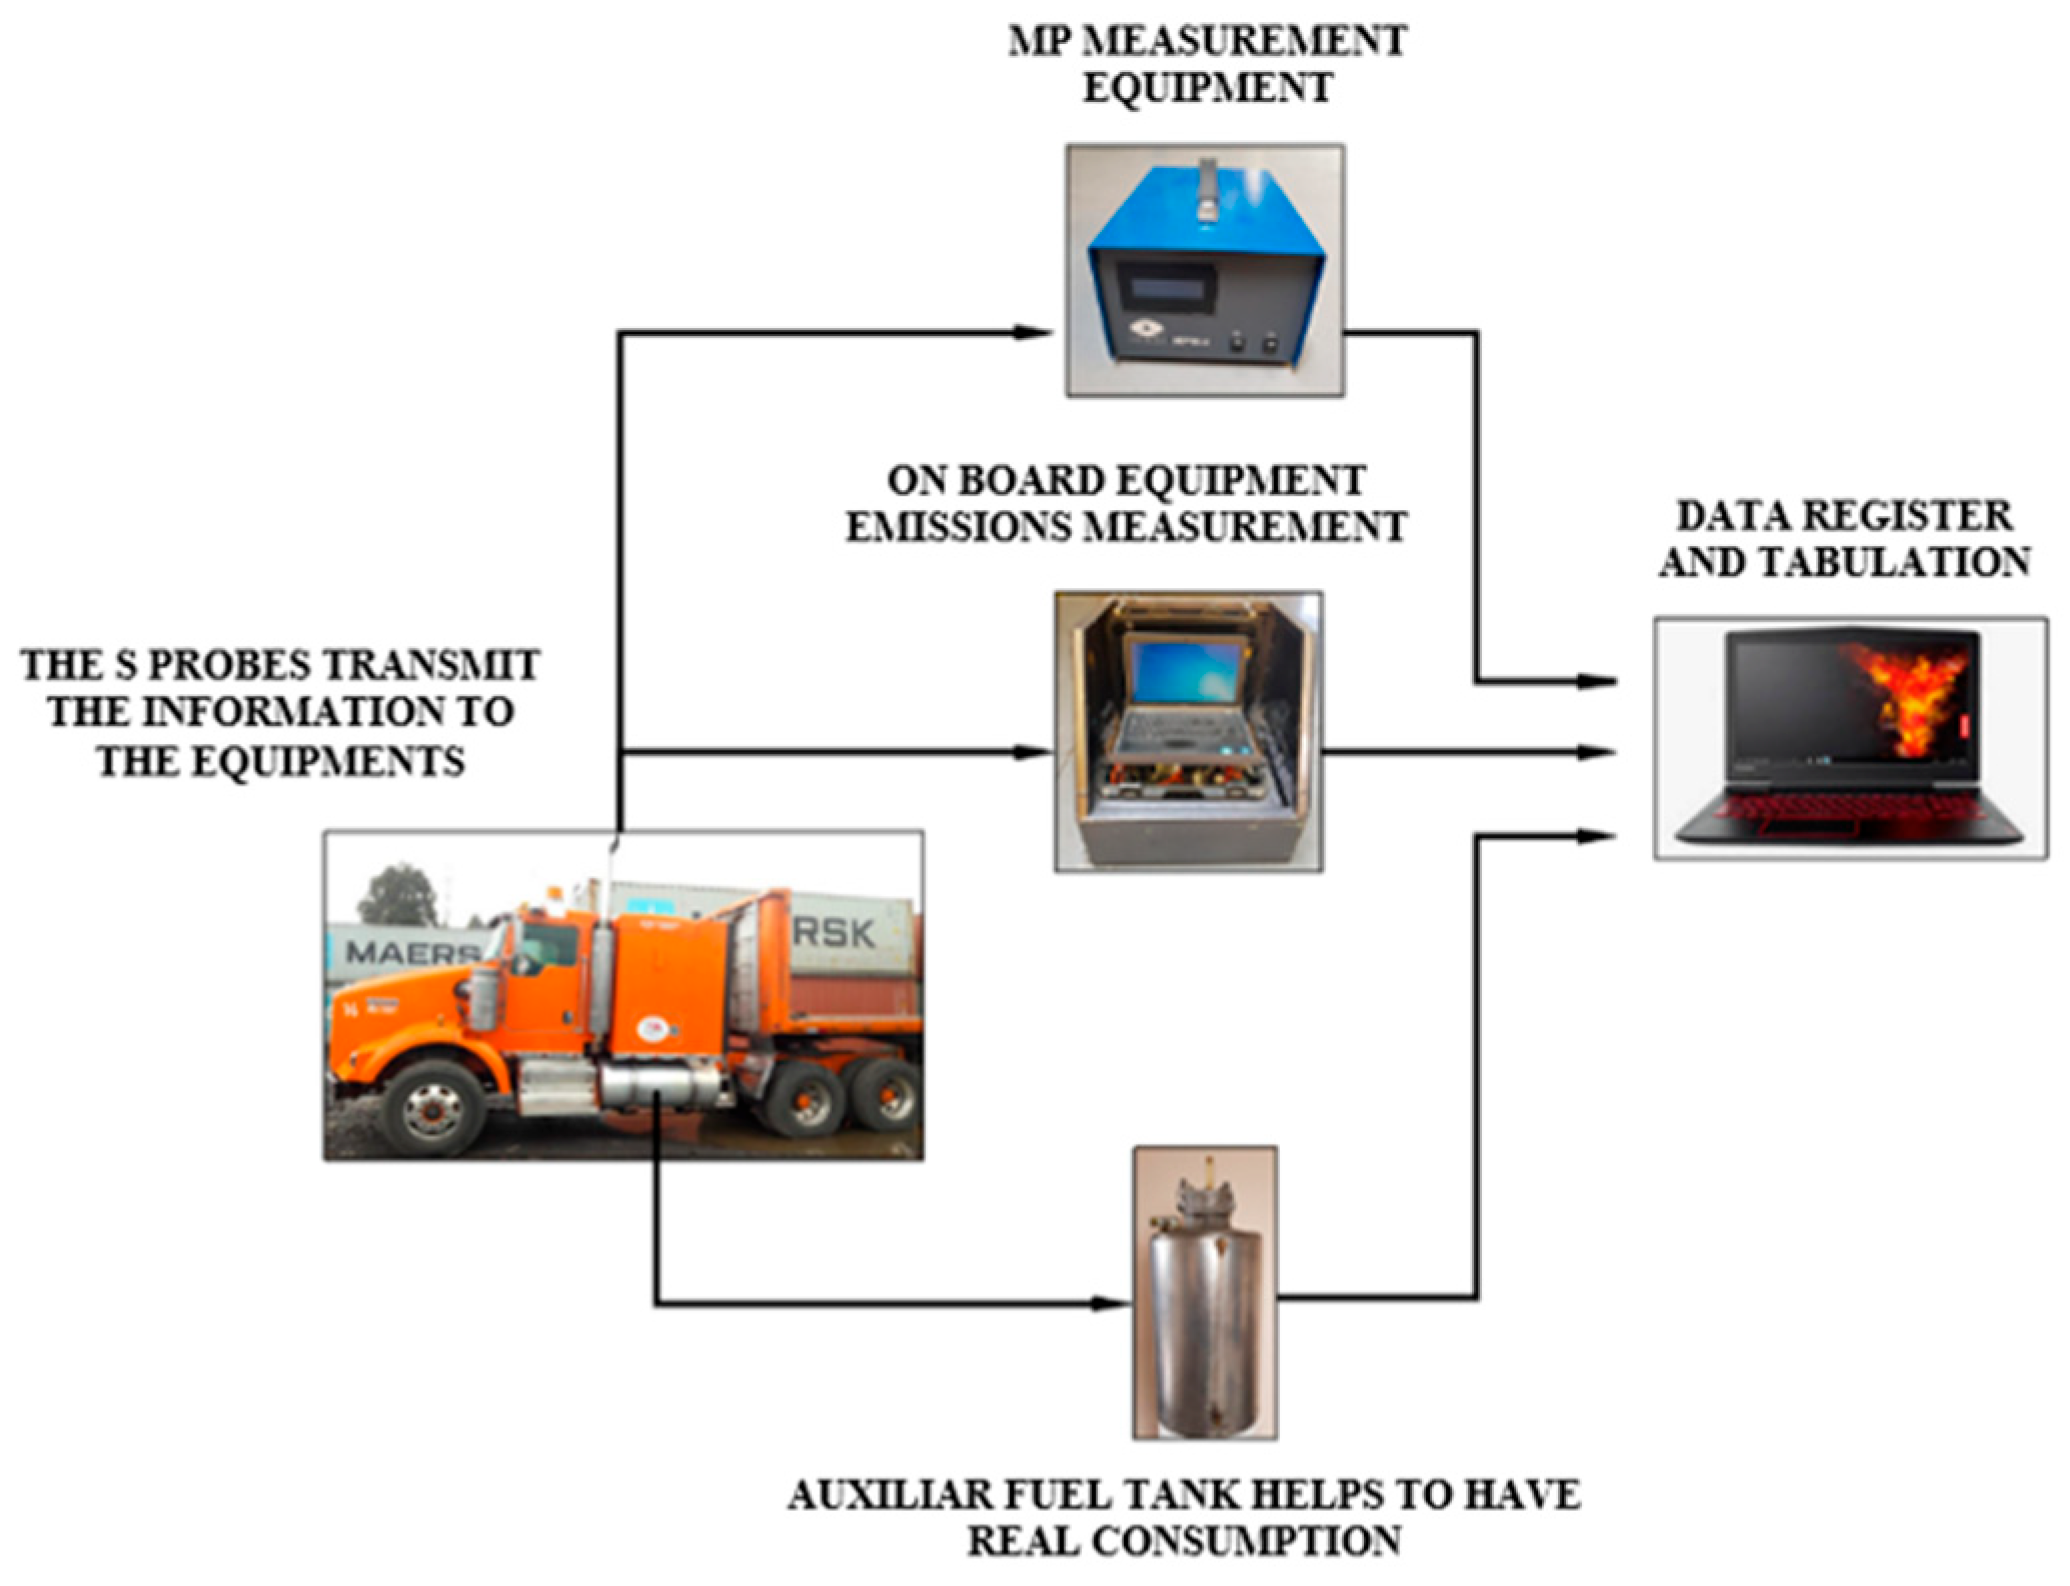
2, CO, HC, and NOx. It collected data through a probe placed in the truck’s exhaust pipe, which was then processed and transmitted to a portable computer. Simultaneously, particulate matter (PM) was measured using the MAHA MPM-4, which features a probe installed in the exhaust pipe that extracts and transmits the data to the measurement equipment. The probe sends the information to a computer for verification and analysis of the data. An external graduated storage tank with a capacity of 10 gallons measured fuel consumption, as is observed in
Figure 1.
The protocol for measuring pollutant emissions, particulate material, and fuel consumption is presented in
Table 6. The tests were conducted over 5 working days, with two tests per day from 9:00 to 15:00. The engine needed to be at an operating temperature of 95 degrees Celsius.
The method’s reliability was verified by processing and analyzing the obtained values, which had to fall within the confidence range, and by applying control charts to establish repeatability and reproducibility. The evaluation was carried out through 2 types of tests:
Repeatability tests consisting of uniformly carrying out the exact measurement on the same day, with the same vehicle, and under the same conditions.
Reproducibility tests consisting of uniformly carrying out the exact measurement on different days, with the same vehicle, and under the same conditions.
Control charts were used to analyze the behavior of a measurement process using statistical methods. The process control checks if all the points on the graph are within the control limits. If a point falls outside the limits, it can be attributed to some assignable cause, indicating that the process is out of control. The basic idea of control charts is to identify any variations in measurements, which are of two kinds:
Random variation: These are factors that slightly affect the variability of the system, but do not cause real problems that prevent control of measurement quality.
Assignable variation: Factors that exceed the natural difference in measurements destabilize the system, which can be detected and identified.
Individual control charts and moving ranges were used to develop this study. We used the following procedure [
37]:
- 1.
Get readings from a set of k observations:
- 2.
Calculate the global average:
where k is the sample size and x
i is the value of the measured variable.
- 3.
Calculate moving ranges between pairs of individuals. These moving ranges are obtained as follows: the first range consists of , and the last range will be . Consequently:
- 4.
Get the average mobile range.
where R
i are the mobile ranges.
- 5.
Calculate the control limits for the distance mean of three standard deviations from the center line marked by :
where LSC
x is the upper control limit for averages, LIC
x is the lower control limit for averages,
is the average of measurements, and
is the debiasing constant.
Similarly, for the range graph, we have:
where LSC
Rm is the upper control limit for moving ranges, LIC
Rm is the lower control limit for moving ranges,
is the average moving range, and D
3 and D
4 are constants that depend on the sample size.
The values of the constants D
2, D
3, and D
4, as tested in this study, are presented in
Table 7 after 5 repetitions. According to the control chart requirements, n = 5 satisfies the repeatability check for the 99.7% confidence interval.
3. Results and Discussion
This analysis presents the data from five repetitions for each fuel used in the pre-established route cycle. Also, it shows the average control charts, which indicate whether the process was under control during data collection, and the moving range control charts as a measure of variability. Finally, a summary table allows easy visualization of the obtained results. Control charts show moving averages and ranges of CO
2, CO, HC, NO
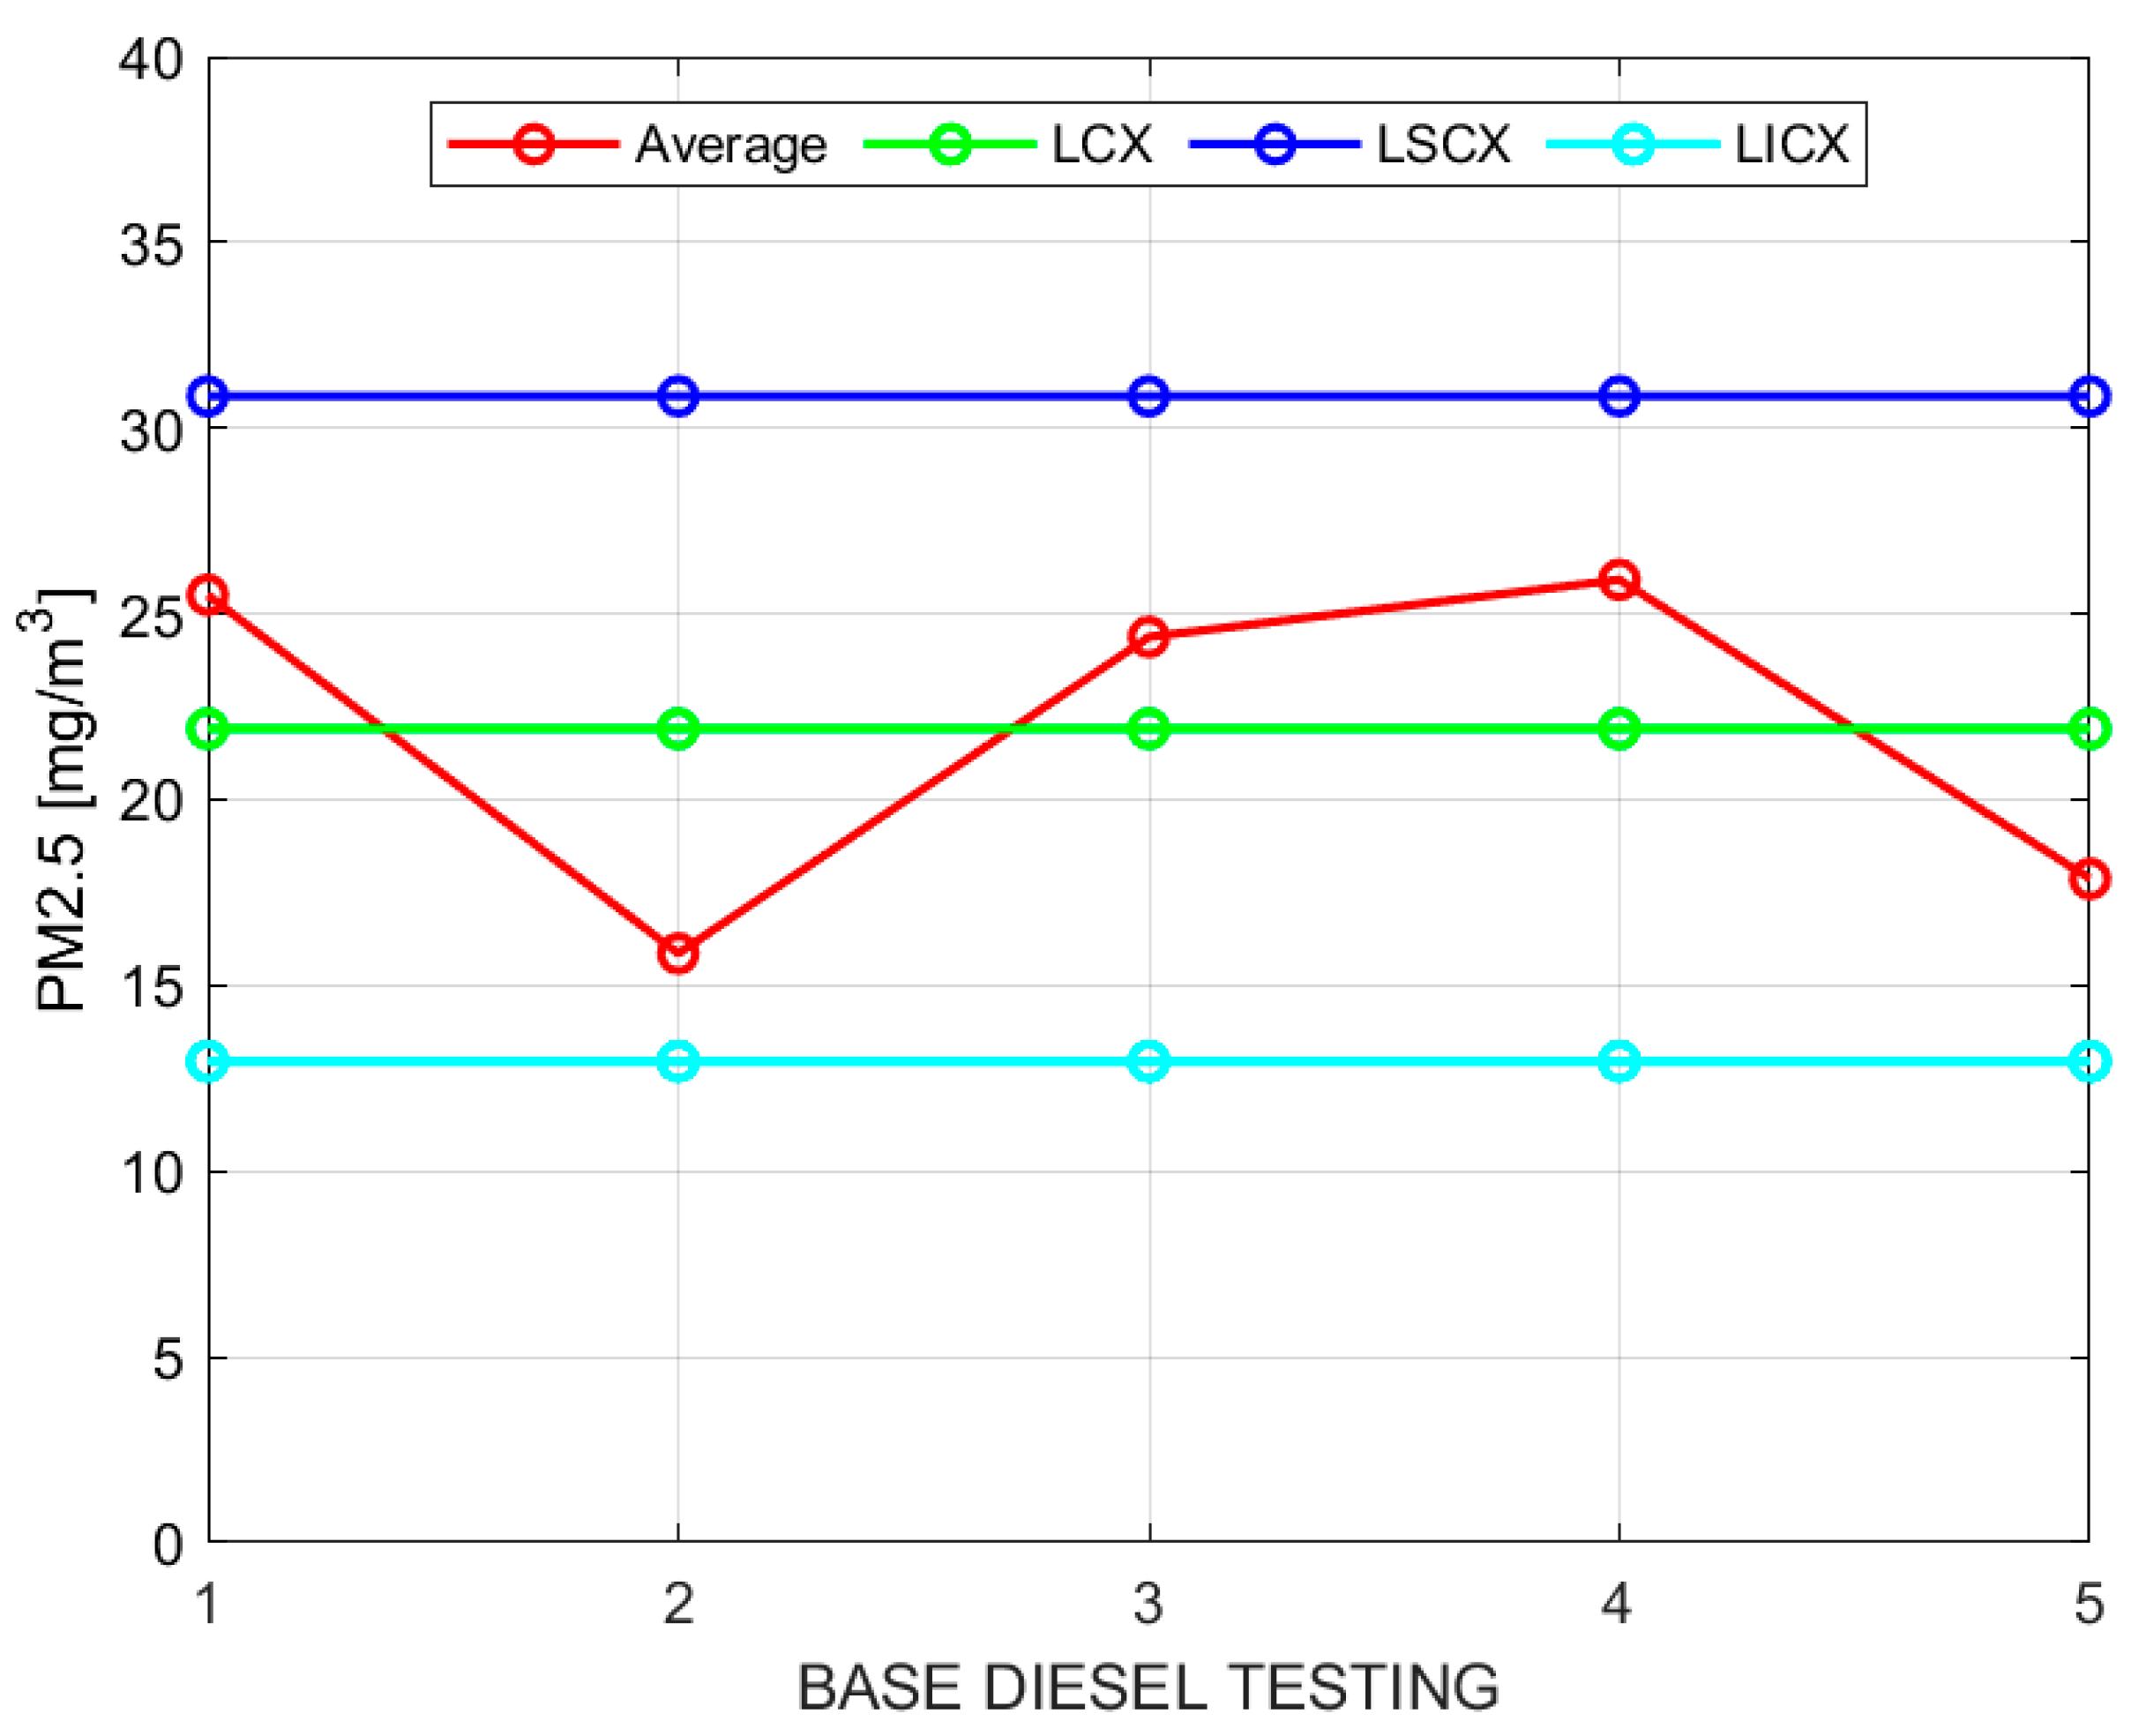
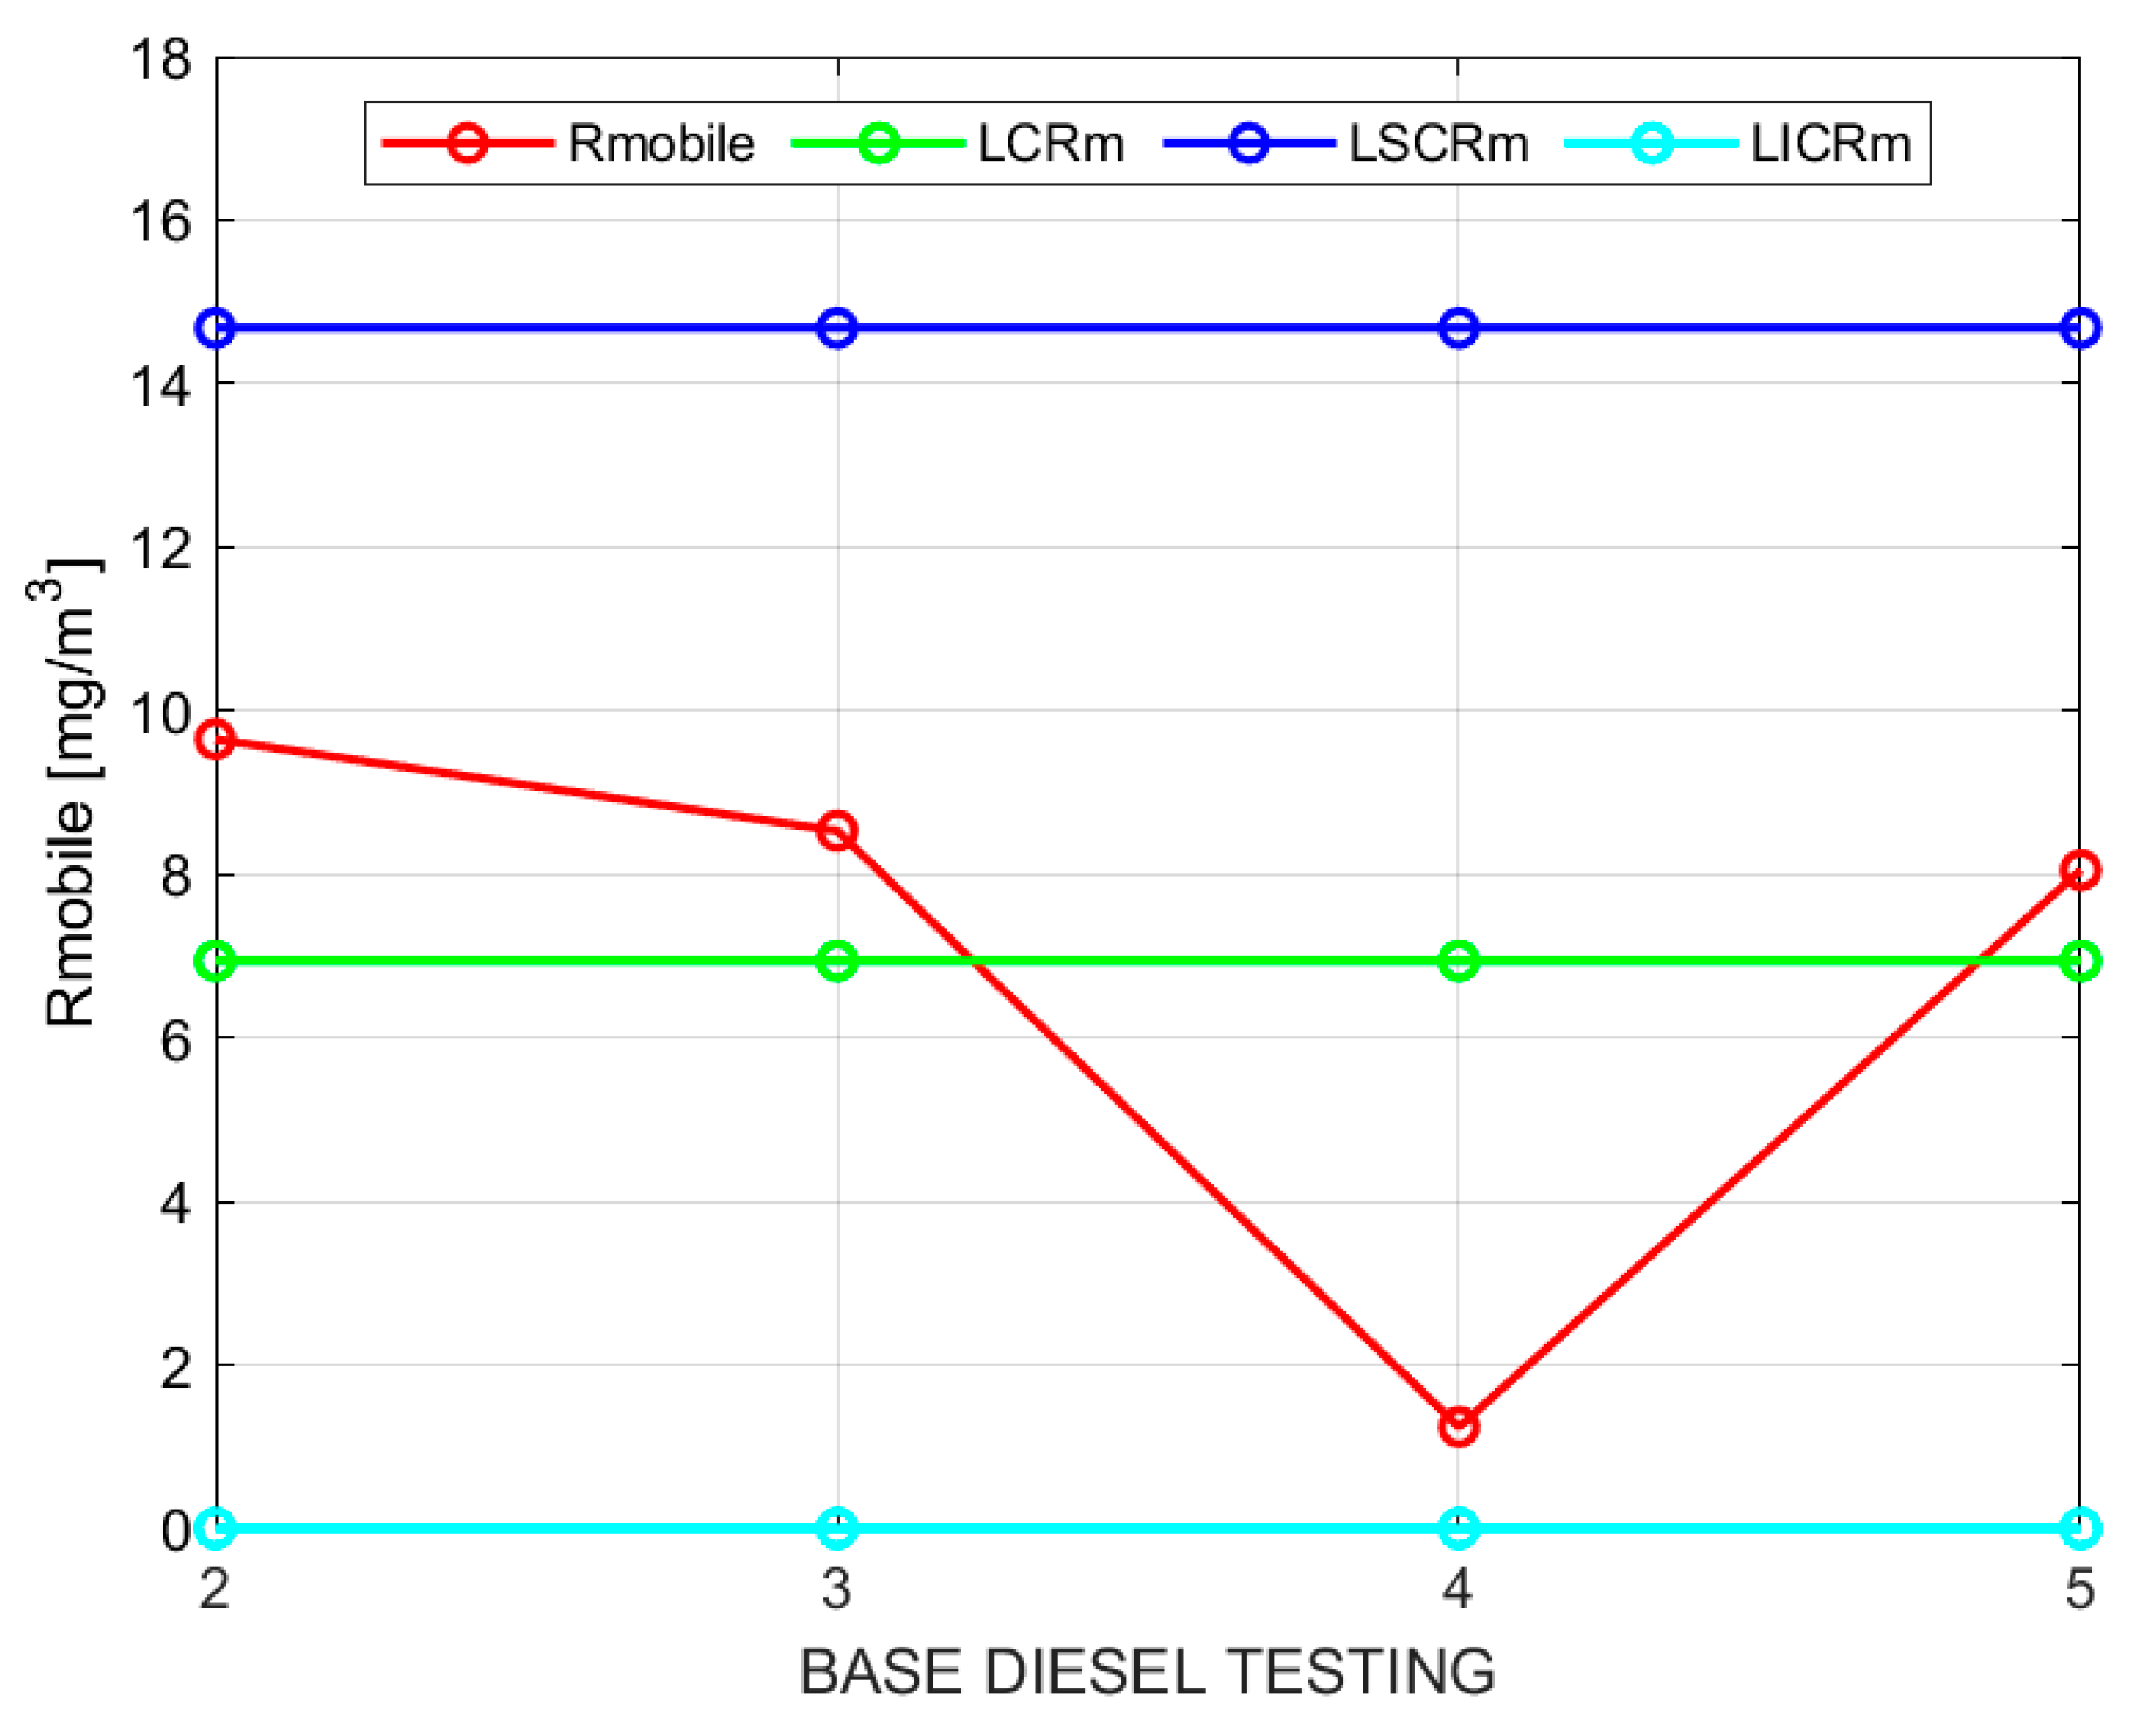
X, particulate matter (PM), and fuel consumption. Below, only the results for particulate matter are presented, followed by a table that displays all the obtained results. The control charts for sample moving averages and ranges of PM with base diesel and following the procedure indicated in the methodology are shown in
Table 8.
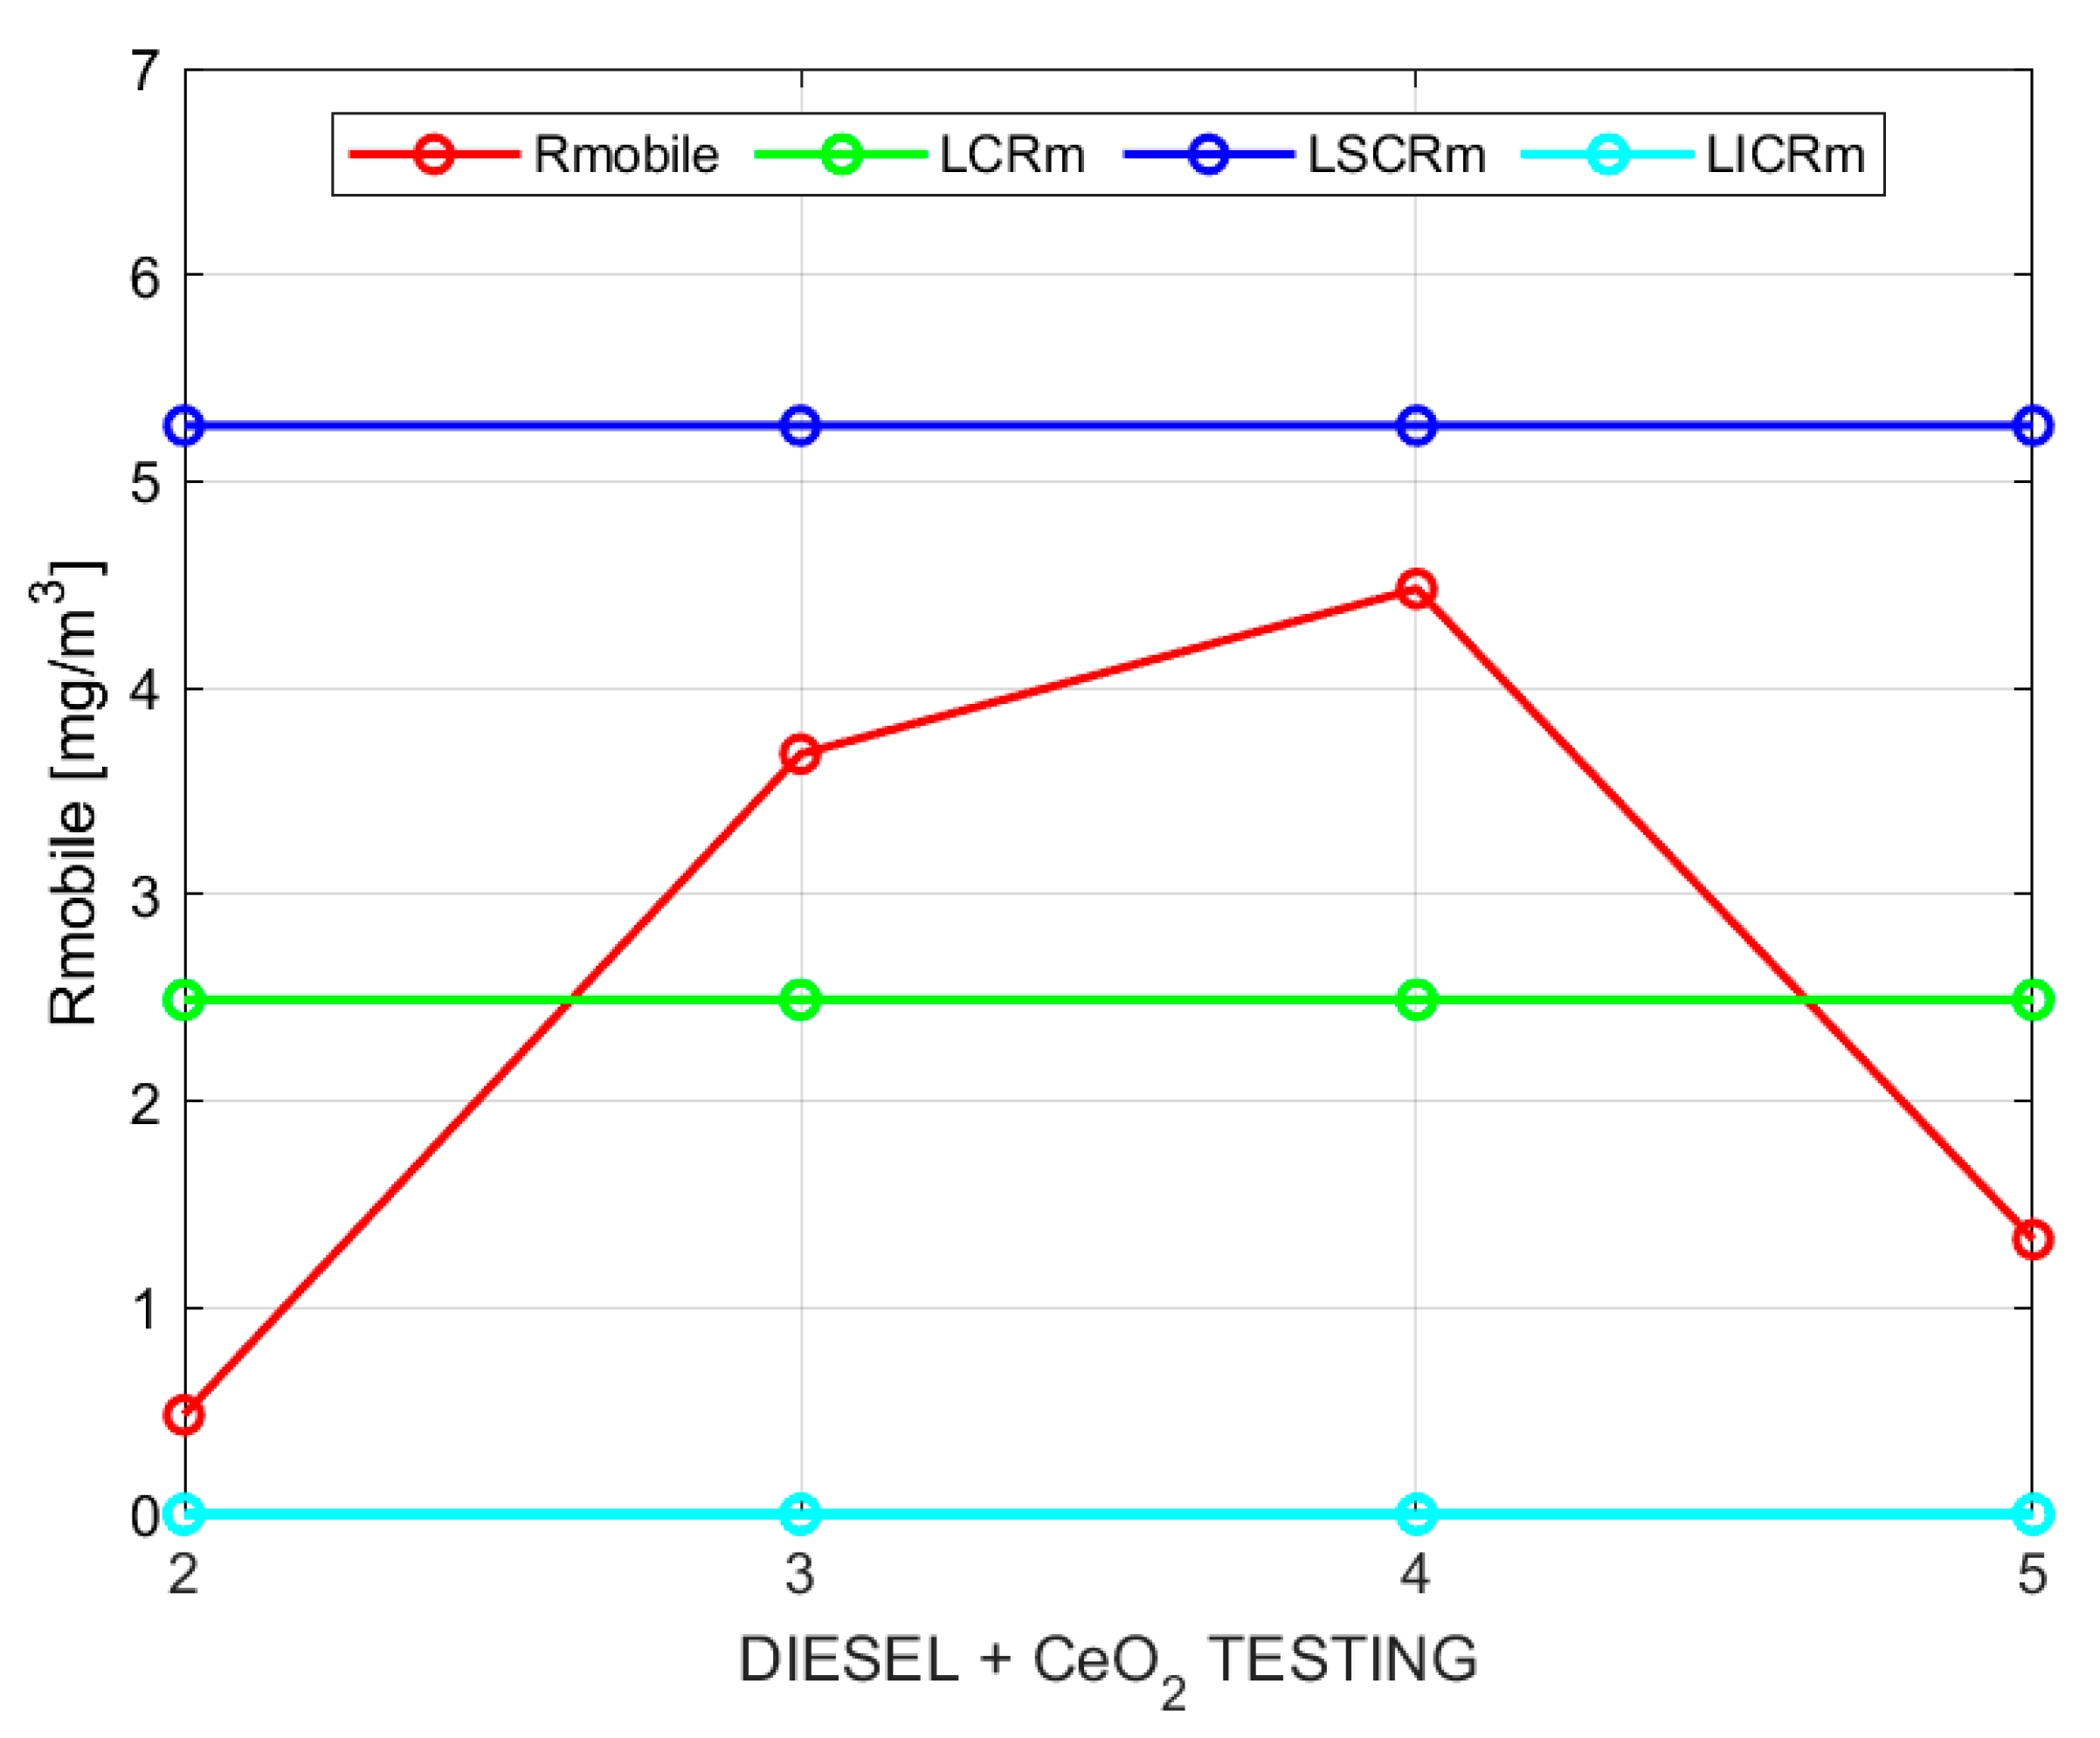
Figure 2 and
Figure 3 show the sample moving averages and ranges of PM using base diesel.
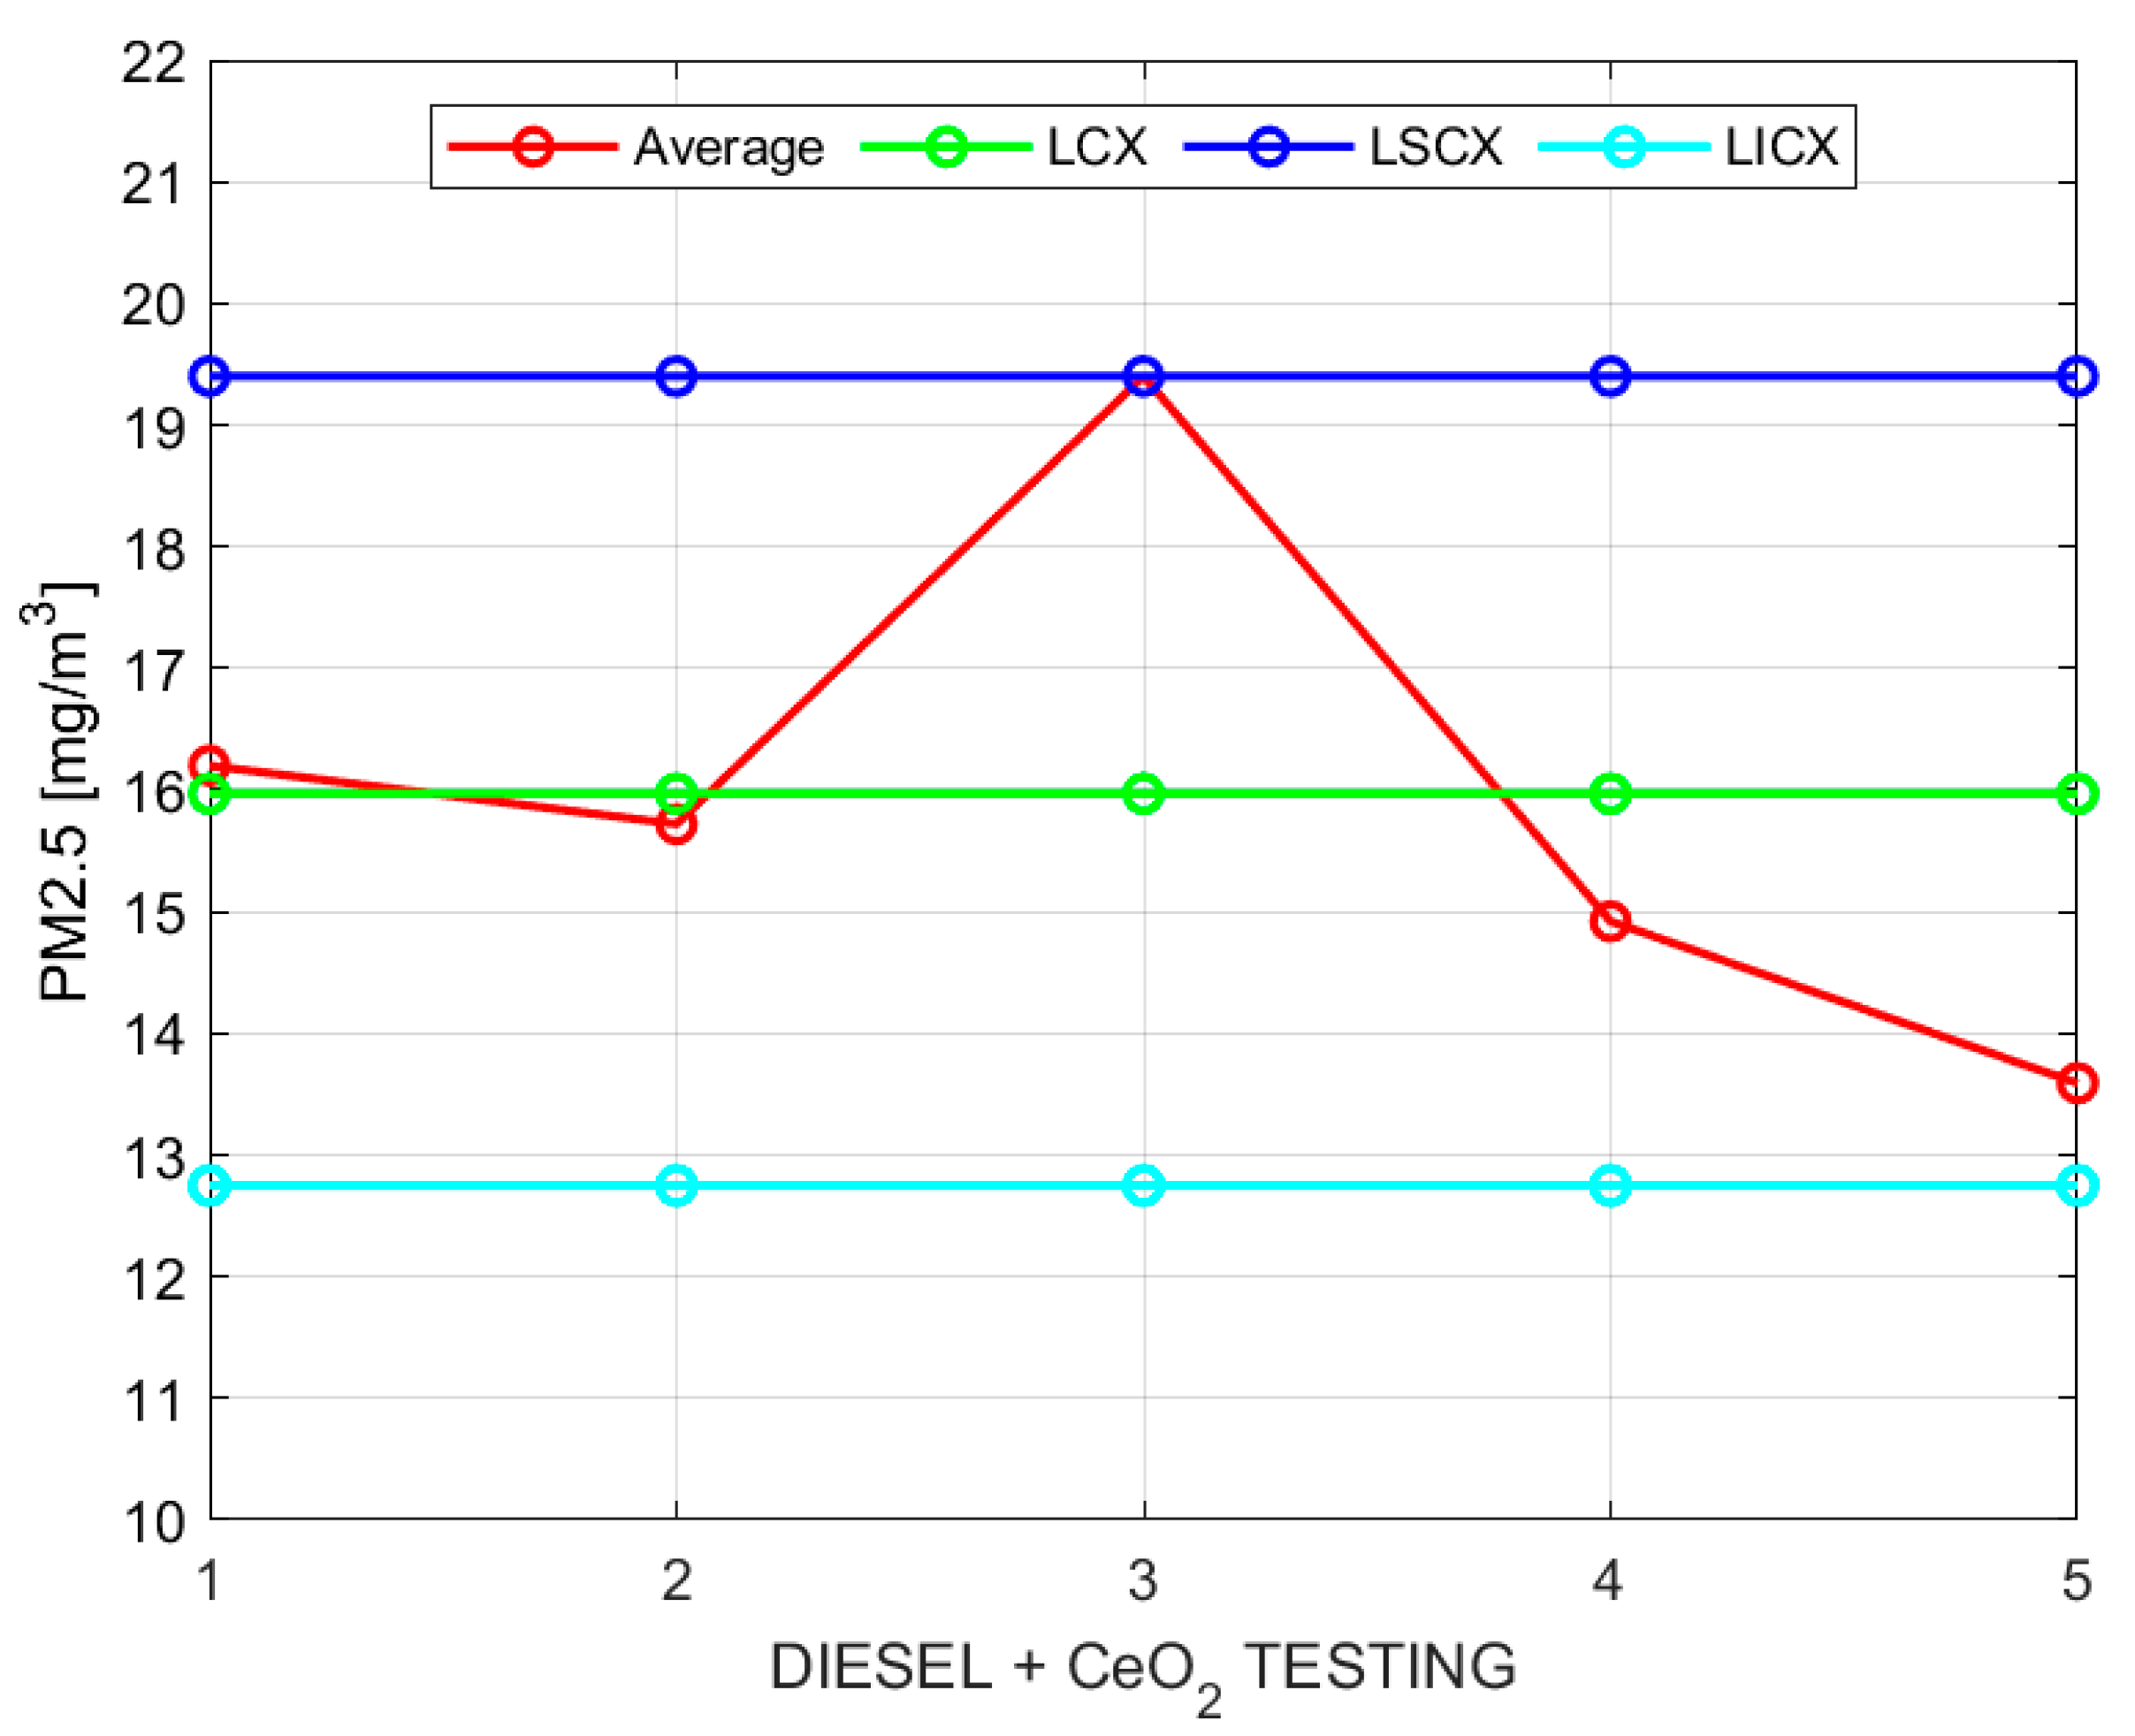
The control charts for sample moving averages and ranges of PM for the mixture of diesel additives with a solution based on cerium oxide processed following the indicated procedure are shown in
Table 9.
Figure 4 and
Figure 5 show the sample moving averages and ranges of PM using the mixture of diesel with a solution based on cerium oxide.
The PM measurements were carried out simultaneously with the other pollutant emissions, and the corresponding averages of each fuel concentration for PM were obtained, as indicated in
Table 10.
Table 10 shows a 27.1% reduction in particulate matter when using diesel with a solution based on cerium oxide, indicating that high combustion temperatures were achieved with the cerium oxide additive compared to the base diesel.
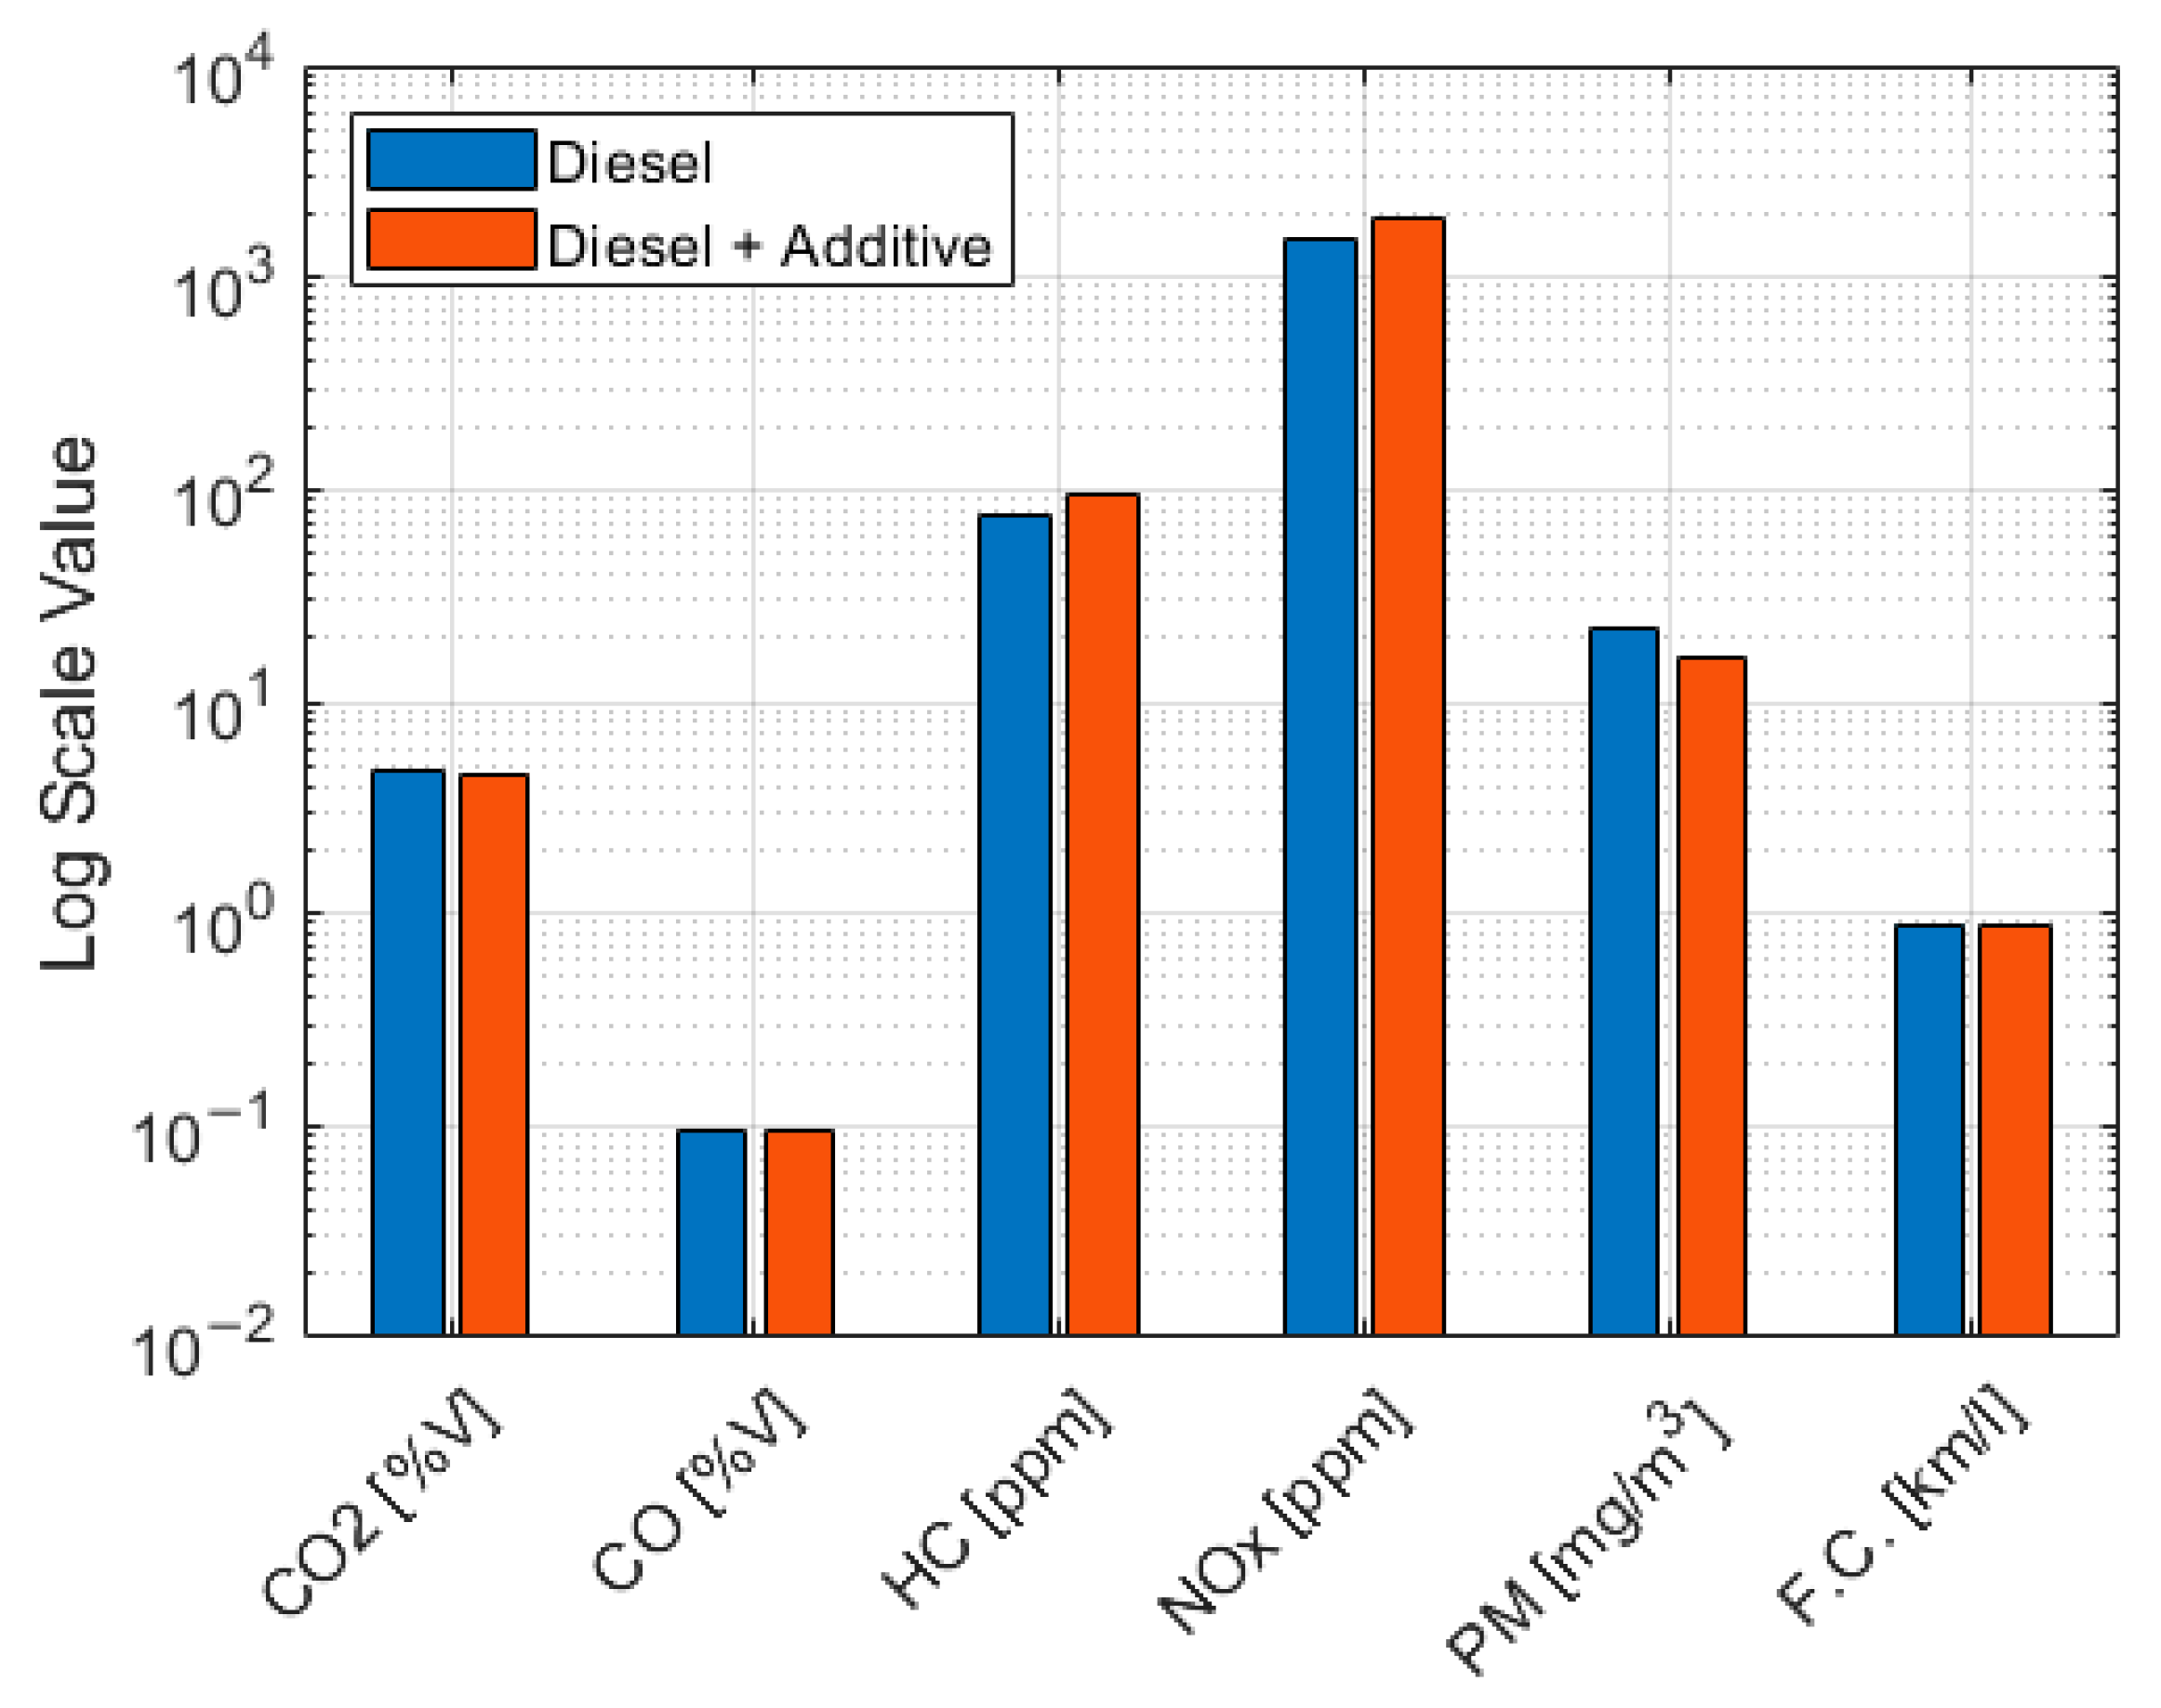
In general, the addition of the solution based on cerium oxide resulted in an improvement in combustion, leading to a reduction in CO
2, CO, and PM. However, there was an increase in HC and NOX and a decrease in fuel consumption. The reduction in PM is attributed to the catalytic function of CeO
2, which enhances carbon oxidation at lower temperatures. The increase in NOx is related to higher combustion temperatures caused by the additive’s improved thermal efficiency. The rise in HC could be due to poor local mixing or early injection. These behaviors are consistent with those reported by Jung et al. [
19] and Venkatesan and Kadiresh [
21].
This study was conducted in real-life conditions, involving heavy loads and the use of premium diesel at an altitude of 2850 m above sea level in Quito, Ecuador. Light-duty conditions and blends with biofuels were not analyzed. In this scenario, the increase in NOx was consistent with reports in the literature [
14]. Additionally, the increase in NOx and HC is reported as part of the specific behavior of the cerium oxide mixture under actual load conditions. The results are shown in
Table 11 and
Figure 6.
4. Conclusions
This study presents experimental data collected under real-life operating conditions, including loads and variations in altitude and slope, aspects that have not been adequately addressed in previous studies. Furthermore, it was not conducted at sea level, as is typically the case analyzed in most studies, but at an altitude of 2850 m above sea level in Quito, Ecuador.
It was confirmed that the moving averages and ranges remained within the control limits without any errors of assignable cause that could destabilize the system. The latter means that the dataset obtained has a reliability of 99.7% and that the measurement process was carried out with repeatability and reproducibility.
Although the emission data showed a decrease, the emission reduction was very slight, 0.34% for CO2 and 0.4% for CO. Consequently, it was not considered statistically significant. Although the reductions in CO2 and CO were not statistically significant, the measurement processes remained within the control limits.
For the three pollutants, HC, NOx, and PM, adding additives to diesel resulted in changes to engine combustion, which is evident in these three pollutants.
Using an additive based on cerium oxide in the truck resulted in a 27.1% reduction in PM, a 24.9% increase in NOX emissions, and a 24.2% increase in HC. The greater oxidation in combustion would explain the reduction in the particulate matter. The increase in NOX emissions primarily stems from the low compressibility of the liquid. This lower capacity of the liquid to compress translates into a more rapid increase in pressure in the injector pump. This advance in fuel injection enables higher temperatures to be reached during combustion, thereby increasing NOX emissions, which are strongly correlated with temperature.
There was a significant increase in HC, which likely indicates incomplete combustion. This suggests that the additive was not combined effectively, and increased mixture agitation is required. On the other hand, there was a reduction in PM, which is probably a consequence of increased oxygen in combustion.
The increase in NOx and HC can be interpreted as a barrier to the extended use of this additive under the analyzed conditions.
This study can be complemented by examining particulate matter (PM1, PM10) and fuel consumption in a diesel mixture with a CeO2 concentration gradient of 100–500 ppm in conjunction with diesel particulate matter composition analysis to optimize the equilibrium relationship between NOx and PM. Additionally, this analysis can be enhanced by examining emissions and fuel consumption in trucks driven by different drivers, as driving style is a significant factor that can influence the results obtained. Furthermore, future studies can evaluate multiple routes to reduce potential operational bias.
