1. Introduction
The contact between the wheel and rail is a critical aspect in railway engineering, as it directly influences safety, comfort, energy efficiency, and the lifespan of train components. Accurate modeling of this contact is essential for predicting stresses, micro-slips, contact forces and wear.
Traditionally, Hertz’s theory [
1] has been the foundation for calculating contact stresses in elastic problems, based on the assumption that bodies are homogeneous and isotropic, with the contact patch having an elliptical shape. While this approach has proven effective in many applications, it has limitations when dealing with complex geometries, anisotropic materials, or nonlinear loading conditions. To address these limitations, researchers like Hobbs [
2] and Nayak et al. [
3] expanded Hertz’s theory, providing a deeper understanding of contact behavior under non-Hertzian conditions. Carter [
4] introduced fundamental concepts about creep and friction forces in rolling contact. These contributions laid the foundation for the development of computational tools. Kalker [
5] extended contact elasticity theory by incorporating more advanced models for nonlinear loads and tribological phenomena. His work has been implemented in software such as CONTACT [
6], which has become a standard in wheel–rail contact analysis.
CONTACT implements Kalker’s half-space theory through the Boundary Element Method (BEM). By discretizing only the contact surface instead of the full volume, it achieves high efficiency in solving elastic contact problems with friction and stick–slip. In addition to its static modules, CONTACT also provides quasi-dynamic and transient capabilities, with optimized formulations that make it particularly suitable for wheel–rail applications [
6]. Nevertheless, the half-space formulation is inherently limited in its ability to capture global structural deformations, conformal contact near the flange, and material nonlinearities. In contrast, the Finite Element Method (FEM) discretizes the entire solid domain, providing a powerful, albeit computationally demanding, alternative to analytical and half-space-based approaches. Unlike the latter, FEM is not restricted by simplified geometries, linear elasticity, or limited material formulations [
7,
8,
9]. It enables accurate prediction of stresses in regions where analytical models fail, such as the gauge corner or wheel flange [
10]. Several studies have shown that the differences in predicted contact pressures between FEM and Hertzian-based methods can exceed the stresses in these critical areas [
10,
11]. Moreover, FEM models can incorporate complex contact conditions, elastoplastic material behavior, and velocity-dependent friction laws [
12,
13,
14].
Despite these advances, many FEM models remain computationally expensive, particularly for large parametric studies or wear sensitivity analysis. In this work, a quasi-static FEM model with implicit time integration is proposed to evaluate pressures, shear stresses, and slip within the contact patch under loading conditions. The model is optimized to reduce computational cost while preserving accuracy in the predicted contact variables, as validated through comparison with the CONTACT software (version 23.2). Although dynamic and plasticity-enhanced FEM formulations exist, the objective here is to develop an efficient framework suitable for repeated simulations over a wide parameter space. This includes future work involving systematic variation in geometrical and loading parameters in independently rotating wheel (IRW) systems, for which this model will serve as a base.
IRW configurations present additional challenges due to the absence of torsional coupling between wheels and the potential for yaw instability [
15,
16]. The proposed FEM approach allows the parametric definition of geometric variables such as toe angle, camber angle, and internal wheel spacing. This is especially relevant for the rolling gear of independent guided wheels used in Talgo trainsets, where passive steering and radial guidance require specialized modeling strategies [
17,
18,
19].
This work advances prior FEM-based wheel–rail contact models by combining: (i) a rigid–flexible domain partition, to cut 3D computational cost without sacrificing local contact accuracy; (ii) a frictionless preconditioning step followed by friction restoration to eliminate initial shear-induced deformation and accelerate convergence; (iii) an automated selection of the elastic slip tolerance (slto) based on quantitative frictional-energy consistency; and (iv) an extensible framework for analyzing the structural response of vehicle assemblies, in particular enabling the study of how contact forces are transmitted into suspension components and other substructures, thereby supporting integrated simulations of suspension systems under realistic operating conditions. The resulting quasi-static, implicit FEM achieves sub-percent errors in normal contact variables against CONTACT while remaining suitable for large parametric sweeps. Moreover, the methodology establishes a platform that can be extended to transient analyses or explicitly integrated simulations in which dynamic effects and inertia become relevant—particularly in curved track scenarios or when simulating wheel defects—and to elasto-plastic formulations requiring full 3D fields (e.g., near flange/gauge corner, conformal contact, or material nonlinearity).
To contextualize the present FEM implementation,
Table 1 contrasts it with representative 3D FE studies strictly aligned with our scope. Ref. [
8] developed a 3D FE model in ANSYS (version 24.1) using measured profiles and highlighted the limitations of half-space assumptions at the gauge corner, reporting computation times of 48–60 h and large deviations with Hertz/CONTACT in conformal contact cases. Ref. [
20] presented a static FE assessment focused on rail stress and safety under rolling, braking, and cornering loads, rather than on quasi-static rolling contact patch parametrics. More recent advances target complementary scopes: Ref. [
21] validated a dynamic 3D FE model up to 10 kHz using the V-Track rig, while [
22] experimentally validated a thermomechanical 3D FE model capturing flash temperatures at high slip ratios. In contrast, the present work focuses on a quasi-static rolling contact framework tailored for large parametric sweeps—rigid–flexible partition, frictionless preconditioning, and SLTO/FKT tuning—achieving an internal ~40% runtime reduction relative to our initial setup while preserving accuracy.
2. Materials and Methods
2.1. Modeling, Meshing and Boundary Conditions
ANSYS commercial software [
23] is used to model the rolling contact between the wheel and rail.
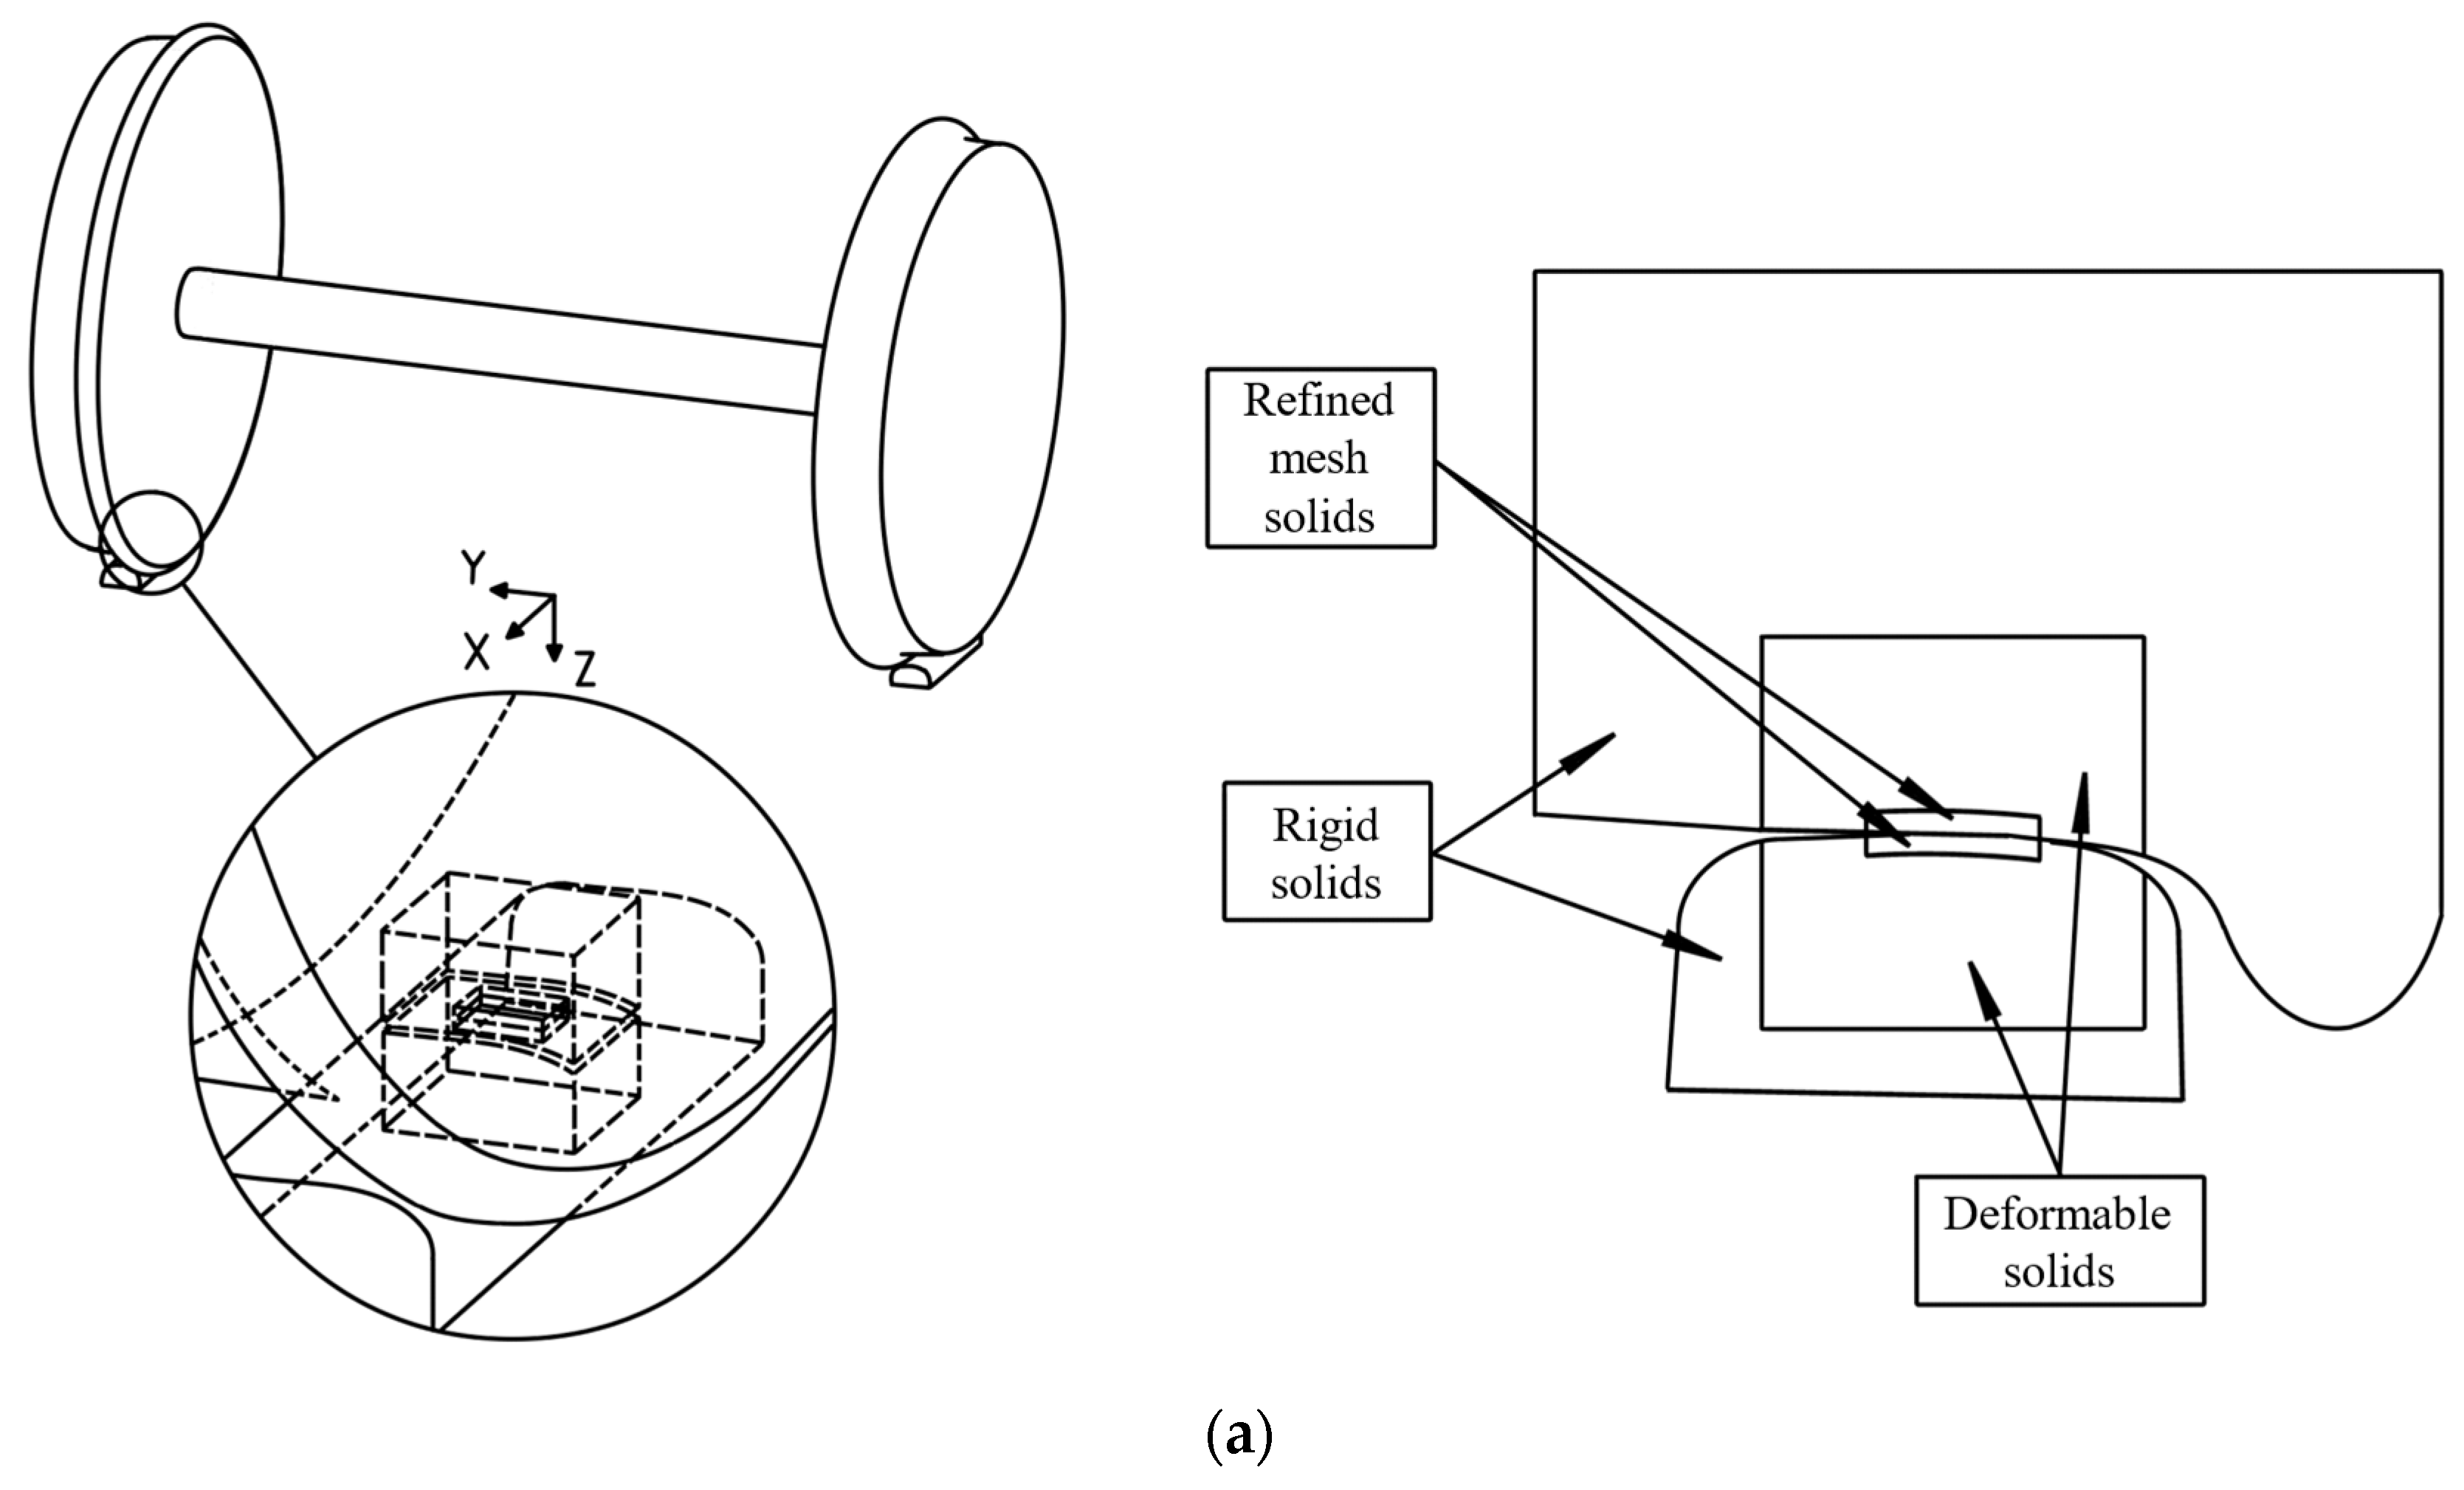
To describe wheel modeling, a global coordinate system is adopted, as shown in
Figure 1a:
X-axis is oriented in the longitudinal direction of vehicle advancement.
Y-axis is oriented in the lateral and rightward direction, perpendicular to the track.
Z-axis is established in the vertical and downward direction.
The origin of the global coordinate system is positioned on the track’s symmetry plane, aligned with the highest points of the inclined rails. The contact modeling is illustrated for a rigid axle system using a S1002 wheel profile with taper 1/20 and a 60E2 rail profile inclined at 1/40.
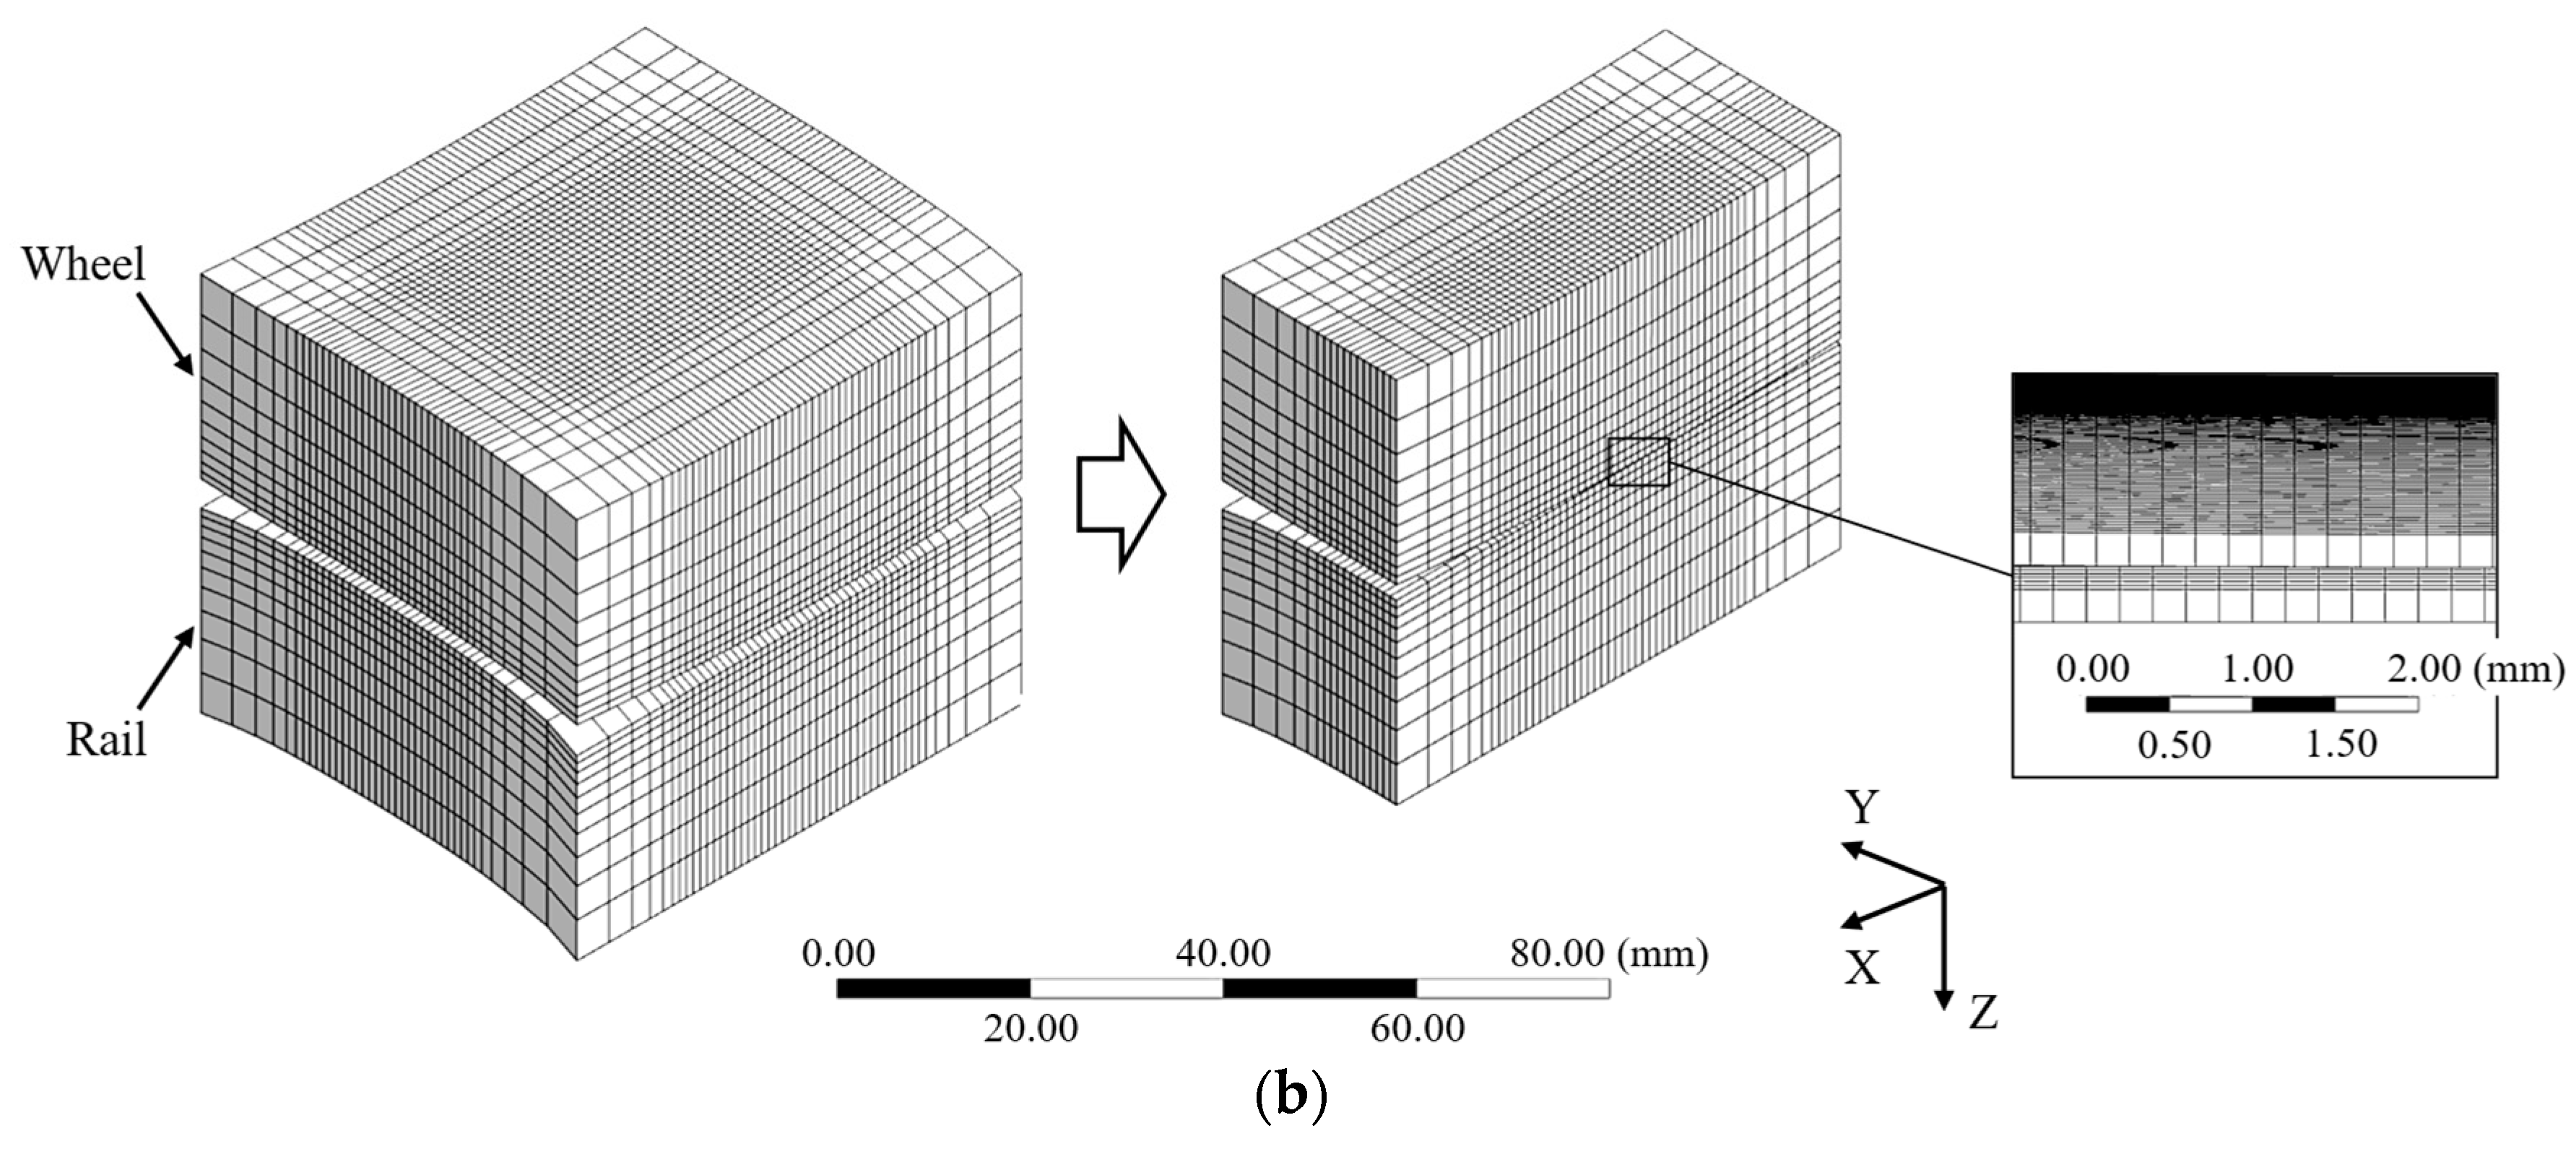
To discretize both the wheel and rail, 8-node hexahedral elements are used. To achieve a balance between accuracy and computational cost, a non-uniform mesh is used, with finer elements at the contact zone.
The model consists of 11 solids: 3 rigid solids (excluded from the results) and 4 solids with a coarse mesh around the contact zones and refined where the contact patch is located, as seen in
Figure 1b.
The geometrical discretization is performed with 0.2 mm elements where contacts occur. The result is approximately 500,000 nodes and 500,000 elements in each contact zone.
A slow mesh transition was applied between coarse and refined regions using local mesh controls and medium smoothing, to avoid abrupt size jumps and preserve solution stability in the frictional contact. The contact patch and its vicinity were discretized hexahedrally.
Hexahedral 8-node linear elements with the Simplified Enhanced Strain (SES) formulation were used, which introduces internal modes to prevent shear locking without relying on reduced integration or hourglass control.
The approach focuses on studying phenomena near the contact area, simplifying the 3D model. The regions of the rail and wheels that are far from the contact area are modeled as rigid. As long as the elastic region is large enough to capture the non-negligible stress fields (typically extending beyond three times the contact patch dimensions), it is shown that the accuracy of the local contact stresses and strain energy distribution remains unaffected, as seen in
Figure 2a.
This optimization strategy, combined with the selection of efficient numerical formulations, can reduce simulation time by up to 40%.
Regarding boundary conditions, the analysis is divided into five steps (
Table 2):
- (i)
A vertical displacement is progressively applied to the axle to establish normal contact between wheel and rail. The vertical load is introduced gradually, with a non-zero friction coefficient.
- (ii)
Once contact is established, the vertical load is held constant while the friction coefficient is progressively reduced until it reaches zero.
- (iii)
The previously established conditions are maintained, ensuring that the contact patch readjusts to the frictionless contact state.
- (iv)
The contact friction coefficient is then set to its target (reference) value, with the contact patch already adapted to the rolling condition.
- (v)
Rolling motion is simulated by applying a constant longitudinal displacement to the wheel while allowing free rotation around the axle. The motion is constrained along the X-axis, and the vertical load is kept constant throughout the simulation.
Step (iii) addresses the deformations that arise when friction is present from the onset of contact, due to the accumulation of shear stresses (
Figure 2b). Running this step without friction (
Figure 2c) produces a deformation pattern governed solely by normal pressures, yielding a more representative initial state. Restoring the target friction coefficient in step (iv) then allows the rolling simulation (step v) to proceed under realistic conditions while reducing the additional distance otherwise required to reach convergence.
When this strategy is not applied, the simulation requires a significantly longer rolling phase (step v) to reach convergence in the stress and deformation fields. Specifically, the rolling time increases by a factor of approximately two, as the contact patch needs to reconfigure itself progressively during rolling, starting from a deformed state induced by the initial frictional contact.
The values of the boundary conditions through the steps are shown in
Table 2. In this configuration, the simulations achieve an average computation time of approximately 3 h per case, running on a 20-core CPU operating at 4.9 GHz. The average computation time per simulation step is approximately 8 min for the first step, 6 min for the second, 5 min for both the third and fourth steps, and 158 min for the final step, which involves the rolling analysis (
Table 2).
The methodology presented would be applicable not only to rigid axle configurations but also to the rolling gear of independent guided wheels, allowing the analysis of the influence of variable geometric parameters such as toe angles (α), camber angles (β), wheel spacing, and other geometry configurations (
Figure 3).
2.2. Mesh Sensitivity
To evaluate the influence of mesh resolution on the numerical results, a mesh sensitivity analysis was performed by comparing three different element sizes in the contact region: 0.8 mm, 0.4 mm, and 0.2 mm.
Table 3 summarizes the main output variables of interest: maximum contact pressure, maximum contact shear stress, contact area, and sliding indication.
The results show a negligible variation in contact pressure across mesh sizes, with a maximum deviation of only 1.1% between the coarsest (0.8 mm) and the finest mesh (0.2 mm). Contact shear stress is more sensitive to mesh refinement, exhibiting an increase of 8.5% from 0.8 mm to 0.4 mm and 2.9% from 0.4 mm to 0.2 mm. This suggests that the shear stress field benefits more from local refinement near the contact surface.
The contact area remains practically unaffected by mesh size, with differences below 0.4%. Similarly, the sliding indication is fully stable across all mesh configurations, indicating that the tangential kinematics are well captured even with coarser meshes.
Based on these results, the mesh with an element size of 0.2 mm was selected for the final simulations, as it provides the highest level of accuracy while maintaining numerical stability in all contact variables.
2.3. Model Formulation and Control
2.3.1. Contact Model
The normal contact problem in the wheel–rail interaction is solved using the Augmented Lagrangian Method [
24].
The frictional state of each node follows Coulomb’s law: adhesion holds when ‖τ‖ ≤ μ pn, while sliding occurs if ‖τ‖ > μ pn, where τ is the contact shear stress vector and pn is the local contact pressure.
The CONTA174 element is used to model contact between surfaces [
25]. The contact is asymmetrical to reduce the computational cost, defining the wheel as master and the rail as slave.
The tangential contact stiffness is modeled as follows:
where
Kt is the tangential stiffness;
is the tangential stiffness factor;
is the friction coefficient;
is the contact pressure;
slto is the elastic slip tolerance.
In this work the results are compared with previous reference cases of the rigid axle [
26,
27]. The objective is to reproduce the stick and slip zones, which is achieved by balancing an increase in tangential contact stiffness and the prevention of chattering.
To obtain accurate results in both the adhesion and slip regions, as well as in the evaluation of tangential contact stress, the elastic slip tolerance parameter is adjusted according to the following expression:
where S
tol is the dimensionless slip tolerance factor, and l
i is the characteristic contact length associated with the size of the finite element.
Typical values of S
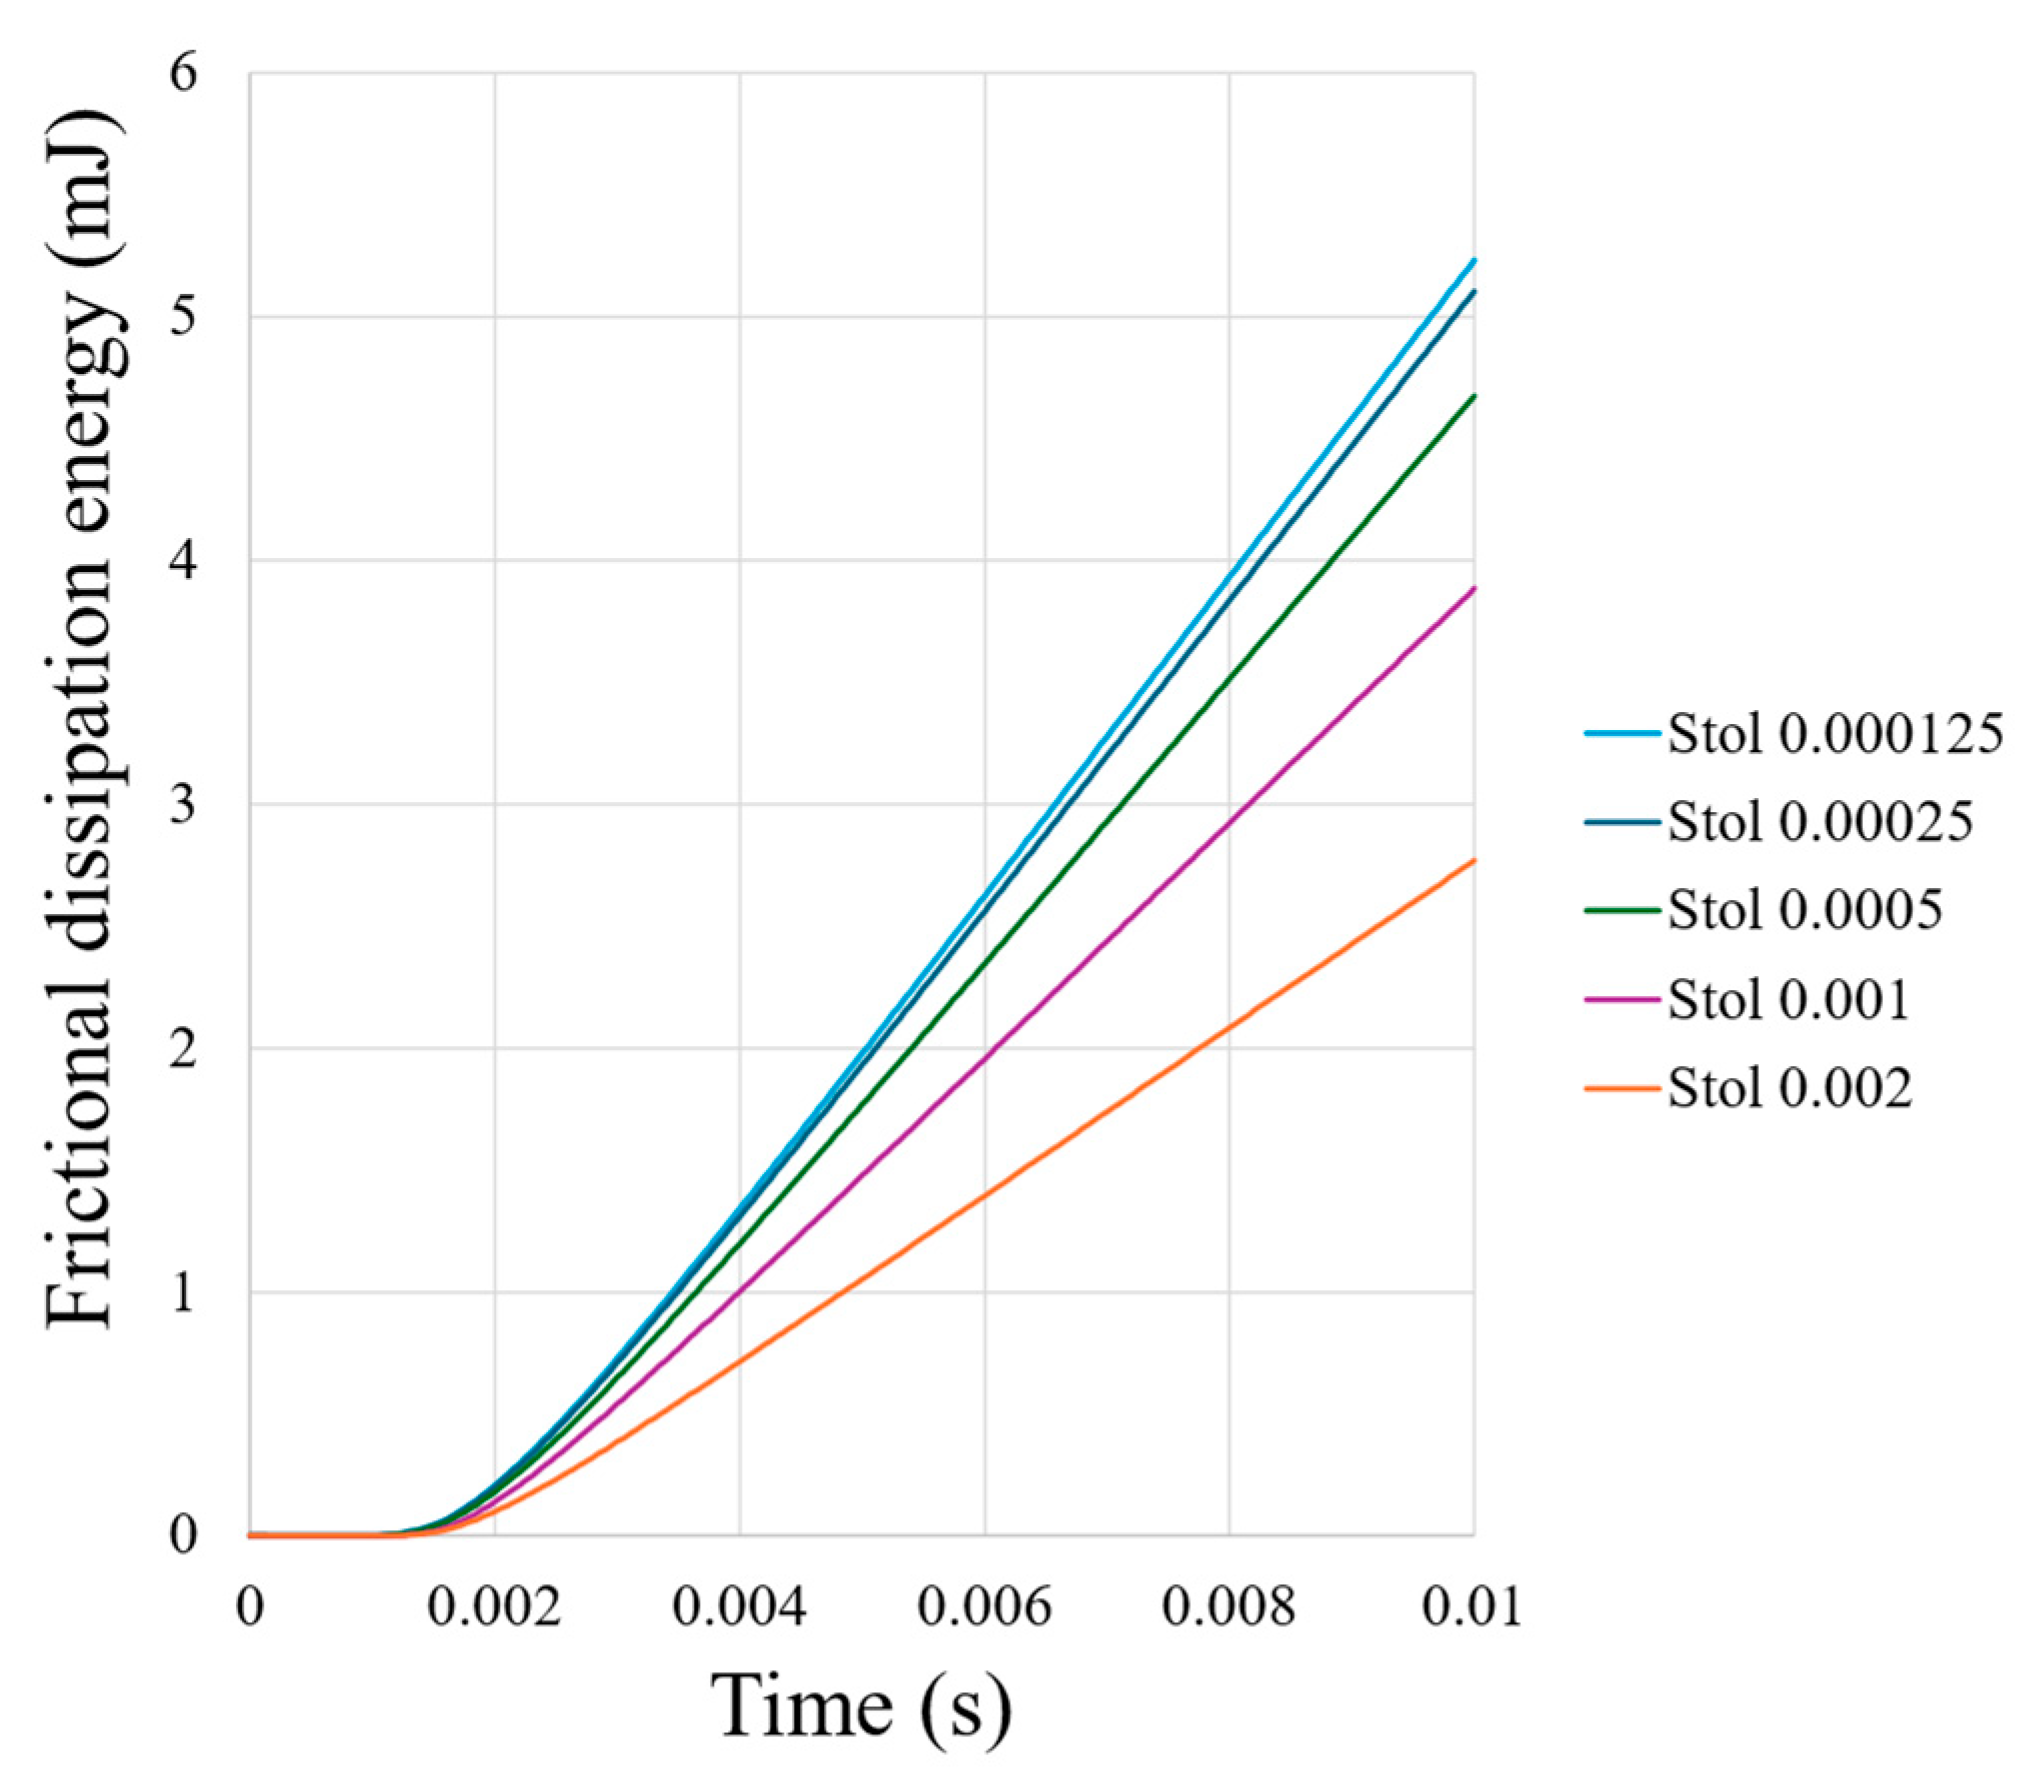
tol range from 0.005 to 0.0002, depending on the sensitivity of the model. A value that is too high may lead to significant inaccuracies in the estimation of frictional dissipation, while a value that is too low may negatively impact the convergence behavior of the solver [
28].
Therefore, S
tol is treated as a tuning parameter and should be adjusted through parametric analysis, seeking a balance between numerical convergence and the accuracy of energy dissipation estimation in the contact interface. Based on this trade-off and the required level of accuracy, a value of 0.00025 was selected. This choice is supported by the results obtained for dissipated energy in the contact region (
Figure 4), showing an error of approximately 2% with respect to the accumulated frictional dissipated energy compared to the next configuration. This approach provides a practical way to automate the selection of the elastic slip tolerance (slto) parameter based on quantitative energy dissipation criteria.
2.3.2. Integration Model and Instability Control
The integration scheme is implicit and follows a quasi-static approach in ANSYS Static Structural. A nonlinear iterative solution method is used, specifically the Newton-Raphson algorithm [
29,
30]. Improper discretization can lead to numerical errors, affecting the normal and tangential contact solution.
A common issue in rolling contact simulations is numerical instability, manifesting as spurious oscillations in the contact shear stress profile. To control this, Equation (3) is used:
where c represents the ratio of rolling displacement per time increment (δq) to mesh size (δx) [
6]. An inappropriate c can lead to unstable tangential force calculations.
In half-space theory models, spatial and temporal discretization requires
to maintain numerical stability [
7,
31]. However, in FEM models, selecting
provides a balance between accuracy and efficiency.
Thus, the time increment for each integration substep is calculated as follows:
where V is the rolling velocity. In this study, with a mesh size of 0.2 mm and a rolling velocity of 2 m/s, the time increment must be less than 0.1 ms.
Full solver settings, including the exact time stepping values, contact formulation options, and numerical controls employed in ANSYS, are compiled in
Supplementary Table S1 for reproducibility.
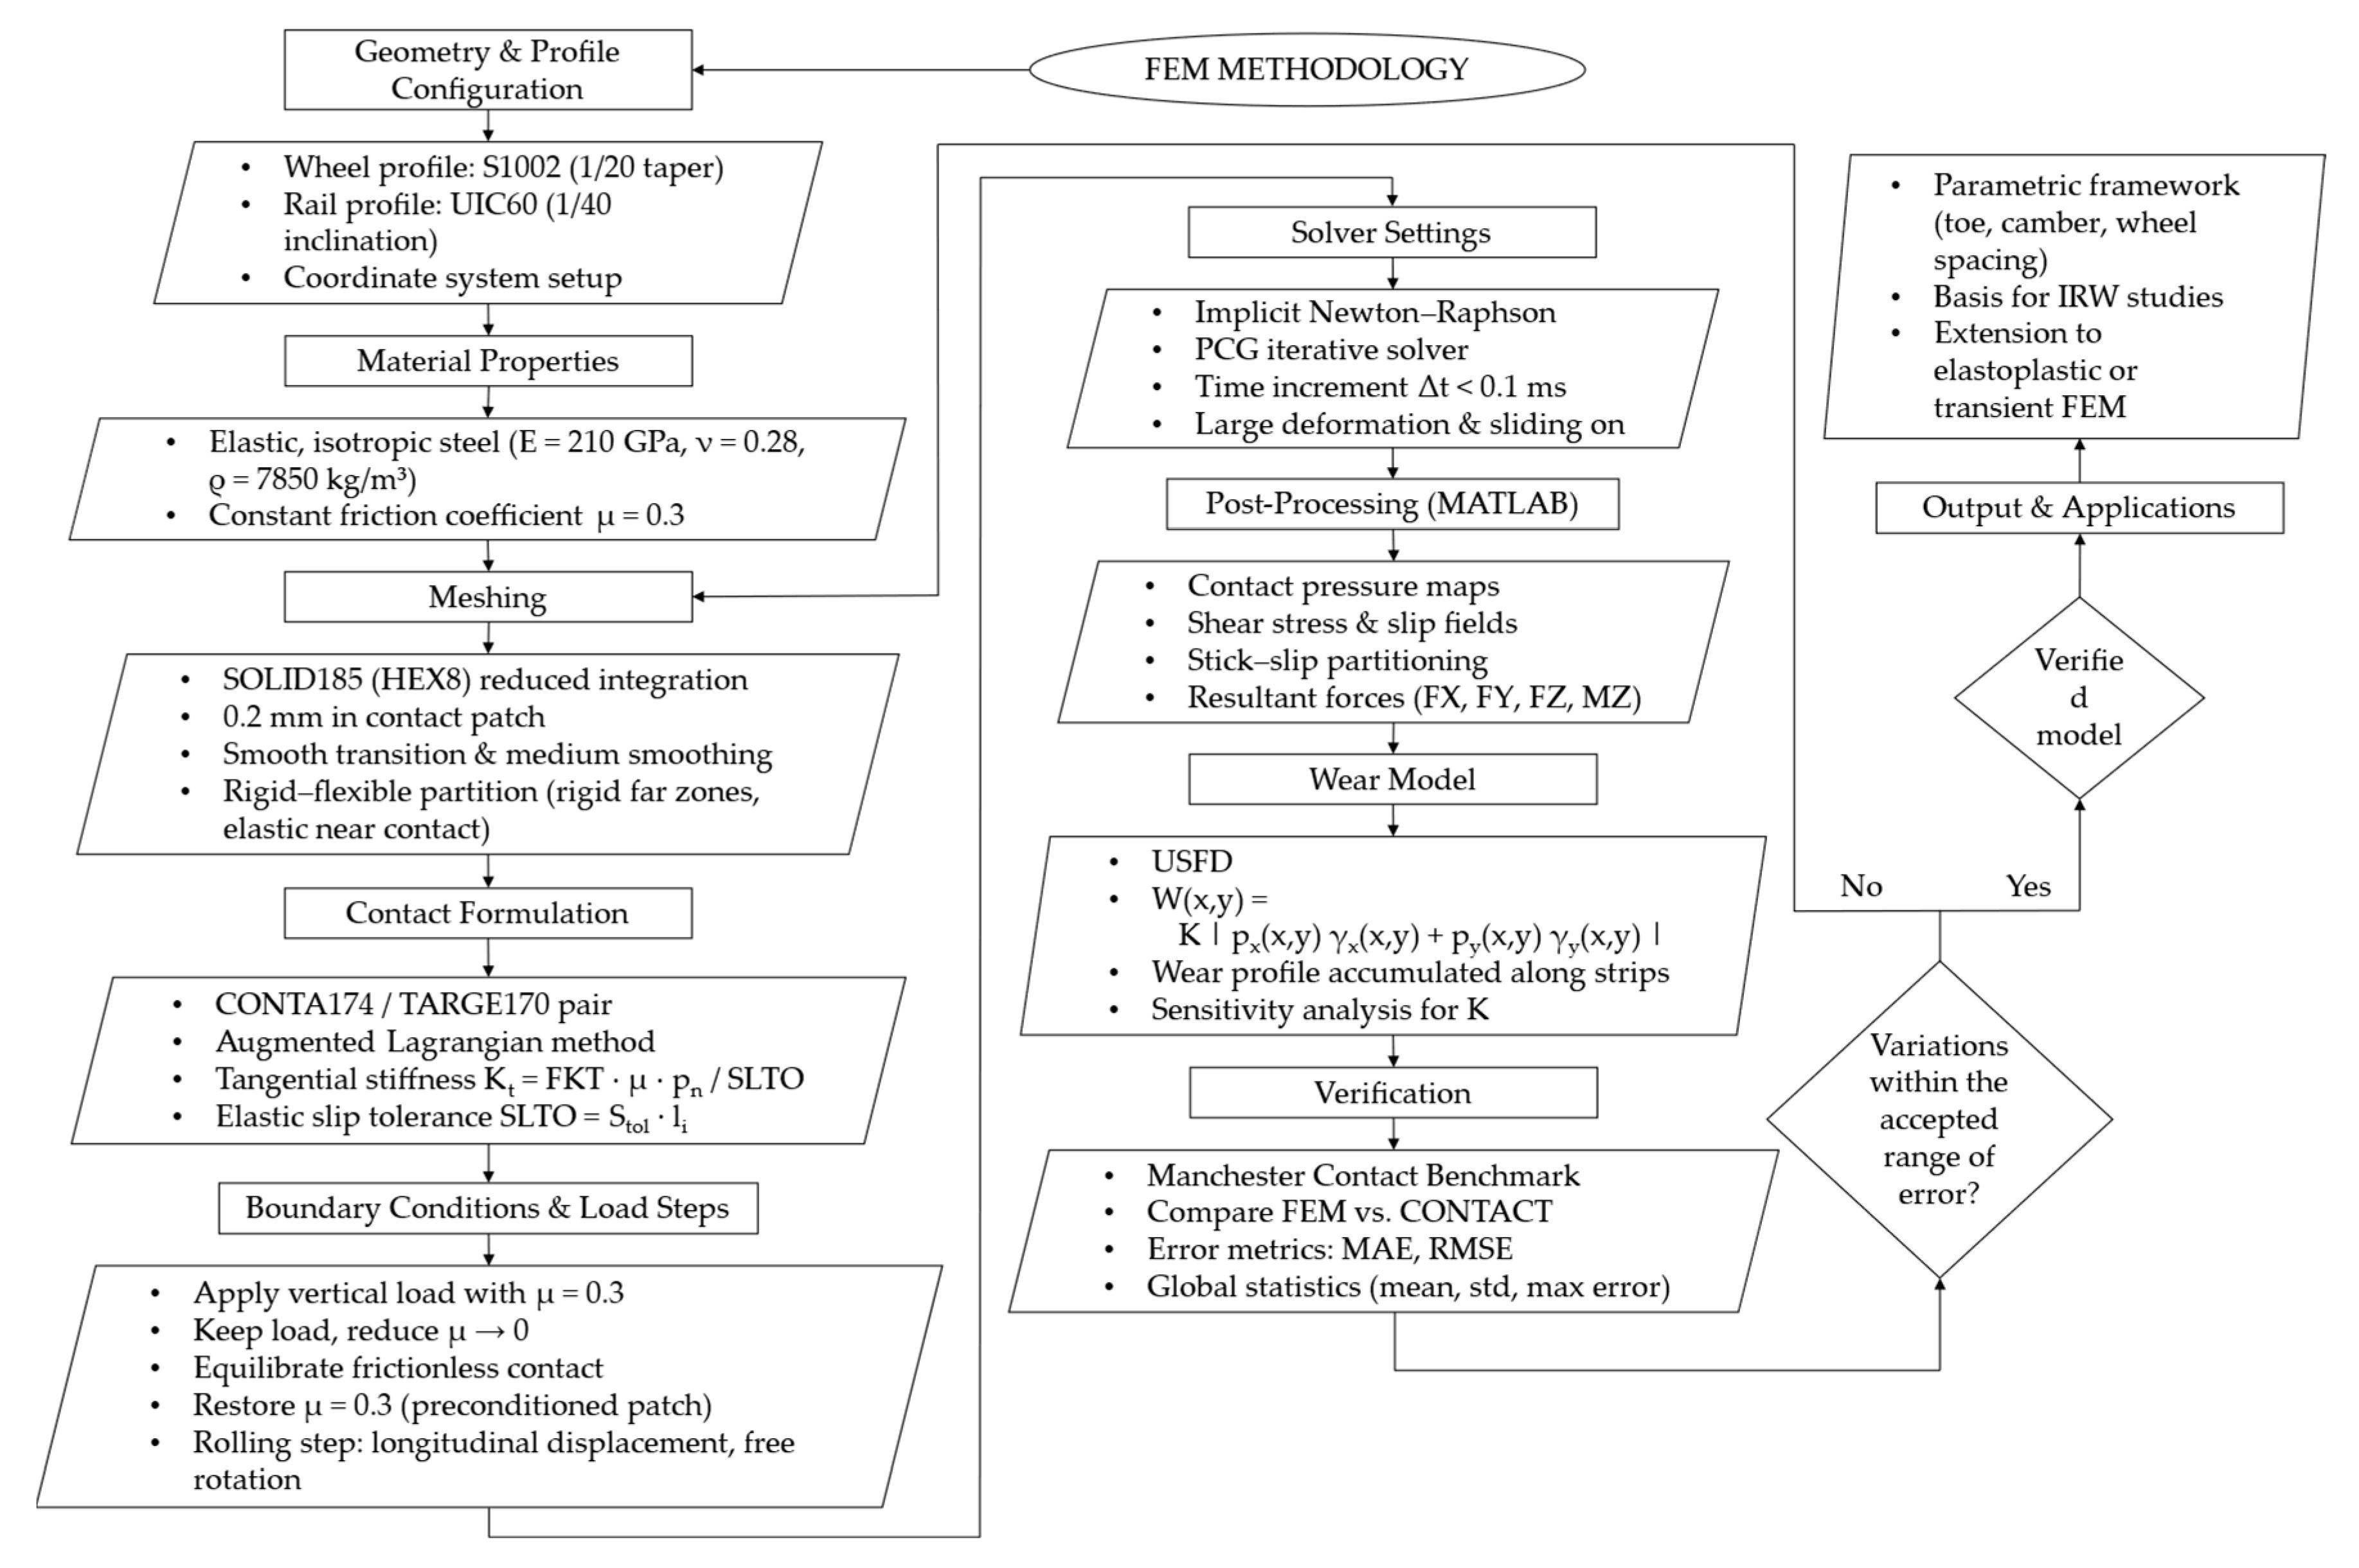
A flowchart of the modeling methodology is provided in
Figure 5, summarizing the main steps from geometry definition to verification. The figure details all substeps of the workflow, including meshing strategy, material properties, five-step loading sequence, contact formulation, solver settings, post-processing routines, and wear calculation.
2.4. Results Generation and Post-Processing
The developed model provides substantial flexibility for wheel–rail contact analysis, enabling: (i) modification of geometric, meshing, and numerical parameters to adapt to diverse study conditions; (ii) detailed evaluation of contact pressure, shear stress, and slip distributions within the patch; (iii) post-processing to derive secondary quantities—such as wear—for design optimization and parametric comparison; and (iv) construction of simulation matrices (design of experiments) by systematically varying geometric and control parameters to conduct sensitivity studies.
2.4.1. Normal Problem
The distributions of contact pressures under the applied loading conditions are obtained and post-processed in MATLAB R2023a.
Figure 6 shows examples of the results for different cases, illustrating the pressure magnitudes and patch dimensions.
2.4.2. Tangential Problem
Tangential results—namely shear stress distribution, slip, and stick–slip partitioning—are directly obtained from the contact formulation of
Section 2.3.1 and subsequently post-processed in MATLAB R2023a.
Figure 7 illustrates representative outputs of these quantities.
2.4.3. Force Calculation
The integration of contact pressure and shear stress distributions allows the calculation of the resultant forces in the normal and tangential directions, which are computed using the following equations:
where
FX, FY, FZ are the forces in the longitudinal, lateral, and normal directions within the contact patch;
MZ is the spin moment within the contact patch;
, , are the contact shear stresses at node I in the X, Y, and Z components;
is the element area, the product of its dimensions in the X and Y directions;
, are the distances to the moment application point for node I in the X and Y components.
These magnitudes provide a global measure of contact behavior and are critical for verifying the model.
2.4.4. Wear Calculation
Among the most used wear models are: USFD, KTH, and BRR. The USFD model is accurate for specific materials and mixed contact (stick-slip) scenarios [
32,
33].
This model is an empirical approach that correlates the dissipated energy at the wheel–rail interface with the mass wear rate. It classifies wear into three regimes (mild, severe, and catastrophic) allowing for an evaluation of wear distribution and friction effects. It computes wear based on local tangential force and slips within the contact patch, using an experimentally determined wear coefficient K specific to the material. The wear rate is defined as shown in the following equation:
where
W is the local mass wear rate ();
K is the empirical wear coefficient specific to the material [
32];
T is the local tangential force (N);
are the local slip values (dimensionless) in the X and Y directions;
A is the local contact area (mm2);
are the contact shear stresses in the X and Y directions.
The wear coefficient (K), depending on the wear regime, takes specific values obtained experimentally from twin-disc tests using R8T steel for the wheel and UIC60 900A steel for the rail, as described in [
32,
33].
The mass wear rate is calculated, for each element of the contact patch, using the results of contact shear stress distribution and slips of
Section 2.4.2. Subsequently, elemental contributions are summed for each strip across the entire contact patch, resulting in a cumulative wear profile, as given in Equation (10). This method is shown schematically in
Figure 8.
where
i is the position of the element in the strip;
j is the longitudinal strip;
is the material density;
is the distance travelled (rolling);
is the dimension of the element in the longitudinal and lateral directions;
is the rolling radius;
is the wear depth in strip j per rolling distance.
Sensitivity to the USFD coefficient K was assessed by scaling K by factors {0.5, 1.0, 2.0}. While absolute wear magnitudes scaled linearly, the spatial distribution, peak locations, and relative rankings across cases remained invariant. Consequently, K is kept constant here and wear is interpreted comparatively; material-specific calibration is planned in future work.
2.4.5. Mesh and Profile Update Strategy
In this study, the mesh and wheel profile are not updated during simulation because the wear predicted per run is an order of magnitude smaller than the characteristic mesh size of the contact region and therefore insufficient to distort the geometry or compromise stress and slip accuracy. This is consistent with literature recommendations: [
34] suggests updating profiles only when wear exceeds 0.1 mm in depth, while [
35] advises a minimum of 50 km of rolling before re-evaluating the geometry. Since the present simulations cover only a few wheel rotations, the accumulated wear remains well below these thresholds, and neglecting profile or mesh updates avoids unnecessary remeshing and computational overhead without improving accuracy.
For completeness,
Supplementary Table S1 compiles geometry, materials, mesh design (including transition/smoothing), contact settings, and solver controls, enabling full reproducibility.
3. Verification of the Modeling Methodology
The Manchester Contact Benchmark [
26] is employed to verify the results of the FEM model for normal and tangential contact. This benchmark consists of a set of test cases designed to evaluate and compare simulation models for wheel–rail contact. Case A is used, which considers a single wheelset with specific loading and geometric conditions, enabling a direct comparison of the FEM model with results obtained using various reference software tools [
27].
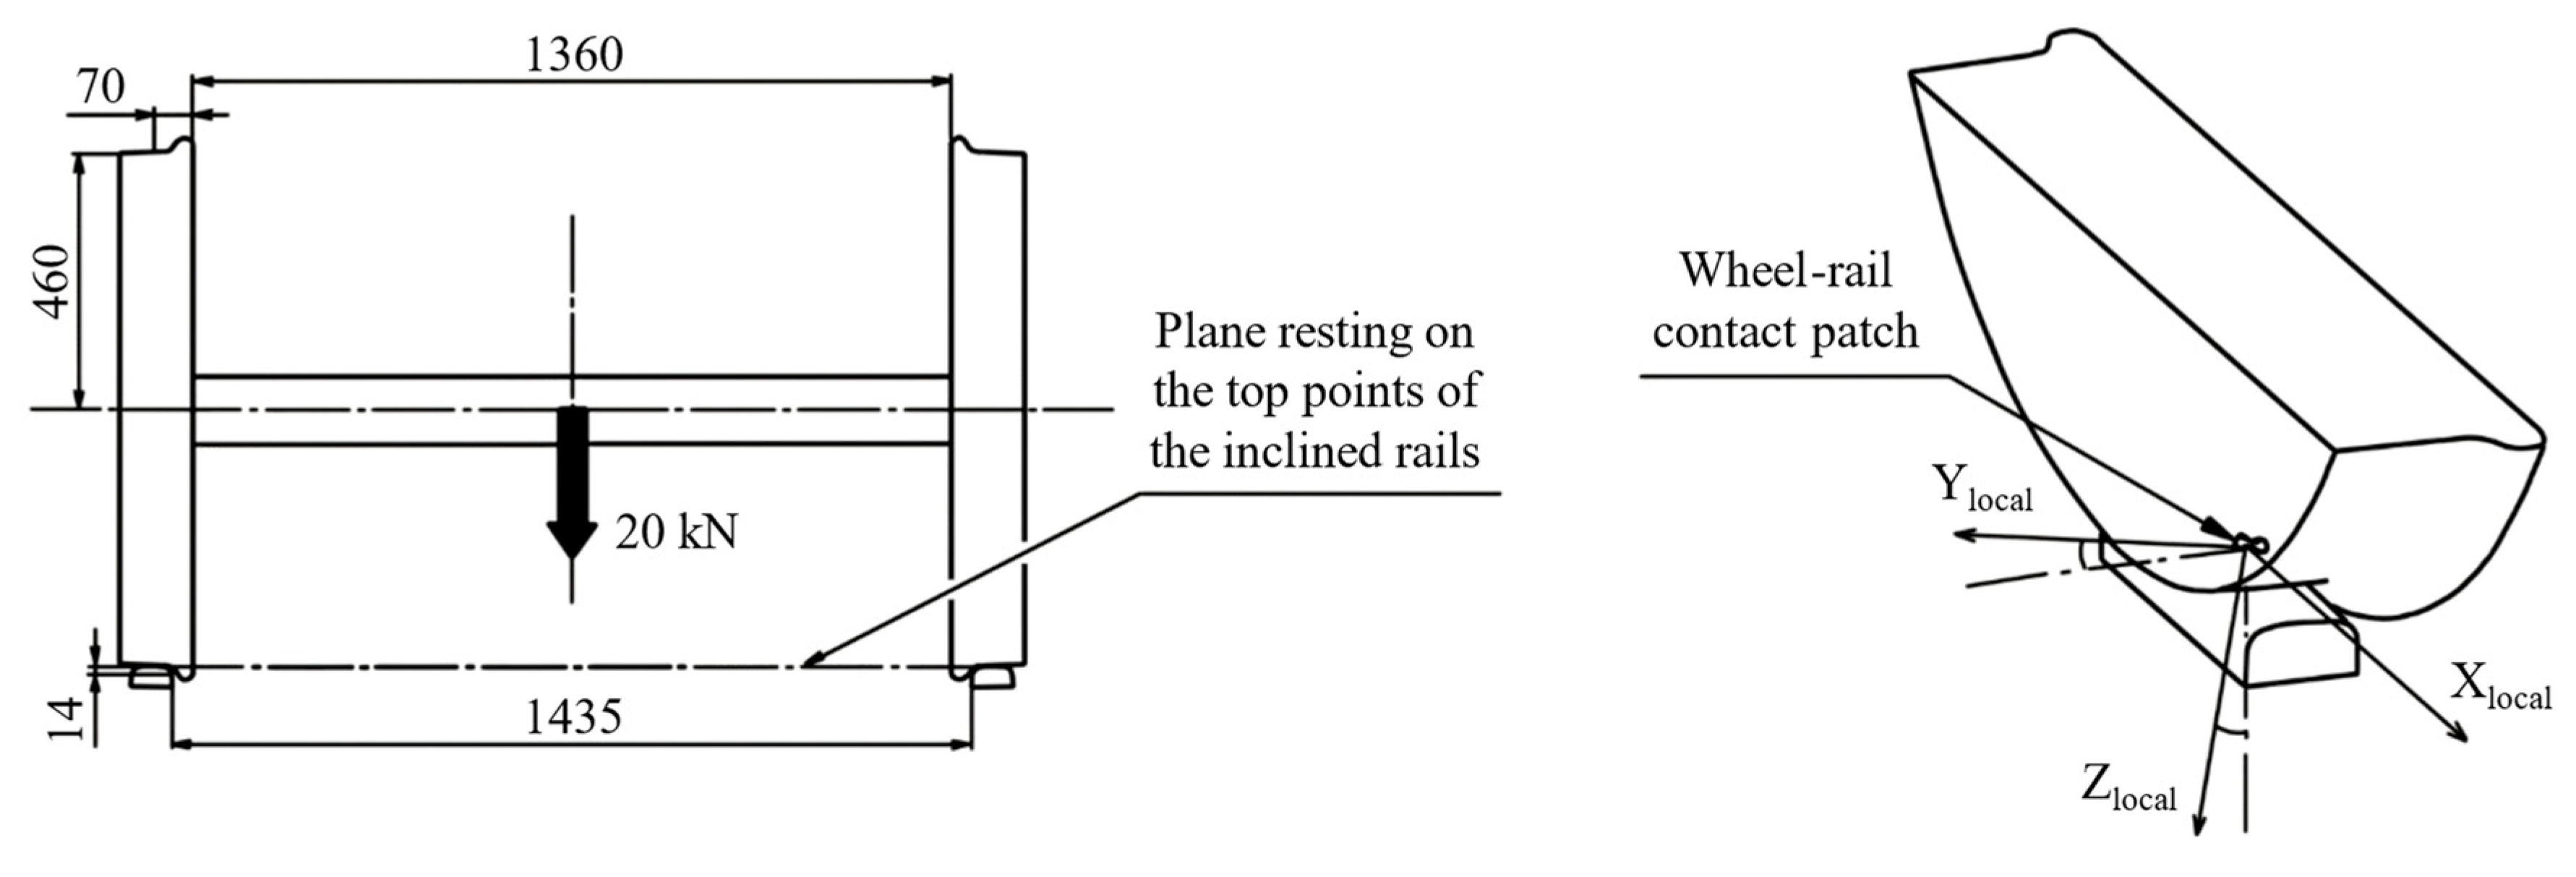
The wheelset model is illustrated in
Figure 9 (left), along with its nominal radius. The simulations use actual wheel profiles (S1002) and rail profiles (UIC60) with a 1:40 inclination. A friction coefficient of μ = 0.3, a vertical load of 20 kN, and a forward velocity of 2 m/s are considered.
The results are presented using a local coordinate system (
Figure 9, right), whose origin is located at the center of the wheel–rail contact patch and is tangent to the surfaces at that point.
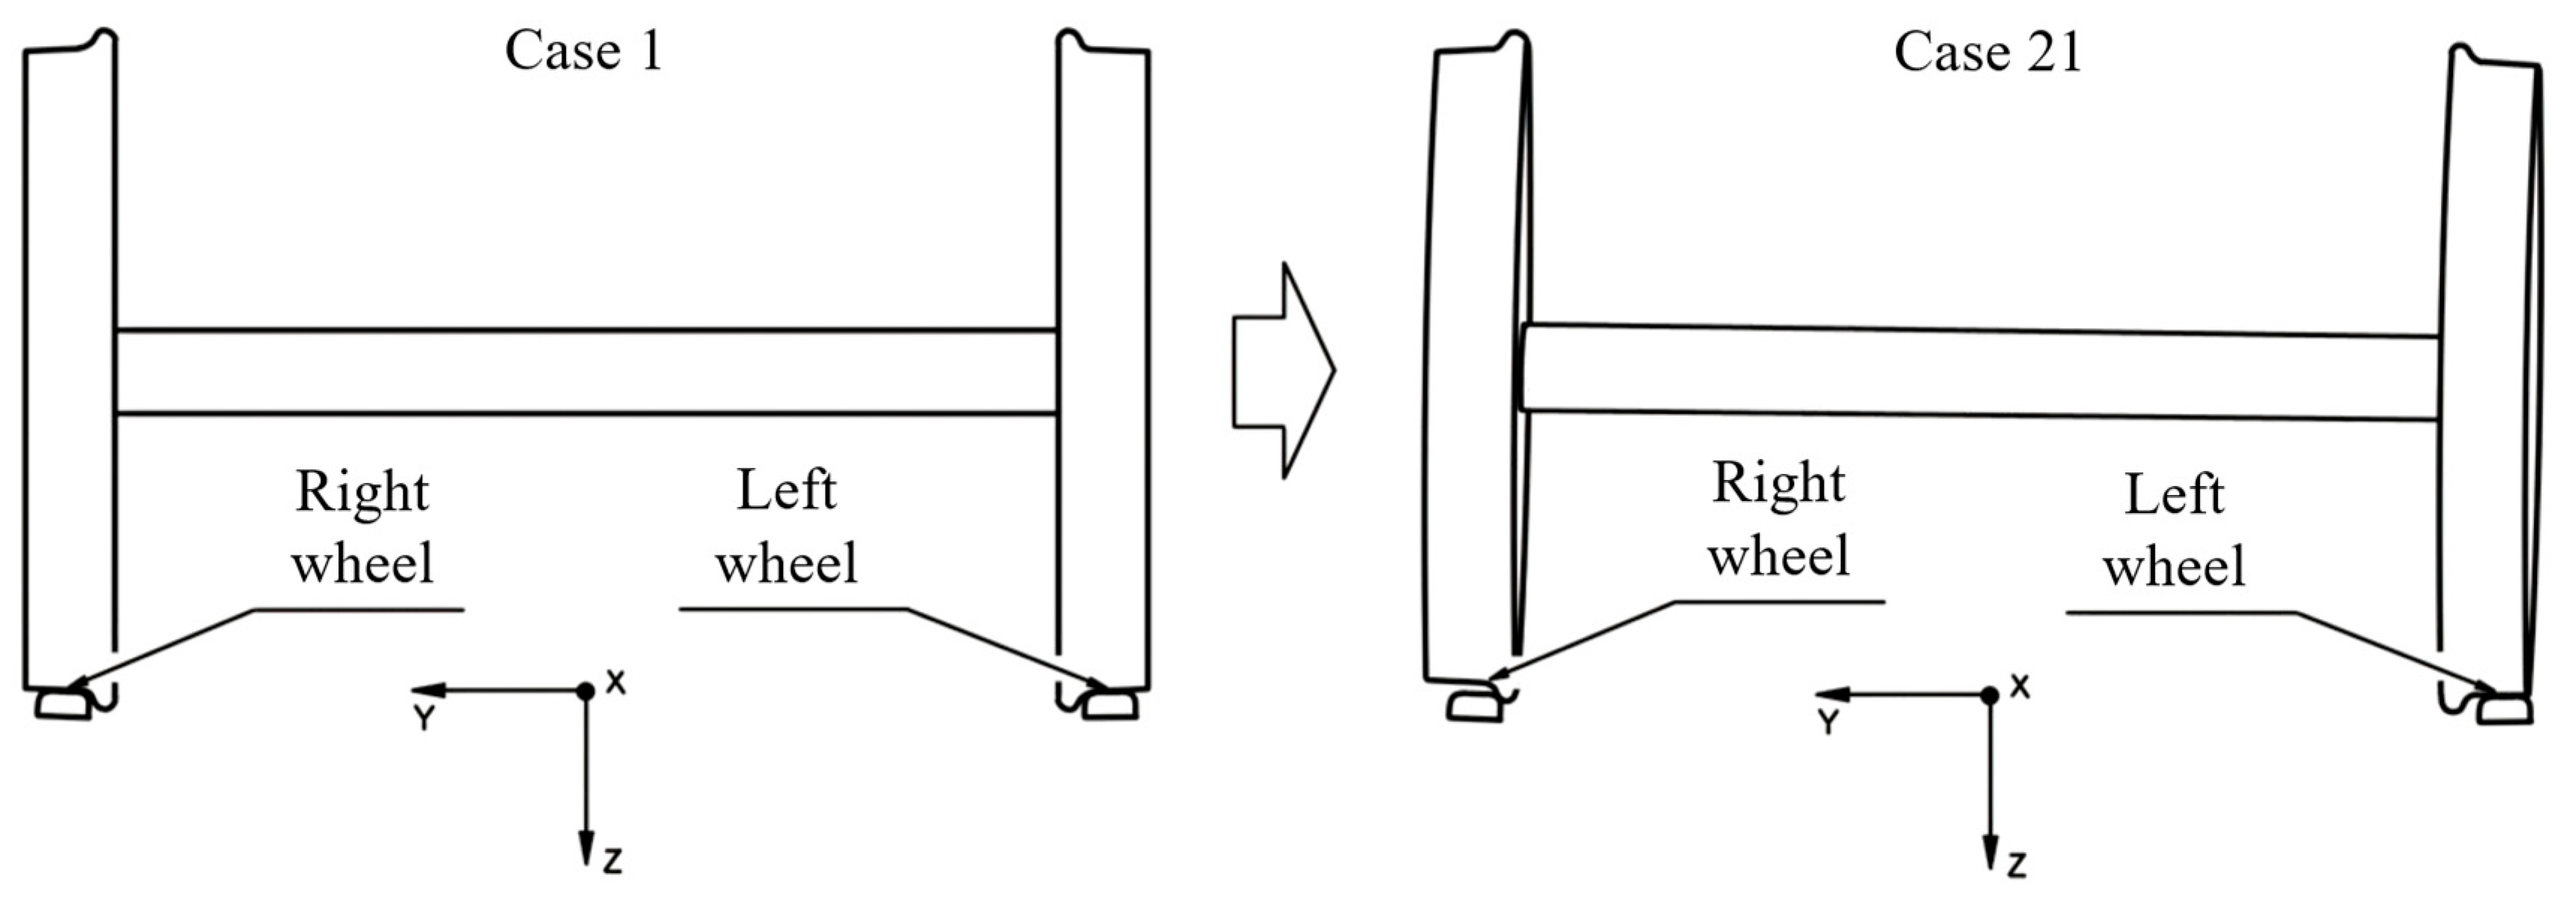
The lateral displacement varies from 0 to 10 mm (
Figure 10) in increments of 0.5 mm, while the yaw angle increases from 0 to 24 mrad in steps of 1.2 mrad (21 cases). In this study, only odd cases are analyzed (
Table 4).
The geometric and mechanical properties of the model are summarized in
Table 5.
The material law used was linear elastic, isotropic, and temperature-independent, excluding plasticity, damping, and thermal dependencies. This is consistent with the scope of elastic contact validation against CONTACT.
3.1. Solution of the Normal Contact Problem
This section presents the distribution of contact pressures and compares the results obtained using CONTACT and FEM, analyzing the differences between both methods and their impact on the accuracy of the simulation. All results presented in this section correspond to the last substep of the simulation, when the system has reached a stable state.
Table 6 provides a comparison between CONTACT and FEM in terms of contact patch dimensions and maximum contact pressure values.
The results show that both methods provide comparable values, with differences in the contact area below 2.3% and a variation in the maximum contact pressure of 0.1%. These discrepancies fall within the expected margins for nonlinear contact simulations and are consistent with the typical numerical approximations present in FEM and analytical contact models. The same trend is observed in tangential contact results, where slight variations in stick-slip zones, contact shear stresses, and slip distributions are expected due to methodological differences between FEM and CONTACT.
Figure 11 illustrates the distribution of contact pressure in the contact patch obtained with both models.
Figure 12 presents this distribution for the longitudinal section of the contact patch where the maximum contact pressure is located.
One of the most relevant aspects of this case study is the presence of two local maxima in the contact patch, a characteristic that does not occur in all configurations. In the area closest to the wheel flange (corresponding to negative values on the Y-axis), the values obtained with FEM tend to be slightly lower than those calculated with CONTACT, with 324.9 MPa in the first case and 328.2 MPa in the second, representing a variation of −1%.
In the region further from the flange (corresponding to positive Y-axis values), higher pressure values are observed in both models due to an increase in interface penetration. However, the maximum contact pressure values are nearly identical, with 338.7 MPa in the FEM model and 338.3 MPa in CONTACT, corresponding to a difference of 0.1%, as shown in
Table 6.
3.2. Solution of the Tangential Contact Problem
The tangential problem in wheel–rail contact is directly related to the transfer of forces, as well as the mechanisms of wear at the interface. In particular, the tangential interaction determines the stress distribution, the differentiated stick and slip zones, and the relative displacements between the contacting surfaces.
This section presents the results obtained for stick and slip zones, the distribution of contact shear stresses, and slips, comparing the FEM and CONTACT solutions.
3.2.1. Stick/Slip Zones
The FEM model predicts an adhesion area of 37.0 mm
2 compared with 37.7 mm
2 in CONTACT, corresponding to 1.9% relative error. Adhesion is concentrated at the front of the contact patch, while slip occurs toward the rear, in agreement with the expected rolling-contact behavior.
Figure 13 compares the FEM and CONTACT predictions, showing consistent partitioning of stick and slip zones across the patch.
One of the most critical factors contributing to the differences between FEM and CONTACT is that, in the FEM model, the solids elastically deform under the contact forces globally. This means that the contact shear stresses and pressures are distributed differently along the contact patch due to elastic deformation of the material. In CONTACT, solids are treated as rigid bodies (with a simplified local elasticity), which reduces the complexity of the contact problem. However, in FEM, the elastic deformation of the bodies results in a redistribution of forces as the geometries of the contacting surfaces adjust (
Section 2.1).
The observed differences in stick-slip zones follow the same pattern as those discussed in
Section 3.1, with deviations within the expected range for nonlinear contact models.
3.2.2. Contact Shear Stresses
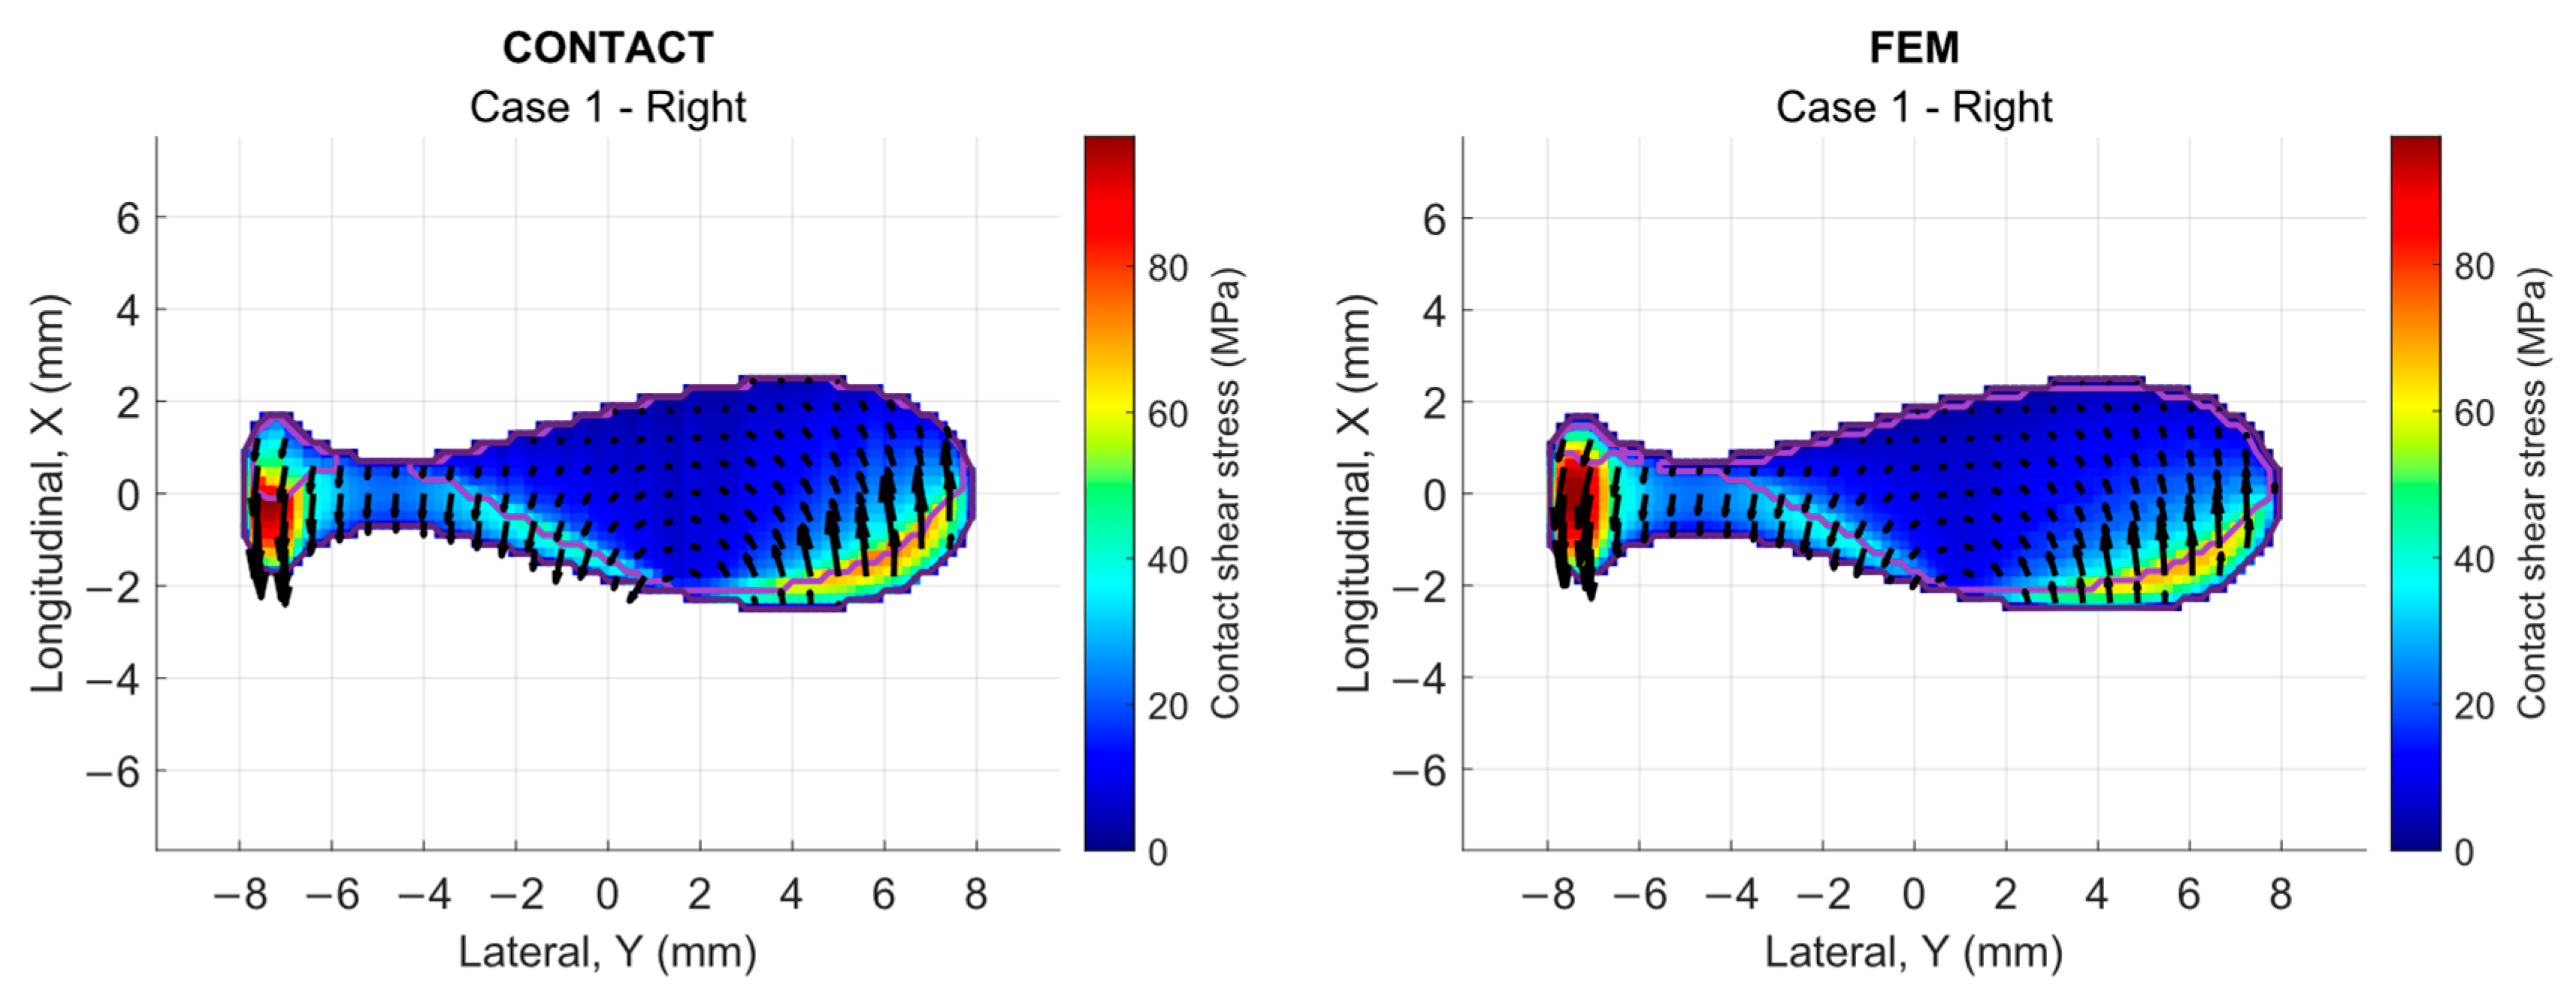
Figure 14 presents the CONTACT-FEM comparison of the contact shear stress distribution within the contact patch. It is observed that stress concentration tends to shift towards the rear section of the contact patch under rolling conditions.
The effect of spin is significant in the orientation of contact shear stress vectors, generating an asymmetric arrangement due to the wheel conicity. This asymmetry in the contact patch is reflected in the stress distribution, which exhibits different behaviors on the right and left sides of the contact patch with respect to the X-Z plane. This pattern is consistent with previous rolling contact studies, where spin plays a crucial role in stress distribution.
The vectors are arranged in a counterclockwise direction (for the case of right wheel contact), and their magnitude depends on the loading conditions and contact geometry, which aligns with the expected behavior in wheel–rail contact analysis. The comparison demonstrates a strong correlation in stress values between both methods, with a difference of less than −0.2% in maximum values (97.5 MPa in FEM vs. 97.7 MPa in CONTACT).
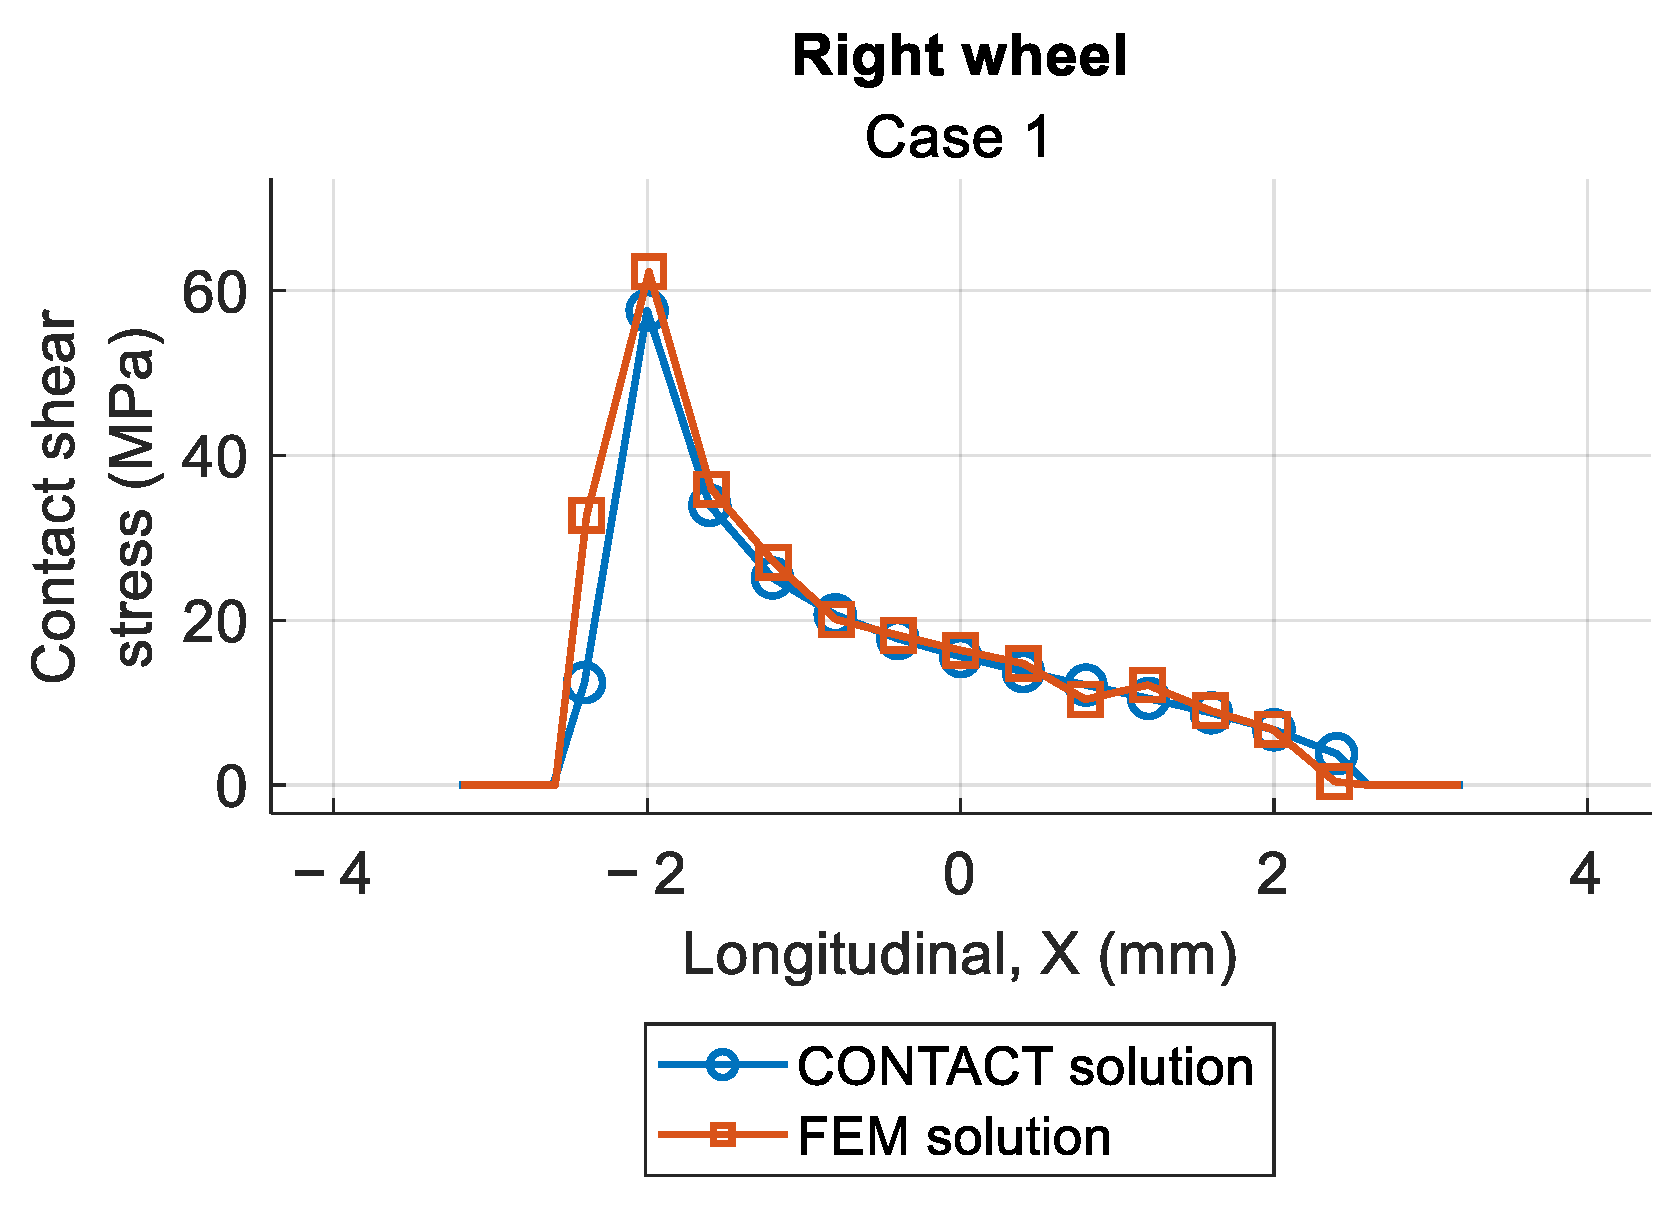
Figure 15 shows the comparison of contact shear stress values corresponding to the longitudinal section of the contact patch where the maximum contact pressure is located. The maximum possible value, corresponding to full slip conditions, is found at
. A good correlation is observed between CONTACT and FEM results.
3.2.3. Slip Distributions
Figure 16 presents the slip distribution obtained using FEM and its comparison with the results generated by CONTACT. The slip values can be cross-referenced with the graphs in the previous sections, where the stick-slip zones (
Figure 13,
Section 3.2.1) and contact shear stresses analyzed. As expected, zero slip values are observed in the stick region, while in areas where contact shear stresses are higher (
Figure 14,
Section 3.2.2), slip increases.
The comparison between FEM and CONTACT results reveals a significant correlation in both the magnitude and direction of slip vectors. This suggests that the FEM model provides consistent results in terms of spatial distribution and intensity of the slip phenomenon, with a maximum slip value of 0.18% for FEM and 0.16% for CONTACT.
Figure 17 shows the slip distribution along the longitudinal axis (X-axis) for the contact patch strip where the maximum contact pressure occurs, comparing both methods.
3.3. Resultant Forces
As discussed in
Section 3, the lateral displacements are adjusted in increments of 1 mm, while the yaw angles are modified in increments of 2.4 mrad [
26,
27]. The forces and moments obtained using the FEM model are compared with those from CONTACT, with all values referenced to the local coordinate system of the contact patch (
Figure 9, right).
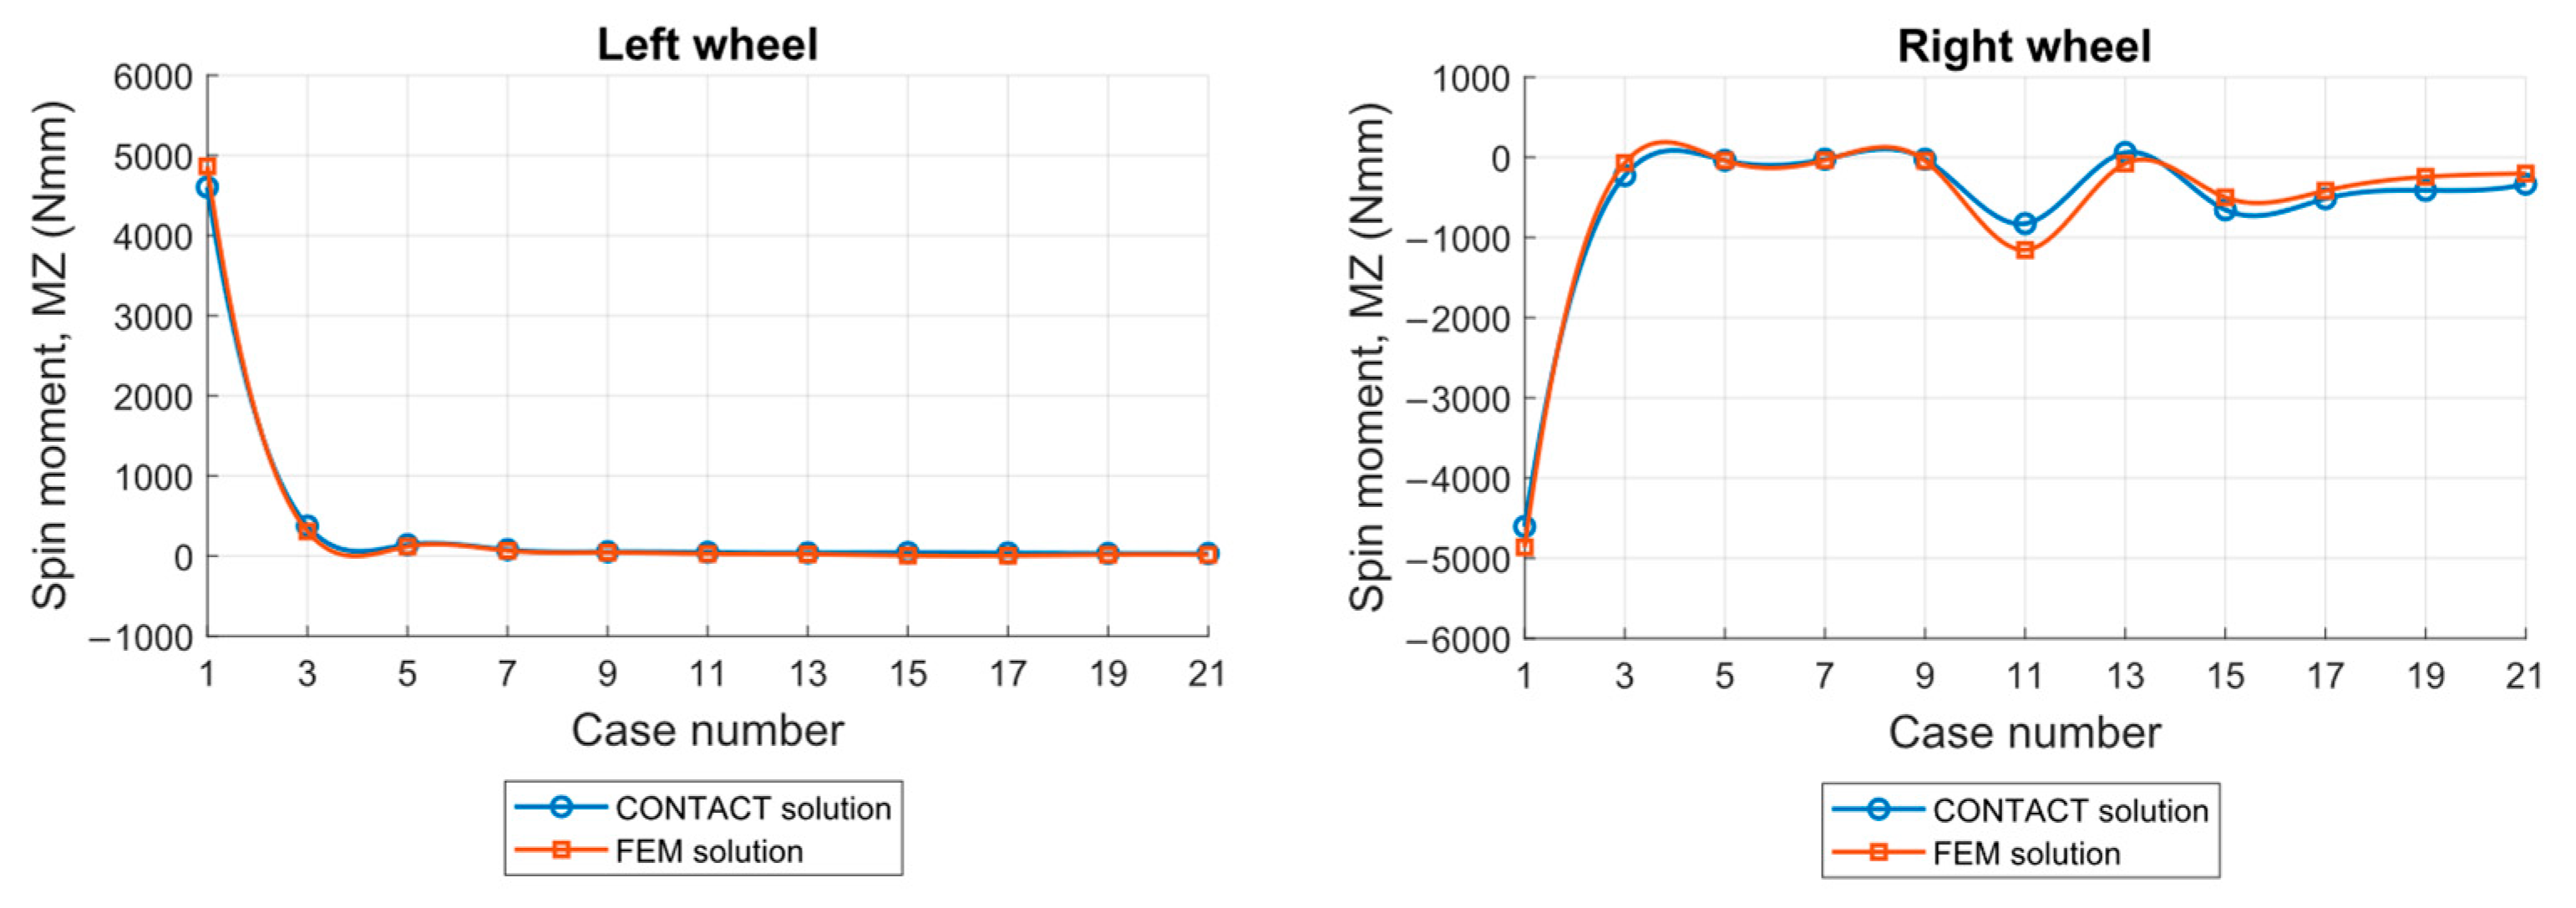
Figure 18 presents the longitudinal force values, obtained using Equation (5). The results show differences of less than 5.1% for contact in both wheels, with maximum differences occurring in Cases 3 and 11 (left and right wheels, respectively).
For lateral forces, obtained using Equation (6), the highest percentage variations occur in Cases 15 (left wheel) and 19 (right wheel), as shown in
Figure 19. These deviations occur primarily because the contact patch in these cases is positioned near the flange (right wheel). However, even in these conditions, for the left wheel, the error does not exceed 1.7%, while for the right wheel, the error remains below 4.3% in all cases.
The longitudinal and lateral (tangential) forces present the greatest level of complexity in terms of accuracy, which is associated with the formulation and mechanics of the tangential problem in this type of contact analysis (as mentioned in previous sections).
For the normal solution, obtained using Equation (7), all results exhibit a percentage error below 0.5% for the left wheel (
Figure 20). For the right wheel, errors remain below 3%, except in Cases 19 and 21, where the deviations are below 4.3%.
Figure 21 presents the comparison of spin moment results in the contact patch, obtained using Equation (8).
The analysis of all cases revealed a pattern: percentage errors tend to increase in later cases, especially in the right wheel contact. The differences between the FEM and CONTACT results in cases where contact is located on the wheel flange can be explained by differences in the assumptions and capabilities of both approaches.
Analytical models based on the elastic half-space theory rely on strict assumptions—such as homogeneity, isotropy, and a contact patch significantly smaller than the local radii of curvature—which are not valid in certain regions, especially near the wheel flange or gauge corner. In these areas, the curvature radii can be small, making the half-space assumption questionable [
10].
Comparative studies have shown that while half-space-based methods provide acceptable results under standard head contact conditions, they can lead to significant errors near the flange. In some cases, the estimated contact pressure may exceed expected values compared to FEM simulations [
8,
10]. FEM is not constrained by this assumption, allowing it to capture local contact characteristics more accurately, though at a higher computational cost and with potential numerical sensitivities.
Furthermore, FEM allows for the modeling of complex contact conditions, including phenomena beyond the reach of simplified analytical models [
36]. These capabilities are particularly relevant when analyzing stress distributions, adhesion–slip transitions, and energy dissipation near the flange area under lateral loading.
The full set of force and moment errors across all cases is reported in
Supplementary Tables S2 and S3, confirming stable agreement with CONTACT except in high-yaw, near-flange cases.
3.4. Wear Analysis
3.4.1. Qualitative Analysis
The distribution of contact shear stresses and slip zones enables the identification of critical wear areas in the wheel–rail interface. The highest stresses and slips are concentrated in the rear section of the contact patch, where dominant slip occurs, leading to greater energy dissipation and increased wear rates. Additionally, when the contact patch shifts toward the wheel flange, the local stress concentration rises due to the higher geometric curvature, further increasing wear in these regions.
3.4.2. Quantitative Analysis
The local implementation of the USFD model is performed by discretizing the contact patch into elements and computing the dissipated energy in each one based on the local contact shear stresses and relative slip obtained from the FEM model (
Figure 8), as explained in
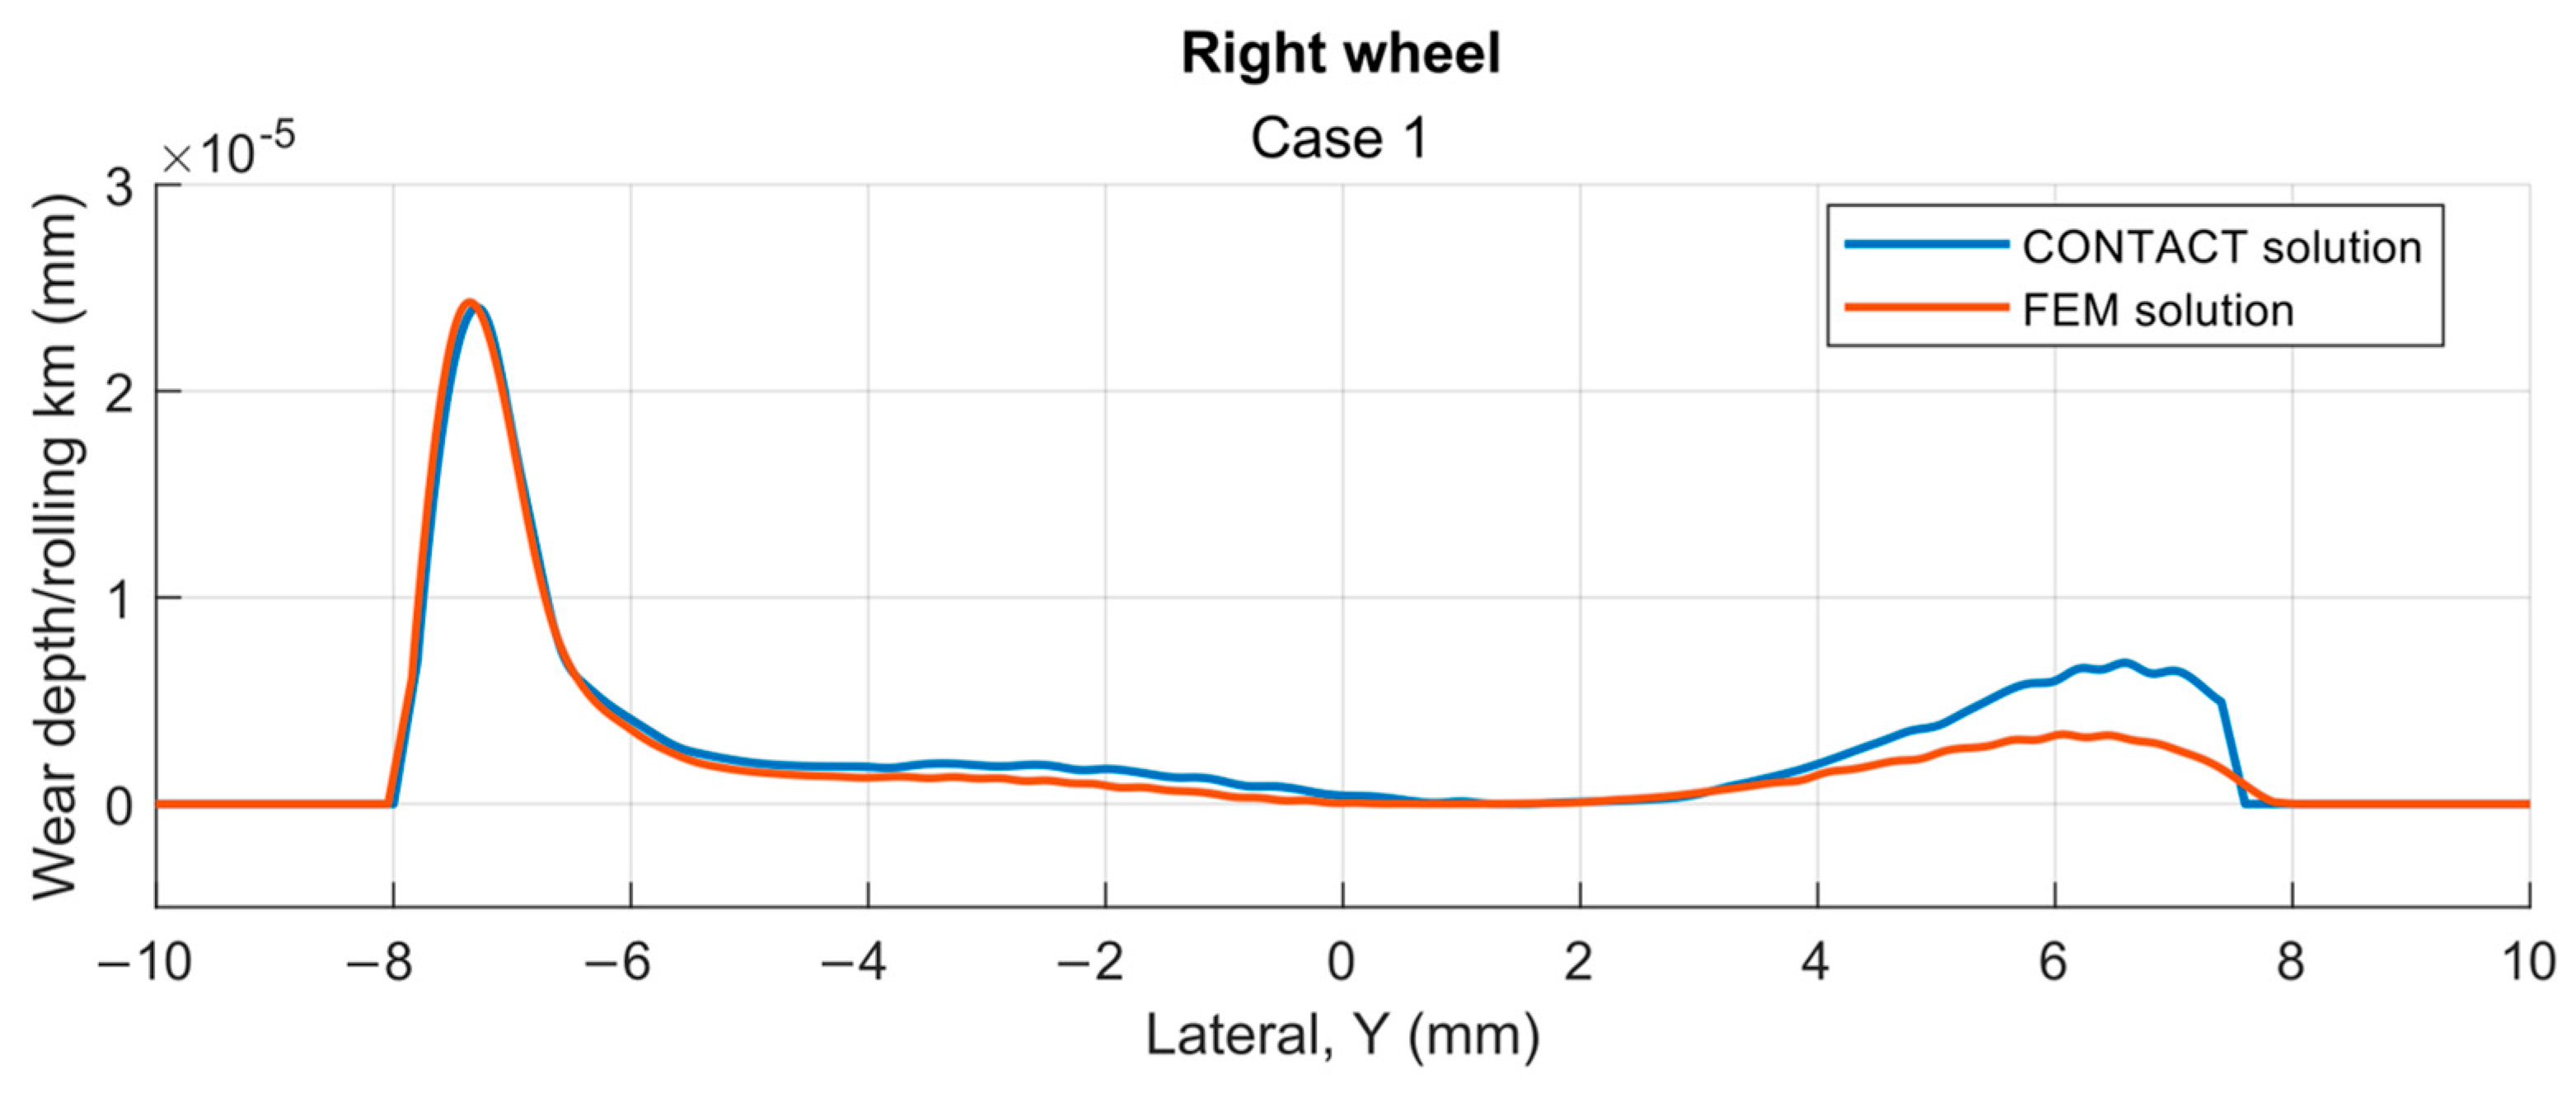
Section 2.4.4. However, it is important to note that the materials used in this study differ from those used in the original verification of the USFD model, which was designed for R8T and UIC60 900A steels. In this work, the mechanical properties were taken from the Manchester Contact Benchmark, which may introduce variations in the estimated wear rates, although this has no effect on the comparison between the two results, which is the purpose of this section.
Figure 22 presents the wear depth values calculated from the results obtained using the FEM and CONTACT for the contact patch of Case 1, right wheel.
For future studies, the implementation of modified versions of the USFD model tailored to the specific material properties employed in this study is planned, further refining the accuracy of wear estimation.
The quantitative accuracy of wear depth predictions is reported in
Supplementary Tables S6 and S7, showing MAE = 4.35 × 10
−4 mm/km and RMSE = 6.15 × 10
−4 mm/km.
It should be noted that while CONTACT is commonly applied to long-distance extrapolations (up to tens of kilometers), the present FEM simulations are restricted to a few wheel rotations. The validation presented here is therefore local in nature, focusing on contact stresses, slip distributions, and wear increments per rotation rather than long-term profile evolution.
4. Discussion
This study proposes a FEM that proves to be a robust tool for analyzing wheel–rail contact phenomena in detail, capturing effects that are not considered in analytical tools such as CONTACT. The model accurately reproduces contact pressure and contact shear stress, as well as the transition between stick and slip zones under rolling conditions, allowing a detailed analysis of the contact even in the wheel flange. Additionally, wear models can be easily applied from the primary model results, enabling accurate estimates of wheel and rail wear.
The use of a constant wear coefficient K, calibrated for R8T/UIC60 steels, limits the absolute predictive accuracy of wear in this study; however, since both FEM and CONTACT use the same K, the relative comparison remains valid. Similarly, the strictly elastic material law excludes plasticity and damping effects, which are relevant for long-term wear but outside the scope of the Manchester Benchmark.
The quasi-static implicit formulation employed provides a significant reduction in computational cost compared with transient FEM models, while preserving high accuracy. This makes the framework suitable for large parametric studies requiring multiple simulations. Verification against CONTACT confirms strong agreement: percentage differences in contact pressures, shear stresses, and resultant forces remain within acceptable ranges for nonlinear contact problems. Stick–slip partitions also match closely, with deviations of less than 1.9% in adhesion area across the studied cases.
Observed discrepancies stem from the inherent differences between FEM and CONTACT formulations. FEM explicitly represents the elastic deformation of solids, including three-dimensional and geometric effects such as surface curvature and local stress concentration. CONTACT, based on half-space theory, focuses on local interactions at the interface and does not include global structural deformation, but remains extremely efficient under such assumptions.
The largest deviations occur when the contact patch extends into the wheel flange, where curvature is high and the contact area is small. In such conditions, local stresses are amplified and differences between formulations become more evident. FEM can provide greater accuracy in representing these complex geometries.
During development, mesh refinement and solver strategies were optimized to balance accuracy and efficiency. The final setup achieves an average runtime of ~3 h per case on 20 cores (≈60 core-hours). Although this is more expensive than CONTACT, the combination of refined local meshing and solver parameter tuning reduced runtime by ~40% compared with a uniform fine mesh. This makes computational cost tractable for parametric sweeps and supports the intended application of the model to large design spaces.
The FEM approach becomes particularly advantageous in conditions that challenge half-space formulations, such as flange contact and high yaw angles, where local curvatures are small and stick–slip zones are highly nonlinear. Moreover, FEM naturally incorporates global structural deformation—critical for independently rotating wheelsets or coupled vehicle dynamics—and can be extended to elastoplastic laws and temperature-dependent friction models. These capabilities lie beyond the scope of CONTACT’s half-space theory.
As a first application, the model is being used to investigate wheel–rail contact in independently rotating wheelsets, as employed in Talgo trainsets. The framework enables parametric variation in toe and camber angles to evaluate their influence on wear and stability, with the ultimate goal of identifying optimum design values.
It should also be emphasized that the present quasi-static FEM framework is not intended to replace dynamic or thermomechanical FE approaches, which address complementary phenomena such as high-frequency vibrations or temperature-induced degradation. Instead, the proposed methodology is positioned as a computationally efficient tool for large parametric sweeps and IRW-oriented studies, providing accurate elastic contact predictions at a fraction of the cost required by more detailed dynamic or coupled thermo-mechanical analyses.
Future work will extend the methodology towards elastoplastic constitutive laws, calibrated wear coefficients, and profile update strategies, thereby enhancing predictive accuracy for long-term wear while retaining efficiency for large-scale parametric analyses.
5. Conclusions
This work developed and verified a quasi-static FEM framework for wheel–rail contact, systematically benchmarked against the reference software CONTACT. The model accurately reproduced contact pressures, shear stresses, force components, and stick–slip distributions over the 11 odd-numbered Manchester Benchmark cases (both wheels), with quantified errors (MAE and RMSE) within acceptable limits for nonlinear contact simulations.
The main contributions of this study can be summarized as follows: (i) the development of a quasi-static FEM framework that combines rigid–flexible domain partitioning, a frictionless preconditioning strategy, and automated slip-tolerance tuning, ensuring both accuracy and computational efficiency; (ii) comprehensive verification against CONTACT, including a statistical assessment of errors across normal and tangential variables; and (iii) the establishment of a parametrizable basis for future studies of independently rotating wheels (IRWs), in which geometric variables such as toe and camber angles can be systematically explored, with direct relevance to passive steering concepts in Talgo trainsets.
Limitations include the use of a constant wear coefficient K from literature and a strictly elastic material law, which restricts absolute wear prediction but preserves the validity of relative comparisons. Future work will extend the framework to elastoplastic constitutive laws, calibrated wear coefficients, and profile update strategies, thereby improving predictive accuracy for long-term wear while retaining computational efficiency.
