Article

Key Performance Indicators for Evaluating Electric Buses in Public Transport Operations

Faculty of Architecture, Civil Engineering and Transport Sciences, Széchenyi István University, Egyetem tér 1, 9026 Győr, Hungary
*
Author to whom correspondence should be addressed.
Vehicles 2025, 7(2), 58; https://doi.org/10.3390/vehicles7020058
Submission received: 21 April 2025 / Revised: 3 June 2025 / Accepted: 8 June 2025 / Published: 11 June 2025

Abstract

The evaluation of electric buses used in public transportation operations encompasses several critical factors that directly influence the operational efficiency, as well as the economic viability, environmental advantages, and user experience. Energy consumption is a critical metric for assessing the energy efficiency of electric buses. It facilitates a better understanding of vehicle performance across varying road conditions and advances the implementation of energy-saving solutions. The passenger demand model is a tool used to assess the quality and experience of electric buses, with the assessment being based on real usage. The operational mileage is defined as the driving distance of electric buses on a single charge. This parameter has a significant impact on both urban coverage and route optimization. The article under consideration identifies evaluation indicators for electric buses. These indicators are derived from a set of 100 questionnaire responses, which were collected in Győr, Hungary. The classification of the indicators into three segments—mechanical, operational and bus transportation system—is proposed, with the underlying rationale and significance of each indicator’s selection being elucidated. The findings indicate that this component is essential for developing a comprehensive evaluation system for electric buses and serves as a solid foundation for more intricate future studies.

1. Introduction

1.1. Backgrounds

Recent years have witnessed a significant population increase and the expansion of metropolitan limits, placing unprecedented strain on public transit systems. Conventional fuel buses meet the demands of extensive passenger service, yet their substantial carbon emissions and air pollution are a growing concern. In response to these challenges, many nations and municipalities are increasingly implementing green and sustainable public transportation solutions, leading to the rising significance of electric buses.
Several governments have set pollution reduction targets or enacted purchase subsidies and tax incentives to promote the proliferation of electric buses. The EU has established aggressive objectives to decrease CO2 emissions from heavy-duty vehicles, including electric buses. Emissions from newly registered vehicles must decrease by 45% by 2030, 65% by 2035, and 90% by 2040 [1]. In 2023, electric bus sales in the EU’s 27 member states reached 5200 units [2], with anticipated additional expansion. The sales value can be found in Figure 1.
Evaluating the operating performance of electric buses necessitates a thorough analysis of several industrial requirements. Initially, it is essential to thoroughly integrate the operational attributes of buses, including frequent acceleration and deceleration, fixed-route operation, and prolonged high-load working conditions. The design and performance of electric buses should satisfy the requirements for frequent acceleration, deceleration, and energy consumption across various operational situations to guarantee reliable and stable performance. Secondly, to guarantee that the vehicle’s performance aligns with operational requirements, it is essential to assess the adequacy of the power output, range, and battery life for the specific demands of the bus routes, while also optimizing the vehicle performance in adverse weather conditions or challenging terrain.
The evaluation system’s design must embody the attributes of the public transportation sector, particularly in enhancing service quality. For instance, in addressing the requirements of urban inhabitants, emphasis should be placed on vehicular comfort, minimal noise levels, and passenger safety.
This research aims to provide a comprehensive assessment framework for the key performance indicators (KPIs) for electric buses using a questionnaire survey. The study will define and classify the KPIs throughout three dimensions: mechanical, operational, and transportation systems, with the objective of supplying data to assess the energy efficiency, service quality, and operational efficacy of electric buses. The approach will assist policymakers in optimizing electric bus deployment, augmenting passenger contentment, and enhancing the sustainability of urban mobility.

1.2. Research Gap

Most of the current studies concentrate on passenger cars, such as assessing vehicle safety depending on crash tests or estimating vehicle pollution in real-world use by means of real-world road tests. In the domain of electric buses, while pertinent testing standards are established, they are highly specialized, and the quantification of their outcomes is not sufficiently clear. Passengers or operators cannot distinctly ascertain their requirements using specialized data.
Buses also have specific safety and performance evaluations, and certain regions impose mandatory standards for particular vehicle functions. For the vehicle’s operator, these reports, despite being highly specialized, frequently lack the perspective of the driver and passengers. The acceleration of one meter per second is challenging to correlate with the actual riding experience.
The objective of this study is based on three-month walk-through research with passengers and bus drivers, based on 100 questionnaires. This enables the operator to comprehend the inclinations of passengers towards various bus types. The basic methodology will be strengthened by analyzing the impact indicators in three areas: mechanical, operational, and transport system. It will identify the main factors considered by passengers when choosing a bus for travelling and the feedback from the driver’s evaluation. Research on passengers and drivers is an effective method for quantifying demand. The purpose of identifying specific fundamental indicators in this manner is to significantly streamline the vehicle selection process, making it more intuitive.

2. Existing Evaluation Indicators and Methods for Electric Buses

2.1. Recent Standards for Electric Buses

With the increase in electric car numbers, numerous studies on the performance evaluation metrics and methodologies for electric vehicles have emerged. The European Union establishes explicit criteria for evaluating the power and energy usage of electric buses, mostly based on the E-SORT standard created by the International Association of Public Transport (UITP). This standard enhances the conventional SORT (Standardized On-Road Test Cycles) and is employed to assess the energy consumption and range of electric and plug-in hybrid buses [3]. China’s testing standards for electric bus dynamics mostly reference GB/T 18385-2024, which outlines the test methods for the power performance of electric vehicles. The standard has revised the test content and methodologies in recent years, highlighting the scientific and practical aspects of the assessment and its representation of the vehicle’s actual performance, including the maximum velocity, acceleration, and peak climbing capability, among others [4]. Alongside certain aforementioned hardware indicators pertaining to the vehicle itself, contemporary assessment techniques emphasize the battery, energy efficiency, and cost-effectiveness. These standards serve as useful references for vehicle engineering, particularly for original equipment manufacturers (OEMs). The actual buyer of a vehicle will rarely utilize these criteria as a foundation for their purchase. A profound understanding of these standards necessitates a specific degree of expertise in engineering.
Zhiming Gao and his team [5] linked the success of electric buses to how well they perform, how reliable urban bus services are, the size of the batteries, and the charging systems, showing that using different battery types and flexible battery replacement methods can lead to significant benefits for electric buses. Hussein Basma et al. [6]. introduced a battery sizing approach predicated on an exhaustive energy demand evaluation of battery electric buses (BEBs) and determined that urban bus batteries are excessively large to support a generally minor percentage of trips during infrequent extreme cold weather events. Jwa et al. [7] evaluated different electric bus models against diesel buses to assess their life-cycle environmental implications, concluding that lithium BEBs excel in energy consumption and emissions, although they still have challenges with regard to trip efficiency. Their analysis overlooked the potential variability in real-world driving conditions, and the persistent issues surrounding trip efficiency signal unresolved operational challenges for electric fleets.

2.2. Recent Research Methods

Several integrated evaluation approaches exist. Kiciński [8] used Kraków as a case study to elucidate the benefits of employing the multi-criteria decision aid/development (MCDA/MCDM) methodology in relation to the urban public transport system, addressing various factors, including travel durations and standards, fleet usage efficiency, environmental sustainability, system integration, and safety. To enhance the efficacy and appeal of metropolitan public transit networks, Cocron et al. [9] delineated the evaluation parameters into four domains: safety aid systems, comfort, convenience, and economics. A scalable cloud model was utilized to build an evaluation methodology for the indication system of electric buses. By using MCDA approaches, Rivero Gutiérrez [10] assisted public transportation managers in determining the appropriate bus types for their fleets, considering economic, environmental, and social sustainability criteria. Furthermore, the research addressed the knowledge deficiency concerning the social sustainability aspect, in addition to the economic and environmental dimensions.
Mustafa Hamurcu [11] introduced an MCDM framework employing the analytic hierarchy process (AHP) and the technique for order of preference by similarity to ideal solution (TOPSIS) regarding electric buses in central Ankara, demonstrating that electric buses surpass other kinds. These integrated approaches provide valuable decision-support tools, yet they often rely on simplified assumptions or rigid structures that may not fully capture the dynamic and context-dependent nature of urban transit planning.
Most of the aforementioned perspectives are derived from experts or operators, neglecting the assessment criteria of various stakeholders, including drivers, passengers, maintenance staff, and urban planners. Passengers prioritize punctuality and comfort, drivers focus on maneuverability and safety, while maintenance professionals emphasize ease of maintenance. Questionnaire-based key performance indicators (KPIs) can effectively address the aforementioned deficiencies.

2.3. Research on Efficiency and Cost

As one of the most important indicators, energy efficiency is the fundamental research domain for evaluating electric buses in public transport systems. Charbel Mansour et al. [12] suggested a modeling approach to evaluate the energy consumption of electric buses, assessing the impact of various driving and weather circumstances, as well as passenger loads, on energy consumption. Sven Borén [13] of Sweden created the newly developed model and implemented it on an electric bus operating on route 1 in Karlskrona as a representative case. Electric buses provide substantial savings in social and overall ownership costs compared to diesel and biogas buses, mostly due to less noise, zero emissions during operation, and lower energy consumption. Marc Gallet et al. [14] provided an energy demand model for electric buses utilizing a real-world dataset, exemplified by Singapore, with applicability to extensive transit networks. Their findings indicate that the prevailing operational conditions result in the non-uniform size of the energy demand.
In terms of cost-effectiveness, Marek Potkány [15] employed a life-cycle cost analysis to assess the probability of acquiring support for electric compared to diesel buses, determining this disparity to be 22%, the requisite threshold for co-financing by governmental entities, local authorities, or EU Structural Funds, while considering varying cost structures and the time value of money. Antti Lajunen [16] created a specific modeling program to thoroughly assess electric buses, demonstrating that the substantial energy capacity of the on-board batteries is essential for buses charged overnight and that the life-cycle costs of electric buses are significantly affected by capital expenditures. Barraza et al. [17] delineated a continuum-approximation-based methodology for the design of an efficient transit network utilizing battery-electric buses inside an urban grid-like road system. The total cost, emissions, and performance of the bus are evaluated against various fuel-powered systems to suggest an alternate bus configuration. Both studies contribute useful modeling techniques for planning operations but potentially limit the applicability of their conclusions under variable demand patterns.

3. Indicators for Analyzing the Operational and Technical Characteristics of Electric Buses

The indicators for assessing electric buses in public transportation are intrinsically multifaceted and might significantly differ based on the accepted perspective. The various dimensions emphasize the intricacy of assessing electric buses and show the necessity of choosing indicators that correspond to particular analytical objectives. This part examines a collection of indicators for operational performance and is designed to represent the operational and technical specifications. Some deficiencies of electric buses exist within public transport systems. This customized method facilitates a more cohesive and contextual evaluation, considering prospective advancements in technology and policy. This serves as a foundation for formulating the questions in the questionnaire.

3.1. Operational Characteristics of Electric Buses

Urban public transportation services are fundamentally characterized by their public welfare component and are generally managed and regulated by local governments to ensure conformity with extensive urban planning and the needs of residents. Bus services are provided in several formats, including normal route buses, bus rapid transit (BRT), community buses, and customized buses, to meet the varying transportation needs of individuals and circumstances. The public transportation system must simultaneously balance efficiency and equity, striving to improve operational effectiveness while guaranteeing equitable access to essential transit services for all regions and demographics.
As urbanization accelerates, the importance of public transport services in improving traffic efficiency, alleviating road congestion, and mitigating environmental pollution has grown increasingly crucial [18]. In the realm of promoting green mobility, the emergence of new eco-friendly vehicles, including fully electric buses and hydrogen-powered buses, has significantly advanced the sustainable growth of bus services. Such progress not only underscores the significance that contemporary cities attribute to energy conservation and environmental stewardship but also affords urban dwellers a more comfortable and eco-friendly travel experience. The peculiarities of the bus service and the operating environment impose certain performance requirements on bus vehicles, which arise directly from the unique attributes of the bus system as a fundamental urban public utility.

3.1.1. Safety Requirements

The safety of urban bus passengers is a vital component of public safety; nevertheless, transportation operations must adhere to financial limitations. Therefore, it is essential to guarantee the safety of public transport vehicles, steering clear of types that present considerable safety hazards or are susceptible to frequent accidents. This provides immediate protection for passenger safety and property while also being essential for sustaining social stability and the urban traffic order. The safety criteria for public transit vehicles include multiple components. The vehicle design and production must strictly comply with national and industry technical safety standards, including the UNECE R107 [19] Bus Safety Code and European Union vehicle technology management regulations, to guarantee the vehicle’s essential safety framework and performance from the beginning. The bodywork must be impact-resistant, and the passenger compartment should be designed with escape routes and fire suppression systems to manage emergencies.
The safety of the electrical system in electric buses is an essential aspect of urban transportation. The high-voltage battery system is an essential component of electric buses and complies with rigorous safety standards [20]. Thermal runaway safety for high-voltage batteries necessitates materials with superior thermal stability and an advanced battery management system (BMS) to continuously monitor parameters such as the temperature, voltage, and current. Upon identifying an anomaly, the BMS promptly implements actions such as cooling and power disconnection to avert the escalation and intensification of thermal runaway [21].
Preventing short circuits is a crucial aspect of electrical system design. Buses must possess high-quality electrical connectors and insulating materials to guarantee optimal electrical performance in conditions of vibration, wetness, and other challenging environments. The electrical system must incorporate many safety devices, such as fuses, circuit breakers, and disconnect switches, to avoid a localized circuit failure causing a system-wide failure. ECE R100 [22] “Electric Vehicle Safety Requirements” and GB/T 18384 [23] “Electric Vehicle Safety Requirements” both delineate the criteria for the aforementioned safety indicators.

3.1.2. Reliability Requirements

Public transportation vehicles must provide daily services according to the stated timetable, without interruption or arbitrary alterations. Consequently, it is imperative to choose automobiles characterized by outstanding reliability and robust adaptability to external conditions [24], while eschewing those susceptible to frequent failures. This criterion is intimately linked to the operational efficiency of metropolitan public transportation networks and the passenger travel experience, serving as a crucial assurance of the quality of public transportation services.
The remarkable dependability of public transit vehicles is evidenced by their ability to operate in all-weather situations. Vehicles must operate dependably in many weather conditions, and such behavior requires advanced temperature management systems, weather-resistant materials, and corrosion-resistant designs to prevent performance degradation due to climate change or extreme conditions. In this case, the vehicle maintains reliable performance with regular use [25]. Given the elevated labor intensity and substantial passenger capacity of urban buses, essential components such as the power system, chassis, and body construction must exhibit superior durability and reliability. Vehicles that frequently malfunction adversely affect transit services, resulting in disruptions to passenger journeys, heightened operational costs, and a decline in public confidence in the transportation system.
Vehicle manufacturers and operators must collaborate closely throughout the process of development, production, selection, and routine maintenance to ensure that public transportation vehicles consistently deliver high-quality service under varying operational conditions [26]. This serves as a fundamental assurance of the reliability of public transportation services and demonstrates a comprehensive consideration of urban inhabitants’ requirements for convenient and safe travel.

3.1.3. Economic Requirements

The bus service, as a public benefit initiative, requires government subsidies to sustain regular operations and production activities, thereby alleviating financial burdens, and hence a high level of economic efficiency. For public transportation companies, the operational power and maintenance costs of vehicles are critical factors that directly influence economic efficiency [27,28]. In the operation of electric buses, the power costs represent a significant expense; therefore, energy usage is very crucial. Vehicles must possess efficient power conversion capabilities by enhancing the power system and optimizing energy management tactics to maximize the range and minimize the energy consumption per unit distance.
The government may help operators in selecting more cost-effective vehicles by providing policy-level incentives. Subsidizing battery expenses and advancing the establishment of charging infrastructure can alleviate the economic burden on bus companies [28]. Then, by advancing energy-efficient technology and enhancing operational strategies, including intelligent scheduling and dynamic route planning, the bus utilization rate can be elevated and the unit service costs diminished.

3.1.4. Environmental Requirements

Public transportation functions as the principal mode of sustainable mobility. As an essential element of urban public transit, they bear substantial societal responsibilities, including energy conservation [29], improvement of energy efficiency, and reduction of pollutants. Buses significantly reduce the per capita energy consumption and carbon emissions via efficient centralized passenger transit, demonstrating greater environmental advantages than private vehicles.
Different types of buses are perpetually refined for energy efficiency and environmental sustainability in their design and operation. For example, promoting the use of electric buses has become an important initiative in major cities. These methods efficiently diminish the use of conventional fossil fuels, concurrently lowering tailpipe emissions and noise pollution, so markedly enhancing urban air quality. When buses undergo technological enhancements [30], they diminish energy consumption and enhance service quality via optimized route planning, increased operational efficiency, and superior utilization of charging infrastructure. The advancement of electric buses is essential for environmentally friendly and low-carbon growth, and their ongoing enhancement will significantly contribute to the establishment of green cities and the achievement of sustainable development objectives.

3.1.5. Convenience and Comfort

In order to guarantee complete accessibility for a variety of demographic groups, such as the elderly, individuals with impaired mobility, expectant women, and individuals with substantial luggage, buses must be constructed as a critical element of urban transportation.
  • Low-floor design [31]: minimizing obstacles to boarding and disembarking.
The elevation of the bus floor significantly influences the ease with which people embark and disembark. The low-floor design significantly reduces the difficulties and time required for passengers to board and alight from the bus, enhancing the operational efficiency. In the EU, low-floor buses are gaining popularity due to their self-retracting pedals that lengthen upon arrival at the station, thereby improving accessibility for passengers with impaired mobility. This design enhances the accessibility of public transit for elderly individuals and those with impairments.
  • Seamless and tranquil journey: improved comfort.
The vehicle’s smoothness and noise regulation are essential for passenger comfort during transit [32]. Buses must be outfitted with sophisticated suspension technologies, such as airbag or electromagnetic suspension, to efficiently absorb vibrations from irregular road surfaces and reduce ride discomfort. Aside from the requirements listed above, buses must also be made easier to turn and move around, so that sudden stops and turns do not bother customers. It is also important to have a quiet place inside. When it comes to decreasing noise, electric buses are a big plus. The drivetrain operates more quietly than internal combustion engines. The drivetrain has been optimized, reducing the noise and vibrations from moving components. These attributes provide a tranquil and pleasant environment for individuals who are traveling.

3.2. Analysis of the Technical Specifications of Electric Buses

An evaluation of electric bus performance must account for the operational characteristics of the public transport sector, as well as the technical attributes of electric vehicles, emphasizing both their advantages and the shortcomings associated with electric technology through problem analysis.
Electric vehicles are becoming more significant in the modern automobile market as a result of their improved efficiency, environmental sustainability, and reduced pollution in comparison to internal combustion engine vehicles. Batteries and electric motors are the primary energy sources in completely electric vehicles. The performance benefits and operational characteristics of these vehicles are determined by the primary power source, the electric drive control system, despite the fact that their chassis, body, and auxiliary components bear a striking resemblance to traditional vehicles.

3.2.1. High Efficiency

The technology of internal combustion engines has reached a high level of maturity after considerable progress. Nonetheless, the energy conversion efficiency of the internal combustion engine, as demonstrated by the diesel engine, is only about 42%. In reality, especially in buses that function at low speeds and often start and stop in urban settings throughout the year, the energy loss is markedly intensified, resulting in an overall energy conversion efficiency of under 35%. A significant fraction of the fuel energy consumption is dissipated as heat and other losses, hindering its efficient conversion into mechanical energy for vehicle propulsion. The conventional internal combustion engine is wholly dependent on “chemical energy”, whereas electric vehicles employ a more efficient energy conversion process, specifically the conversion from “chemical energy to electrical energy to mechanical energy.”
This conversion pathway offers numerous benefits. This could offer several benefits [33]: firstly, electric vehicles eliminate the idling losses associated with internal combustion engines during stops; and secondly, during braking, the vehicle can convert a portion of its kinetic energy into electrical energy via the energy recovery system for later utilization. In addition, the energy efficiency of electric vehicles is markedly enhanced, with their ultimate energy conversion efficiency exceeding 80%.

3.2.2. Better Performance in Acceleration

A major difference between electric vehicles and traditional internal combustion engine vehicles is that the torque output characteristics of the powertrain are intricately connected to the vehicle’s acceleration potential. The primary advantage of electric motors is their ability to deliver maximal starting torque immediately upon activation, granting completely electric vehicles significant acceleration capability in the initial phases. The vehicle’s ability to react quickly to slight pedal pressure enables a smooth and speedy acceleration experience. This trait is especially vital for situations necessitating swift integration into traffic, starting at traffic signals, and frequent accelerations and decelerations on urban routes, hence enhancing the driving efficiency.
On the other hand, vehicles with traditional internal combustion engines have slow acceleration since they rely on the engine speed to gradually produce more torque and power. At low rpm, the internal combustion engine produces very little torque, which causes the engine to take longer to gain speed than its power peak [34]. To enhance the performance, several internal combustion engine models integrate turbochargers or are calibrated for increased low-speed torque, while others optimize the gearbox ratios to accommodate frequent acceleration and deceleration.
The power output of electric vehicles, regardless of employing a single-speed gearbox or an efficient multi-gear electric drive system, is marked by enhanced linearity and smoothness. This is especially relevant in situations such as hill starts, rapid overtaking, and track starts.

3.2.3. Advantageous Low-Velocity Performance Criterion

The major purpose of buses is centered on metropolitan areas with significant passenger density, making their operational features tightly linked to the urban traffic environment. In congested urban thoroughfares, traffic congestion is frequently unavoidable, and the establishment of bus lines in these regions can improve the traffic flow and significantly redistribute urban traffic, acting as a crucial approach to alleviating the congestion issue. The operational environment influences the bus’s performance: the vehicle generally functions at modest speeds, necessitating intermittent acceleration and deceleration to accommodate road conditions and facilitate passenger boarding and alighting. Buses are required to stop at certain stations along their route, and the activities of passengers boarding and alighting increase the frequency of stops and starts. The frequent patterns of acceleration, deceleration, and halting impose distinct requirements on vehicle performance. Under low-speed conditions, buses require excellent power responsiveness and a smooth ride to navigate effectively through intricate urban traffic while ensuring passenger comfort.
The low-speed and frequent start/stop conditions present a greater challenge to the energy efficiency, emission reduction capacity, and durability of buses. Conventional internal combustion engine vehicles typically have diminished thermal efficiency and increased pollutant emissions at lower speeds, but electric buses often attain an efficiency of over 90%. These cars can fully utilize the high efficiency and zero-emission advantages of electric power at low speeds, significantly reducing the environmental impact. To effectively manage frequent start/stop scenarios, the transmission and braking systems of buses must exhibit exceptional durability and efficiency, as demonstrated by the adoption of technology for recovering brake energy that captures and stores energy from deceleration for later use during acceleration, thereby improving the energy efficiency.

3.2.4. Wading Skills

Adverse weather conditions, including precipitation and snowfall, can impose heightened demands on bus performance, particularly when urban routes become inundated following rains. Buses must not only maintain regular operation but also guarantee the safety of passengers and vehicles. The vehicle must possess robust possibility and stability, enabling it to go safely across wet road portions of less than 30 cm.
  • Water-resistant capability
The chassis and electrical system of the vehicle are the most susceptible components when traversing flooded roads; therefore, the bus must enhance its waterproof capabilities in the design. The chassis must be fabricated from waterproof materials or receive specialized protective treatment, while essential components like battery packs, controllers, and wiring interfaces should have a high level of protection (IP67 or higher is recommended). The vehicle must have sufficient ground clearance to avert water intrusion into the compartment or damage to critical components while navigating a wet route. Pneumatic suspension systems, such as those produced by WABCO, are currently widely utilized in various vehicles for chassis elevation and depression.
  • Tire efficacy and optimal braking
The brake system must exhibit robust water resistance and rapid response capacity, using technologies such as an anti-lock brake system (ABS) and electronic brake-force distribution (EBD) to enhance the safety and handling stability on wet surfaces [35].
  • Cognitive surveillance and security
Some versions may incorporate an intelligent monitoring system that assesses the depth of standing water in real time, notifying drivers to navigate safely or suggesting an alternative path. Additionally, emergency methods may be instituted to swiftly disable critical electrical systems, especially in cases of significant water accumulation, to avert further damage.

3.2.5. Environmental Benefits

The environmental benefits of electric vehicles are apparent not only in their “zero emissions” during operation but also in their significant potential for emissions reduction during their entire life cycle. Electric vehicles operate exclusively on electric power, have no tailpipe emissions, and do not release pollutants harmful to the environment and human health, such as carbon dioxide (CO2), nitrogen oxides (NOx), or particulate matter (PM2.5).
The engine and exhaust system generate considerable noise during operation, while electric vehicles provide a quieter atmosphere for urban inhabitants due to their practically silent motors that produce minimal operational noise. This function is essential during nighttime or in heavily populated residential areas, greatly reducing the irritation and stress caused by road noise.

3.3. Technological Deficiency

In addition to the aforementioned benefits, electric buses have certain technical deficiencies that have a clear adverse effect on the service quality and operational efficiency.

3.3.1. Lower Range

Electric buses have a significantly shorter operational range than traditional fuel-powered buses owing to the battery technology limits, weather conditions, and performance deterioration over time. Diesel buses have a range of 700–1000 km, whilst electric buses usually have a range of 300–500 km. Despite significant advancements in contemporary battery technology, it remains challenging to completely surmount the following obstacles.
The lithium-ion batteries employed in fully electric buses exhibit considerable temperature sensitivity. Lithium iron phosphate and lithium manganese acid batteries have optimal performance at ambient temperature (25 °C). At lower temperatures, the battery’s ohmic and polarization internal resistances significantly rise, leading to the reduced efficiency of the chemical reaction within the battery, which directly affects the usable capacity and vehicle range. Research data indicates that the useful capacity of the Li-FePO4 battery at 10 °C and −20 °C diminished to 62.6% and 57.8% of its nominal capacity [36], respectively, but the usable capacity of the Li-Mn2O4 battery at −10 °C and −20 °C declined to 83.1% and 58.2%.
As the service life of lithium-ion batteries increases, their performance will unavoidably decline after many charge/discharges cycles. The main causes of this phenomenon are that lithium ions become entrenched in the battery’s anode material throughout the charging and discharging process and are unable to be reintroduced into the cycle system, resulting in a reduction in active lithium ions. The positive and negative electrode materials will eventually suffer structural changes or surface passivation processes, lowering the battery’s capacity. With long-term battery use, the electrolyte may break down owing to high temperatures, overcharging, and other causes, increasing the battery’s internal resistance and reducing performance.

3.3.2. Longer Charging Time

Unlike gasoline-powered buses, which can be refueled in a matter of minutes, charging solely electric buses takes a considerable amount of time, affecting the vehicles’ operational efficiency and time cost. With DC high-power fast charging, a single charge typically takes 20 to 50 min; with standard charging, it takes much longer. For example, the BYD KUD3 model has a charge capacity of 300–350 kWh and takes approximately 45 min to charge from SOC 5% to 80% using a 300 kW DC charging gun.
At the operational level, an increase in the charge duration immediately leads to an extended vehicle dwell time at stations, affecting vehicle scheduling and the overall operational efficiency. In high-traffic locations, such delays may trigger a chain reaction, requiring more non-operational time for vehicle charging, which could lead to decreased service frequency on specific routes, affecting the passenger experience. Depression abates to offset the reduced running time due to single-car charging, and public transportation operators may need to increase their vehicle investment, thus raising procurement and operations costs.
While fast-charging technology can mitigate the issue of prolonged charging durations to a certain degree, it remains subject to certain limits. The charging power of each station is distributed, prolonging the charging duration. This may hinder the timely departure of vehicles, and prolonged reliance on fast charging can expedite lithium battery degradation, thereby reducing the battery lifespan and elevating the replacement costs.
Considering the bus operation features and the technical details of electric buses, the main evaluation criteria for electric buses can be grouped into three types: mechanical indicators, operational indicators, and indicators of bus transportation systems.

4. Development of an Evaluation Indicator System for Electric Buses in Public Transportation

4.1. Principles for Constructing the Indicator System

To develop a comprehensive, scientific, and functional evaluation indicator system for electric buses, it is essential to adhere to specific fundamental principles, grounded in a thorough analysis of the operational traits of public transportation and the technical at-tributes of electric vehicles. The indicator system must possess a distinct hierarchical structure, exhibit logical rigor, and demonstrate high compatibility with the real construction objectives and industry growth plans [37].
Principle of standardization: The terms and technical specifications of the indicators must be clear, consistent, and adhere completely to EU standards and pertinent industry norms. All the data sources must be authoritative and precise, while the procedures for data processing and computation should adhere to scientific rigor to guarantee the reliability and validity of the evaluation outcomes. Standardized terminology can mitigate the comprehension bias and enhance the communication efficacy; uniform parameter definitions and data-processing techniques can guarantee the consistency and comparability of the evaluation outcomes across various entities (e.g., transportation management agencies, operating companies, and research institutions).
Principle of comparability: The evaluation index system is employed to identify models with superior operational performance, so the indicators must be comparable. Without standardized criteria and comparable dimension indicators, properly assessing whether modes are more energy-efficient, cost-effective, or user-satisfactory is challenging. The performance of electric buses, being a nascent means of transportation, is considerably influenced by environmental factors like the temperature, road conditions, and load. A dynamic assessment method that allows longitudinal comparisons can elucidate the system’s true performance throughout varying operational phases or policy modifications.
Principle of practicality: To guarantee the functionality of the indicator system in actual management, the structure must remain uncomplicated and the hierarchy explicit. The indicators need to be comprehensible, and the calculation methodology should be straightforward and pragmatic to enhance the usability and offer more effective support and guidance for public transit operators and industry authorities. If the assessment system becomes overly complicated or if the data-collecting requirements are unacceptable, successfully implementing it in real life can be challenging. Therefore, when formulating the indicators, comprehensive attention must be focused on balancing implementation costs with managerial competencies. Replication and repetition should be eliminated within the structure, defining a standardized assessment tool that is replicable and expandable to improve the overall operational efficiency and technical standards of the industry.
The development of an indicator evaluation system for electric bus indicators has to conform to the three fundamental concepts of standardization, comparability, and practicality, as well as to achieve a balance between theoretical standards and practical applicability. The evaluation system may actually facilitate the ongoing improvement and high-quality advancement of electric bus systems when the indications are scientifically robust, comparatively efficient, and user-friendly.

4.2. Development of Evaluation Indicators

A structured questionnaire was created to identify the indicators for electric bus systems, drawing from a comprehensive review of the current literature, technical papers, and operational case studies pertaining to electric mobility. The questionnaire concentrated on three primary categories of the bus transportation system: system-level planning, vehicle-level technical specifications, and operational and user-related aspects. These categories constituted the foundation for the organization of the questions and the subsequent analysis. The questions were formulated in multiple-choice and open-ended formats, facilitating both quantitative and qualitative insights.
The questionnaire was evaluated by three experts from academia and industry specializing in electric mobility and urban transportation. Pilot research with 10 participants was executed to assess the clarity, logical organization, and content validity. In response to the input, multiple elements were amended to guarantee a user-friendly and cohesive structure.
The design of the questionnaire conformed to certain guiding principles:
  • Clarity and accessibility: The questions were expressed in clear language and organized into coherent sections to minimize response fatigue.
  • The survey’s content validity was confirmed by its basis in the existing literature on passenger satisfaction, environmental behavior, and transit service assessment, thereby encompassing all the critical domains.
  • User-centric insight: Various factors pertaining to subjective views on electric buses (for example, ride comfort, noise levels, and air conditioning effectiveness) cannot be easily evaluated through technical analysis alone.
  • The scalability of data: The incorporation of both closed-ended and open-ended questions enabled the acquisition of quantitative and qualitative data.
The survey was divided into four sections:
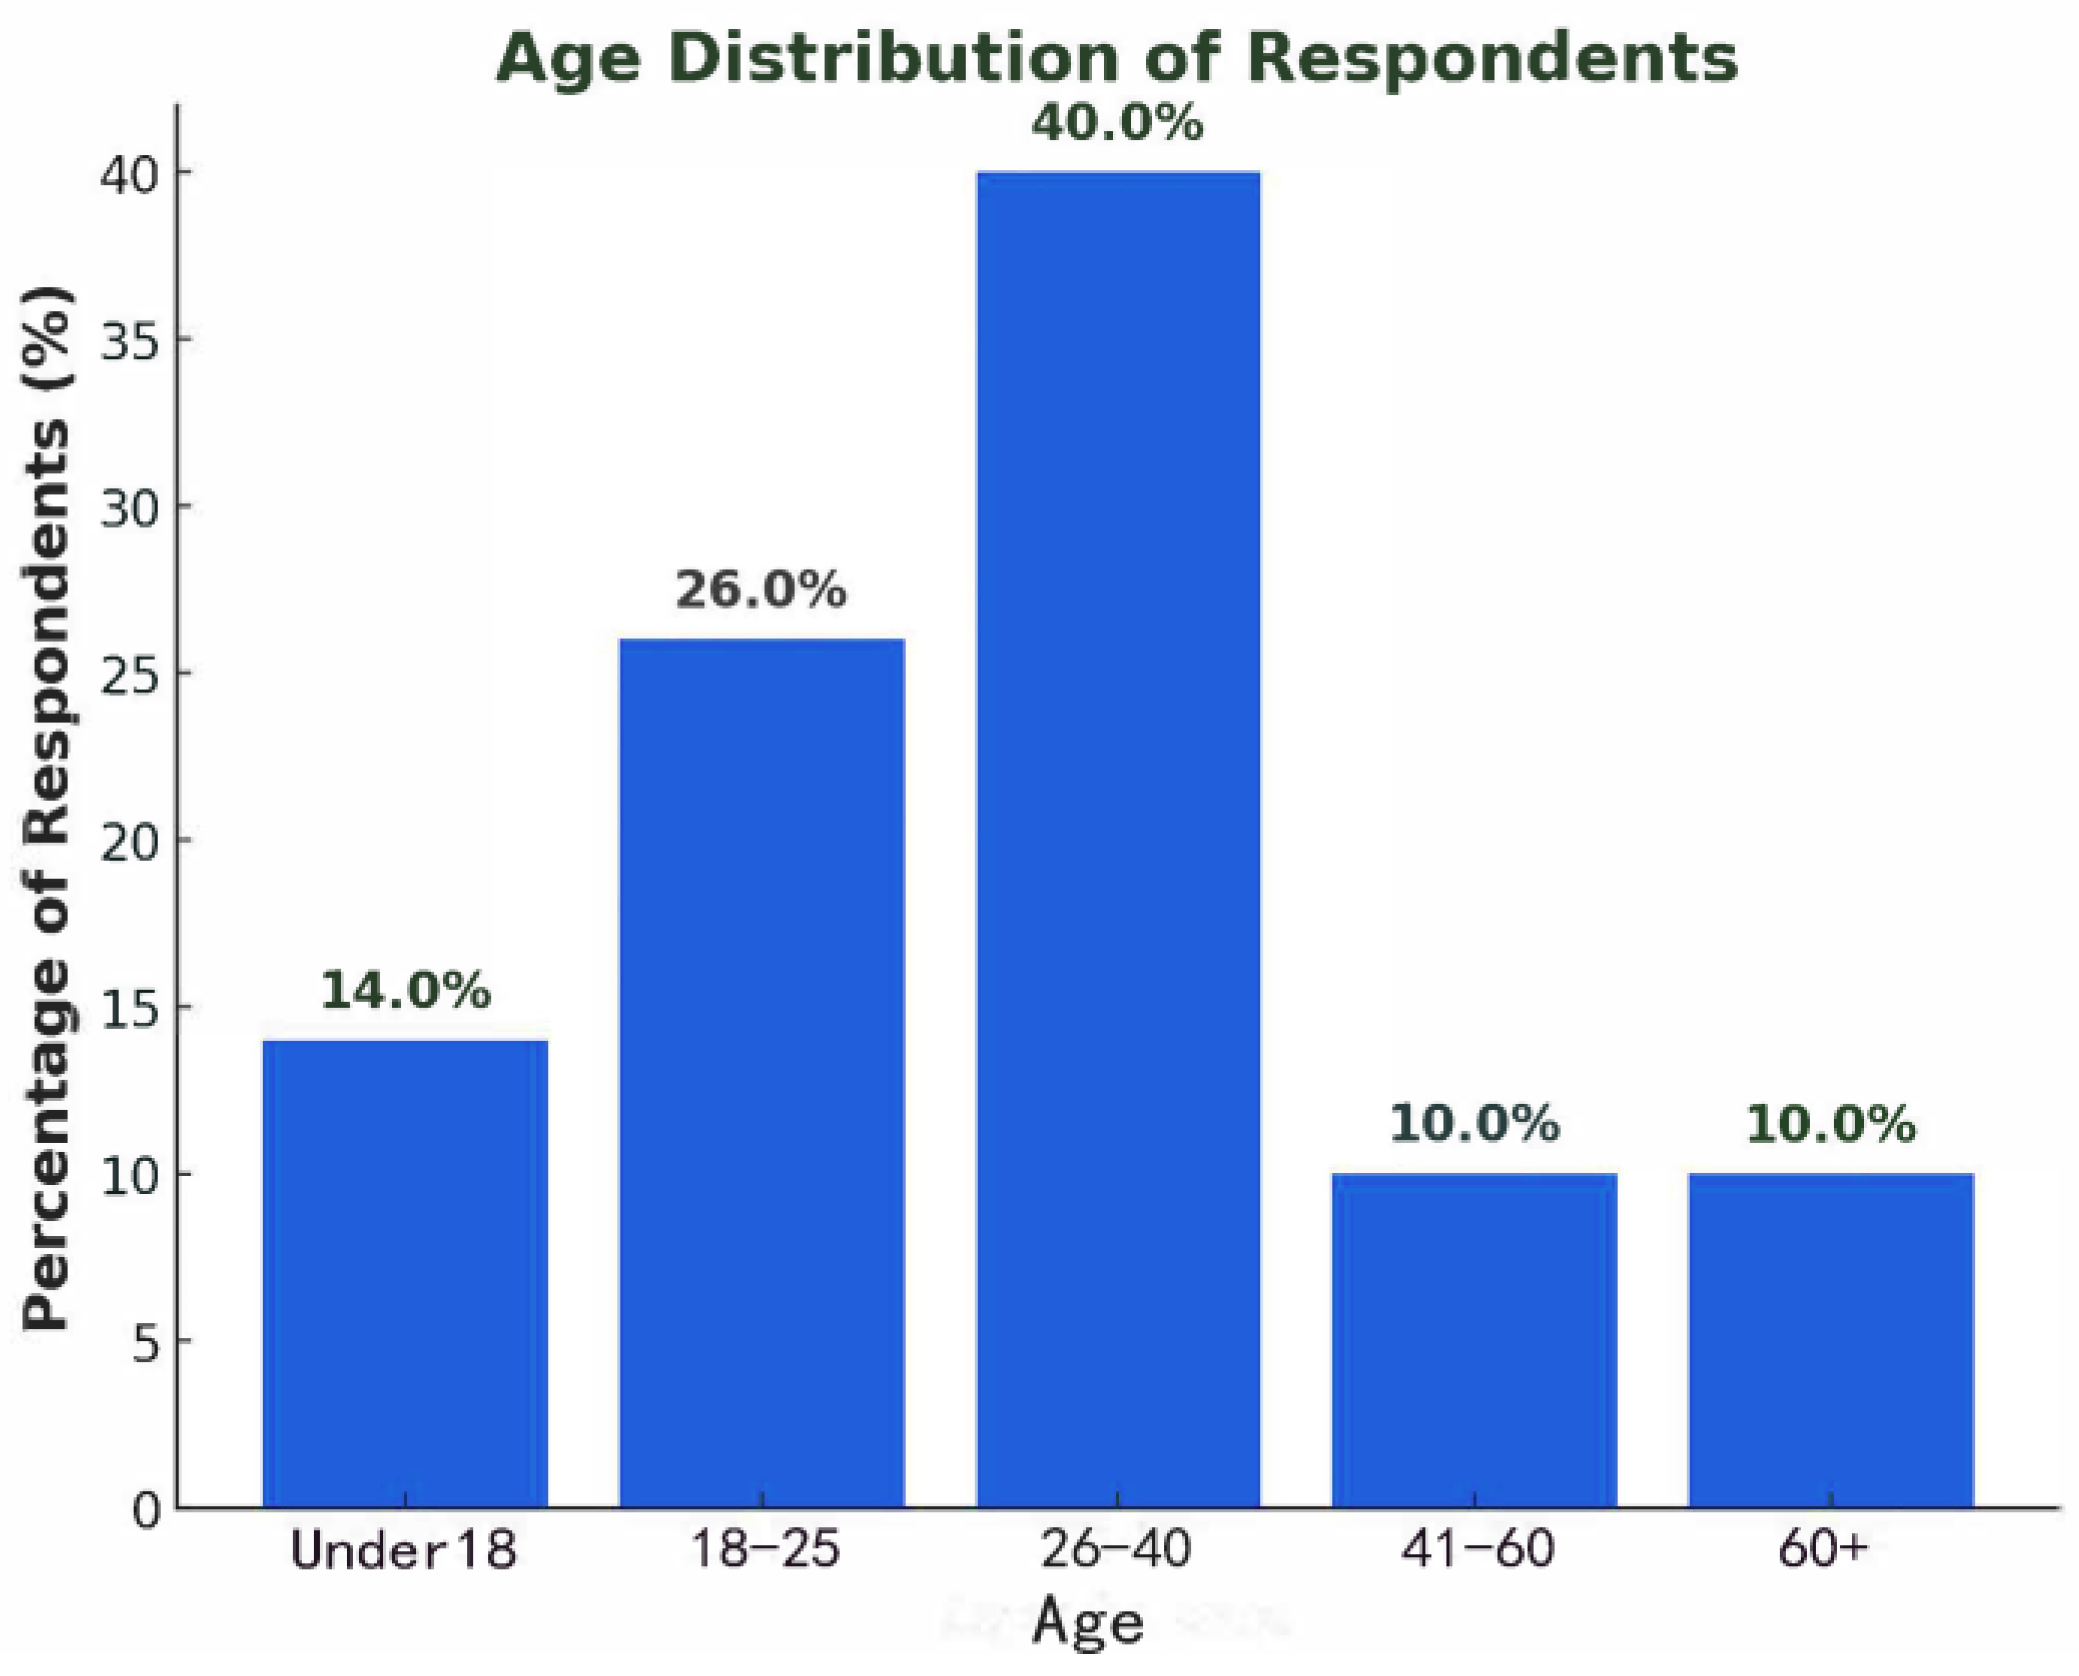
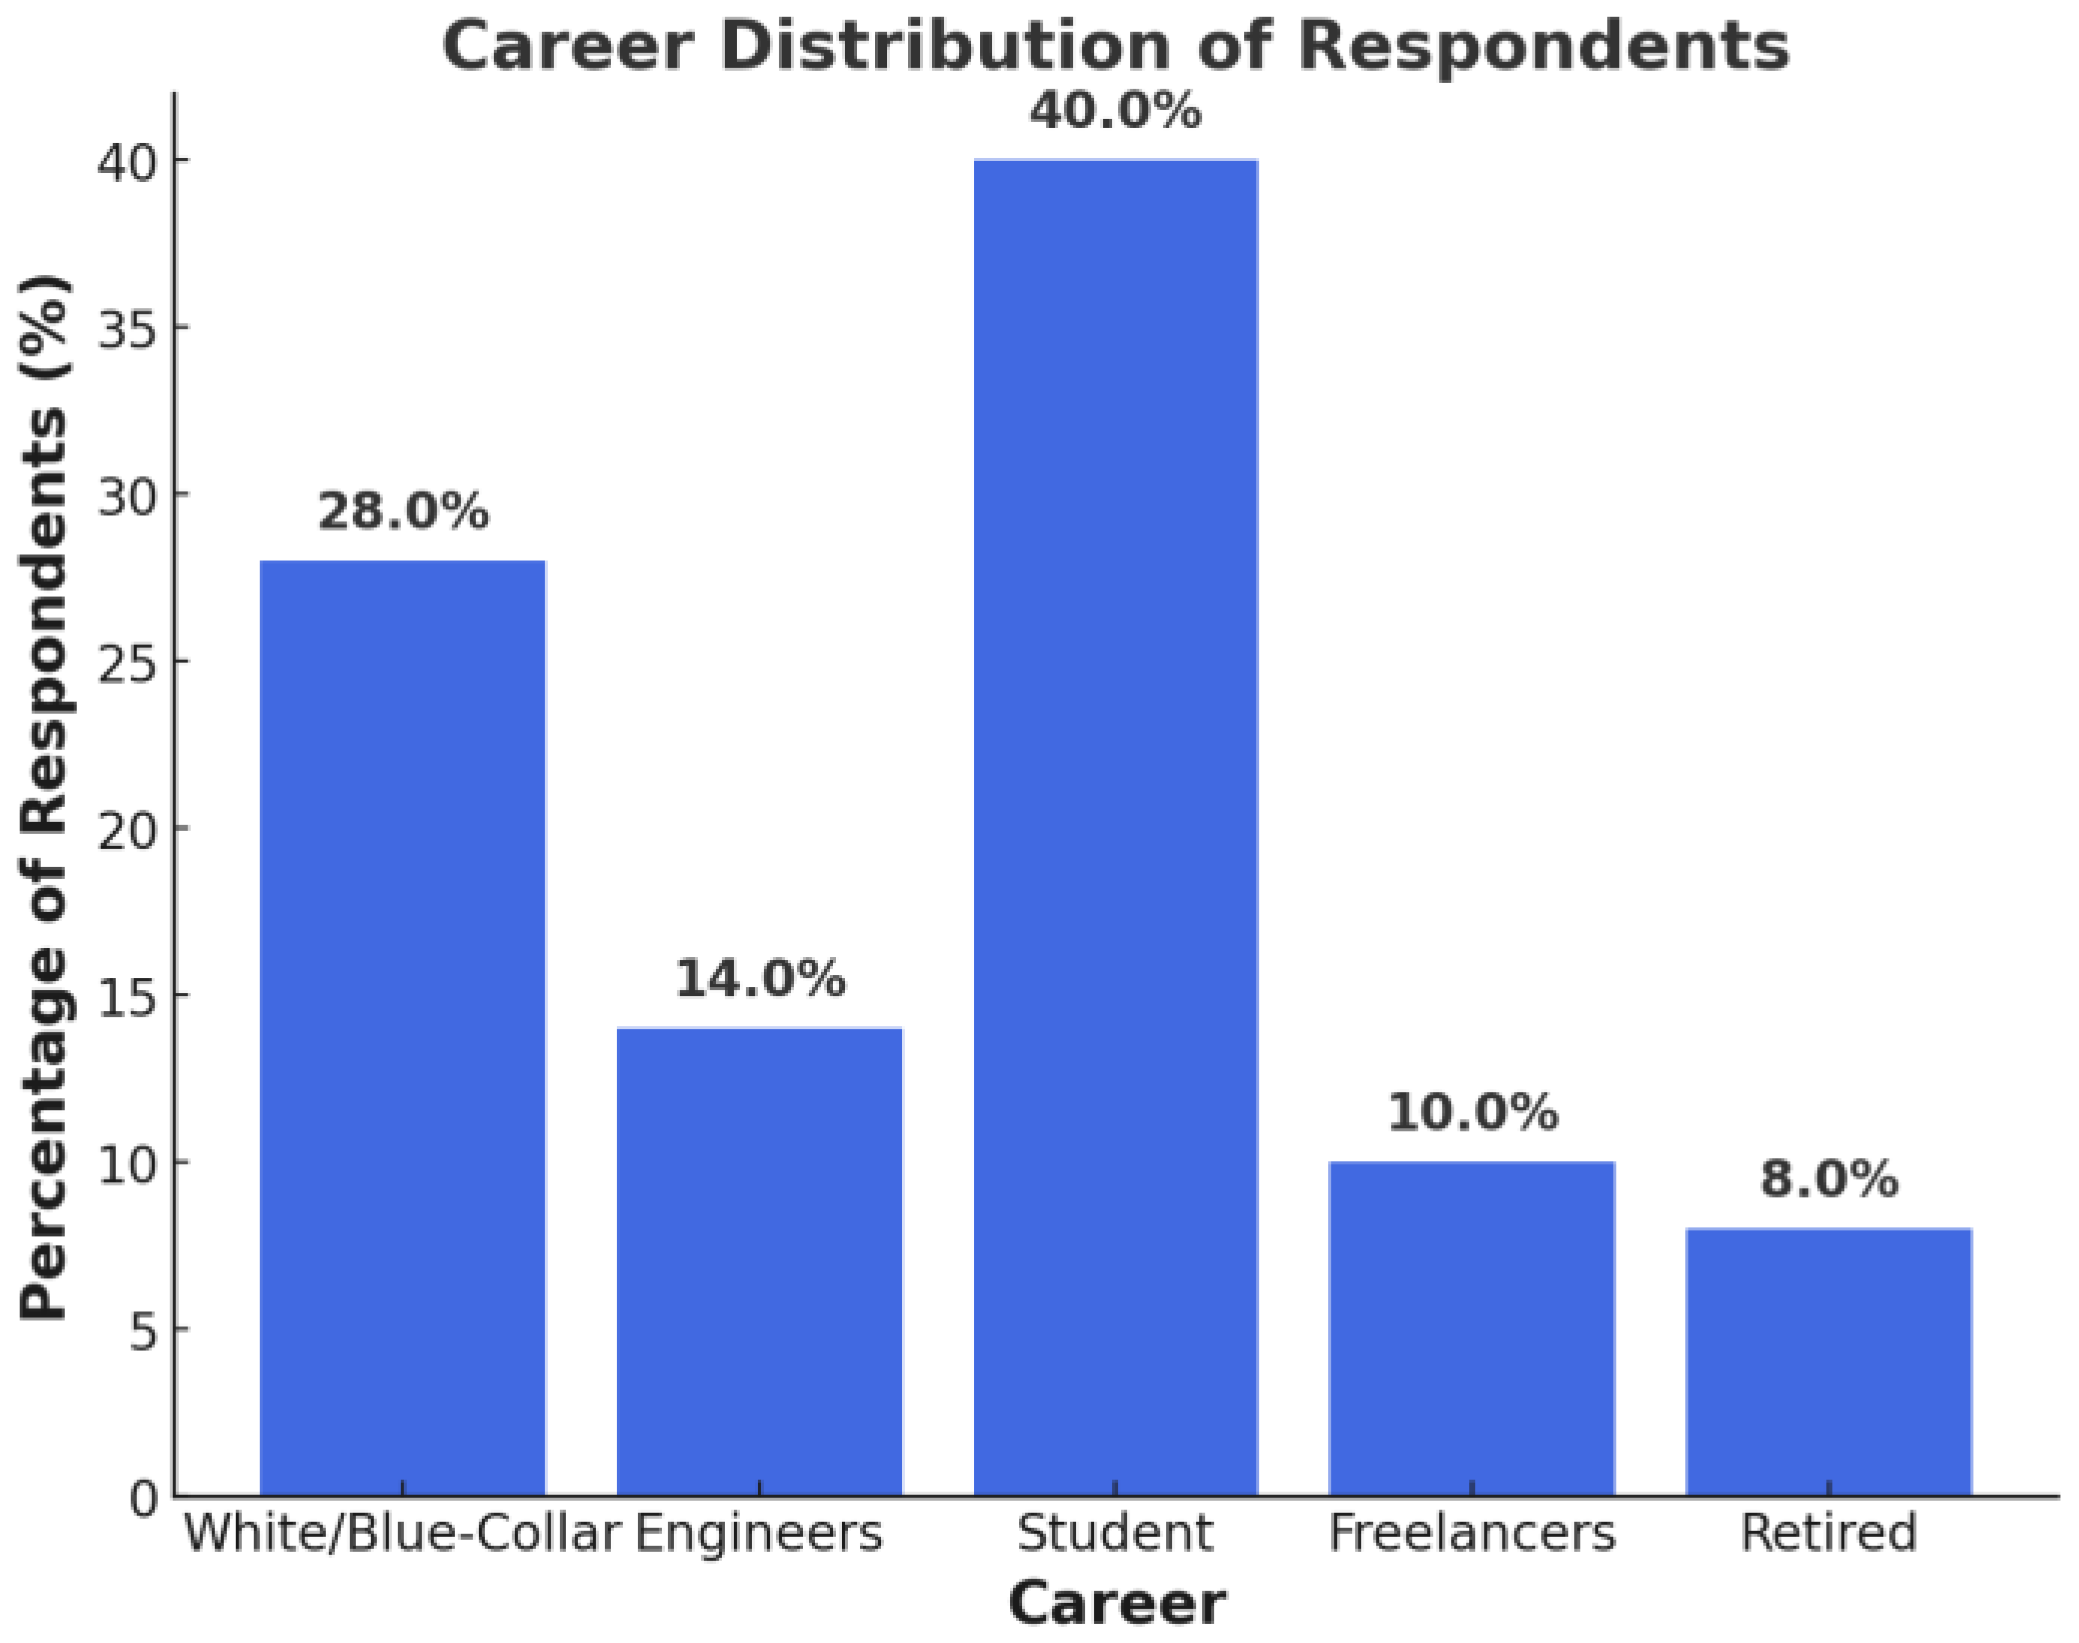
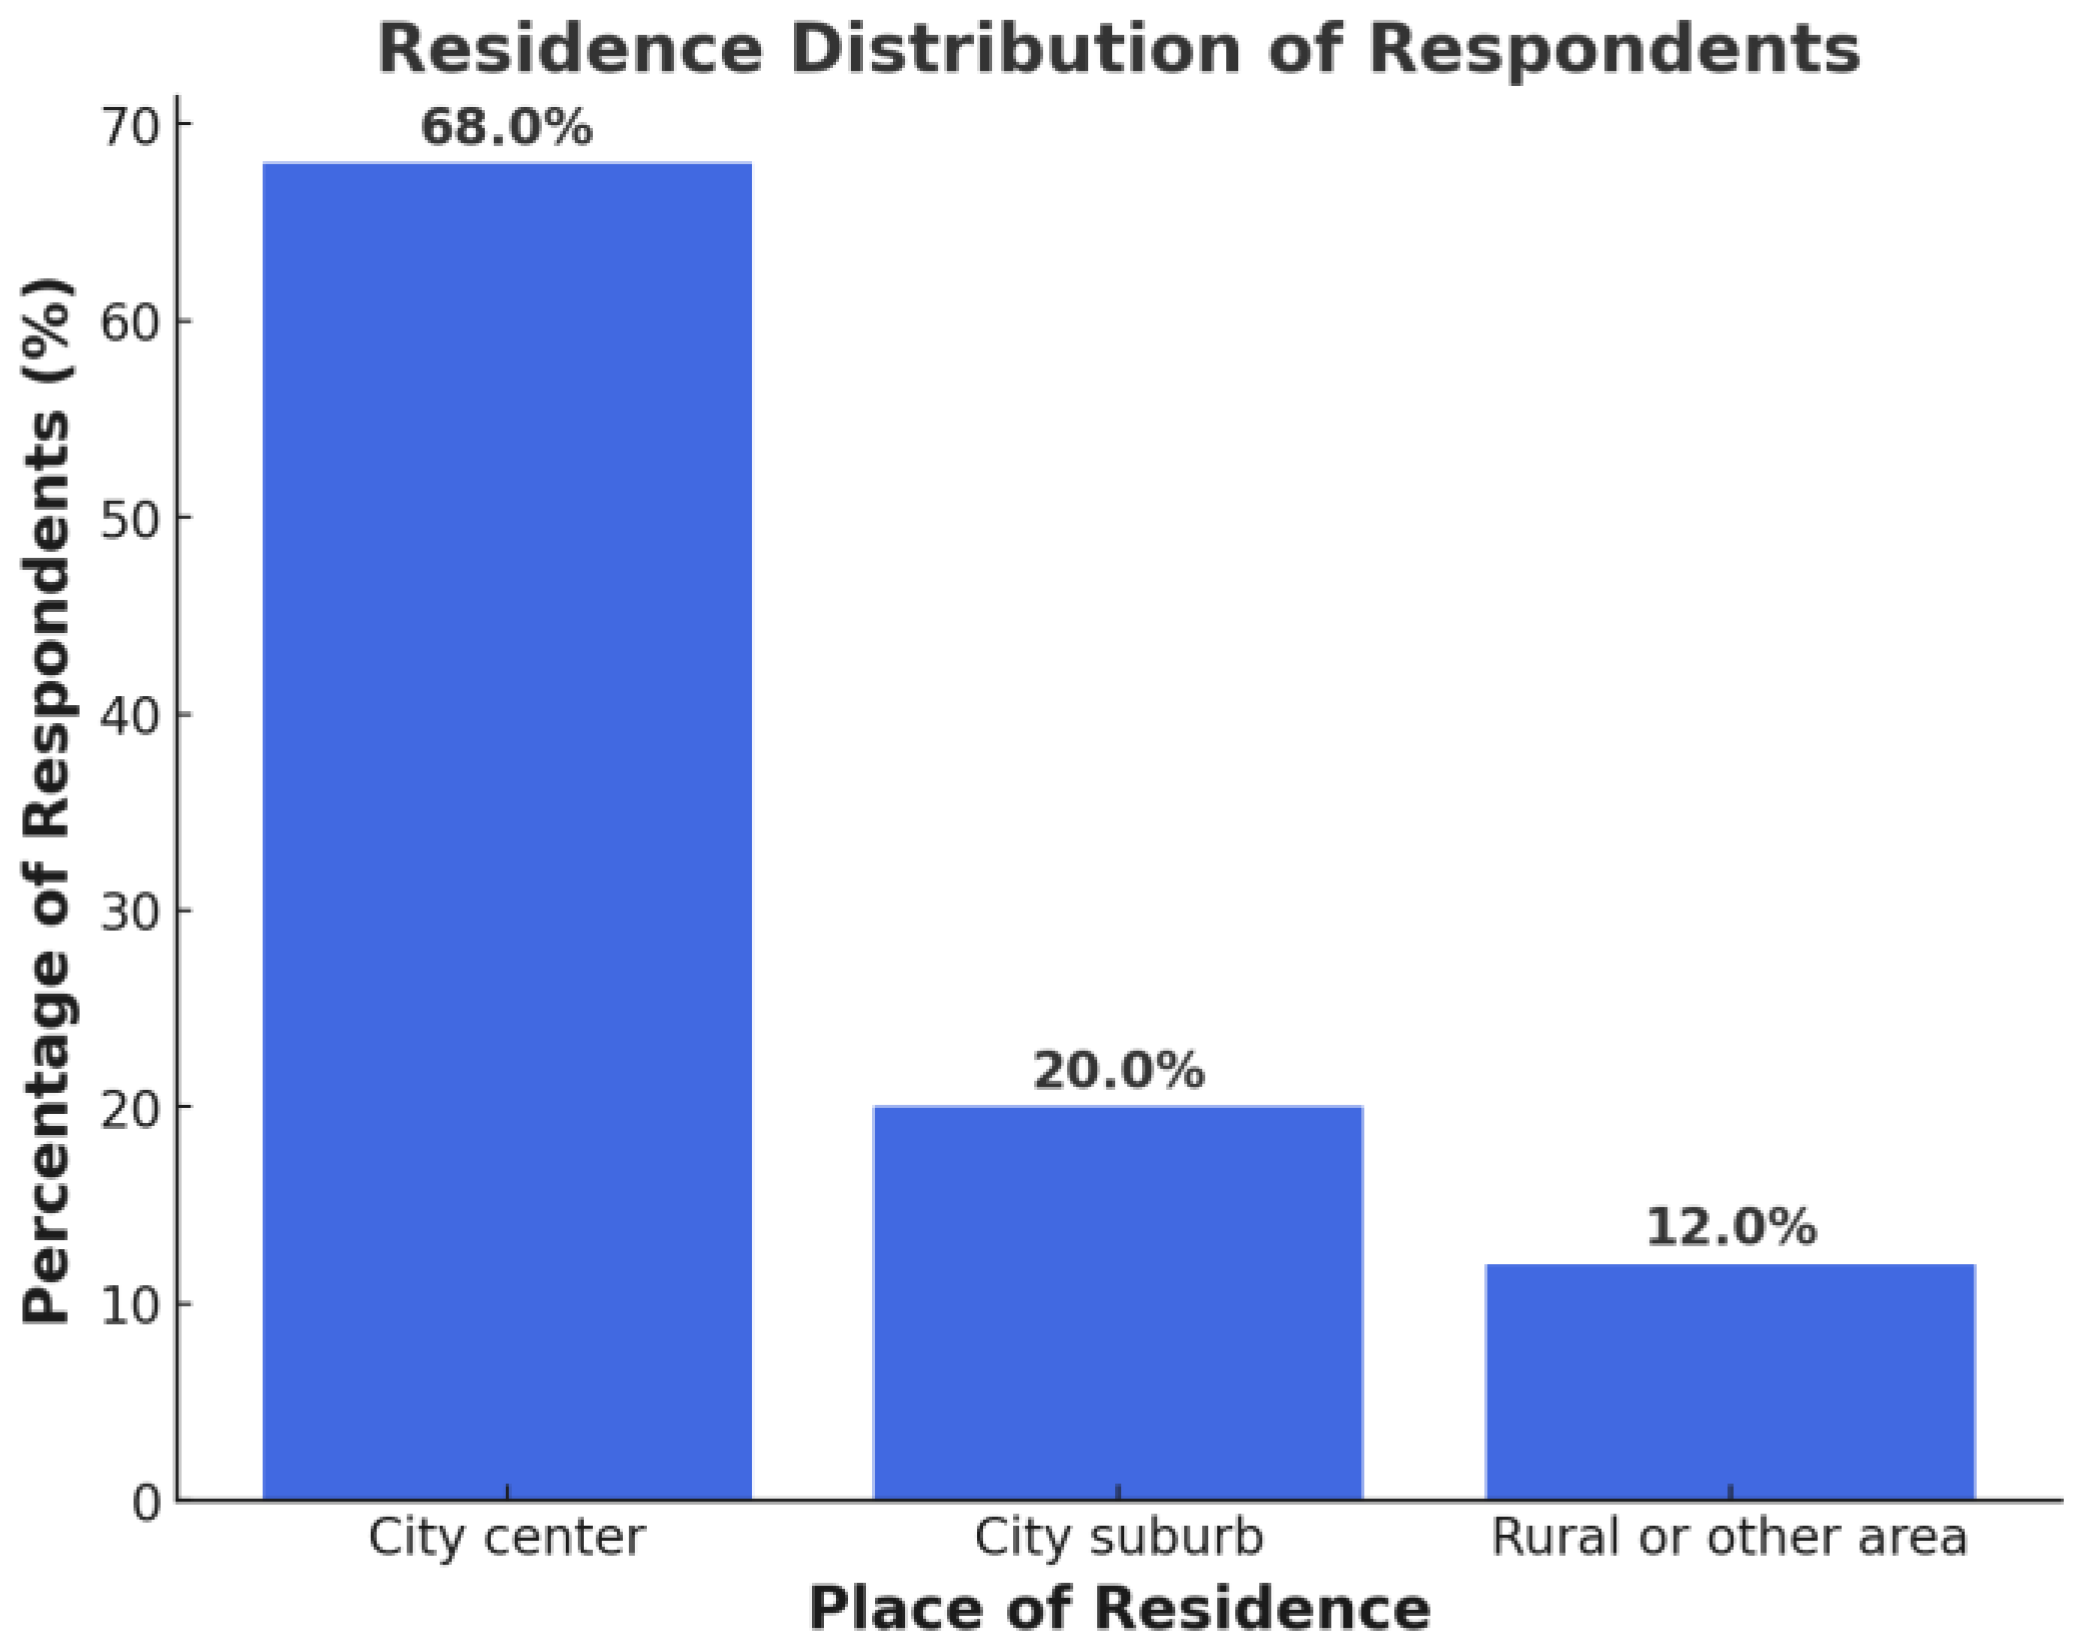
  • Essential demographics: age, profession, geographic region.
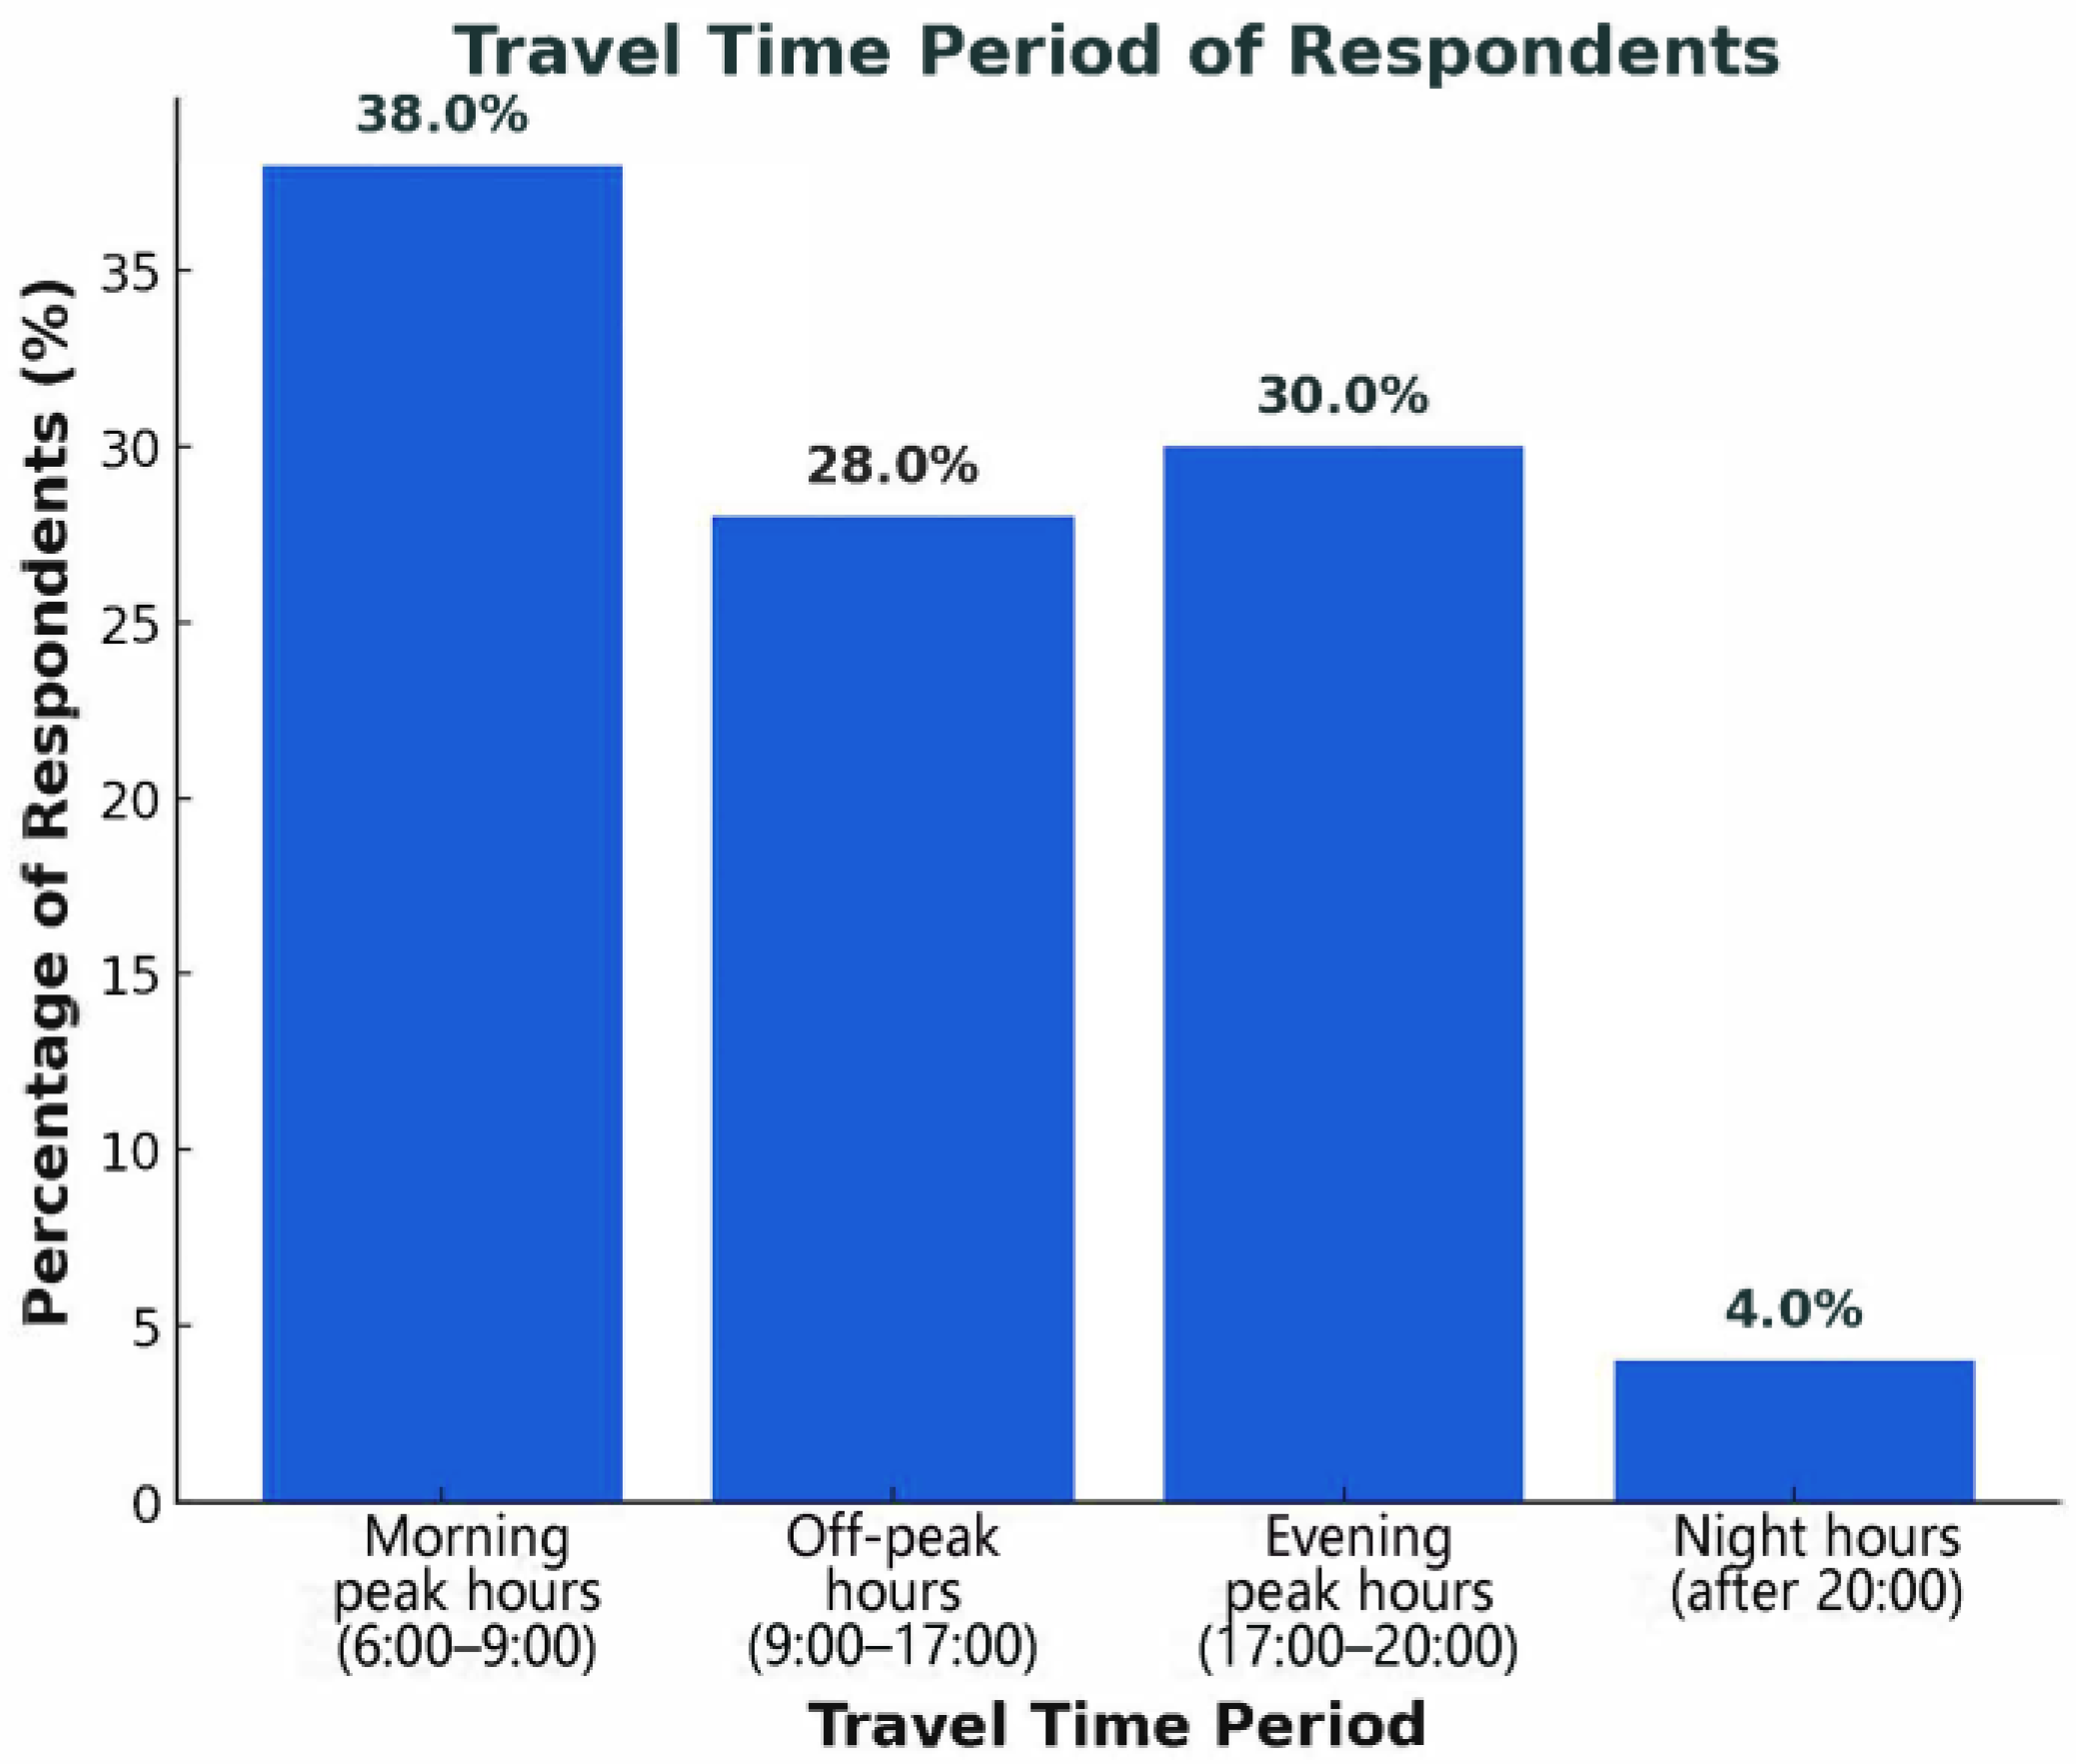
  • Current usage patterns: trip purposes, frequency and temporal context.
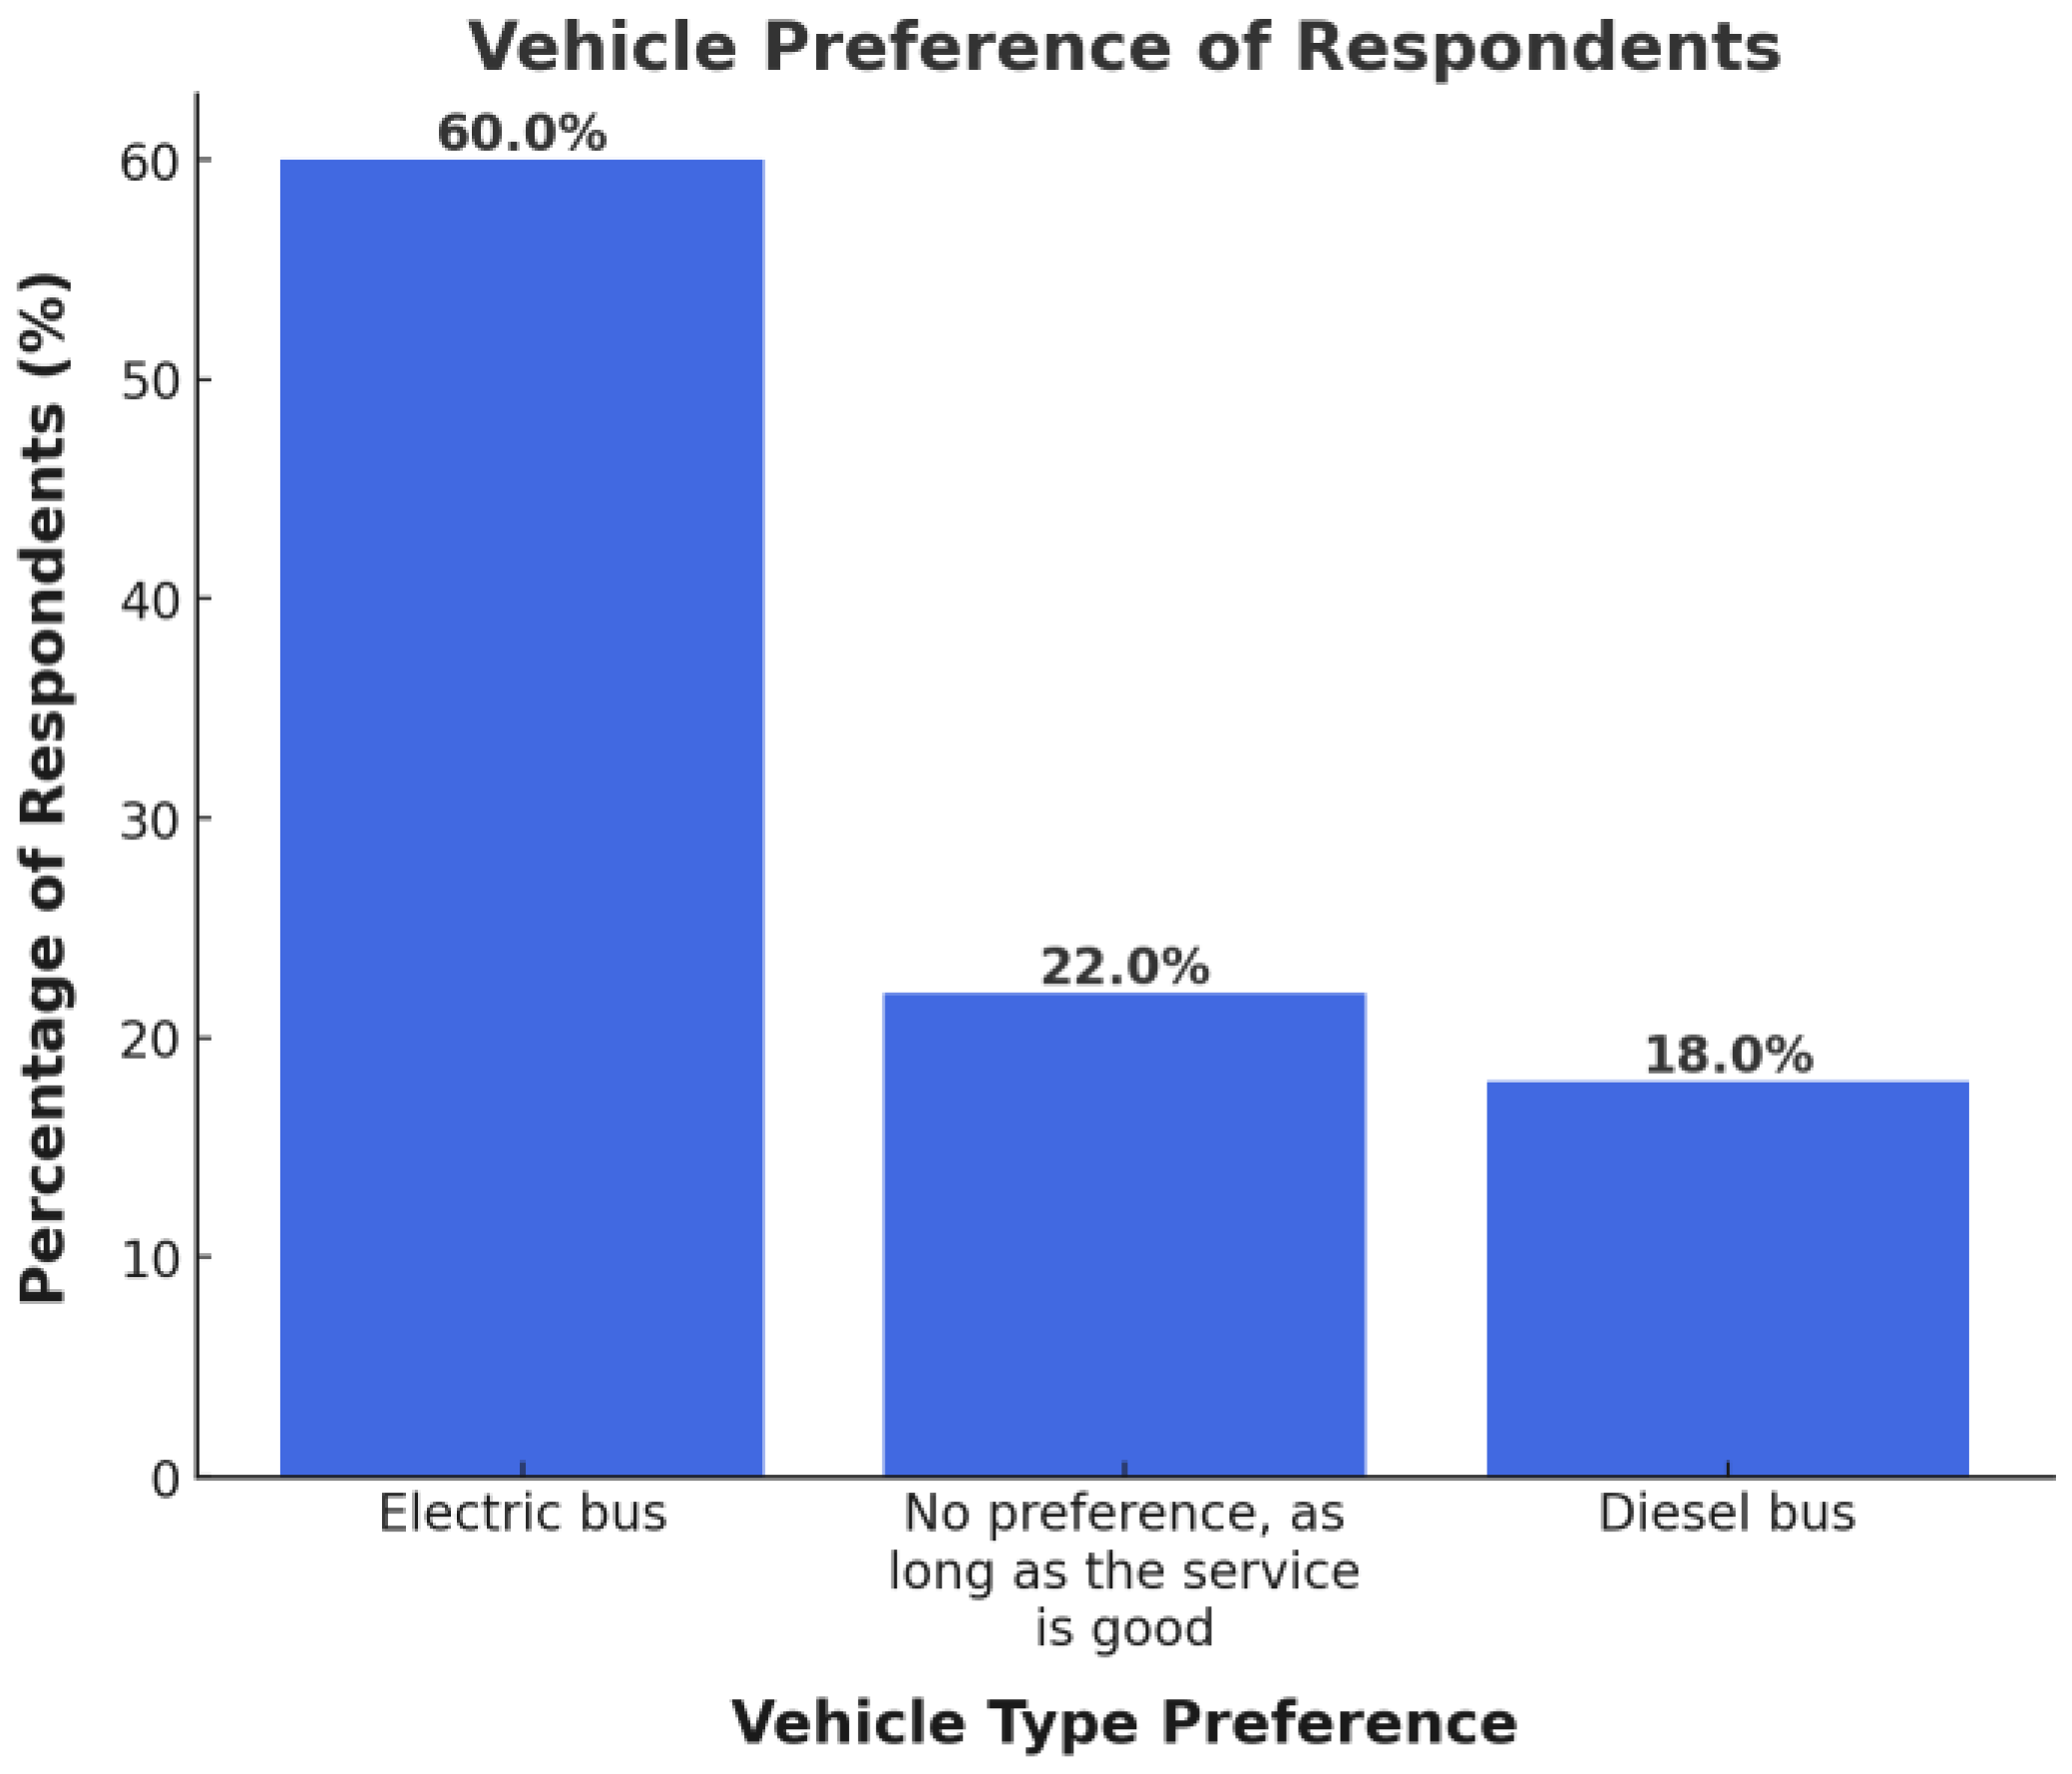
  • Determinants affecting service preference: timeliness, comfort and ecological factors.
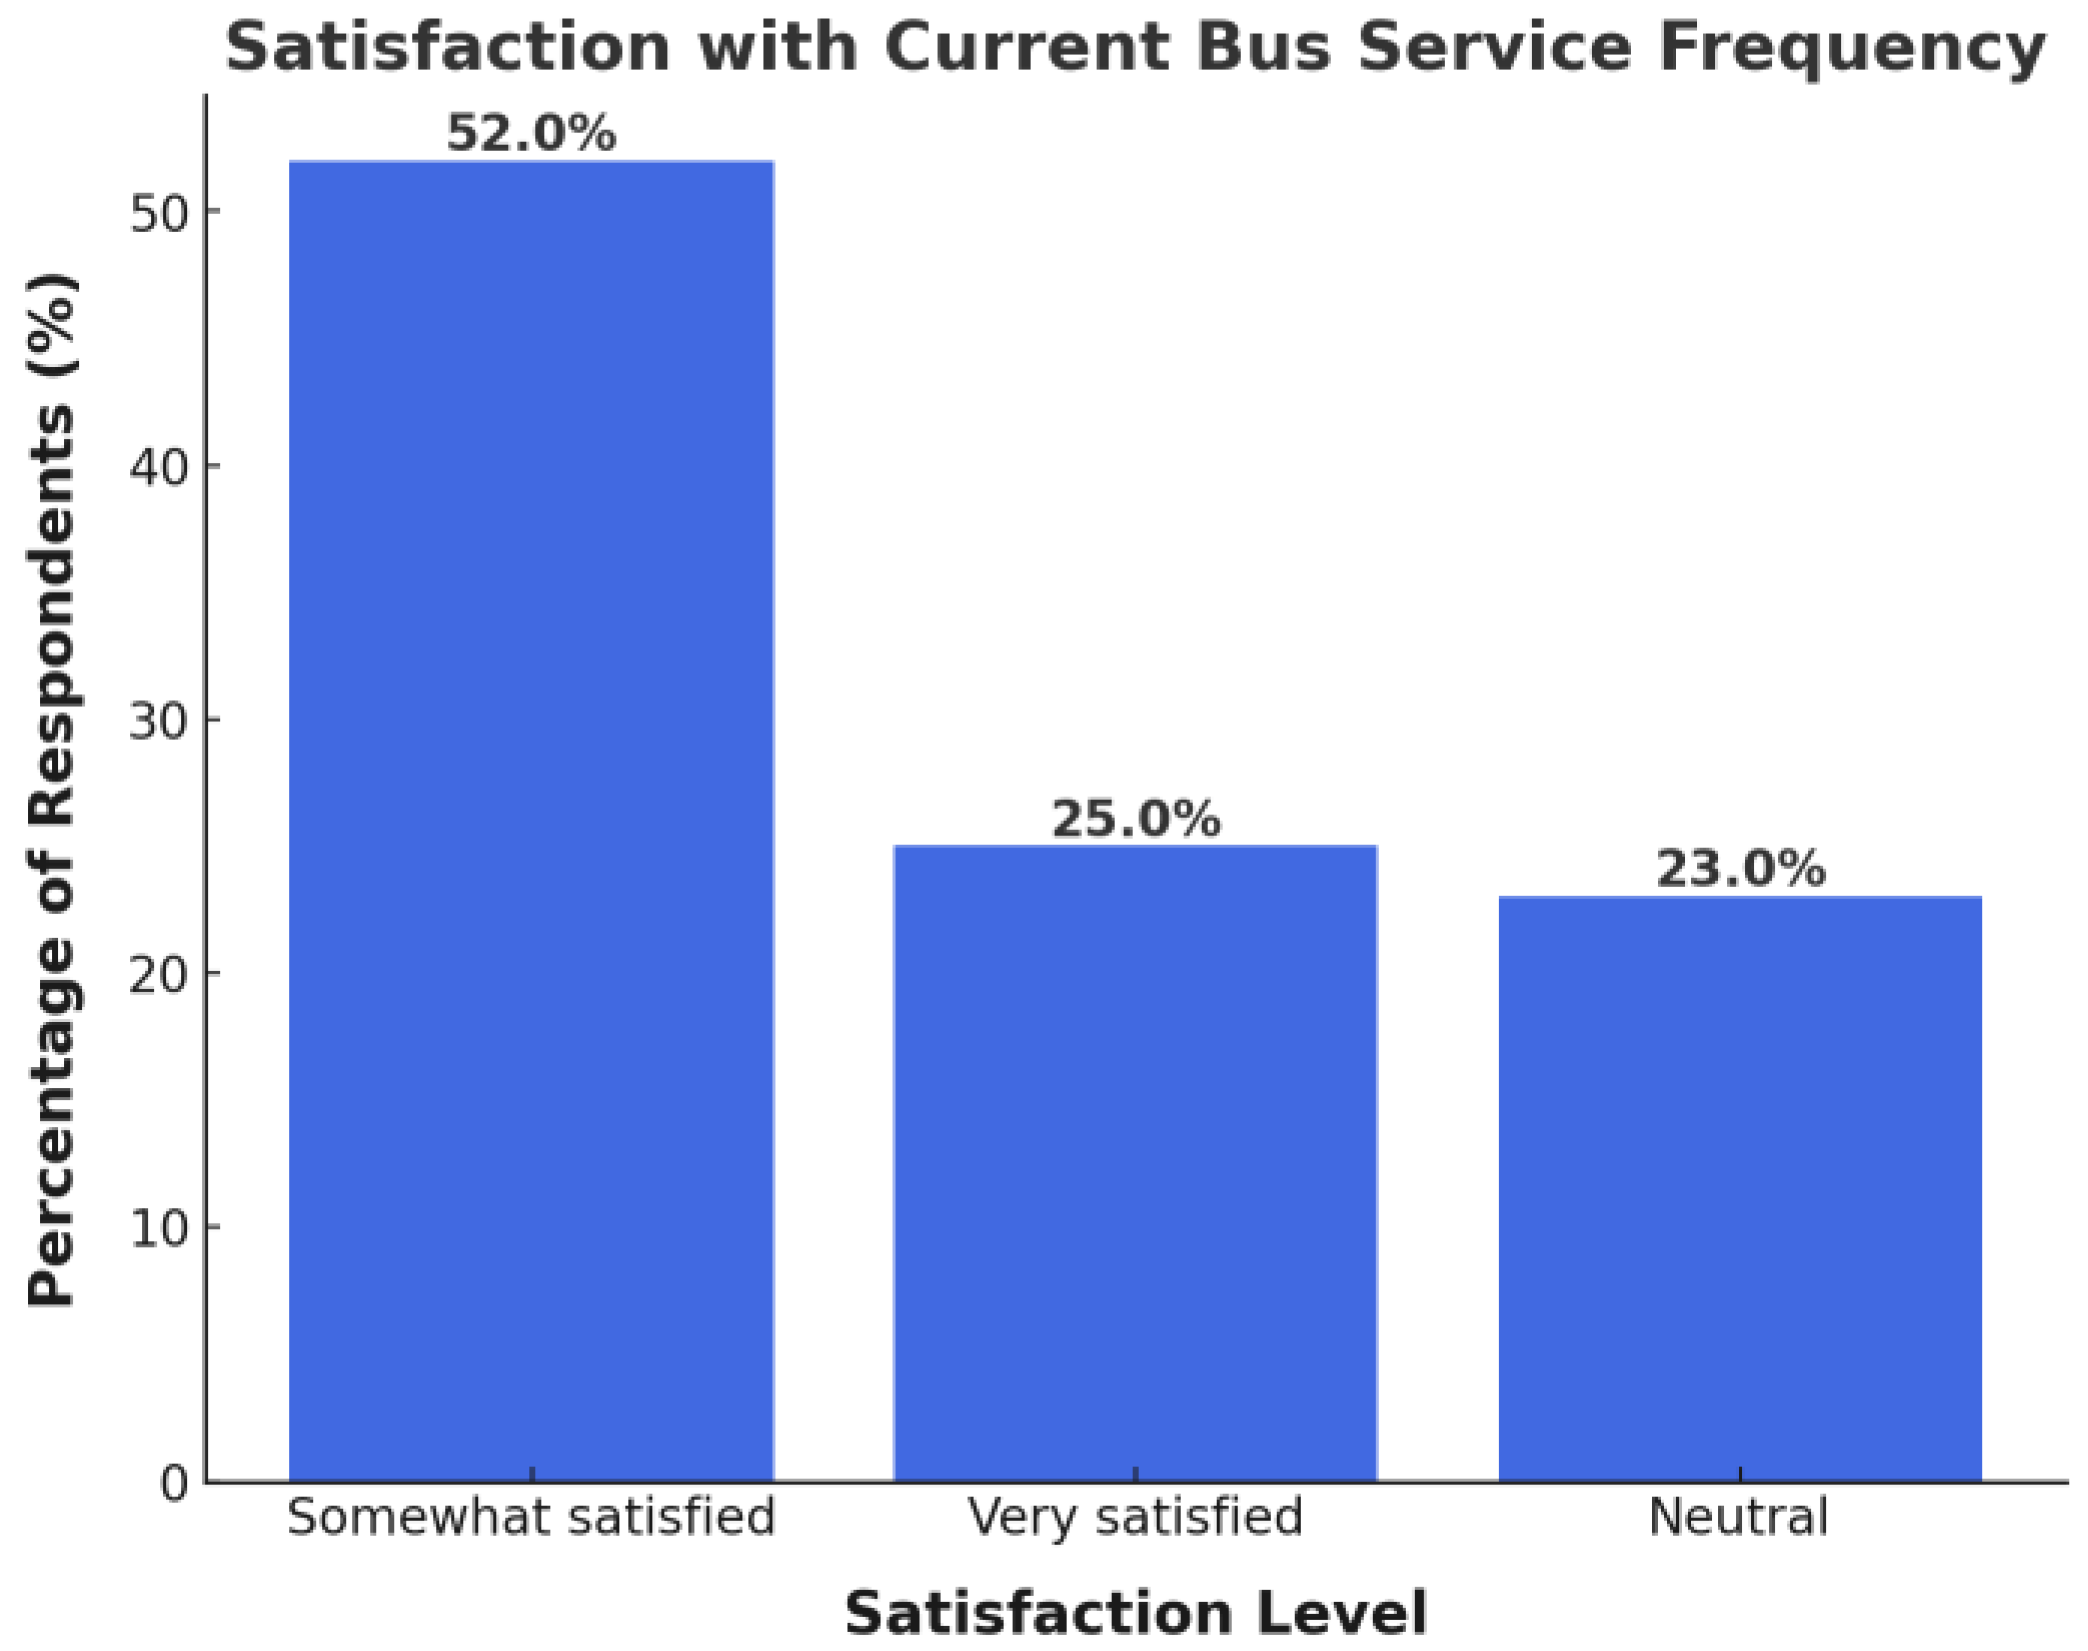
  • Evaluation and analysis of electric buses: satisfaction levels, drawbacks, willingness to incur further expenses and suggestions.
To guarantee sample variety, the questionnaire was disseminated throughout various professional networks, transportation communities, and social media platforms. Although the sample size was rather limited, it was adequate for discerning recurring themes and shared priorities, which constituted the principal aim of this exploratory study.
The survey aimed to validate, contextualize, and categorize existing indicators rather than to create KPIs from the ground up, addressing real-world operational and planning issues. This framework allowed us to pinpoint key differences between the technical performance indicators established in expert models and the user experience aspects prioritized by passengers. As an example from the results, although the battery range and charging duration are primary considerations in technical evaluations, passengers prefer ride smoothness, air-conditioning dependability, and cleanliness, indicating varying KPI weightings from the user perspective.

4.3. Survey Process

The completed questionnaire was disseminated online via Google Forms from 5th January 2025 to 5th March 2025 at Győr, Hungary, and a total of 100 valid responses were obtained. The participants comprised a diverse array of stakeholders, including students, blue/white-collar workers, engineers, and freelancers.
These indicators will facilitate enhancements of transit services and optimize the deployment of electric buses. The questions focused on age, place of residence, careers, travel timing period, vehicle type preference and satisfaction with current bus frequency.
The primary interviewees were passengers around bus stops, and other questions were also administered on buses. Informal interviews were conducted with two electric bus drivers to enhance the passenger perceptions and acquire further operational knowledge. Despite the sample size (n = 100) being somewhat constrained, it was adequate for an exploratory study focused on uncovering fundamental KPIs. The variety of respondents and uniformity in responses among the various stakeholder groups offered credible assurance of the findings’ robustness and relevance. This mixed-method approach facilitated a more thorough comprehension of the user experience and operational difficulties related to electric bus services within the local public transportation system. This empirical data collection aimed to evaluate key performance parameters relevant to the operation of electric buses within the local public transportation system.
This research aimed to address the following subsequent inquiries:
  • Do the chosen assessment indicators correspond to the preferences and requirements of passengers and operators?
  • In what manner do the survey findings endorse the implementation of electric buses as a sustainable transportation alternative?

4.4. Practical Calculation of Evaluation Indicators

The notion of practicality was underscored as a fundamental factor in the formulation and selection of KPIs. This principle stipulates that indicators must be quantifiable, interpretable, and actionable within practical operating settings utilizing accessible data sources. Each indicator was chosen not just for its theoretical significance but also for the accessibility of quantifiable and dependable data, sourced from technical sensors, public transport operator reports, or passenger input.
According to the structured survey methodology and the KPI framework established in this section, the indicators were classified into the mechanical, operational, and transport system dimensions. This classification corresponds with industry-standard assessments of electric buses and endorses a pragmatic, data-driven methodology grounded upon user feedback.
The mechanical indicators (e.g., NVH, battery systems, vehicle body) were primarily evaluated through users’ perceptions of comfort, noise, and environmental performance. For example, questions about air-conditioning efficiency, noise levels, and ride smoothness reflect real-time feedback on mechanical design aspects.
The operational indicators (e.g., charging time, reliability, energy consumption) were informed by both user attitudes (e.g., concerns over mid-route power depletion) and publicly available technical specifications. Satisfaction ratings related to punctuality and performance helped quantify the user-perceived reliability.
The transport system indicators (e.g., route coverage, passenger demand, scheduling) were directly addressed through questions about trip purpose, time-of-day usage, and service satisfaction. These responses reflect systemic attributes impacting electric bus implementation strategies.
The melding of user-reported data with the classified indicator system guaranteed that each KPI is both theoretically substantiated and practically quantifiable. The varied sample, particularly the incorporation of engineers and commuters, enhanced the representativeness and significance of these variables, offering substantive insights for forthcoming evaluation models. The details can be found in Table 1 below.
The survey gathered replies from 100 participants. As shown in Figure 2, the majority of respondents were aged between 26 and 40 years.
Figure 3 shows the different careers from the survey. The sample comprised commuters (42%) and students (40%), reflecting significant transit user demographics. Moreover, 28% of these commuters are white-collar and blue-collar workers, while an additional 14% are engineers.
When it comes to the place of residence, which is shown in Figure 4, the majority resided in urban or suburban locales. This particular point will serve as the foundation for the upcoming discourse.

5. Key Indicators

5.1. Mechanical Indicators

  • Design of Vehicle Bodies (Double/Single Decker, Articulated Buses)
The survey findings indicate that passenger capacity is essential. Participants underscored the necessity for buses to accommodate elevated passenger loads during peak hours, noting that a few individuals chose to utilize the bus services post-20:00 when alternative transportation options are accessible. After 20:00, bus services in Győr significantly reduce in frequency, which affects passenger confidence in timely arrivals. Evening routes may insufficiently cover all residential areas or need longer and less relaxed transfer times, causing consumers to choose more direct or quicker solutions. Public bus networks typically lower the service frequency or route coverage post-peak hours due to operating cost constraints and diminished demand. As a result, commuters living in suburban or sparsely populated regions frequently have transit issues throughout the evening. Reduced route consolidation during off-peak hours may compel passengers to endure prolonged waits between transfers or undertake indirect routes, meaning increased overall travel duration and frustration. The current bus systems may lack responsiveness to nighttime travel needs, which represents a critical gap in the service delivery.
For travelers going home after work or social engagements, the demand for dependability and time efficiency intensifies during the night. In such cases, private automobiles, ride-hailing services (e.g., Bolt, Uber), or operational metro lines are considered more efficient and dependable options, providing door-to-door service with less uncertainty. The absence of thorough and well-organized late-evening coverage undermines the competitiveness of electric buses, particularly in comparison to transportation modes that provide more perceived control and time efficiency.
In this case, a flexible body design and a combination of several vehicle types are employed to accommodate evolving passenger requirements. Articulated buses are employed on specific routes with substantial ridership, whereas traditional single-deck buses are utilized on other routes. These results are shown in Figure 5.
  • Energy Type (Electric vs. Diesel)
Figure 6 shows the statistical result of the different vehicle type preferences. In this case, 60% of participants indicated a strong preference for environmentally friendly transit options by choosing electric buses, validating the emphasis on electric powertrains as a primary consideration. Another 22% of participants expressed less worry over the kind of gasoline their cars ran on. Moreover, 18% of respondents demonstrated limited concern for environmental issues by showing a preference for diesel buses.
  • Noise, Vibration, and Harshness (NVH)
Passengers rated comfort favorably, with electric buses garnering especially excellent feedback for their smooth and quiet operation, which markedly improves the entire passenger experience in comparison to diesel alternatives. Passengers generally rated comfort positively, with electric buses receiving particularly strong praise for their smooth and quiet operation—features that significantly enhance the overall passenger experience compared to diesel buses. Even if someone is unfamiliar with the vehicle’s mode of propulsion, they have the courage to embrace this innovation. The result can also be found in Figure 6, and more than half of the respondents expressed a willingness to experiment with electric buses.
  • Battery Systems
Participants voiced apprehension over the range constraints, with more than half indicating that the restricted range and extended charging durations of electric buses are significant disadvantages. Nonetheless, one disadvantage is progressively being ameliorated by technological advancements. Research indicates that electric buses can deliver equivalent service quality to diesel buses when well-constructed, alleviating passenger concerns regarding vehicle range and related issues. Göhlich et al. [38] examined and organized pertinent car technologies and charging systems through a morphological matrix, incorporating both technological and operational factors by implementing a modular simulation model. The research indicates that complete electrification of public transport networks is feasible under specific conditions.

5.2. Operational Indicators

  • Required infrastructure
Upon analysis of the findings, almost one-third of the respondents expressed a desire for an increase in charging facilities. They contended that the current infrastructure can still satisfy demand, and as the proliferation of electric vehicles increases, an inevitable disparity in resource allocation would arise. Commuters will encounter delays due to vehicles not arriving punctually.
The service frequency, circulation length, and operating speed of a transit system may have a significant impact on the cost of different charging infrastructure. Chen et al. [39] examined the most effective strategy for positioning diverse charging facilities along bus routes and ascertaining the ideal size of the electric bus fleet, including their battery capacities, to minimize the overall infrastructure and fleet expenses while preserving the service frequency and fulfilling the charging requirements of the bus system. The findings indicate that the frequency of service, duration of operation, and operational speed of a transportation system may significantly influence the cost competitiveness of various pricing infrastructures.
  • Passenger capacity
Passengers commuting daily emphasize the significance of high-capacity buses, particularly during peak hours. For certain popular routes, the demand may significantly differ from standard routes, necessitating distinct fleets and vehicle layouts. This reaffirms that capacity can serve as a fundamental operational metric.
  • Cost
More than 60% of respondents endorsed a fare increase for environmentally friendly buses; however, concerns regarding affordability persisted, with some individuals advocating for the maintenance of current fare levels, asserting that the savings from fuel costs and reduced electricity expenses should adequately offset the initial price differential of the vehicle. The necessity of achieving equilibrium between sustainability and affordability was underscored, rather than simply augmenting expenditure.
  • Charging time and range
Less than 50% of respondents mentioned charging time as a difficulty. Many of them presented worry about electric buses having a lesser range than diesel buses (about 300–500 km for electric buses against 700–1000 km). Certain respondents worried that this restriction might raise the possibility of mid-route charging needs or service disruptions. However, it was clear that not all the participants were familiar with the operational and technical aspects of electric buses, such as different charging strategies (e.g., fast charging and depot charging), which could alleviate range-related concerns. Passengers with experience using electric vehicles noted that planning charging stations was critical for long-distance trips and therefore less flexible than with fuel vehicles. In contrast, those who primarily use their vehicles for urban commuting or short trips found the range limitations less worrisome. Many believe that all-electric buses are well suited for short urban routes, but their reliability on long suburban routes remains an uncertainty.
  • Maintenance and service
This indicator was derived from a brief chat with two bus drivers rather than a questionnaire. It can still be considered an important indicator. The interviewed bus drivers possess two years of experience operating electric buses, which, in contrast to the company’s older diesel buses, are more user-friendly and mechanically uncomplicated, necessitating only routine inspections of the coolant and power steering fluids, along with various consumables, thereby obviating the need for laborious maintenance tasks. Despite the extended duration required for daily charging, they surpass fuel vehicles in numerous aspects, including noise, NVH, drivability, and ride comfort. The passenger response has been positive, with no breakdowns impacting vehicle operations throughout the one and a half years of rigorous use.
The electric bus’s simpler mechanical structure significantly diminishes the challenges associated with initiation. A seasoned driver can swiftly acclimate to the new vehicle’s operation, and the incorporation of the electrical system streamlines morning start-up, obviating prolonged waits for components to reach operational temperature and simplifying pre-departure checks.
Additionally, electric buses generate less noise pollution. A compulsory 20 min break will be scheduled after the bus driver has operated continuously for one and a half to two hours. The operational attributes of electric buses enable drivers to utilize energy-intensive devices, such as air conditioning and heating, while stationary, without concern about the mechanical degradation of the engine. From a driver’s perspective, despite the higher costs, limited range, and extended recharging times of electric buses, they still favor operating the more convenient, newer, and better-equipped electric buses.

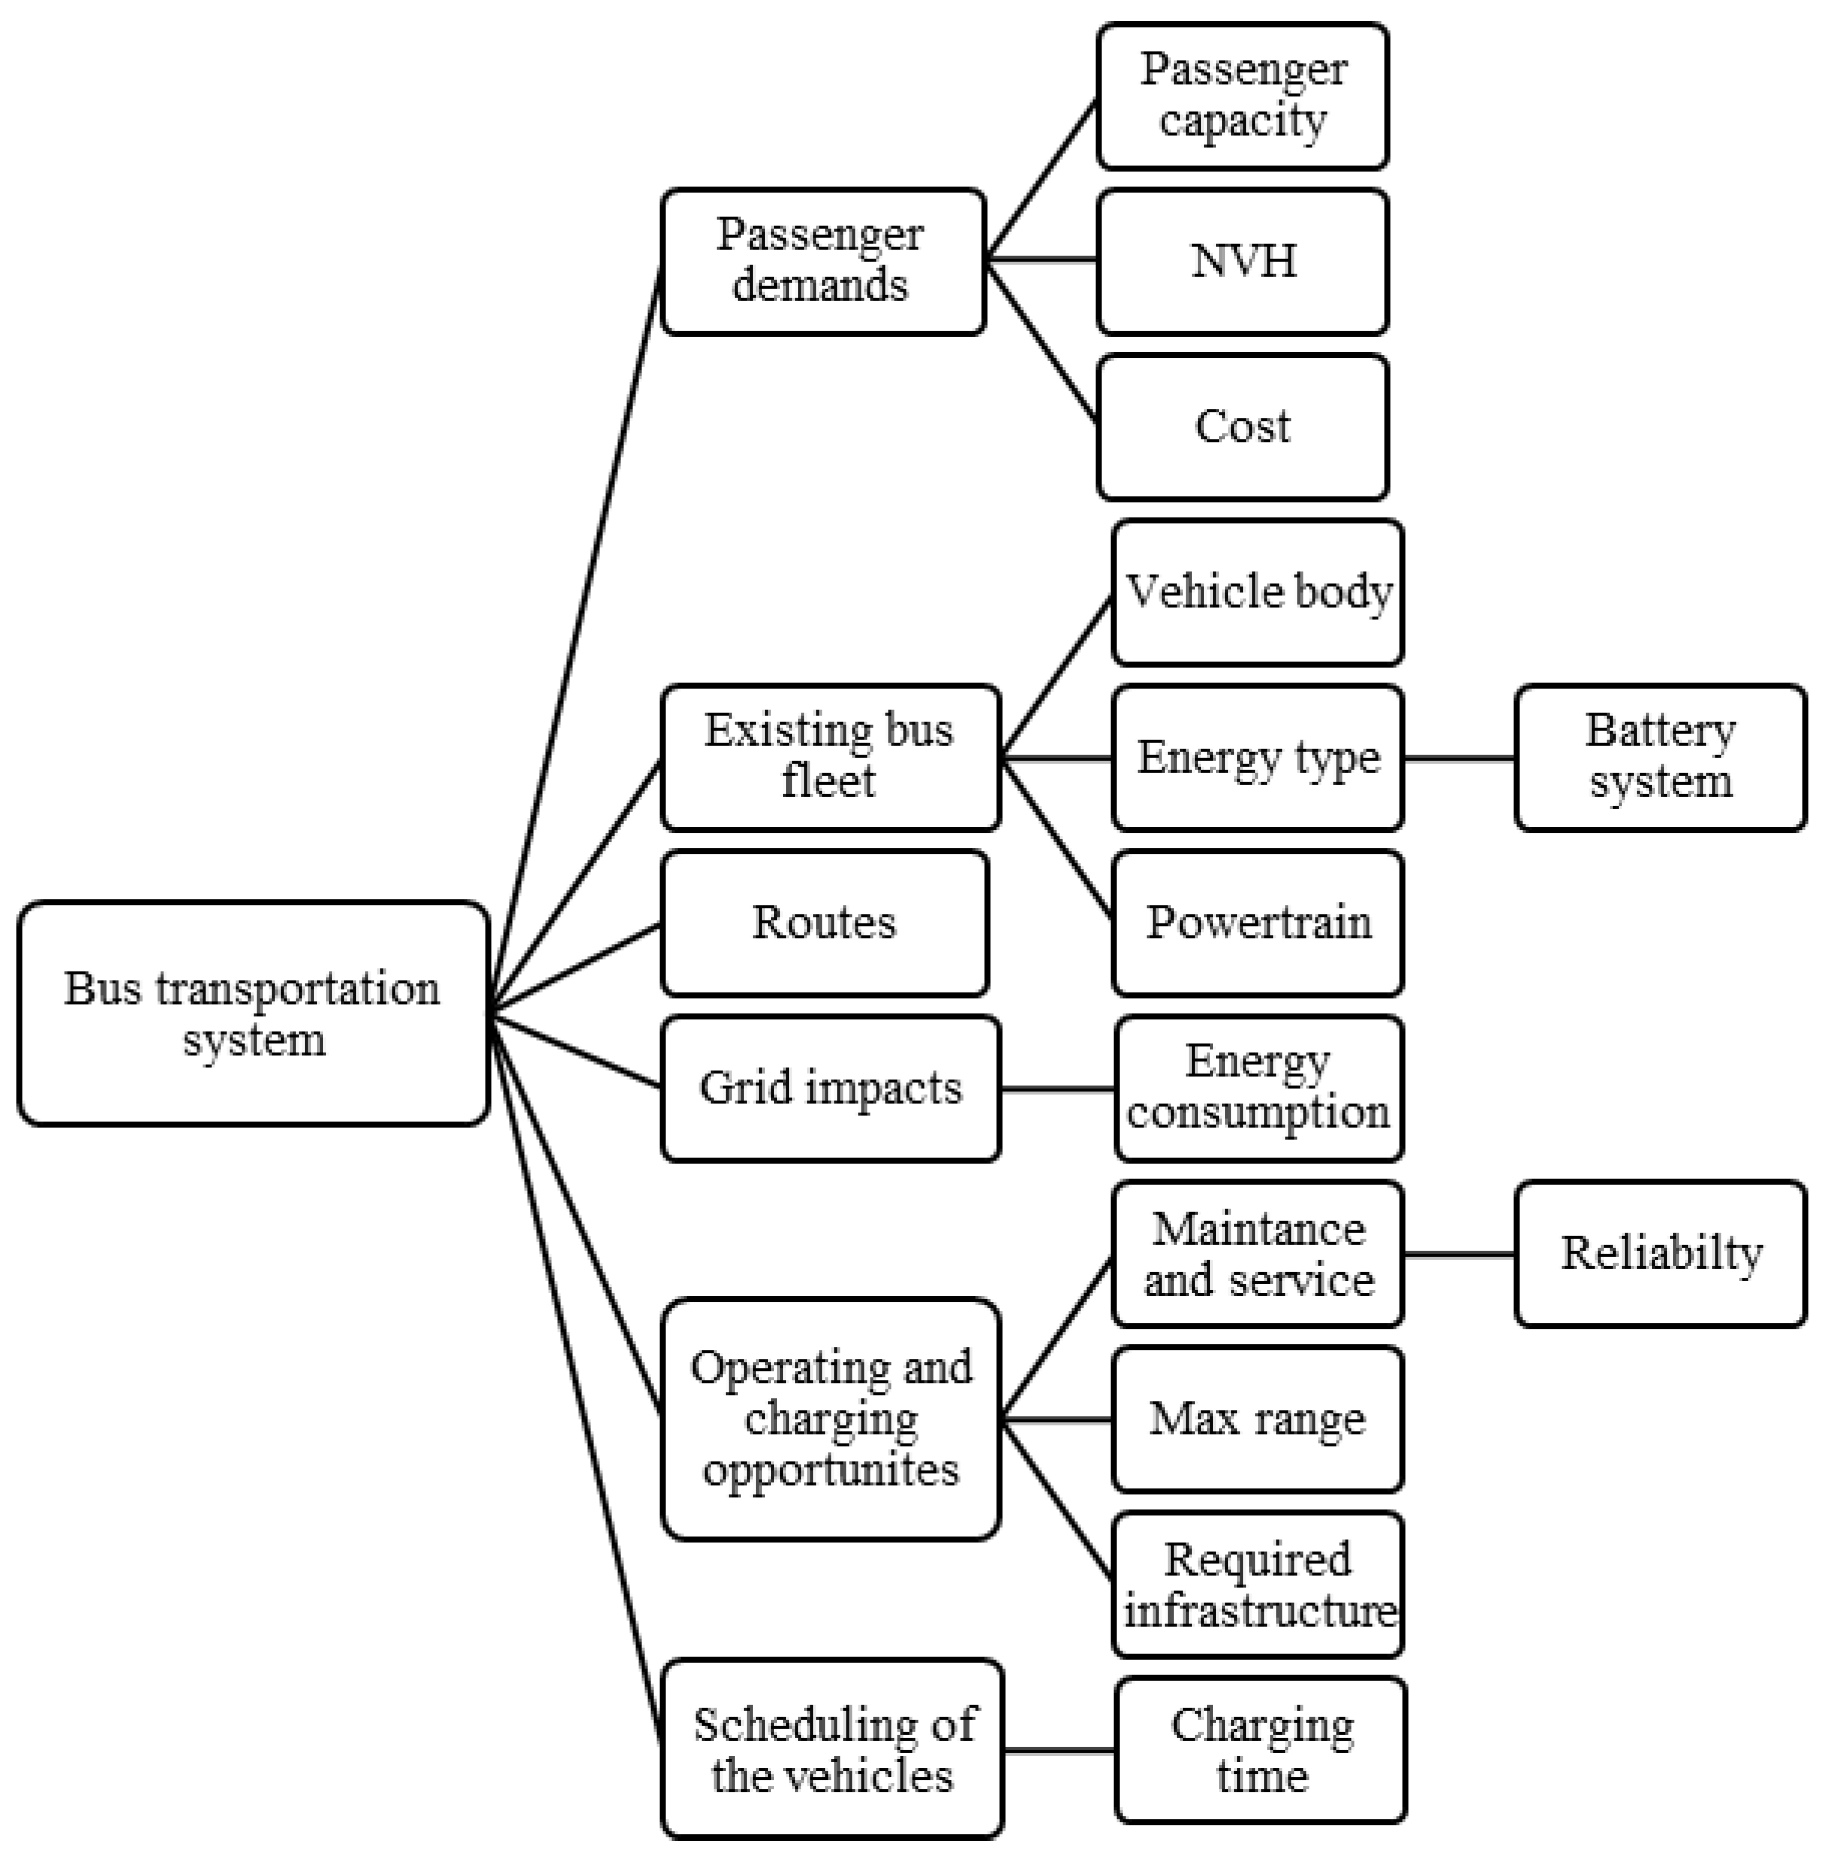
5.3. Bus Transportation System Indicators

  • Passenger demand
The survey results show a high demand during peak hours, which is consistent with the actual operations of the transit system. Here, 25% of the total respondents expressed apprehension that drivers unacquainted with electric buses could struggle to operate them smoothly until they acclimated to the motors’ output characteristics, perhaps inducing motion sickness among passengers. The discussion indicates that about 33% of the passengers have extensive experience riding various types of buses. The various power kinds of buses can be identified by the green vehicle number plates designated for electric cars and the distinctive fuel identification stickers affixed to the front of the buses. Both drivers and passengers can perceive that the power output characteristics of electric buses change.
Certain vehicles are particularly vulnerable to meteorological conditions. Approximate 80% of individuals expressed concerns regarding the vehicles’ waterproof capabilities, asserting that the electrical system may be prone to short-circuiting when subjected to prolonged humidity exposure.
Sebastiani et al. [40] assessed the energy consumption of buses through discrete-event simulation, gathering data on the passenger demand, bus speed, distance, and route elevation for Curitiba’s public transportation system, employing a mathematical model that considers varying loads and frictional forces. The results illustrate many scenarios contingent upon the quantity and placement of charging stations and the duration of bus operations, influenced by passenger demand. The passenger demand serves as a crucial evaluation criterion for assessing the operational effectiveness of a transit system.
  • Existing bus fleet
More than 80% of respondents underscored the necessity of substituting the obsolete diesel bus fleet with electric buses, expressing a preference for electric cars. The state of the current bus fleet directly impacts the operating efficiency and passenger happiness. Electric buses offer a feasible alternative to outdated vehicles with elevated emissions, particularly on routes characterized by significant passenger demand.
Apart from the passenger questionnaire, two bus operators with a bus capacity of about 100 were personally visited during the investigation. One of them still obtains objective government subsidies, expecting to progressively expand the percentage of electric cars in the future. They have already bought about 20 electric buses for the replacement of aging diesel vehicles on inner-city and suburban routes. The new electric buses are generally well liked by passengers; hence, the electrification of the public transport system is going rather well in the area. Regarding the launch of electric vehicles, the business had negotiated ahead of time with local authorities for charging stations containing pantographs for quick and simpler charging. Another operator claimed that although their present paths mostly serve suburban commuters with significant traffic on one route, the 2–3 h charging time for electric buses can make vehicle scheduling somewhat challenging for them. Thus, for the time being, the electric bus has a wait-and-see attitude and is not rushing to replace the diesel cars. Regarding future plans, in the short term, internal combustion engine vehicles will still be the primary choice; so, they do not take the acquisition of extra electric vehicles into consideration. The strategy will be changed suitably if the policies and circumstances allow the premise.
Pelletier et al. [41] introduced a thorough optimization-based decision support tool addressing a fleet replacement issue, considering the purchase expenses, salvage income, operational costs, charging infrastructure investments, and demand charges in a cost-efficient manner, facilitating organizations to recognize bus replacement strategies that align with their fleet electrification objectives.
  • Routes
The aforementioned input indicates that electric buses are more appropriate for short- and medium-distance urban routes, where the range limitations are less critical, while suburban routes necessitate greater range capabilities. Participants observed that these routes generally exhibit consistent passenger demand patterns and feasible charging schedules, such as elevated passenger volumes during morning and evening peak hours and diminished volumes throughout the remainder of the day, which facilitate the organization of vehicle operations and charging schedules. This route is ideally suited for the introduction of electric buses.
Certain routes exhibiting low power demand characteristics, such as those with little gradients or functioning in high-traffic, low-speed settings, are especially beneficial for electric buses. Vehicles can optimize energy use and prolong the lifespan of both the vehicle and its battery. By using electric buses on shorter routes, transportation authorities may eliminate running interruptions, improve environmental and financial efficiency, and provide consumers with a constant, dependable service. Electric buses find that some routes with planned charging facilities—such as pantographs at key stations—fit since this charging technology greatly simplifies the vehicle replenishment procedure.
The technological and operational attributes of electric buses contrast with those of traditional diesel vehicles, resulting in substantial alterations in vehicle scheduling and route design. A single-vehicle depot-vehicle scheduling (SDVS) model was funded by Chao et al. [42], incorporating unique limitations and the operational characteristics of electric buses, and it is formulated to address the electric vehicle scheduling challenge. The model encompasses two separate target functions: minimizing capital investment in the electric vehicle fleet and reducing the overall charging demand at charging stations. The fundamental concept of the Non-Superiority Sorting Genetic Algorithm (NSGA-II) is utilized and examined in addressing the scheduling issue for an impending electric bus demonstration project in Shanghai. Consequently, this signal cannot be disregarded and can even be said to be a major determinant of the decision on the implementation of electric buses.
  • Grid impact
Two engineers who were questioned reported seeing oscillations in the power supply system when charging electric vehicles at their residences. Concerns were raised regarding the grid’s capacity to accommodate a completely electrified fleet, highlighting the necessity of developing distributed and scalable charging systems. They want vehicles that impose minimal strain on the grid while ensuring stability, together with charging stations that are strategically arranged in terms of the location. Focused research has been undertaken to resolve this matter. Mohamed et al. [43] executed a dual modeling experiment, initiating three charging modalities, flash charging, periodic charging, and overnight charging, to formulate a real-time simulation model for an extensive analysis of electric bus operations within a public transportation network, aimed at quantifying the energy demand, designing the requisite charging station infrastructure, assessing the operational feasibility, and generating charging load profiles. The simulation results indicate that flash charging and periodic charging are more appropriate for the functioning of a comprehensive public transport network; nonetheless, they encounter significant, intermittent power needs. The overloading and voltage management of substation transformers and distribution feeders enhance the viability of nocturnal electric bus operations.
The energy consumption of the vehicle can somewhat influence the overall power demand but is not solely constrained by its interaction with the grid. The mode of operation (e.g., charging schedule, route design), selection of technology (e.g., engine and battery configurations), and infrastructure architecture (e.g., centralized or dispersed charging stations) also have an impact. Also, the energy usage affects the overarching system choices, including the design of charging load profiles, the planning of charging station locations, and the vehicle dispatch tactics.
  • Operating and charging opportunities
Around 15% of respondents underscored the necessity of carefully timed charging opportunities during off-peak hours to mitigate grid stress. These options may involve employing depots or specific charging zones at transit hubs, enabling buses to recharge between routes without significant service interruptions. Transit authorities can enhance the operational efficiency and minimize the strain on grid resources by including charging operations into vehicle timetables.
Complete electrification of specific lines is anticipated to be achievable in the imminent future. A proper operating and charging schedule for these cars will be necessary. A k-Greedy algorithm-based technique [44] to achieve this job was proposed by Paul et al. The findings indicate that the k-Greedy algorithm effectively optimizes the mileage of electric buses, hence decreasing the fuel expenses and CO2 emissions for bus operators.
The quieter operation and reduced maintenance expenses of electric buses offer substantial benefits. Additionally, their implementation provides the potential to improve transport schedules by incorporating charging intervals at strategically positioned hubs, guaranteeing uninterrupted service with little interruption. Transit agencies can utilize these benefits to enhance reliability and decrease long-term operational costs. The lowered noise levels improve the urban environment, especially in densely populated regions, hence increasing public acceptability and passenger happiness.
  • Scheduling of the vehicles
Passengers desire buses to deliver superior, constant service to safeguard their daily commutes, rather than to contend with the exceedingly unreliable quality of the vehicles. Due to the constraints of electric bus technology, existing bus transportation planning challenges require further modification. A vehicle schedule must start and end at the same depot, and the number of vehicles available at each depot is restricted. The scheduling of electric vehicles is acknowledged as an emerging study domain. Perumal et al. [45] examined 43 papers about electric bus technology and delineated various challenges in the electric bus planning process (strategic, tactical, and operational). The challenges encompass investment in the electric bus fleet and charging infrastructure; the positioning of charging infrastructure; the electric vehicle scheduling problem (E-VSP); and the charging scheduling problem. The E-VSP seeks to determine a vehicle schedule that accommodates a series of scheduled trips and charging stations, fulfilling the range and charging prerequisites of electric buses while minimizing the operational expenses. Figure 7 collocates the level of service frequency satisfaction results.

5.4. Final Results

The integration of indicators from the questionnaire survey and the literature research has established a robust foundation for creating a complete evaluation system for electric buses. Emphasizing factors like the passenger demand, scheduling of the bus, and route dependability demonstrates a significant connection with current public transit requirements. Figure 8 graphically depicts the interconnections of the indicators among transportation systems to show us the relation between all these indicators.
Given the varied passenger demands, electric buses need to have adequate passenger capacity and ensure optimal noise and NVH performance during operation, as these factors directly influence the passenger experience, thereby affecting the public’s acceptance and usage frequency of the transportation system. Consequently, cost serves as a critical metric of system efficiency, encompassing vehicle acquisition, operation and maintenance, and energy utilization. Cost control is an extension of fulfilling passenger demand and a need for the sustainable growth of transportation systems.
Alongside the passenger demand, there are several systemic factors that facilitate operations, such as the state of the current bus fleet, the design of bus routes, and the influence of electrification trends on the power grid. In total, these parameters establish the foundation for the actual operating circumstances and impose limitations on vehicle layouts and operational methodologies.
The fleet composition requires the selection of vehicle body construction, energy source, powertrain, and various battery systems based on the usage environment and operational objectives. Diverse technical alternatives will influence the energy consumption, maintenance service needs, maximum range, and reliance on infrastructure. The maintenance and service of the vehicle are equally significant, as they are linked to operational and charging opportunities. To prevent operational interruptions and efficiency decline, it is crucial to synchronize the charge-related variables, such as charging durations, with the vehicle scheduling and servicing timeframes.
Even though some connections in the diagram, like the one between “grid effects” and “energy consumption”, might make things seem simpler than they are, this simplification helps us explore and improve how we measure these factors. The diagram serves as both a useful conceptual framework and a catalyst for more comprehensive modeling and systematic investigation of essential factors.

6. Results and Discussions

Using electric substitutes for aging diesel fleets presents a chance to increase the operating efficiency and lower the environmental impact. This change not only fits with worldwide sustainability targets but also solves urgent operational problems, including the expensive maintenance costs and reduced dependability linked with older diesel buses. It is crucial to incorporate the technical features of electric vehicles, like the rapid charging capabilities, sophisticated dispatch systems, and compatibility with renewable energy sources, which are vital for enhancing green public transportation. A comprehensive and empirical evaluation framework for operational performance indicators must be established by multifaceted data analysis, incorporating industry standards and practical application requirements. This will enable bus selection and technological improvement while promoting standardization and sustainable development in the sector.
Public transport authorities can lower emissions, improve customer happiness with smoother and quieter journeys, and guarantee compliance with ever stricter environmental rules by substituting younger fleets. Then, stepwise modernization lets transit managers progressively incorporate electric buses, therefore maximizing routes and schedules and balancing financial restrictions.
Taking into consideration numerous elements, such as the bus stop distance and energy efficiency, Szilassy et al. assessed the fit between bus routes and electric buses using the TOPSIS (technique for order of preference by similarity to ideal solution) [46] approach. This approach is meant to maximize the path of electric buses, therefore enhancing their practical use in urban transportation systems. Using a multi-criteria decision analysis technique, Földes et al. created a compliance metric determining method to evaluate the fit of electric buses on particular bus routes [47]. The study included route-specific as well as vehicle-specific factors; a case study was carried out in Budapest analyzing 30 buses and 58 bus lines. Finally, the findings reveal that more powerful electric buses clearly benefit ramps and high-capacity routes.
The survey data offers comprehensive validation of the chosen assessment markers, demonstrating distinct relationships between passenger preferences and operational necessities. In the context of the mechanical indicators, more than 80% of respondents identified the environmental effect and comfort as primary goals, hence affirming the importance of electric powertrains and enhanced NVH performance. The poll revealed significant issues, including the charging duration and infrastructural deficiencies, with 65% of participants emphasizing the need for strategically designed charging solutions. Concerning the transit system elements, participants emphatically endorsed fleet modernization, with widespread backing for phased replacement schemes to guarantee compatibility with service requirements and infrastructure preparedness.

7. Conclusions

The importance of this work lies in using the research as a foundation for the identification of passenger-oriented assessment indicators, therefore guiding later improvement of the theory. As a result, the real automobile experience becomes more and more importance. This, in turn, considers elements such as the purchase costs, residual revenue, operating costs, infrastructure investment, and demand charges, as well as the fleet planning.
This research represents a crucial advancement in creating a thorough, passenger-centric assessment methodology for electric buses inside public transportation systems. Data obtained via questionnaires were utilized to define and validate key performance metrics. This study categorizes the key performance indicators into three criteria—mechanical, operational, and public transport system—that affect the implementation of electric buses. The actual data obtained from the survey substantiates the significance of the chosen variables. Passenger feedback underscores the increasing desire for sustainable, dependable, and comfortable transportation alternatives, affirming the congruence between customer expectations and the fundamental characteristics of electric buses. These insights substantiate the conclusion that electric buses provide significant potential to address modern transportation requirements.
This study recognizes the need to utilize MCDA in order to evaluate and rank the various bus systems. However, the fundamental purpose of this research is to develop a framework for assessment that is passenger-centered and realistically informed. This will allow for the establishment of a foundation for other types of analyses. The purpose of this study is not to assume that certain criteria have been predetermined by experts; rather, it incorporates direct feedback from one hundred transit users using a structured survey. This allows for the identification of real-world issues and priorities across three dimensions: mechanical indications, operational performance, and system-level circumstances.
This research makes a contribution to policy and planning by, among other things, predefining indicators and weights, as is the case with many MCDA-based studies:
  • Anchoring the KPI selection in public acceptability to augment the social legitimacy of forthcoming judgements.
  • Discovering implicit factors frequently omitted in conventional MCDA—such as the safety perception and readiness to invest in environmental advantages.
  • Offering a reproducible mechanism for transportation agencies to revise indicator sets in accordance with changing user preferences.
The survey results confirm the significance of the chosen evaluation indicators. The passenger demand for sustainable, dependable, and comfortable transportation corresponds with the chosen criteria, highlighting the capability of electric buses to fulfill contemporary transit requirements. This reinforces the potential of electric buses to meet modern transit needs.
It also highlights the need to incorporate real-world user experiences into performance evaluations. This human-centered perspective facilitates a more sophisticated comprehension of the trade-offs associated with electric bus planning, encompassing the acquisition costs, operational expenditures, residual value, and infrastructure investments.
The survey framework and resultant indicator tree provide a robust basis for forthcoming MCDA models (e.g., AHP, TOPSIS), enabling decision-makers to allocate weights and evaluate the performance of diesel, hybrid, and electric systems within actual operating limitations. This research addresses a significant preliminary need, guaranteeing that any MCDA implemented is both technically sound and attuned to the context and user needs.
This work, while not performing the whole MCDA sequencing, advances scientific knowledge by focusing on the sometimes neglected yet essential initial phase of MCDA: the empirical selection and validation of decision criteria from the viewpoint of real transit users.
At the same time, the findings establish a solid foundation for additional research focused on enhancing evaluation techniques and facilitating evidence-based decision-making in forthcoming urban transit planning. Ongoing investigation in this domain is warranted and essential to guarantee the effective incorporation of electric buses into intricate and dynamic transportation systems. Given these findings, a deeper exploration of the topic is both relevant and worthwhile [48]. It is prudent to pursue an in-depth examination of this topic.

Author Contributions

Methodology: X.L.; writing—original draft preparation, X.L.; writing—review and editing, Á.W. and B.H.; visualization, X.L.; supervision, Á.W. and B.H. All authors have read and agreed to the published version of the manuscript.

Funding

This research received no external funding.

Data Availability Statement

Data is available upon request at the corresponding author.

Conflicts of Interest

The authors declare no conflict of interest.

References

  1. Intercity Electric Buses: Current Landscape and Future Prospects in Europe. European Alternative Fuels Observatory. Available online: https://alternative-fuels-observatory.ec.europa.eu/general-information/news/intercity-electric-buses-current-landscape-and-future-prospects-europe (accessed on 18 November 2024).
  2. Global EV Data Explorer—Data Tools. IEA. Available online: https://www.iea.org/data-and-statistics/data-tools/global-ev-data-explorer (accessed on 18 November 2024).
  3. UITP SORT & E-SORT Brochures. UITP. Available online: https://www.uitp.org/publications/uitp-sort-e-sort-brochures/ (accessed on 24 November 2024).
  4. GB/T 18385-2005 (GB/T 18385-2024 Newer Version) PDF English. Available online: https://www.chinesestandard.net/PDF.aspx/GBT18385-2005 (accessed on 24 November 2024).
  5. Gao, Z.; Lin, Z.; LaClair, T.J.; Liu, C.; Li, J.M.; Birky, A.K.; Ward, J. Battery capacity and recharging needs for electric buses in city transit service. Energy 2017, 122, 588–600. [Google Scholar] [CrossRef]
  6. Basma, H.; Mansour, C.; Haddad, M.; Nemer, M.; Stabat, P. Energy consumption and battery sizing for different types of electric bus service. Energy 2022, 239, 122454. [Google Scholar] [CrossRef]
  7. Jwa, K.; Lim, O. Comparative life cycle assessment of lithium-ion battery electric bus and Diesel bus from well to wheel. Energy Procedia 2018, 145, 223–227. [Google Scholar] [CrossRef]
  8. Kiciński, M.M.; Solecka, K. Application of MCDA/MCDM methods for an integrated urban public transportation system—Case study, city of Cracow. Arch. Transp. 2018, 46, 71–84. [Google Scholar] [CrossRef]
  9. Hu, X.; Zheng, M.; Zhao, J.; Gao, R.; Li, B.; Chen, X.; Dai, G. Research on Application Performance Index System of Pure Electric Buses Based on Extensible Cloud Model. World Electr. Veh. J. 2022, 13, 45. [Google Scholar] [CrossRef]
  10. Rivero Gutiérrez, L.; De Vicente Oliva, M.A.; Romero-Ania, A. Economic, Ecological and Social Analysis Based on DEA and MCDA for the Management of the Madrid Urban Public Transportation System. Mathematics 2022, 10, 172. [Google Scholar] [CrossRef]
  11. Hamurcu, M.; Eren, T. Electric Bus Selection with Multicriteria Decision Analysis for Green Transportation. Sustainability 2020, 12, 2777. [Google Scholar] [CrossRef]
  12. Basma, H.; Mansour, C.; Haddad, M.; Nemer, M.; Stabat, P. Comprehensive energy modeling methodology for battery electric buses. Energy 2020, 207, 118241. [Google Scholar] [CrossRef]
  13. Borén, S. Electric buses’ sustainability effects, noise, energy use, and costs. Int. J. Sustain. Transp. 2020, 14, 956–971. [Google Scholar] [CrossRef]
  14. Gallet, M.; Massier, T.; Hamacher, T. Estimation of the energy demand of electric buses based on real-world data for large-scale public transport networks. Appl. Energy 2018, 230, 344–356. [Google Scholar] [CrossRef]
  15. Potkány, M.; Hlatká, M.; Debnár, M.; Hanzl, J. Comparison of the Lifecycle Cost Structure of Electric and Diesel Buses. NAŠE MORE Znan. Časopis More Pomor. 2018, 65, 270–275. [Google Scholar] [CrossRef]
  16. Lajunen, A. Lifecycle costs and charging requirements of electric buses with different charging methods. J. Clean. Prod. 2018, 172, 56–67. [Google Scholar] [CrossRef]
  17. Barraza, O.; Estrada, M. Battery Electric Bus Network: Efficient Design and Cost Comparison of Different Powertrains. Sustainability 2021, 13, 4745. [Google Scholar] [CrossRef]
  18. Li, J.Q. Battery-electric transit bus developments and operations: A review. Int. J. Sustain. Transp. 2016, 10, 157–169. [Google Scholar] [CrossRef]
  19. UN Regulation No. 107—Rev.7|UNECE. Available online: https://unece.org/transport/documents/2021/05/standards/un-regulation-no-107-rev7 (accessed on 27 November 2024).
  20. Zhang, G.; Zhang, H. Research of the electric vehicle safety. In Proceedings of the World Automation Congress 2012, Puerto Vallarta, Mexico, 24–28 June 2012; pp. 1–4. Available online: https://ieeexplore.ieee.org/abstract/document/6321145 (accessed on 4 March 2024).
  21. Indu, K.; Aswatha Kumar, M. Electric Vehicle Control and Driving Safety Systems: A Review. IETE J. Res. 2023, 69, 482–498. [Google Scholar] [CrossRef]
  22. Regulation No. 100 Rev.3|UNECE. Available online: https://unece.org/transport/documents/2022/03/standards/regulation-no-100-rev3 (accessed on 27 November 2024).
  23. GB 18384-2020 PDF in English. Available online: https://www.chinesestandard.net/PDF.aspx/GB18384-2020 (accessed on 27 November 2024).
  24. Gandoman, F.H.; Ahmadi, A.; Van den Bossche, P.; Van Mierlo, J.; Omar, N.; Nezhad, A.E.; Mavalizadeh, H.; Mayet, C. Status and future perspectives of reliability assessment for electric vehicles. Reliab. Eng. Syst. Saf. 2019, 183, 1–16. [Google Scholar] [CrossRef]
  25. Shu, X.; Yang, W.; Guo, Y.; Wei, K.; Qin, B.; Zhu, G. A reliability study of electric vehicle battery from the perspective of power supply system. J. Power Sources 2020, 451, 227805. [Google Scholar] [CrossRef]
  26. Davidov, S.; Pantoš, M. Planning of electric vehicle infrastructure based on charging reliability and quality of service. Energy 2017, 118, 1156–1167. [Google Scholar] [CrossRef]
  27. Meishner, F.; Uwe Sauer, D. Technical and economic comparison of different electric bus concepts based on actual demonstrations in European cities. IET Electr. Syst. Transp. 2020, 10, 144–153. [Google Scholar] [CrossRef]
  28. Lee, J.; Oh, S.; Son, S. Optimal battery electric bus planning and its economic and environmental impacts. Transp. Res. Part D Transp. Environ. 2023, 122, 103821. [Google Scholar] [CrossRef]
  29. Mahmoud, M.; Garnett, R.; Ferguson, M.; Kanaroglou, P. Electric buses: A review of alternative powertrains. Renew. Sustain. Energy Rev. 2016, 62, 673–684. [Google Scholar] [CrossRef]
  30. Gabsalikhova, L.; Sadygova, G.; Almetova, Z. Activities to convert the public transport fleet to electric buses. Transp. Res. Procedia 2018, 36, 669–675. [Google Scholar] [CrossRef]
  31. Hwangbo, H.; Kim, J.; Kim, S.; Ji, Y.G. Toward Universal Design in Public Transportation Systems: An Analysis of Low-Floor Bus Passenger Behavior with Video Observations. Hum. Factors Ergon. Manuf. 2015, 25, 183–197. [Google Scholar] [CrossRef]
  32. Barabino, B.; Eboli, L.; Mazzulla, G.; Mozzoni, S.; Murru, R.; Pungillo, G. An innovative methodology to define the bus comfort level. Transp. Res. Procedia 2019, 41, 461–470. [Google Scholar] [CrossRef]
  33. Al-Ogaili, A.S.; Al-Shetwi, A.Q.; Sudhakar Babu, T.; Hoon, Y.; Abdullah, M.A.; Alhasan, A.; Al-Sharaa, A. Electric Buses in Malaysia: Policies, Innovations, Technologies and Life Cycle Evaluations. Sustainability 2021, 13, 11577. [Google Scholar] [CrossRef]
  34. Zhou, B.; Wu, Y.; Zhou, B.; Wang, R.; Ke, W.; Zhang, S.; Hao, J. Real-world performance of battery electric buses and their life-cycle benefits with respect to energy consumption and carbon dioxide emissions. Energy 2016, 96, 603–613. [Google Scholar] [CrossRef]
  35. Li, L.; Zhang, Y.; Yang, C.; Yan, B.; Marina Martinez, C. Model predictive control-based efficient energy recovery control strategy for regenerative braking system of hybrid electric bus. Energy Convers. Manag. 2016, 111, 299–314. [Google Scholar] [CrossRef]
  36. Smart, M.C.; Ratnakumar, B.V.; Whitcanack, L.; Chin, K.; Rodriguez, M.; Surampudi, S. Performance characteristics of lithium ion cells at low temperatures. IEEE Aerosp. Electron. Syst. Mag. 2002, 17, 16–20. [Google Scholar] [CrossRef]
  37. Shiau, T.A.; Liu, J.S. Developing an indicator system for local governments to evaluate transport sustainability strategies. Ecol. Indic. 2013, 34, 361–371. [Google Scholar] [CrossRef]
  38. Göhlich, D.; Fay, T.A.; Jefferies, D.; Lauth, E.; Kunith, A.; Zhang, X. Design of urban electric bus systems. Des. Sci. 2018, 4, e15. [Google Scholar] [CrossRef]
  39. Chen, Z.; Yin, Y.; Song, Z. A cost-competitiveness analysis of charging infrastructure for electric bus operations. Transp. Res. C-Emerg. Technol. 2018, 93, 351–366. [Google Scholar] [CrossRef]
  40. Sebastiani, M.T.; Lüders, R.; Fonseca, K.V.O. Evaluating Electric Bus Operation for a Real-World BRT Public Transportation Using Simulation Optimization. IEEE Trans. Intell. Transp. Syst. 2016, 17, 2777–2786. [Google Scholar] [CrossRef]
  41. Pelletier, S.; Jabali, O.; Mendoza, J.E.; Laporte, G. The electric bus fleet transition problem. Transp. Res. Part C Emerg. Technol. 2019, 109, 174–193. [Google Scholar] [CrossRef]
  42. Chao, Z.; Xiaohong, C. Optimizing Battery Electric Bus Transit Vehicle Scheduling with Battery Exchanging: Model and Case Study. Procedia Soc. Soc. Behav. Sci. 2013, 96, 2725–2736. [Google Scholar] [CrossRef]
  43. Mohamed, M.; Farag, H.; El-Taweel, N.; Ferguson, M. Simulation of electric buses on a full transit network: Operational feasibility and grid impact analysis. Electr. Power Syst. Res. 2017, 142, 163–175. [Google Scholar] [CrossRef]
  44. Paul, T.; Yamada, H. Operation and charging scheduling of electric buses in a city bus route network. In Proceedings of the 17th International 977 IEEE Conference on Intelligent Transportation Systems (ITSC), Qingdao, China, 8–11 October 2014; pp. 2780–2786. [Google Scholar] [CrossRef]
  45. Perumal, S.S.G.; Lusby, R.M.; Larsen, J. Electric bus planning & scheduling: A review of related problems and methodologies. Eur. J. Oper. Res. 2022, 301, 395–413. [Google Scholar] [CrossRef]
  46. Szilassy, P.Á.; Földes, D. Compliance indicator determination method to match electric buses with bus lines. Heliyon 2024, 10, e38321. [Google Scholar] [CrossRef]
  47. Szilassy, P.Á.; Földes, D. Compliance Indicator Determination Method to Match Electric Buses with Routes; Social Science Research Network: Rochester, NY, USA, 2023; 4594506. [Google Scholar] [CrossRef]
  48. Manzolli, J.A.; Trovão, J.P.; Antunes, C.H. A review of electric bus vehicles research topics—Methods and trends. Renew. Sustain. Energy Rev. 2022, 159, 112211. [Google Scholar] [CrossRef]
Figure 1. Electric bus sales in the EU 27 [2].
Vehicles 07 00058 g001
Figure 2. Age of respondents.
Vehicles 07 00058 g002
Figure 3. Career of respondents.
Vehicles 07 00058 g003
Figure 4. Residence place of respondents.
Vehicles 07 00058 g004
Figure 5. Time travel period of respondents.
Vehicles 07 00058 g005
Figure 6. Vehicle type preference of respondents.
Vehicles 07 00058 g006
Figure 7. Satisfaction level.
Vehicles 07 00058 g007
Figure 8. Affiliation between indicators.
Vehicles 07 00058 g008
Table 1. Indicator calculation approach.
Indicator CategoryExample IndicatorsCalculation
Vehicle bodyStructural type, travel partied of respondents based on survey.
Mechanical indicatorsEnergy typeElectric/diesel/hybrid, vehicle preferences from survey.
NVHUser feedback.
Battery systemBattery capacity (kWh), type (Li-ion, LFP, etc.).
Required infrastructureNumber/type of charging stations.
Passenger capacityOfficial specifications
CostLife-cycle cost analysis.
Operational indicatorsCharging timeTime to full charge under standard power (kW), driver feedback.
RangeMax distance per full charge, driver’s feedback.
Maintenance and serviceAnnual maintenance cost or downtime hours, driver feedback.
Energy consumptionkWh/km from operation logs/simulation.
Passenger demandDaily operational data or estimated peak load, can be analysis from the survey.
Existing bus fleetInventory data from transit agency.
RoutesNumber of lines served, route lengths, frequency, user feedback.
Bus transportation system indicatorsGrid impactEstimated peak load per depot; assessed via power demand modeling.
Operating and charging opportunitiesAvailability of time/space for mid-route charging.
Scheduling of the vehiclesHeadway times, timetable optimization data.
Charging timeTime to full charge under standard power (kW), driver feedback.
ReliabilityMean time between failures, driver feedback.
Disclaimer/Publisher’s Note: The statements, opinions and data contained in all publications are solely those of the individual author(s) and contributor(s) and not of MDPI and/or the editor(s). MDPI and/or the editor(s) disclaim responsibility for any injury to people or property resulting from any ideas, methods, instructions or products referred to in the content.

