Abstract
Reduced gravity may impair motion perception accuracy, especially in the absence of visual cues, which could degrade astronauts’ driving performance. The lack of prior research makes simulating realistic motion perception for lunar rover driving particularly challenging. We created a simulation system to quantitatively simulate the motion characteristics of a lunar rover at different gravity levels, and a software program based on the spatial orientation observer model was developed for the comparison of motion perception differences between Earth’s and lunar gravity. In comparison to Earth’s gravity, the lunar rover in lunar gravity demonstrates the following differences: (1) The rover exhibits a greater propensity to float and slip, and slower acceleration and deceleration. (2) Dynamic tilt perception may be more complicated with single vestibular information, while static tilt perception is greatly reduced; the introduction of visual information can notably improve the perception accuracy. Simulation results demonstrate that motion characteristics and perception of lunar rover driving exhibit a more variable trend at different gravity levels. An intuitive mathematical formulation was proposed to explain the single vestibular results. Our findings provide a basis for further optimizing lunar rover driving motion simulation strategies.
1. Introduction
Astronauts may experience long periods of microgravity in their space flight and low gravity through the lunar exploration missions. Studies have shown that reduced gravity environments lead to an increase in the underestimation of tilt perception, resulting in insufficient control inputs in active scenarios [1]. Another study also indicated that manual control precision was degraded when supine subjects were exposed to a simulated hypo-gravity environment [2]. While Apollo 15 astronauts completed a task in 10 min during 1-g training, execution time on the Moon increased by 63% [3]. This increase in time reflects the overall impact of the lunar environment on task execution. Thus, it is of significance for astronauts undergoing sufficient ground training before their spaceflights and especially for the manual control task.
The manned lunar rover will greatly expand the scope of astronauts’ exploration on the lunar surface. To ensure the driving safety and stability, manually driving a lunar rover requires astronauts’ constant attention, leading to high accuracy standards for motion perception. The only manned lunar rover driving that has been implemented so far was during the Apollo mission, using the Lunar Roving Vehicle (LRV). Due to technological limitations, the driving training mainly relied on a ground-driven car called the 1-g trainer, which was designed to replicate handling characteristics of the actual rover and attempt to duplicate movement in one-sixth of Earth’s gravity [4]. According to the reports of the Apollo crewmembers, there are two noticeable differences between driving the lunar rover and the 1-g trainer [5]. One is the braking distance for the former, which is approximately twice that of the latter; the other one is the former, which is very “floating” in comparison to the latter, and the sideslip frequently occurs when turning at speeds above 5 km/h. Consequently, driving a lunar rover differs significantly from the 1-g simulation. Furthermore, adequate warnings for obstacles, such as lunar craters and rocks, are needed for astronauts, to adjust the rover’s speed and direction timely to reduce sideslip and maintain the stability of the rover. All the above require a higher level of accuracy in the driving operations of the astronauts.
Accurate simulation of motion characteristics during preflight training is crucial for enhancing the safety and precision of astronauts operating lunar rovers. Although it is not possible to replicate the precise gravitational conditions of the Moon on Earth, it is possible to create a motion perception that closely resembles that experienced on the Moon [6,7,8]. However, previous reports from Apollo missions only provided qualitative observations but lacked the necessary quantitative descriptions of the discrepancies in motion perception between driving a lunar rover on Earth and on the Moon. This is an area that remains under-researched, which presents a significant challenge but is also crucial for the development of effective motion simulation strategies.
The observer model for spatial orientation and motion perception simulation, which is based on the state-observer framework, is an important tool in the study of motion perception. It establishes the quantitative mathematical relationship between the input and output of sensory organs in the perceptual process [9,10]. The most common spatial orientation models related to motion perception in the literature are based on the vestibular system [11,12]. Vestibular cues play an important role in motion perception, and include two components: otoliths sensing gravity and inertial force, and semicircular canals, which sense rotational motion but whose output is proportional to rotational velocity. By modeling the physical dynamics of vestibular receptors and their corresponding internal models, the observer model can explain how neural systems integrate afferent sensory information to estimate linear acceleration, rotational velocity and gravity. A visual-vestibular model was incorporated into the original observer model framework, thereby extending the model’s capabilities to predict orientation, position, and linear velocity [13]. Similarly, accurate internal models for this visual processing were added. The observer model has been effectively used to predict human orientation and motion perception, even for complex paradigms such as off-vertical-axis rotation (OVAR), subjective vertical (SV), and some unusual motion perception including spatial disorientation, the tilt-gain, and tilt-translation illusions in the aerospace environment [11].
It is worthy of note that a modification of the observer model was recently proposed. In this modification, the resulting errors between the sensory dynamics and internal models in the otolith organ sense are differentially weighted in the different axes of the coordinate system. This modification has been experimentally demonstrated to effectively predict some scenarios in altered gravity, such as dynamic roll tilt in hyper-gravity and static roll tilt in a hypo-gravity analogue [7,11].
It has also been used to simulate lunar landing motions to predict astronauts’ perception of vehicle orientation and identify disorientating maneuvers [14]. The study concluded that the motions experienced during lunar landing may create potential orientation misperceptions, particularly when visual pathways were deactivated in the model. Visual cues were seen to reduce these misperceptions, but the visual scenario during lunar landing may have additional limitations not modeled in the study. However, in comparison to the relatively predictable motion of a lunar lander, the motion of a lunar rover exhibits a greater degree of unpredictability and dynamic maneuvers. This could potentially complicate human orientation and motion perception when adapting to a novel gravitational environment.
The objective of this study was to identify and analyze the differences in motion characteristics and motion perception between driving a lunar rover on Earth and the Moon. A lunar rover driving simulation system was constructed, and motion perception software was developed based on Newman’s spatial orientation observer model. Subsequently, a motion simulation of a lunar rover driving under Earth and lunar conditions was performed. Finally, the Earth–Moon perception differences were quantitatively simulated and compared. Based on the simulation results, suggestions for the motion simulation strategy of lunar rover driving were proposed.
2. Materials and Methods
Figure 1 illustrates the comprehensive simulation process. Initially, a simulation system for lunar rover driving was employed to simulate and compare the discrepancies in motion characteristics between Earth and lunar conditions. The accurate simulation of motion characteristics is a fundamental prerequisite for the prediction of motion perception. Subsequently, using the observer model, a comparison of the motion perceptions of lunar rover driving was conducted between Earth and lunar conditions. The motion data was generated by the lunar simulation system in lunar gravity, reflecting actual rover movement. This data serves as the input for the motion perception software, as illustrated in Figure 1.
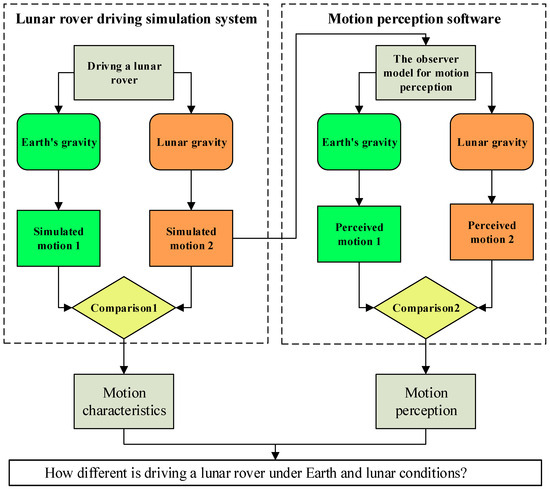
Figure 1.
The comprehensive simulation process in our work.
2.1. Lunar Rover Driving Simulation System
We developed lunar terrain generation software using the Unity rendering engine. A much more realistic simulation of the lunar surface data was achieved by using a digital elevation model (DEM) and a digital orthophoto map (DOM). A DEM is a digital model of the Moon’s surface in terms of elevation, while a DOM is a digital map that combines the image characteristics of a photograph with the geometric qualities of a map. Utilizing the Chang’e-2 20 m resolution DEM and 7 m resolution DOM as foundational components, and incorporating the LRO (NASA’s Lunar Reconnaissance Orbiter) meter-level resolution DOM as supplementary data, we constructed a detailed three-dimensional terrain with a 0.1 m resolution DEM and DOM. The primary processes involved are Kriging interpolation, texture rendering, crater and rock modeling, as well as their distribution modeling. We applied Kriging interpolation to generate higher-resolution lunar terrain. Kriging is a popular geostatistical interpolation method that uses existing terrain data to predict unknown points and generate a new terrain [15]. It utilizes the covariance function and variogram to estimate unknown points by forming a weighted linear combination of surrounding known data points. The weights are determined by minimizing the prediction variance, which is a measure of how well the variogram (a statistical description of the spatial correlation between data points) fits the covariance function. This process of interpolation is iterated until a continuous and resolution-compliant terrain surface is achieved. The color and texture characteristics were rendered based on the lunar surface images from the Chang’e-3’s Yutu rover navigation camera. Additionally, craters and rocks of varying sizes were generated based on Lunar size-frequency distribution models [16,17]. The depth-to-diameter ratio of the crater was estimated using an empirical formula based on statistical results of the Chang’e-4 landing zone [18]. To meet the requirements of the driving simulation in this work, the lunar terrain was generated within a 1 km × 1 km range.
A three-dimensional digital model of the lunar rover was constructed to emulate the similar machine structure of LRV. To improve the accuracy of the model’s dynamic simulation, the parameters of the commercial vehicle dynamics simulation software [19] were calibrated to align with the specifications of the lunar rover, encompassing factors such as mass, suspension travel, engine torque, and others. Additionally, the wheel–soil dynamics were simulated using the Unity physics engine [20], designed to replicate the motion characteristics of the lunar rover across various speeds and gravity levels. The primary parameters representing the physical properties of the wheel–soil interface include dynamic friction, static friction, elasticity and spring stiffness. Moreover, to ensure the precision of the simulation, the virtual lunar rover is equipped with two control modes: manual operation via a T-handle controller and autonomous navigation along a predefined route. A stability control function has been incorporated into the vehicle to ensure stable operation by regulating the output torque and controlling the vehicle speed. Figure 2 illustrates the lunar rover driving visual scene generated by our simulation system.
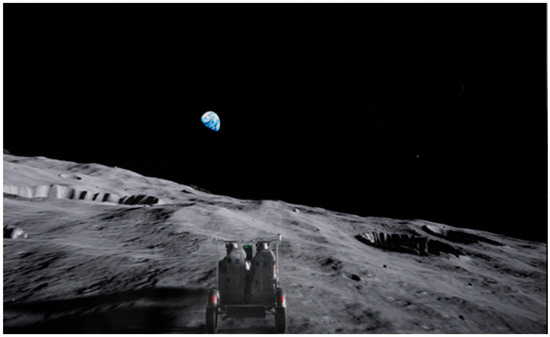
Figure 2.
Lunar rover driving visual scene generated by our simulation system.
The key parameters of the lunar rover model and their values are listed in Table 1. As detailed motion data for the manned lunar rover is not available, our model validation was conducted in two aspects. First, a quantitative comparison of the vehicle dynamics was made between our simulation system and professional dynamics software (Automatic Dynamic Analysis of Mechanical Systems, ADAMS) for a total of four typical driving items, including crossing a 0.15 m high obstacle at 3 km/h, crossing a 0.4 m deep pit at 1 km/h, climbing up a 20° slope, and turning. ADAMS is a widely used multi-body dynamics simulation software that includes a professional vehicle simulation module. After configuring the vehicle model to align with our simulation system, the resulting dynamics simulation was used as a reference for validating the model. The results indicate that the motion trends reveal a convergence of the results obtained from the simulation system and those of ADAMS, and the difference in amplitude is no more than 10% on average. Second, the simulation system was utilized to generate a scene as the video of Apollo astronauts driving the LRV, and our rover was driven according to its route. Based on the visualization of the overall rover motion, it appears that they are quite close in terms of acceleration and deceleration, steering, and collision response with the lunar surface.

Table 1.
Key parameters and their values for the lunar rover model.
2.2. Motion Perception Software
The motion perception software we adopted takes the observer model as reference [13,21]. To improve the accuracy and comprehensiveness of the simulation, we developed a model that integrates visual and vestibular perception. We use distinct weight values for different axes of the otolith model, and introduce the effect of the idiotropic vector. Furthermore, to improve the computational efficiency, we use C++ programs (Qt 5.12) to implement all model functions instead of Matlab R2023b, which is used in Newman’s initial model. We tested all vestibular and visual-vestibular illusions mentioned in Newman’s paper and obtained consistent results, confirming the accuracy of our model.
The model framework is shown in Figure 3, which is divided into vestibular sensory pathways (OTO, SCC) and visual sensory pathways, and the latter consists of positional inputs (VISp, VISv) and rotational inputs (VISω, VISg). The motion inputs pass through physical models representing sensory dynamics (yellow frames), and internal models (purple frames) representing central nervous system estimates. These internal models and their associated input–output variables are all marked with the symbol of “ˆ” at the top. The head-fixed coordinate system is used, where the X-axis is aligned with the naso-occipital axis, the Y-axis corresponds to the interaural axis, and the Z-axis is the cephalocaudal axis. Bold signal labels in the figure are representative of three-dimensional vectors.
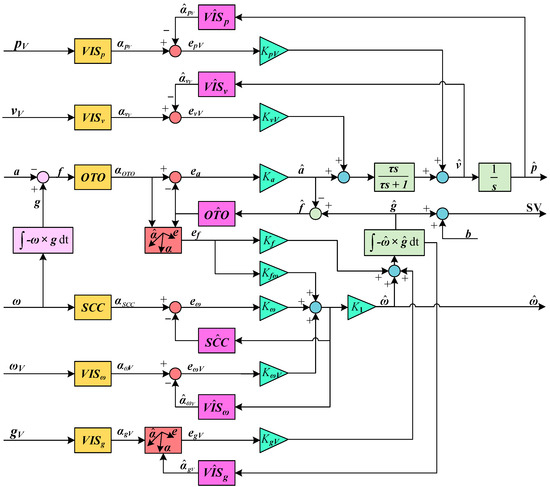
Figure 3.
The observer model for human spatial orientation perception simulation.
The vestibular pathways consist of the otolith and semicircular canal models, which receive three-dimensional vectors of linear acceleration (a) and angular velocity (ω). The otolith model takes specific force (f = g − a) as input. Head rotations (ω) yield a change in gravity in the head-fixed reference frame (), and thus the gravity (g) can be calculated by the above equation. The transfer function (OTO) is set to unity. The semicircular canal model takes angular velocity (ω) as input, and its transfer function (SCC) is a second-order high-pass filter with a long time constant of 5.7 s and a neural adaptation time constant of 80 s. The visual pathways consist of four inputs: visual position (pV), linear velocity (vV), angular velocity (ωV), and gravity (gV). The transfer functions (VISp, VISv, VISω, VISg) for all of these inputs are unity for simplicity. The activation or deactivation of visual pathways depend on environmental conditions. The outputs of the transfer functions are the efferent signals of the otoliths (αOTO), semicircular canals (αSCC), and visual models (αpV, αvV, αωV, αgV).
The central nervous system compares the efferent signals from the semicircular canals, otoliths, and visual models with the expected values estimated by their corresponding internal sensory models (, , ,
,
, , ). The resultant error signals (ea, ef, eω, epv, evv, eωv, egv) are modulated by nine corresponding weighting parameters (Kω, Ka, Kf, Kfω, K1, KpV, KvV, KωV, KgV). The term Ka represents the weighting of the otolith error, which varies between the utricular plane (Kau) and its perpendicular counterpart (Kau⊥). These weighting parameters are free variables, but the values presented in Table 2 are widely used. This set of values has been experimentally validated and can effectively predict most perceptions, including tilt perception in hyper-gravity and hypo-gravity [11]. The model outputs are perceived linear acceleration (), gravity (), and angular velocity (). It can also estimate linear velocity () and position ().
Table 2.
Parameter values for the spatial orientation perception model.
In the observer model, our focus is on the part that is influenced by variations in gravity: the specific force model and the subjective vertical (SV) model. Both are incorporated into the observer model and our software. According to the spatial orientation model, when visual information is not considered, the perception of body tilt angle is primarily determined by a specific force, which is also known as the gravito-inertial force (GIF). The model is employed to elucidate the somatogravic illusion [14], otherwise known as tilt translation ambiguity [22]. Figure 4A illustrates the specific force model. In the absence of visual information, humans tend to perceive the specific force as gravity. Consequently, the angle between the specific force and the body’s longitudinal axis is the perceived tilt angle. The specific force model is inapplicable in the static tilt when linear acceleration (a) and angular velocity (ω) are close to zero; however, the tilt angle perception remains biased (typically underestimated). In such a case, the SV model plays a significant role [21].
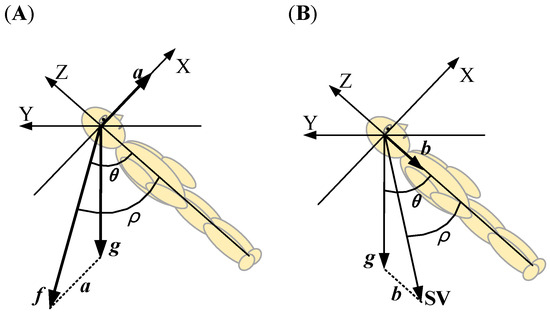
Figure 4.
Schematic interpretation of the specific force model and the subjective vertical model. (A) Tilt angle perception based on the specific force model (f = g − a). g denotes the gravitational force. f denotes the specific force. a denotes the head linear acceleration. The angle θ is the body tilt angle, and ρ denotes the perceived tilt angle. (B) Tilt angle perception based on the subjective vertical model (SV = g + b), without considering vision. b denotes the idiotropic vector aligned with the longitudinal axis of the body. The head-fixed coordinate system is used, in which the X-axis is aligned with the naso-occipital axis, the Y-axis corresponds to the interaural axis, and the Z-axis is the vertical axis aligning with the longitudinal body axis.
SV is the subjective judgement of the body’s vertical and represents the internal representation of gravity. In addition to external visual and vestibular cues, our sense of verticality is also determined by an internal cue: a tendency to shift the SV towards the person’s own longitudinal axis, also known as the idiotropic vector [23]. It is independent of the rotation angle sensed by the vestibular system and its value has been empirically determined to be 0.2 g (where g represents the Earth’s gravity) [21,24]. The SV is the sum of three vectors, representing the perceived vertical. The angle between SV and the body’s longitudinal axis is the perceived static tilt angle, including pitch and roll. The idiotropic vector and the SV model are also introduced to the observer model. The SV model is illustrated in Figure 4B, without considering vision.
3. Results
3.1. Simulation Comparison of Motion Characteristics for Lunar Rover Driving
Using the lunar rover driving simulation system, we conducted a comparative analysis of the motion characteristics of a lunar rover on the ground and on the lunar surface. A 60 s driving simulation was conducted, and the rover operates in automatic drive mode along the designated path. The simulation system will drive the rover to reach its destination in the shortest possible time, provided that the vehicle functions in a stable manner. The conditions of the lunar rover were fixed, with a total mass of 500 kg, a maximum torque of 170 Nm, and a maximum speed of 16 km/h (4.4 m/s). The sole variable between the simulation settings was the magnitude of the gravitational force. The ground condition has a gravitational force of 9.8 m/s2, while the lunar surface condition has a gravitational force of 1.63 m/s2.
After analyzing the motion data of the lunar rover under different gravity conditions, we obtained the following three conclusions. First, the magnitude fluctuation range of the rover’s acceleration is smaller on the lunar surface than on the ground, and the total driving time is also longer. Figure 5A below shows the curves of forward acceleration and vertical acceleration under Earth and lunar conditions. Moreover, as illustrated in Table 3, a statistical comparison of the means and standard deviations of the acceleration data is presented. The standard deviations on the lunar surface are found to be smaller and demonstrate consistent trends in all three axes. Data in lunar conditions demonstrate smaller standard deviations and all three axes have consistent trends. Notably, significant differences are observed in forward acceleration (ax) and vertical acceleration (az). The results indicate that driving on the lunar surface feels more floating and less bumping than on the ground.
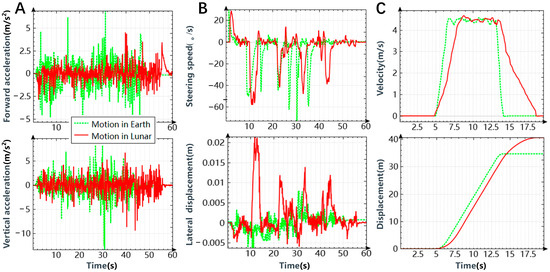
Figure 5.
Motion comparisons of lunar rover under simulated ground and lunar conditions. (A) Simulated curves of forward acceleration and vertical acceleration of lunar rover. (B) Simulation comparisons of lunar slip. (C) Simulation comparisons of lunar rover acceleration-deceleration.
Table 3.
Comparison of lunar rover accelerations under simulated Earth and lunar conditions.
Second, the rover exhibited significantly greater sideslip on the lunar surface (Figure 5B). The steering speed changed similarly in both simulations, implying that the rover performed comparable turning motions in both conditions, which is a prerequisite for comparing lateral displacements. Lateral displacement represents the change in lateral motion of the rover in the rover-fixed coordinate system, and its value is essentially unchanged when there is no sideslip and the rover is always moving along the steering direction. However, the values of the lateral displacements differ significantly, with the values on the lunar surface being more than twice as large as those on the ground.
Finally, the acceleration and deceleration of the lunar rover on the lunar surface are slower, resulting in a longer braking distance. Figure 5C illustrates a motion simulation in which the lunar rover accelerates for a specific duration before braking to a stop. The comparison shows that the rover’s velocity on the lunar surface increases and decreases more slowly than on Earth. Furthermore, when the rover comes to a stop, it has traveled a longer distance on the lunar surface, approximately 9 m, compared to the ground, where it travels only about 4 m.
3.2. Simulation Comparison of Motion Perception for Lunar Rover Driving
The differences in motion perception between Earth’s and lunar gravity are predicted and compared using the observer model. The motion of the rover is very dynamic and stochastic. To enhance the predictability and intuitiveness of the simulation and to incorporate static motion perception, four terrain elements of lunar rover driving (Obstacle, Upslope, Flat Road, and Downslope) were selected to create a regular simulated road. As illustrated in Figure 6A, the rover proceeded in a sequential manner to traverse a rectangular obstacle (0.2 m in height and 0.5 m in length), an upslope (with a 10° slope), a flat road, and a downslope (also with a 10° slope). It should be noted that the rover-fixed coordinate system is assumed to be aligned with the direction of the head-fixed coordinate system, while the deviation between the center of the lunar rover and the head is ignored.
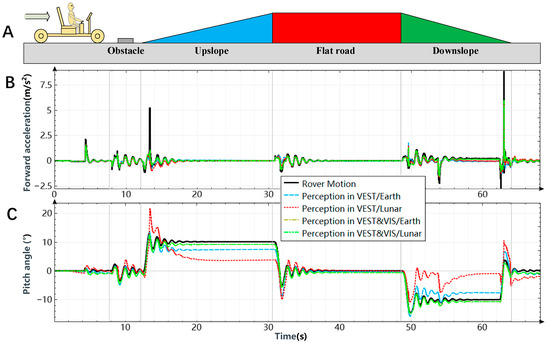
Figure 6.
Simulation comparison of lunar rover forward motion perception under regular terrain. (A) Schematic diagram of lunar rover route under regular terrain. (B) Simulation comparison of forward acceleration perception, shows no significant differences among the four conditions. (C) Simulation comparison of pitch angle perception, shows significant underestimation or overestimation of pitch in lunar condition. The lunar rover passes through four sections of Obstacle, Upslope, Flat road, and Downslope in turn in Figure (A), which are distinguished by different colors, and the corresponding motion perception curves in Figure (B,C).
The forward motion of the rover, including forward acceleration and pitch angle, was simulated under four conditions. To enhance the comprehensiveness of the simulation, a detailed perception comparison was conducted between the vestibule mode and the vestibule & vision mode in both Earth and lunar conditions. The gravity parameter of the observer model was set to 9.8 m/s2 to simulate Earth conditions and 1.63 m/s2 to simulate lunar conditions. Figure 6B,C show the motion perception simulation results for the forward acceleration and pitch angle of the rover (Rover Motion) under four conditions. The simulation includes four conditions, that is vestibule mode/Earth condition (VEST/Earth), vestibule mode/lunar condition (VEST/Lunar), vestibular & vision mode/Earth condition (VEST&VIS/Earth), and vestibular & vision mode/lunar condition (VEST&VIS/Lunar).
The results show that there were no significant differences in forward acceleration perception among the four conditions mentioned above (see Figure 6B), and all accelerations were perceived realistically with a slight decrease in perception magnitude. However, the pitch angle perception showed clear differences under different simulation conditions (see Figure 6C). In the vestibular mode, the perceived dynamic pitch angle is significantly larger in the lunar condition than under the Earth condition. Furthermore, compared to the actual angle, the perception of the static pitch angle was significantly smaller in the lunar condition than in the Earth condition. In the vestibular and vision mode, the perception shows a similar trend and the pitch angle of the lunar rover can be accurately perceived under both lunar and Earth conditions. This result indicates that the difference in gravity levels affects the angle perception from the vestibular system, while visual information can reduce this difference.
Furthermore, the discrepancies in pitch angle perception observed in the vestibular mode can be effectively elucidated by the specific force model and the SV model. A comparison of pitch angle perception during upslope (see Figure 7A) and downslope (see Figure 7B) in Earth’s and lunar gravity was conducted based on the two models. The perception differences in dynamic pitch can be explained by the specific force model when the vehicle turns into the slope (see Figure 7(I,III)), whereas the differences in the stable slope are better explained by the SV model (see Figure 7(II,IV)).
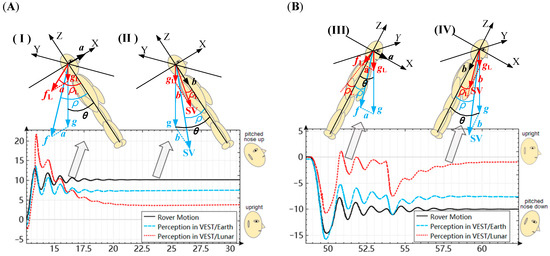
Figure 7.
Comparison and interpretation of pitch angle perception during upslope and downslope in Earth’s and lunar gravity. (A) Pitch angle perception during upslope, shows greater overestimation of dynamic pitch and underestimation of static pitch in lunar condition. (B) Pitch angle perception during downslope, shows underestimation of dynamic pitch and greater underestimation of static pitch in lunar condition. g and gL denote the gravity of Earth and the Moon, respectively. f and fL denote the inertial forces on the human body under the conditions of Earth and the Moon, respectively. The angle θ is the body pitch angle, and ρ and ρL denote the perceived pitch angle under the conditions of Earth and Moon.
Since the gravitational force on the Moon is only one-sixth of that on Earth, the direction of the specific force will be closer to that of forward acceleration (ax) than to gravity (g). Therefore, a greater dynamic pitch angle is perceived (I). This conclusion also applies to the simulation results of obstacle segment. Furthermore, due to the fluctuations in the magnitude and direction of acceleration, the perception of dynamic pitch angle may also exhibit variability. Under condition III, the discrepancy in gravity between Earth and Moon can lead to the perception angle to move in the opposite direction, and a smaller dynamic pitch angle is perceived (III).
The idiotropic vector is consistently oriented along the longitudinal axis of the body, with a magnitude of 0.2 g. The idiotropic vector is considerably smaller than the gravitational force on Earth, resulting in only a minor underestimation of the pitch angle. However, under the lunar condition, the idiotropic vector exceeds the lunar gravity (0.167 g) and thus dominates the SV. Consequently, the resultant force of both will be centered on the body’s axis under the lunar condition, resulting in a pitch angle perception closer to 0 (II & IV).
The combination of the two vector models gives rise to the following formulations:
The equations may be employed to approximate the perceived tilt angle in the vestibular mode, for the respective gravitational conditions of Earth and the Moon. A quantitative comparison of the difference in perceived pitch angles for the four cases is illustrated in Figure 7, which was conducted based on the equations. The specific comparisons are presented in Table 4 below. The values of forward acceleration are consistent with those in Figure 5B, and a typical value was chosen in cases (I) and (III) because of their fluctuating acceleration.
Table 4.
A quantitative comparison of the perceived pitch angles for the four cases.
It should be noted that the above equations do not consider the frequency characteristics of the organ’s dynamics and the internal model. However, they are nevertheless a suitable tool for intuitively and conveniently analyzing the difference in perceived tilt angle under different gravities.
4. Discussion
4.1. Motion Characteristics Between the Simulated Earth and Lunar Conditions
Our results indicate significant differences in motion characteristics between Earth and lunar conditions. The rover exhibits a greater propensity to float and slip under the lunar condition. This is due to the low gravity of the lunar environment, which results in a reduced weight of the rover. The reduced gravity results in less adhesion and friction between the lunar rover and the lunar surface [25]. Consequently, the lunar rover is more susceptible to sliding when executing the same steering maneuver and vehicle speed in comparison to the condition of Earth’s gravity.
Forward and vertical accelerations decreased markedly in the lunar condition. As the weight of the lunar rover is reduced, the acceleration response of the vehicle should be more rapid. However, the decreased friction due to the reduced gravity can lead to a lack of traction between the wheels and the surface, especially on loose surfaces [26]. Moreover, the vehicle may easily lose contact with the lunar surface after a high-speed impact, resulting in the loss of the ability to perform evasive maneuvers. It is therefore necessary to ensure that the output torque is decreased on the Moon for the same control input to guarantee the controllability and stability of the lunar rover. This will result in slower acceleration and deceleration. Furthermore, uncontrolled motions related to gravity may also be affected, such as the acceleration of the rover due to gravity during downhill movement and the deceleration when the rover collides with the lunar surface due to uneven terrain.
Our simulation of rover driving under lunar conditions approximates the experience of an astronaut driving an LRV on the lunar surface, and results are consistent with the subjective reports of the Apollo crews [25,27]. This establishes a solid foundation for our subsequent efforts in simulating the motion perception.
4.2. Motion Perception with Single Vestibular Information
The results demonstrate that the perception of pitch angle may differ in magnitude and direction between Earth and the lunar conditions in the vestibular mode. The dynamic pitch angle perception is determined by the specific force, which is the vector difference between the gravity vector and the acceleration vector. Thus, an identical forward acceleration results in a pitch angle (somatogravic illusion) that is greater in lunar gravity than in Earth’s gravity. The final perceived pitch angle is also influenced by the actual tilt angle and the acceleration direction. However, the overall perception of Apollo astronauts was that slopes were less pronounced than on Earth [27]. It is supported by the observed magnitude reduction in forward acceleration on the lunar surface relative to the ground, which leads to a reduced effect of the somatogravic illusion.
The observer model has also been employed to predict astronauts’ perception of lunar landing motion, and the results show that astronauts would falsely perceive themselves as upright despite a significant pitch or roll in instances that have limited visual cues [6,14]. This is explained by the fact that the specific force direction during the lunar landing is aligned with the longitudinal body axis. That is, it satisfies the following:
where gL is the magnitude of the Lunar gravity, and a represents the vehicle’s longitudinal acceleration. The angle θ is the vehicle’s tilt angle. When incorporating it into the equation we proposed above, this yields the following:
This signifies that the vestibular perception of verticality is through the subject’s body axis, thereby resulting in the misperception of being upright.
Moreover, our results indicated that the static pitch angle perception of the lunar rover is significantly smaller in lunar gravity than in Earth’s gravity. As was observed in our simulations in the vestibular mode, where the visual cues are limited, perception is mainly influenced by gravity and the idiotropic vector, as determined by SV. The idiotropic vector exceeds the lunar gravity, thus astronauts may no longer use gravity as a reference for verticality on the Moon, and they tend to align the SV with their longitudinal body axis [28,29]. Our results are also consistent with those previously reported in the literature [8,30]. Psychophysical experiments in parabolic flight have found self-roll tilt is underestimated in reduced gravity (0.25 g, 0.5 g, 0.75 g) when blindfolded, and the underestimation increases with decreasing gravity levels [8].
4.3. Motion Perception with the Vestibular and Visual Information
Visual information significantly reduced discrepancies in dynamic and static pitch angle perception across both conditions. The simulations based on the observer model assumed that the visual information is sufficient to accurately represent the motion characteristics of the rover. The transfer function of the visual channel in the model is unity, indicating that the rover’s motion, orientation, and gravity are perceived without attenuation through visual information. Consequently, in the vestibular and vision mode, the addition of gravity (gV) in the visual channel reduces the differences generated by the vestibular channel. As a result, the output perception is less affected by the gravity level, and the deviation in perception under the two simulation conditions is reduced.
4.4. Limitations
The present study is based on computer simulations, and it is important to note that the simulation results are limited by the accuracy of the model. The motion simulations of the lunar rover driving conducted in this study can reflect the differences in motion characteristics between Earth’s gravity and Lunar gravity; however, it is likely that the magnitude of these differences will differ from the real situation because the sources of the model are not derived from real lunar rover motion data. Moreover, the study does not consider the potential variability of motion characteristics across different regions of the lunar surface with varying levels of dust [28]. In the development of the lunar rover model, the primary focus was on simulating core parameters integral to the vehicle’s motion performance. The present study did not address the simulation of components such as thermal control, energy management, communication, or navigation. The observer model presented in this study does not address all the operational factors during lunar rover driving and all the factors involved in spatial orientation perception, such as the ability to integrate visual conditions, including the pilot’s gaze, the view field of the astronaut’s suit, and the angle of lunar surface illumination, etc. Additionally, the observer model provides an “average” predicted perception, while there are substantial inter-individual differences in spatial orientation perception [11].
5. Conclusions
Overall, we used a simulation system to compare the motion characteristics of a lunar rover under Earth and lunar conditions. Subsequently, a comparison of the motion perceptions of lunar rover driving between Earth and lunar conditions was conducted using a software program based on the observer model. The simulation results showed that, in comparison to Earth’s gravity, driving the lunar rover in lunar gravity exhibited a greater propensity to float and slip, and slower acceleration and deceleration. Furthermore, dynamic tilt perception may be more complicated with single vestibular information, and static tilt perception is greatly reduced, while the introduction of visual information can notably improve the perception accuracy. Our study fills a gap in the existing research on the simulation of motion perception in lunar rovers, thereby providing a basis for further optimization of lunar rover driving motion simulation strategies. Further efforts should be made to enhance the fidelity of the simulation system and the precision of the observer model. This will facilitate the development of simulators and the exploration of methods for efficiently achieving low gravity motion simulation on the ground.
Author Contributions
Conceptualization, W.-H.L.; data curation, S.-L.X. and H.D.; formal analysis, W.C.; funding acquisition, W.C.; investigation, S.-L.X.; methodology, W.C. and J.-G.C.; project administration, W.-H.L.; software, W.C., F.D. and M.A.; supervision, H.D.; visualization, F.D. and M.A.; writing—original draft, W.C.; writing—review and editing, J.-G.C. All authors have read and agreed to the published version of the manuscript.
Funding
This work was supported by the Foundation of National Key Laboratory of Human Factors Engineering (614222203022205).
Data Availability Statement
Data is unavailable due to privacy.
Conflicts of Interest
All the authors declare no conflicts of interest regarding this work.
Abbreviations
The following abbreviations are used in this manuscript:
| LRV | Lunar Roving Vehicle |
| DEM | Digital elevation model |
| DOM | Digital orthophoto map |
| ADAMS | Automatic Dynamic Analysis of Mechanical Systems |
References
- Clark, T.K. Sensorimotor challenges for crewed lunar surface missions, analogs, and countermeasures. In Proceedings of the AIAA SCITECH 2022 Forum, San Diego, CA, USA & Virtual, 3–7 January 2022. [Google Scholar] [CrossRef]
- Rosenberg, M.J.; Galvan-Garza, R.C.; Clark, T.K.; Sherwood, D.P.; Young, L.R.; Karmali, F. Human manual control precision depends on vestibular sensory precision and gravitational magnitude. J. Neurophysiol. 2018, 120, 3187–3197. [Google Scholar] [CrossRef] [PubMed]
- Kubis, J.F.; Elrod, J.T.; Rusnak, R.; Barnes, J.E. Apollo 15 Time and Motion Study. NASA Technical Report, No. NASA-CR-128695. 1972. Available online: https://ntrs.nasa.gov/citations/19730008096 (accessed on 2 September 2013).
- Young, A.H. Training for the Moon. In Lunar and Planetary Rovers: The Wheels of Apollo and the Quest for Mars. Springer Praxis Books; Springer: New York, NY, USA, 2007; pp. 57–84. [Google Scholar] [CrossRef]
- Litaker, H.L.; Vos, G.A.; Liberman, A.P.; Bingham, L.K.; Jones, V.L.; Gelo, T.J.; Cramer, M.O.; Scharunovych, N.; Frangoudis, A.A.; Royer, J.M. Developing a motion-based system for lunar vehicle handling qualities testing. In Proceedings of the IEEE Aerospace Conference, Big Sky, MT, USA, 2–9 March 2024; pp. 1–22. [Google Scholar] [CrossRef]
- Clark, T.K.; Stimpson, A.J.; Young, L.R.; Oman, C.M.; Natapoff, A.; Duda, K.R. Human spatial orientation perceptions during simulated lunar landing motions. AIAA J. Rocket. 2014, 51, 267–280. [Google Scholar] [CrossRef]
- Galvan-Garza, R.C.; Clark, T.K.; Sherwood, D.; Diaz-Artiles, A.; Rosenberg, M.J.; Natapoff, A.; Karmali, F.; Oman, C.M.; Young, L.R. Human perception of whole body roll-tilt orientation in a hypogravity analog: Underestimation and adaptation. J. Neurophysiol. 2018, 120, 3110–3121. [Google Scholar] [CrossRef] [PubMed]
- Meskers, A.J.H.; Houben, M.M.J.; Pennings, H.J.M.; Clément, G.; Groen, E.L. Underestimation of self-tilt increases in reduced gravity conditions. J. Vestib. Res. 2021, 31, 345–352. [Google Scholar] [CrossRef]
- Bos, J.E.; Bles, W. Theoretical considerations on canal–otolith interaction and an observer model. Biol. Cybern. 2002, 86, 191–207. [Google Scholar] [CrossRef]
- Merfeld, D.M.; Young, L.R.; Oman, C.M.; Shelhamert, M.J. A multidimensional model of the effect of gravity on the spatial orientation of the monkey. J. Vestib. Res. 1993, 3, 141–161. [Google Scholar] [CrossRef]
- Clark, T.K.; Newman, M.C.; Karmali, F.; Oman, C.M.; Merfeld, D.M. Mathematical models for dynamic, multisensory spatial orientation perception. Prog. Brain Res. 2019, 248, 65–90. [Google Scholar] [CrossRef]
- Lewkowicz, R. A modelling approach to the human perception of spatial orientation. Pol. J. Aviat. Med. Bioeng. Psychol. 2016, 22, 27–42. [Google Scholar] [CrossRef]
- Newman, M.C. A Multisensory Observer Model for Human Spatial Orientation Perception. Doctoral Dissertation, Massachusetts Institute of Technology, Cambridge, MA, USA, 2009. Available online: http://dspace.mit.edu/handle/1721.1/7582 (accessed on 24 November 2009).
- Clark, T.K.; Young, L.R.; Stimpson, A.J.; Duda, K.R.; Oman, C.M. Numerical simulation of human orientation perception during lunar landing. Acta Astronaut. 2011, 69, 420–428. [Google Scholar] [CrossRef]
- Meyer, T.H. The discontinuous nature of kriging interpolation for digital terrain modeling. Cartogr. Geogr. Inform. Sci. 2004, 31, 209–216. [Google Scholar] [CrossRef]
- Bo, Z.; Di, K.; Liu, Z.; Yue, Z.; Liu, J.; Shi, K. A catalogue of meter-scale impact craters in the Chang’e-5 landing area measured from centimeter-resolution descent imagery. Icarus 2022, 378, 114943. [Google Scholar] [CrossRef]
- Di, K.; Xu, B.; Peng, M.; Yue, Z.; Liu, Z.; Wan, W.; Li, L.; Zhou, J. Rock size-frequency distribution analysis at the Chang’E-3 landing site. Planet. Space Sci. 2016, 120, 103–112. [Google Scholar] [CrossRef]
- Yang, M.; Yue, Z.; Di, K.; Wan, W.; Liu, J.; Shi, K. Statistical Analysis of Secondary Craters in the Chang’E-4 Landing Area Based on Panoramic Camera Data. Bull. Mineral. Petrol. Geochem. 2021, 40, 720–729. [Google Scholar] [CrossRef]
- Bonecracker Games. Realistic Car Controller. Available online: https://www.bonecrackergames.com/realistic-car-controller (accessed on 15 June 2023).
- Xie, Y.Z.; Tang, Z.H.; Song, A.G. Motion Simulation and Human-Computer Interaction System for Lunar Exploration. Appl. Sci. 2022, 12, 2312. [Google Scholar] [CrossRef]
- Vingerhoets, R.A.; Van Gisbergen, J.A.; Medendorp, W.P. Verticality perception during off-vertical axis rotation. J. Neurophysiol. 2007, 97, 3256–3268. [Google Scholar] [CrossRef][Green Version]
- Chen, W.; Chao, J.-G.; Wang, J.-K.; Chen, X.-W.; Tan, C. Subjective vertical conflict theory and space motion sickness. Aerosp. Med. Hum. Perform. 2016, 87, 128–136. [Google Scholar] [CrossRef]
- Mittelstaedt, H. A new solution to the problem of the subjective vertical. Naturwissenschaften 1983, 70, 272–281. [Google Scholar] [CrossRef]
- Dyde, R.T.; Jenkin, M.R.; Harris, L.R. The subjective visual vertical and the perceptual upright. Exp. Brain Res. 2006, 173, 612–622. [Google Scholar] [CrossRef]
- Costes, N.C.; Farmer, J.E.; George, E.B. Mobility Performance of the Lunar Roving Vehicle: Terrestrial Studies, Apollo 15 Results. NASA Technical Report, NASA TR R-401. 1972; pp. 47–57. Available online: https://ntrs.nasa.gov/citations/19730008090 (accessed on 2 September 2013).
- Rodríguez-Martínez, D.; Van Winnendael, M.; Yoshida, K. High-speed mobility on planetary surfaces: A technical review. J. Field Robot. 2019, 36, 1436–1455. [Google Scholar] [CrossRef]
- Columbus, C. Apollo 16 Technical Crew Debriefing; NASA: Houston, TX, USA, 1972; pp. 141–258.
- Harris, L.R.; Herpers, R.; Hofhammer, T.; Jenkin, M. How much gravity is needed to establish the perceptual upright? PLoS ONE 2014, 9, e106207. [Google Scholar] [CrossRef]
- de Winkel, K.N.; Clément, G.; Groen, E.L.; Werkhoven, P.J. The perception of verticality in lunar and Martian gravity conditions. Neurosci. Lett. 2012, 529, 7–11. [Google Scholar] [CrossRef] [PubMed]
- Clark, T.K.; Young, L.R. A case study of human roll tilt perception in hypogravity. Aerosp. Med. Hum. Perform. 2017, 88, 682–687. [Google Scholar] [CrossRef]


Disclaimer/Publisher’s Note: The statements, opinions and data contained in all publications are solely those of the individual author(s) and contributor(s) and not of MDPI and/or the editor(s). MDPI and/or the editor(s) disclaim responsibility for any injury to people or property resulting from any ideas, methods, instructions or products referred to in the content. |
© 2025 by the authors. Licensee MDPI, Basel, Switzerland. This article is an open access article distributed under the terms and conditions of the Creative Commons Attribution (CC BY) license (https://creativecommons.org/licenses/by/4.0/).