Article

A Graph-Theoretic Approach for Exploring the Relationship Between EV Adoption and Charging Infrastructure Growth

by
Fahad S. Alrasheedi
* and
Hesham H. Ali
Department of Computer Science, University of Nebraska at Omaha, 1110 South 67th Street, Omaha, NE 68182, USA
*
Author to whom correspondence should be addressed.
Vehicles 2025, 7(2), 54; https://doi.org/10.3390/vehicles7020054
Submission received: 8 April 2025 / Revised: 7 May 2025 / Accepted: 27 May 2025 / Published: 3 June 2025

Abstract

:
The increasing global demand for conventional energy has led to significant challenges, particularly due to rising CO2 emissions and the depletion of natural resources. In the U.S., light-duty vehicles contribute significantly to transportation sector emissions, prompting a global shift toward electrified vehicles (EVs). Among the challenges that thwart the widespread adoption of EVs is the insufficient charging infrastructure (CI). This study focuses on exploring the complex relationship between EV adoption and CI growth. Employing a graph theoretic approach, we propose a graph model to analyze correlations between EV adoption and CI growth across 137 counties in six states. We examine how different time granularities impact these correlations in two distinct scenarios: Early Adoption and Late Adoption. Further, we conduct causality tests to assess the directional relationship between EV adoption and CI growth in both scenarios. Our main findings reveal that analysis using lower levels of time granularity result in more homogeneous clusters, with notable differences between clusters in EV adoption and those in CI growth. Additionally, we identify causal relationships between EV adoption and CI growth in 137 counties and show that causality is observed more frequently in Early Adoption scenarios than in Late Adoption ones. However, the causal effects in Early Adoption are slower than those in Late Adoption.

1. Introduction

As global populations grow, the demand for conventional energy continues to rise, leading to increased CO2 emissions and depletion of finite natural resources [1]. In the U.S., transportation contributes nearly 29% of carbon emissions, with light-duty vehicles responsible for 59% of these. This highlights the urgency of transitioning to sustainable energy sources [2,3].
Achieving zero carbon emissions in light-duty transportation is a crucial step toward this goal, and electric vehicles (EVs) offer a promising solution, as they produce zero tailpipe emissions [4]. In this study, the term EV refers specifically to vehicles that rely on charging infrastructure (CI), including Battery Electric Vehicles (BEVs) and Plug-in Hybrid Electric Vehicles (PHEVs). Conventional hybrid vehicles without external charging capability are excluded from the analysis.
However, widespread EV adoption faces several challenges, including insufficient CI, high upfront costs, and concerns about limited driving range [5]. To mitigate these barriers, government interventions have been implemented, such as subsidies for CI and tax credits for EV purchases. Therefore, a sufficient CI is significant to sustain an effective transition to EV [6].
Moreover, several studies have investigated the influence of CI alongside other factors, such as socio-demographic, economic, environmental, and political variables, on EV adoption in the United States [7,8,9,10]. While CI consistently emerges as a significant driver of EV adoption, the sole relationship between EV adoption and CI growth remains underexplored. Existing research typically embeds CI within broader multivariable models, making it difficult to isolate its unique effect.
Thus, a key question remains open: Does widespread EV adoption stimulate the development of more CI (Early Adoption), or does the availability of CI drive EV adoption (Late Adoption)? Additionally, such relationships may vary depending on the temporal granularity considered. Hence, this study contributes to the field by investigating the sole relationship between EV adoption rate and CI growth (at a county level) in two different scenarios of Early Adoption and Late Adoption (as defined in Section 3.3) through two complementary analyses: (1) correlation analysis using a graph-theoretic approach and (2) causality analysis.
In the correlation analysis, we propose a graph model for analyzing EV adoption patterns across 137 counties in six U.S. states, where nodes represent counties and edges represent correlations between their EV adoption rates. In each adoption scenario, we construct graph models at multiple time granularities (i.e., monthly, bi-monthly, quarterly, and bi-annual) to capture temporal dynamics. Using the Louvain method, a community detection technique, we cluster counties into groups based on their correlation structures. A similar graph-theoretic analysis is performed on CI growth patterns. Subsequently, we compute the correlation between the EV adoption and CI growth at different combinations of adoption scenarios and time granularities. In the causality analysis, we examine the directional causality relationship between EV adoption and CI growth for each county, incorporating different time lags and using the same combinations of adoption scenarios and time granularities.
This study analysis firstly reveals that, within EV adoption networks, counties from the same state tend to cluster together, exhibiting greater homogeneity at finer time granularities. However, this pattern is not observed in CI growth networks, highlighting the complexity of the relationship between EV adoption and CI growth. Secondly, the correlations between EV and CI networks in both adoption scenarios, Early Adoption and Late Adoption, are consistently weakly positive, with Late Adoption correlations being slightly higher than those in Early Adoption. Thirdly, 115 out of 137 counties exhibit causal relationships between EV adoption and CI growth, analyzed using various combinations of time granularities, time lags, and the two adoption scenarios. Notably, causality is observed more frequently in Early Adoption scenarios than in Late Adoption ones. However, the causal effects in Early Adoption are slower than those in Late Adoption, which can be attributed to the significantly higher costs of establishing new CIs compared to adopting new EVs.
The remainder of this paper is organized as follows. Section 2 reviews the related work on EV adoption and CI growth. Section 3 presents our graph-theoretic methodology for constructing correlation networks and conducting causality analysis. Section 4 discusses the empirical findings derived from the network clustering and Granger causality tests. Section 5 outlines the study’s limitations and proposes directions for future research, while Section 6 concludes the paper.

2. Literature Review

In this section, we review existing research on the complex relationship between EV adoption and CI growth. In addition, we discuss studies that have utilized a graph model in the context of CI optimization and identify gaps in the literature that our study aims to address.

2.1. Impact of Charging Infrastructure and Other Factors on EV Adoption

There is an extensive body of research in the literature examining EV adoption globally. Since our study focuses on the United States, we narrow our review to studies that are most relevant to our analysis; specifically, those conducted within the U.S. that consider CI as a key factor influencing EV adoption. These studies provide the necessary background and support for our research approach. To underscore the broader significance of this topic, we also briefly highlight selected national-level studies from other countries at the end of this section.
Ledna et al. investigated the impact of various support policies on EV adoption in California, focusing on investments in public CI and vehicle purchase subsidies [11]. They simulated three policy scenarios—no support, support for either infrastructure or vehicle purchases, and combined support—under both conservative and optimistic assumptions regarding technological advancement. Their findings suggest that combined support policies are most effective in boosting EV sales and reducing CO2 emissions overall, while infrastructure-focused support yields better outcomes in conservative technology scenarios, emphasizing the importance of tailoring policy strategies to market and technological conditions.
In another study, Chen et al. developed a game-theoretic model to examine the strategic interactions among governments, technology firms, and consumers in promoting EV adoption under various subsidy policies [5]. Their goal was to identify optimal government incentive strategies, focusing on infrastructure investment subsidies versus usage subsidies, under constrained budgets. The study found that when the budget is limited, either type of subsidy can be effective. However, under a high-budget scenario, investment subsidies are more effective for maximizing market penetration, while usage subsidies better enhance consumer surplus and overall social welfare.
White et al. examined the mechanisms underlying the relationship between public CI and EV adoption intent across three major U.S. metropolitan areas: Los Angeles, Dallas/Fort Worth, and Atlanta [12]. Using multiple mediation analysis, they tested whether three psychological constructs (i.e., range anxiety, perceived mobility restriction (PMR), and subjective norms) mediated the effect of public charging station density on EV adoption intent. Their findings revealed that subjective norms were the strongest and most consistent mediator, significantly influencing adoption intent in all three regions. Range anxiety played a marginal role in two of the regions, while PMR showed no significant mediating effect. These results suggest that the visibility of CI may function more as a social signal promoting adoption, rather than alleviating technical or mobility concerns.
Khan et al. examined the distribution of charging stations across New York City to identify the socio-demographic and transportation factors associated with charging station access [13]. Using correlation and hypothesis testing at the zip-code level, they found that the presence of highways, higher median household income, and a greater percentage of White-identifying population were positively associated with the presence and number of charging stations. Their findings highlight significant disparities, with low-income and minority communities having notably less access to charging stations, underscoring the need for equity-focused policies in infrastructure planning.
Burra et al. addressed the lack of sufficient EV-owning households in Maryland’s travel surveys by developing a synthetic population using a Bayesian network approach [7]. They estimated household-level EV ownership probabilities using a binomial logit model and evaluated how socio-demographic factors and access to Level 2 and DC fast chargers influence EV adoption. Their findings revealed that high-income and suburban households are more likely to own EVs, and that access to workplace charging and DC fast chargers significantly increases the likelihood of ownership. The study highlights the importance of differentiating between charger types and suggests that equitable infrastructure deployment should consider both location and income disparities.
Pamidimukkala et al. conducted a survey-based study of University of Texas at Arlington affiliates to examine how four categories of barriers (i.e., technological, environmental, financial, and infrastructure) affect consumers’ intentions to adopt EVs [8]. Using structural equation modeling on responses from 733 participants, they found that financial, infrastructure, and technological barriers all had significant negative effects on EV adoption intention, with financial barriers having the strongest influence. Infrastructure barriers (e.g., insufficient public charging stations and limited maintenance and repair services) also emerged as key obstacles. In contrast, environmental barriers were not statistically significant, suggesting that respondents largely accepted the environmental benefits of EVs.
Debnath et al. applied computational text analysis to approximately 36,000 Facebook posts, comprising a corpus of around 600,000 words, to explore public discourse surrounding EV adoption in the United States across six PESTLE dimensions: Political, Economic, Social, Technological, Legal, and Environmental [14]. Using a mixed-methods approach that combined social network analysis and machine learning-based topic modeling, they identified key themes within each category. The analysis revealed that discussions of charging technology and renewable energy dominated the Technological dimension, while concerns related to CI (e.g., particularly public funding, regulation, and policy) were primarily clustered under the Political category.
Kamis et al. developed predictive models for three 2021 targets (i.e., EV registrations, EV-related jobs, and new public CI (Level 2)) using county-level data across a wide range of predictors, including existing CI, environmental conditions, education, and socio-demographic factors. They found that existing CI was a significant predictor across all models, with Gradient Boosted Trees showing superior accuracy over traditional regression methods [9].
At the national level, Broadbent et al. developed a national-scale policy simulation model to explore how public incentives and infrastructure investment affect EV adoption trajectories and emissions reductions in Australia. Additionally, Babic et al. proposed a simulation-based operational model for transforming urban parking lots in Melbourne into EV-enabled charging hubs, focusing on profitability, charger allocation, and consumer behavior [15]. In Germany, Illmann et al. analyzed monthly ZIP-code-level data from 2012 to 2017 and found a significant long-term relationship between public CI and private EV registrations, with fast chargers having the strongest influence [16]. In France, Haidar et al. used mixed-effects regression to analyze BEV and PHEV adoption across 94 departments and found that different incentives and CI types affect each market differently, with fast and ultra-fast chargers driving BEV sales, and slow-to-normal chargers being more relevant for PHEVs [17]. In China, studies examine the relationship between EV adoption and the availability of CI [18,19]. They consistently find that improvements in CI have a positive impact on promoting EV adoption, though the nature of the effect depends on the policy design, regional conditions, and stakeholder interactions.

2.2. Application of Graph Model to Charging Infrastructure

The graph model is a powerful tool for analyzing relationships between various entities. A correlation network, where nodes represent entities or variables and edges indicate correlation strength, is widely used in diverse fields including bioinformatics, engineering, and social sciences [20,21,22]. Notably, graph-based models are inherently mathematical representations of complex networks and are often more robust to imperfections in data, as they emphasize structural relationships rather than isolated measurements [23,24,25].
The application of graph-theoretic models to EV has predominantly focused on optimizing station placement and network coverage. Gagarin et al. modeled the problem as a multiple domination problem on reachability graphs to ensure drivers can access multiple charging options within a limited cruising range [26]. Arkin et al. employed unit disk graphs and t-spanners to determine the minimum number of stations required to enable near-shortest EV routes with sufficient recharging support [27]. Moreover, studies in [28,29,30] applied the concept of the hitting set to identify the optimal number and locations for charging stations. Finally, Altundogan et al. integrated graph-based distance modeling with a genetic algorithm to optimize the spatial distribution of a fixed number of chargers across urban networks [31].
While these studies demonstrate the utility of graph theory for infrastructure planning, they do not explore the dynamic, temporal interplay between EV adoption trends and CI growth, an area this study addresses by applying graph models to correlate and interpret adoption patterns directly.

2.3. Gaps Found in the Literature

Based on the reviewed literature in Section 2.1 and Section 2.2, we identify the following gaps that this study aims to address:
  • Most of the existing literature examines EV adoption and its relationship with other factors in one to three cities, resulting in limited data diversity. This study, however, analyzes 137 counties across six U.S. states, enhancing the analysis and demonstrating the role of states in clustering counties within the correlation networks.
  • The use of graph models has mostly been limited to optimizing the placement of charging stations within specific areas. In contrast, this study contributes by applying a graph model to explore patterns in both EV adoption and CI growth networks under two scenarios of Early Adoption and Late Adoption, build a correlation network, and cluster counties accordingly.
  • Existing studies rarely examine how the relationship between EV adoption and CI growth varies across different adoption scenarios (e.g., Early Adoption vs. Late Adoption) or under varying temporal granularities and lags. This limits our understanding of the timing and directionality of influence between the two. Our study addresses this by incorporating multiple time granularities and adoption phases to uncover nuanced structural and causal patterns.

3. Methodology

In this section, we outline the approach used to analyze the relationship between EV adoption and CI growth. It starts by describing the data in Section 3.1, using a graph model to build correlation networks in Section 3.2, introducing the two cases of adoption in Section 3.3, setting different time granularities in Section 3.4, and establishing two causality tests in Section 3.5.

3.1. Data Collection

3.1.1. EV Data

The data used for EV registrations were obtained from Atlas Hub [32], which works directly with states to provide comprehensive temporal data across various U.S. states, primarily at the ZIP code and county levels. In this study, EVs refer specifically to vehicles that rely on CI, namely BEVs and PHEVs. Conventional hybrid vehicles without external charging capability are excluded from this analysis.
We selected states offering consistent data from 2018 to 2023 on a monthly basis; thus, counties that had 12 months of data for each year in the selected period were included in the final dataset. Consequently, this dataset consists of EV data from 137 counties across six states. We aggregate the data at various time granularities to enable analysis at different temporal scales. Table 1 provides a summary of the states and the number of counties from each.

3.1.2. CI Data

Data on public and private charging stations were collected from the Alternative Fueling Station Locator, which, at the time of this research, included a total of 67,540 stations [33]. To ensure consistency, the dataset was filtered to include only the counties represented in the EV data. More importantly, the CI for a county is represented by the number of chargers rather than the number of charging stations, as this more accurately reflects the infrastructure’s capacity. Consequently, our analysis investigates the relationships between EV adoption and different CI levels, including Level 2 chargers, DC fast chargers, and a combined level that includes Level 1, Level 2, and DC chargers, referred to as “ALL”. Additionally, each CI level for a county is aggregated into various time granularities, consistent with the approach used for the EV adoption data.

3.2. Proposed Graph-Theoretic Approach: Correlation Network

To investigate the structural relationships among counties based on their EV adoption or CI growth, we construct an unweighted, undirected graph, where each node represents a county and edges reflect statistically significant correlations between counties’ growth rates. Let C i and C j denote the sequences of growth rates for counties i and j, respectively. The similarity between each pair of counties is measured using the Pearson correlation coefficient:
ρ i j = Cov ( C i , C j ) σ C i σ C j ,
where Cov ( C i , C j ) is the covariance between the two growth rate sequences, and σ C i and σ C j are their standard deviations. We define a graph G = ( V , E ) , where each node v V represents a county, and an edge ( i , j ) E is created if ρ i j τ , where τ is a correlation threshold selected through modularity-based optimization.
To detect clusters of counties exhibiting similar growth behavior, we apply the Louvain community detection algorithm, which partitions the graph into non-overlapping communities. The quality of these partitions is evaluated using the modularity metric:
Q = 1 2 m i , j A i j k i k j 2 m δ ( c i , c j ) ,
where A i j is the adjacency matrix, k i and k j are the degrees of nodes i and j, m is the total number of edges, c i denotes the community of node i, and δ ( c i , c j ) is the Kronecker delta, equal to 1 if c i = c j and 0 otherwise [34]. The threshold τ is selected to maximize modularity Q while maintaining a meaningful number of network connections.
Following the initial partitioning, we optionally apply a refinement procedure that iteratively removes the edge with the highest edge betweenness centrality, the number of shortest paths that pass through that edge. After each removal, modularity is recomputed to assess whether community separation has improved. This process reveals more distinct and cohesive clusters by removing structural bridges between loosely connected groups of counties.

3.3. Early Versus Late Adoption

We define two adoption scenarios of Early Adoption and Late Adoption to examine the relationship between EV adoption and CI growth using different time granularities.

3.3.1. Early Adoption

In this scenario, we assume that EVs are adopted before sufficient CI is available. In other words, EV adopters take the risk of using EVs despite a lack of supporting infrastructure, expecting their adoption to prompt further CI development. To analyze this, we apply a one-year lag, where EV adoption data span 2018 to 2022 while CI growth data cover 2019 to 2023. This means a given year in the EV data (e.g., 2020) is aligned with the following year in the CI data (e.g., 2021). In this scenario, we investigate whether correlations exist between EV adoption and each level of CI, accounting for the one-year lag between the two datasets.

3.3.2. Late Adoption

This scenario assumes that CI is established before widespread EV adoption, with the expectation that sufficient CI will encourage more consumers to adopt EVs. Similar to the Early Adoption scenario, we apply a one-year lag: CI growth data span 2018 to 2022, while EV adoption data cover 2019 to 2023. Here, CI data for a given year are aligned with EV data from the following year (e.g., 2018 CI data are aligned with 2019 EV data.).

3.4. Different Time Granularities

The relationship between EV adoption and CI growth is complex; therefore, our analysis explores multiple time granularities to capture underlying patterns that may emerge at different temporal resolutions. To this end, we divide the dataset into several time granularities: monthly, bi-monthly, quarterly, and bi-annual periods. For each granularity, we calculate the growth rate based on cumulative values from one period to the next. For instance, at the monthly level, we compute the relative increase in total adoption or infrastructure from January to February, February to March, and so on, whereas, at the quarterly level, we compare cumulative totals from one quarter to the next. Hence, the adoption or growth rate (AGR) at each step is mathematically expressed as
AGR j = G j G j 1 G j 1
where AGR j represents the relative growth rate at period j, G j is the cumulative number of registered EVs or installed CI units up to period j, and G j 1 is the cumulative value up to the previous period. This formulation reflects the proportional change in adoption or infrastructure accumulation between adjacent time steps.
Through this analysis, we examine the correlation networks of EV adoption and the growth of multiple CI levels (e.g., Level 2, DC fast chargers, and ALL) across different temporal granularities. Specifically, we investigate whether clusters observed at finer granularities persist at coarser levels or whether new correlations between counties emerge, thereby shedding light on the temporal dynamics of EV adoption and CI expansion.

3.5. Causality Relationships Between EVs and CIs

To examine the directional relationship between EV adoption and the expansion of CI, we apply the Granger causality test to the respective growth rate sequences rather than raw time series. We formulate two complementary hypotheses:
  • Early Adoption Scenario: This hypothesis tests whether the growth of EV adoption leads to subsequent growth in CI. The null hypothesis is the following: EV adoption growth does not Granger-cause CI growth.
  • Late Adoption Scenario: This hypothesis tests whether the growth of CI drives EV adoption. The null hypothesis is the following: CI growth does not Granger-cause EV adoption.
Granger causality tests are performed at a significance level of α = 0.05 , assessing whether lagged values of one county’s growth rate series contribute statistically to predicting another. To capture potential delayed effects, we consider multiple time lags, i.e., half-year, one-year, two-year, and three-year. These tests are conducted across multiple temporal granularities (i.e., monthly, bi-monthly, quarterly, and bi-annual), enabling us to investigate whether the causal relationships vary across different time resolutions and adoption scenarios.

4. Results

In this section, we present the outcomes of our analysis, including the correlations for both EV adoption and CI growth using a graph-theoretic approach. We examine the two cases of Early Adoption (Section 4.1) and Late Adoption (Section 4.2) using different time granularity. Additionally, we present the results of our analysis of causality relationships between EV adoption and CI growth in these two cases in Section 4.3.

4.1. Early Adoption of EV

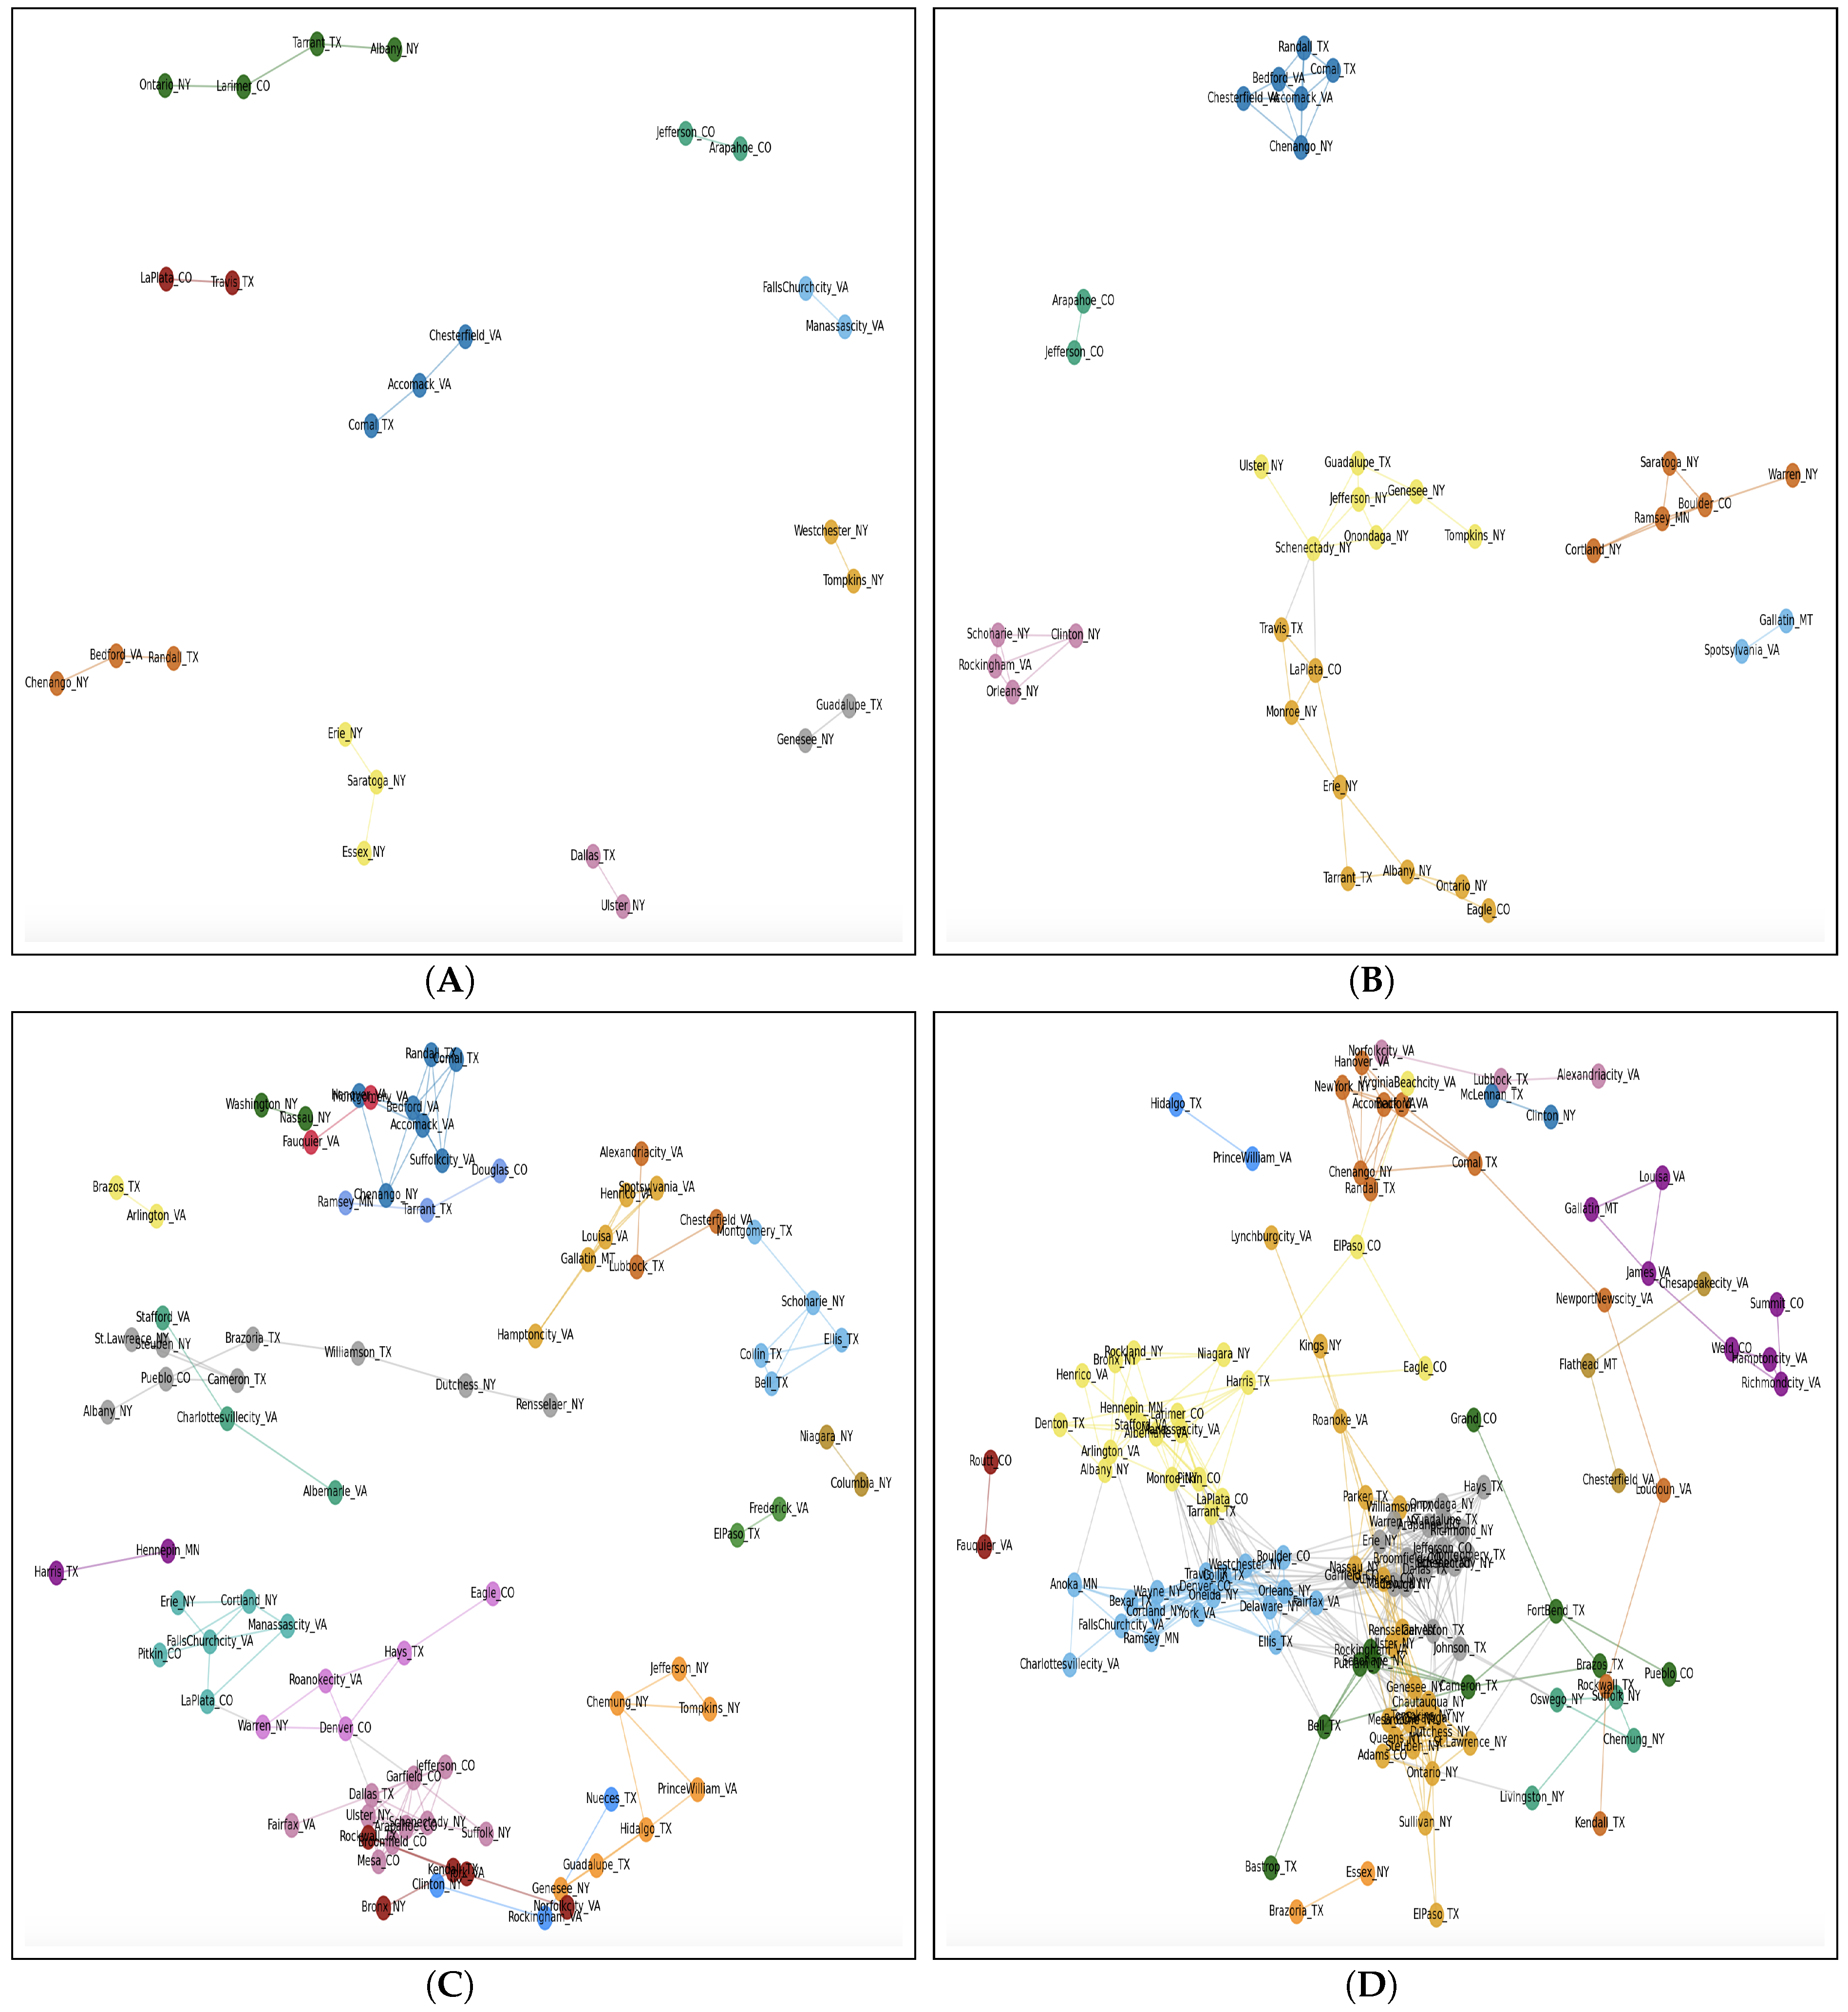
Figure 1 illustrates the correlation networks between counties for their EV adoptions (2018–2022) using different time granularity in the scenario of Early Adoption. The first notable finding is that lower levels of granularity produce more homogeneous clusters. For example, on a monthly basis, we observe that each cluster comprises counties from the same state. However, as the granularity span increases, this homogeneity decreases, though it remains noticeable. Moreover, counties within the same cluster and state tend to be geographically close to each other. This raises the question of whether geographical proximity influences EV adoption, whether areas that are close to one another are more likely to adopt EVs if one area has already adopted them extensively (Contagion of EV Adoption).
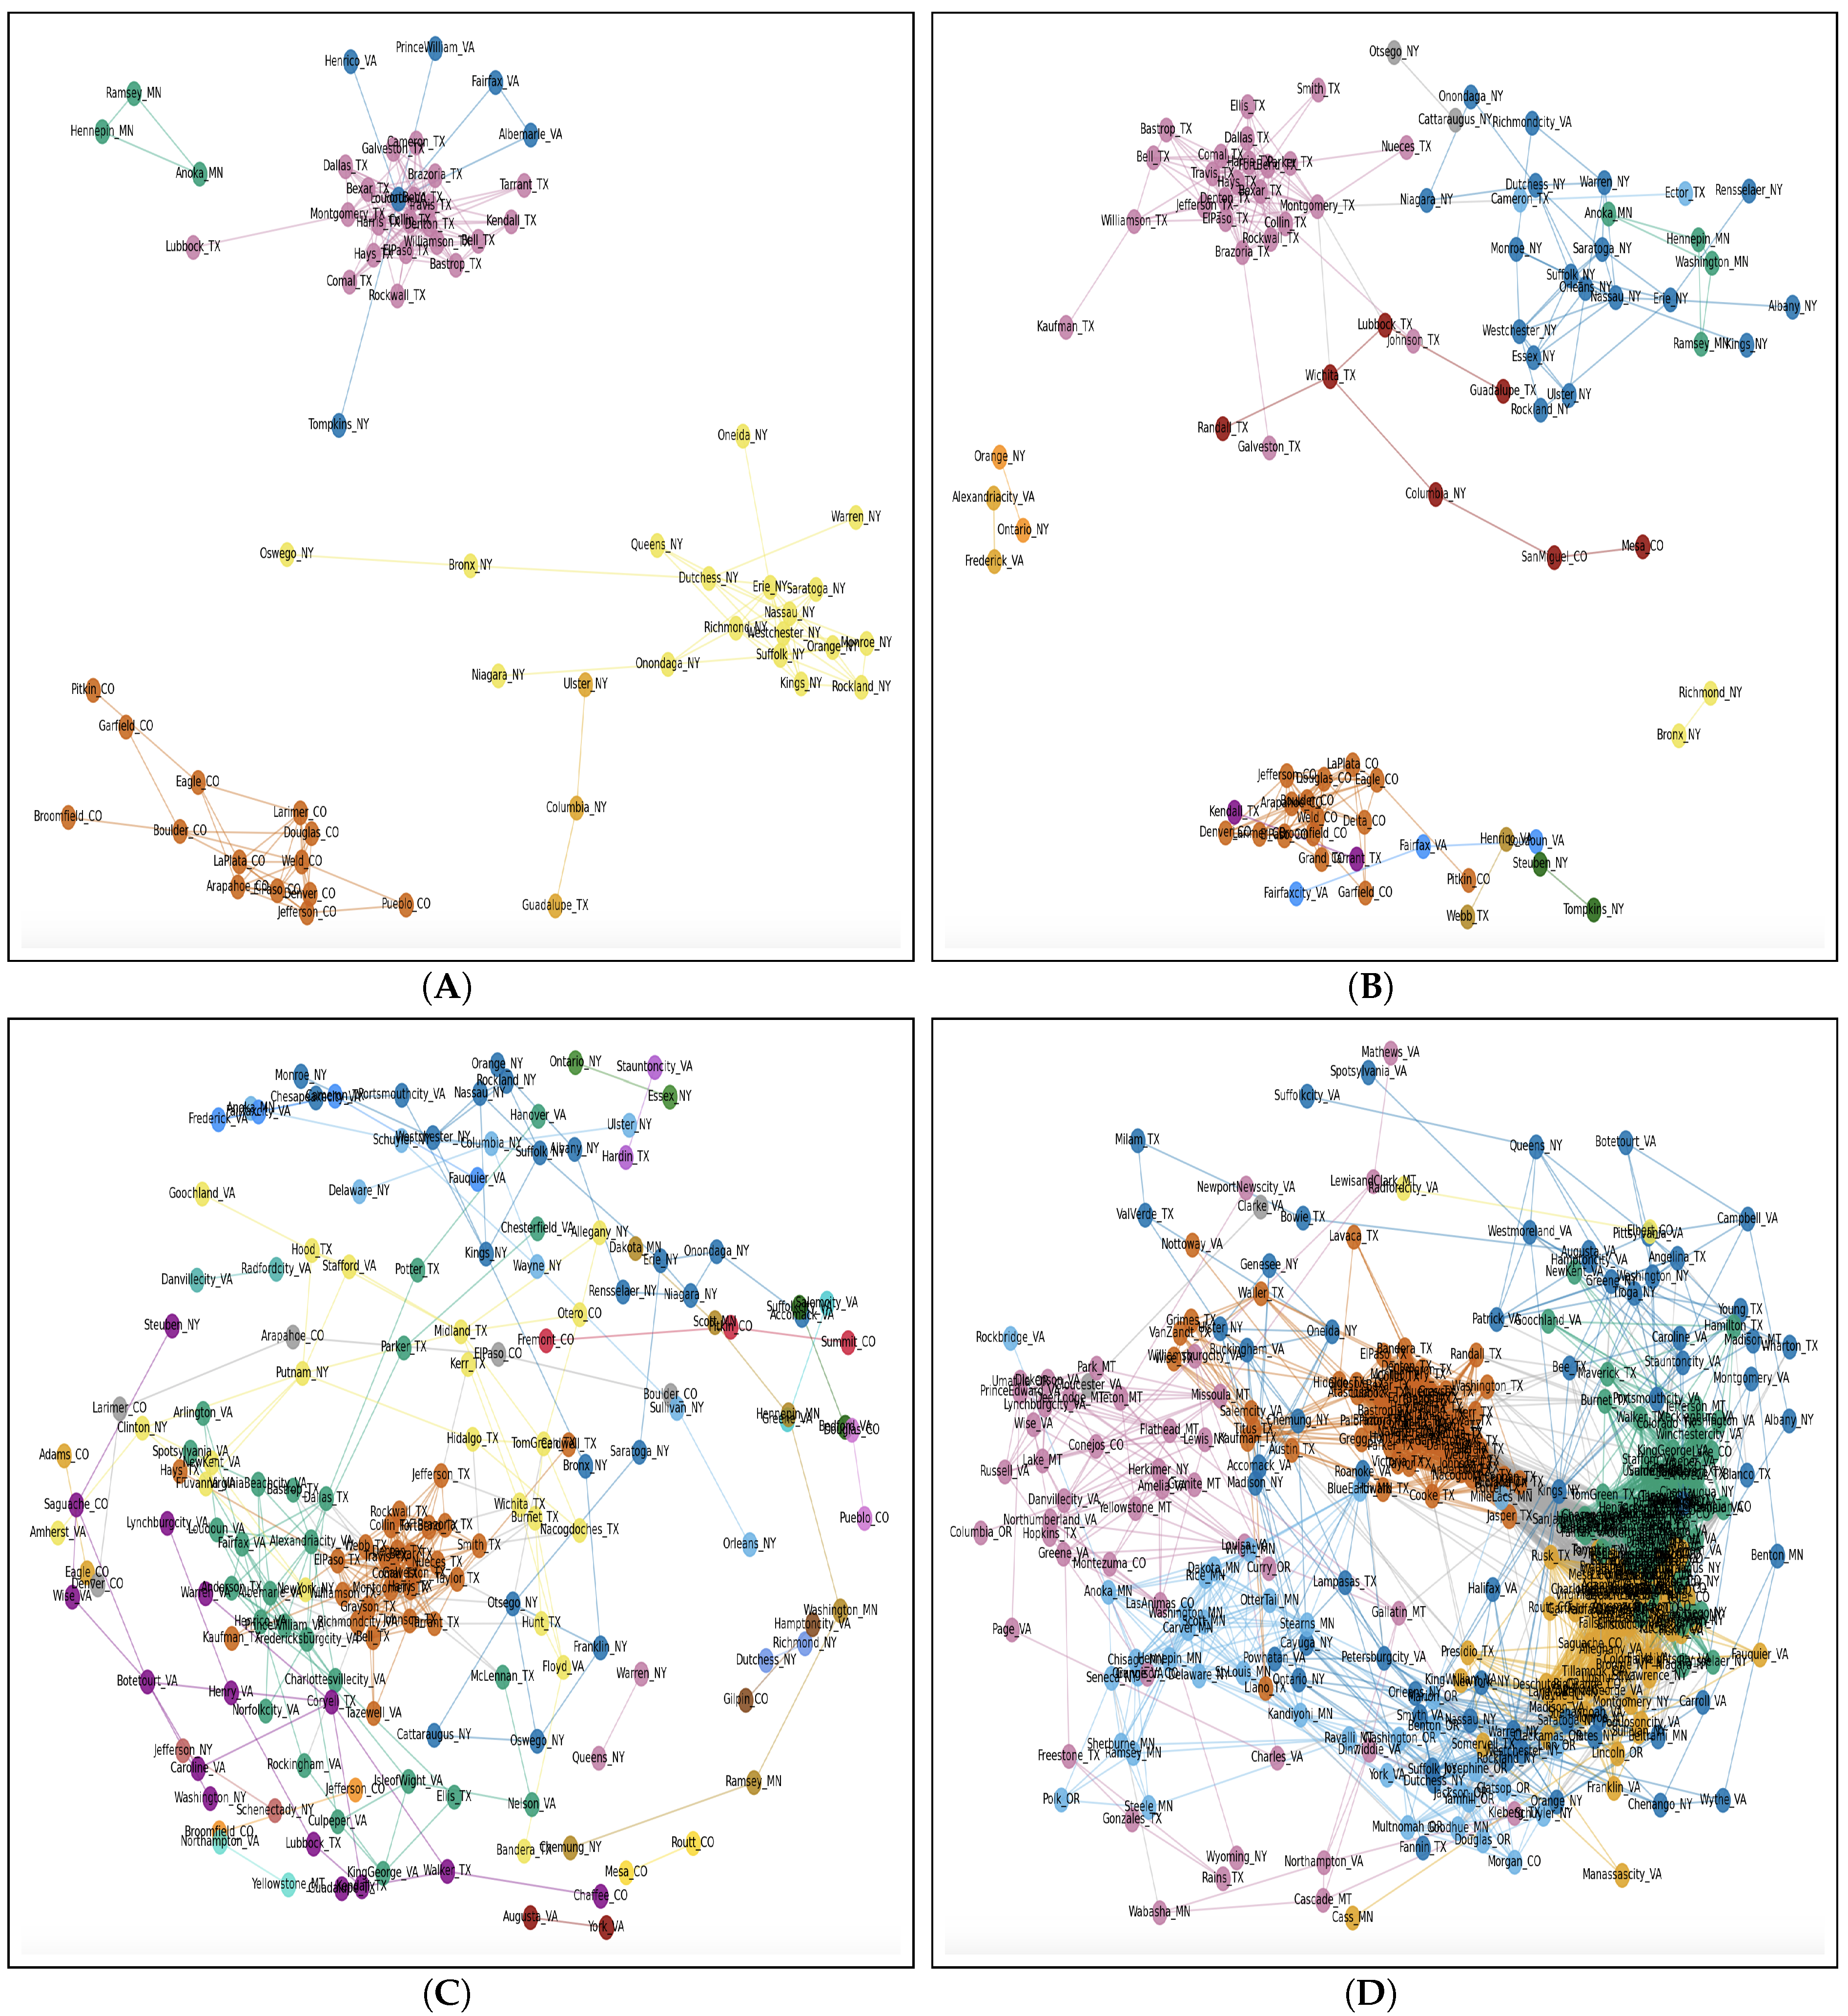
Similarly, Figure 2 illustrates the correlation between counties regarding the “ALL” level of CI (2019–2023) in the Early Adoption scenario. Due to space limitations, and since the findings for “ALL” level chargers apply to other levels of CI, we do not show the other levels. In general, the clusters identified in CI do not exhibit the same patterns seen in EV adoption. The CI clusters are far more heterogeneous in terms of the states their counties belong to. The discrepancies between the EV and CI correlation patterns highlight the complexity of the relationship between EV adoption and CI development.
Lastly, Table 2 shows the correlation between EV adoption and various CI levels (Level 2 chargers, DC chargers, and ALL) in the scenario of Early Adoption. We observe that the correlations are consistently weakly positive. Moreover, lower levels of granularity tend to have slightly stronger correlations than higher levels.

4.2. Late Adoption of EV

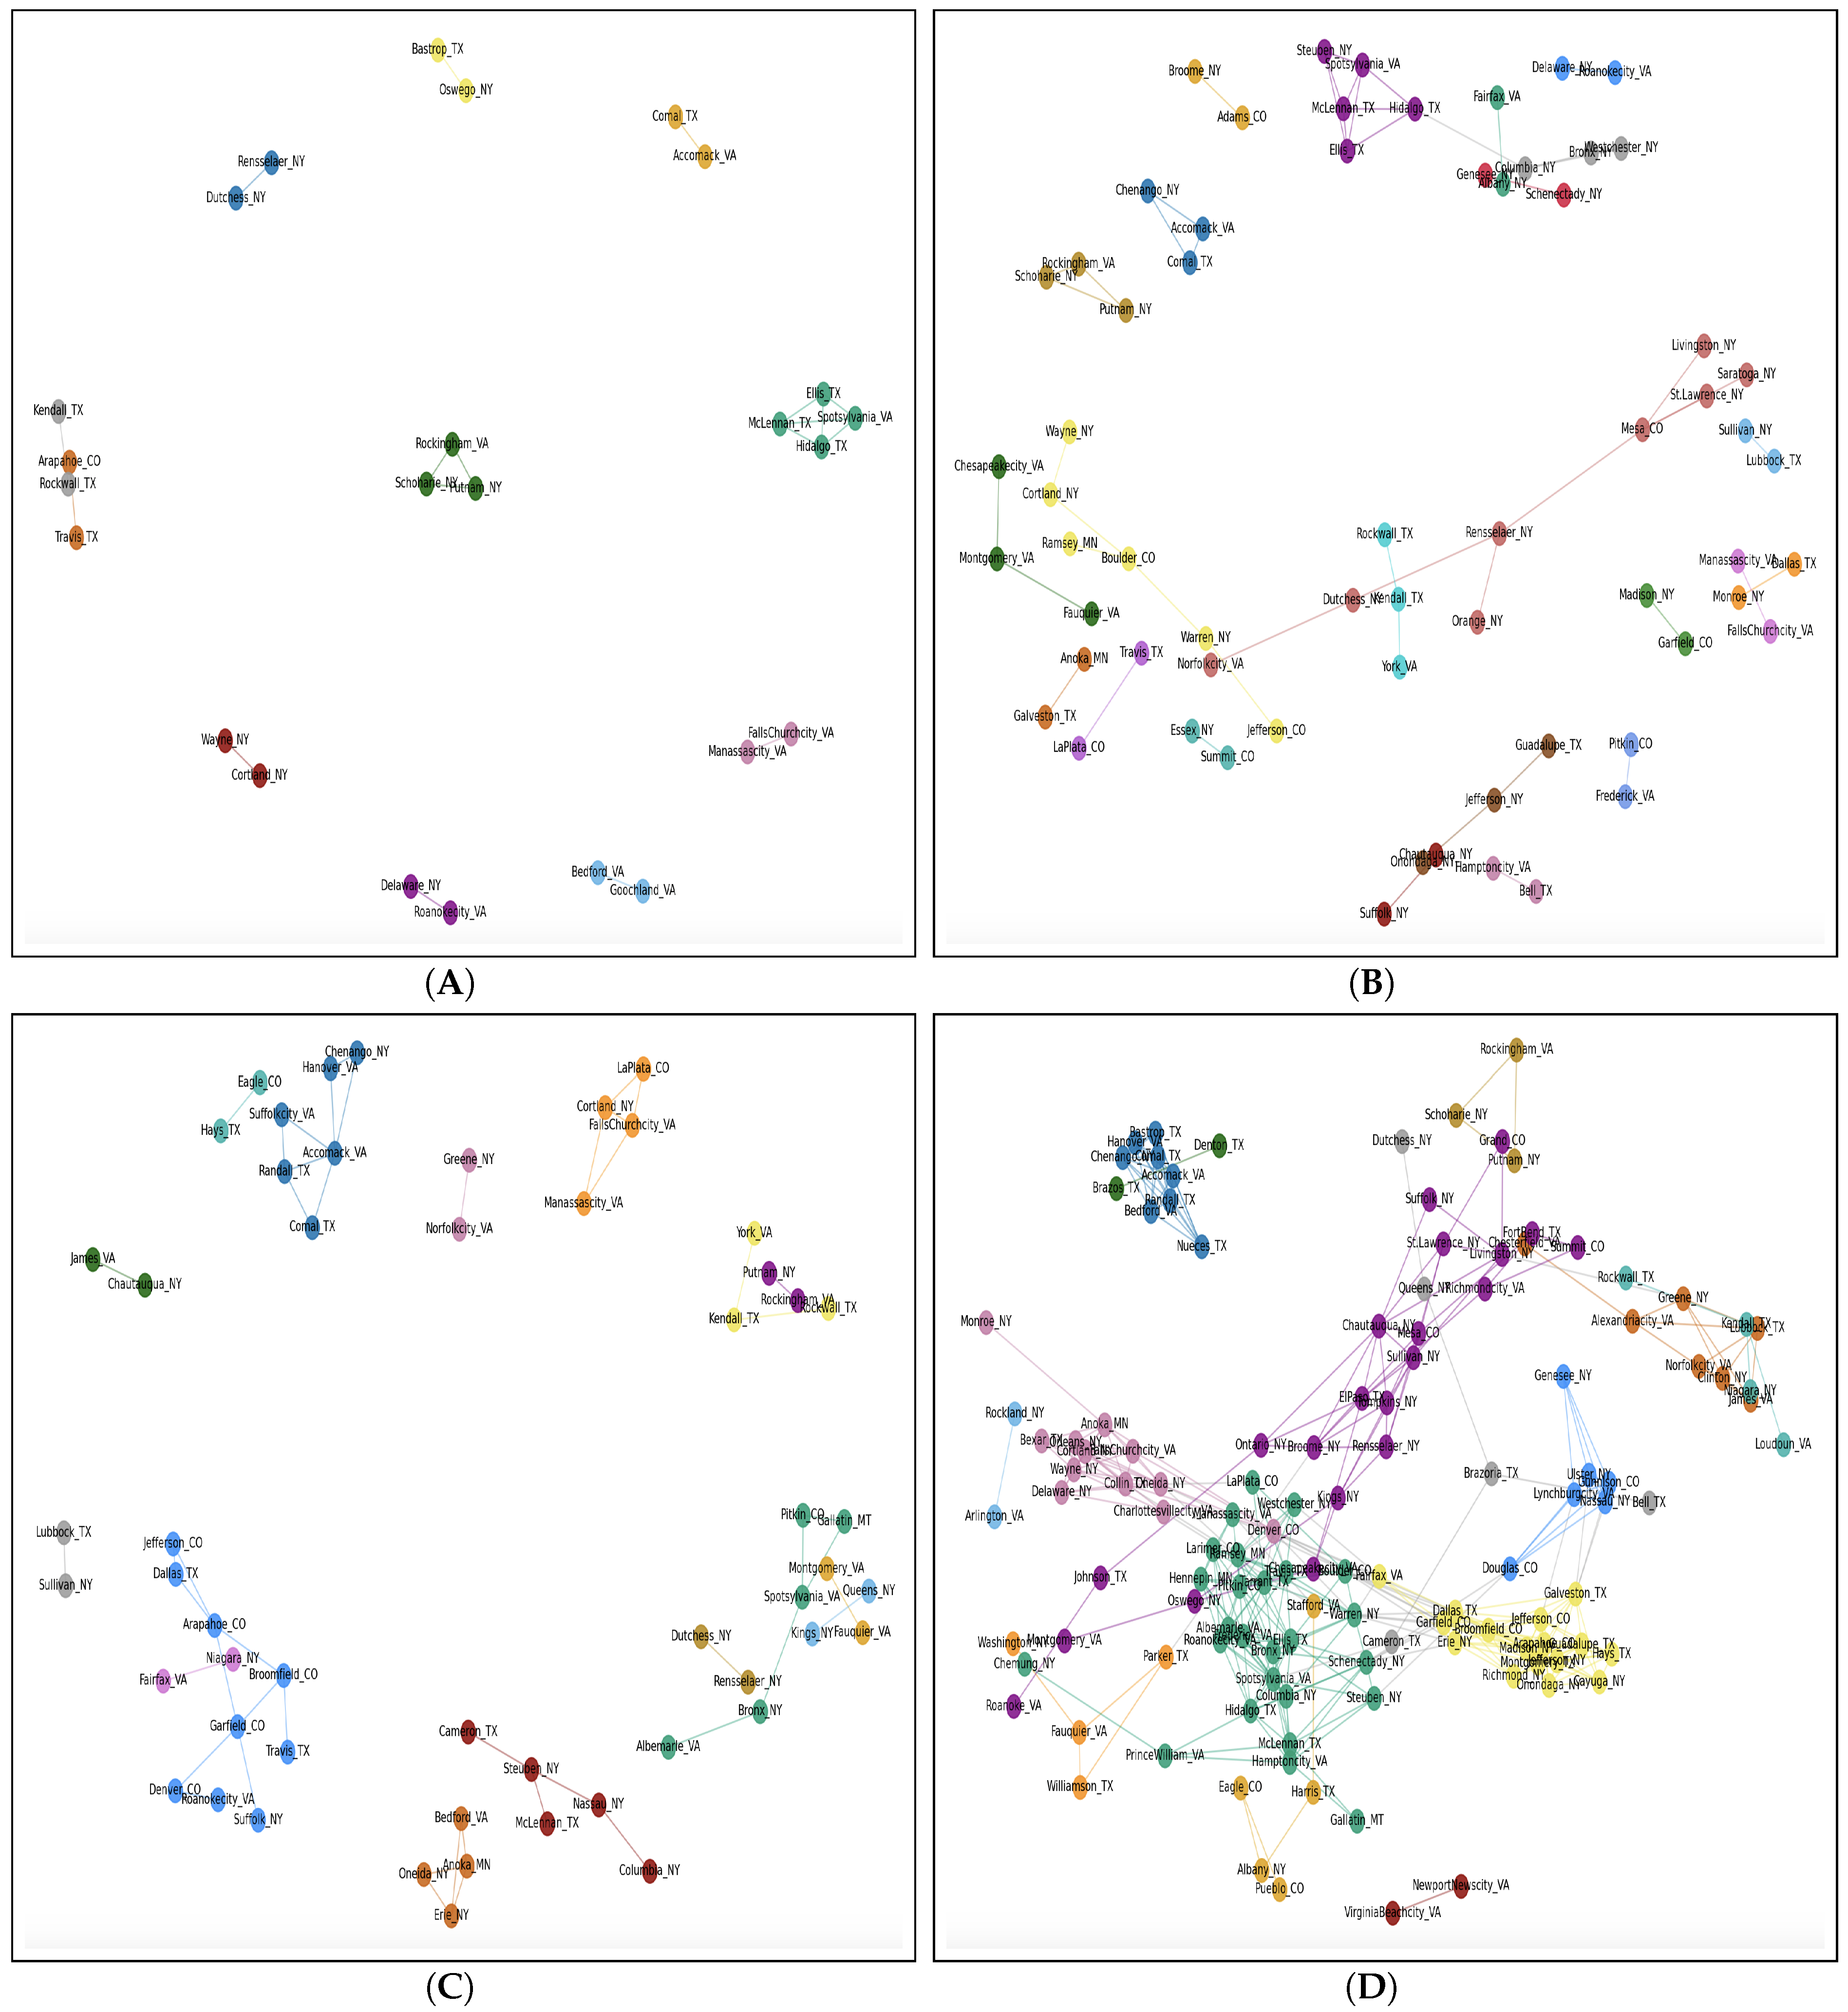
Figure 3 illustrates the scenario of Late Adoption for EV adoption (2019–2023). A similar pattern to the Early Adoption scenario is observed, where lower levels of granularity show more homogeneity. However, there are noticeable differences between the clusters in the scenarios of Early and Late Adoption. One key difference is that the Early Adoption networks tend to be slightly denser than the Late Adoption networks. This could be due to the sparser nature of the early adoption data (2018–2022), which result in a higher number of correlations between counties.
For the correlations between counties regrading CI growth in the Late Adoption scenario, we only show the correlation for the “ALL” level of CI for simplicity in Figure 4. Analogously, the findings regarding CI promotion in the Late Adoption scenario are similar to those in Early Adoption, where the EV and CI correlation patterns differ significantly.
Lastly, Table 3 shows the correlation between EV adoption and various CI levels (Level 2 chargers, DC chargers, and ALL) in the Late Adoption scenario. We observe that the correlations are consistently weakly positive. Moreover, lower levels of time granularity tend to show slightly stronger correlations. Additionally, the correlation between EV adoption and CI growth in the Late Adoption scenario is generally higher than in the Early Adoption scenario across most levels of time granularity. This supports the conclusion that providing adequate CI might be crucial to promoting the use of EVs.

4.3. Causal Relationships Between EV Adoption and CI Growth

We conducted a Granger causality test to uncover the causal relationships between EV adoption and CI growth. In this analysis, we explore whether EV adoption causes CI growth or vice versa in the Early Adoption and Late Adoption scenarios, respectively. For simplicity, we focus on one level of CI, namely “ALL”, which represents all types of chargers combined. Understanding the effects of specific levels, particularly DC chargers, on EV adoption is important and will be addressed in future work. In our causality analysis, we use different time granularities, including monthly, bi-monthly, quarterly, and bi-annual periods. Moreover, we test various lags between EV adoption and CI growth, including half-year, one-year, two-year, and three-year lags, to uncover potential relationships. Hence, each combination of a time granularity, a time lag, and an adoption scenario is tested for each county in our analysis. The number of counties rejecting the null hypotheses for Early Adoption and Late Adoption, as explained in Section 4.3, is detailed in this section.
Table 4 presents the causal relationships captured in the Early Adoption scenario, where EV adoption causes CI “ALL” growth. Each entry in Table 4 represents a combination of a time granularity and time lag, indicating the number of counties with significant evidence of causal relationships. For instance, when using quarterly granularity and a two-year lag, 17 counties show such causal relationships. To account for counties appearing repeatedly across different combinations, the “Unique” column represents the unique counties showing causal relationships for a specific time granularity across different time lags, while the “Unique” row indicates the unique counties for a time lag across different granularities. Similarly, Table 5 presents the causal relationships captured in the Late Adoption scenario, where CI “ALL” growth causes EV adoption.
From Table 4 and Table 5, we observe that the number of unique counties in the Early Adoption scenario (93 out of 137) is larger than in the Late Adoption scenario (77 out of 137). This indicates that EV adoption tends to cause CI growth more frequently than CI growth causes EV adoption. Consequently, EV adoption in an area before CI development is more critical than investing in CI before EV adoption. Thus, focusing on incentivizing EV purchases is a significant step for widespread adoption. Nevertheless, the demonstration of CI growth causing EV adoption in several counties highlights the complex and bidirectional nature of the relationship between EVs and CI.
Secondly, the causal effect of EV adoption on CI growth is clearly slower than the reverse. Specifically, the “Unique” row in Table 4 shows that the peak number of counties (45 counties) exhibiting CI growth caused by EV adoption occurs at a two-year lag. In contrast, the causal effect of CI growth on EV adoption peaks at a half-year lag (44 counties) as shown in Table 5. This finding is intuitive, as the slower causal effect of EV adoption on CI growth is likely due to the high costs associated with investing in CI infrastructure, such as charging stations. On the other hand, the causal effect of CI growth on EV adoption is faster, as purchasing an EV is an individual decision and typically less costly than establishing CI.
Overall, Table 6 shows that 115 unique counties out of 137 (approximately 84% of the data) exhibit significant causal relationships between EV adoption and CI growth using various time granularities, time lags, and adoption scenarios. Furthermore, Table 6 reveals that three states have a higher number of counties where EV adoption causes CI “ALL” growth, two states have more counties where CI “ALL” growth causes EV adoption, and one state exhibits an equal number of counties for both causal relationships.

5. Limitations and Future Work

This study focuses exclusively on the correlation and causal dynamics between EV adoption and CI growth at the county level, using a graph-theoretic model and causality analysis. One inherent limitation is that the analysis does not explicitly isolate the influence of external factors such as policy interventions, technological advancement, and socio-demographic characteristics. Instead, we assume that such influences are implicitly embedded in the observed trends of EV adoption and CI growth across counties. For example, government incentives or socioeconomic conditions that encourage EV adoption are presumed to be reflected in the adoption data; likewise, infrastructure investments and policy support are assumed to manifest in the CI growth data. Although this approach enables an isolated view of the EV–CI relationship, it restricts our ability to attribute clustering behavior to specific contextual drivers.
Future research could integrate multivariate modeling or cluster enrichment techniques to examine whether counties grouped into the same cluster share underlying characteristics such as population density, income levels, policy environments, or technological readiness. Such analysis would enhance the interpretability of the clusters and support more informed policy recommendations. For instance, in the Early Adoption scenario using bi-monthly data, we observed that Danville City in Virginia appeared in a cluster primarily composed of Texas counties. Upon inspection, this outlier grouping may be explained by shared factors such as rural influence, moderate commute distances, limited access to public transit, and lower median income, traits that may transcend geography. These examples highlight the potential of structural characteristics to shape adoption patterns beyond state boundaries.
Another limitation lies in the scope and structure of the input data. Although our analysis is based on complete and clean records for 137 U.S. counties, it may not fully represent broader national trends. Some regions with incomplete or inconsistent data were excluded from this study. As a result, the findings, while indicative, may not generalize to all counties. Future studies should aim to extend the analysis to a larger and more diverse geographic set as higher-quality and more comprehensive data become available.
Finally, our current framework does not account for potential uncertainty or noise in the reported data. Although the datasets were obtained from reliable sources and contain no missing values for the included counties, they may still reflect reporting inconsistencies or systemic biases. Future research could incorporate uncertainty quantification techniques or sensitivity analysis to assess the robustness of the correlation and community detection outcomes.

6. Conclusions

This study investigates the isolated relationship between EV adoption and CI growth at the county level, employing a combination of graph-theoretic modeling and Granger causality analysis. Our results reveal that, within the correlation networks of EV adoption, counties from the same state tend to cluster together, particularly at finer temporal granularities, suggesting greater homogeneity driven by internal state-level factors. In contrast, such clustering patterns are not consistently observed in the CI growth networks.
Furthermore, we find that the correlations between EV adoption and CI growth are negligible in both adoption scenarios: Early Adoption and Late Adoption. While both scenarios exhibit weak positive correlations, slightly higher values are observed in the latter, where CI is assumed to precede widespread EV adoption. This marginally supports the idea that the availability of sufficient infrastructure may be important for encouraging EV adoption.
Our causality analysis shows that more counties exhibit statistically significant results under the Early Adoption scenario, indicating that EV adoption may, in some cases, drive subsequent CI development. This finding underscores the potential value of early-stage policies and incentives aimed at accelerating EV adoption as a means to stimulate infrastructure investment. Additionally, the analysis reveals that the causal effect from EV adoption to CI growth tends to emerge more slowly than the reverse. Overall, 115 out of 137 counties demonstrate some form of causal relationship under varying combinations of time granularity, time lag, and adoption scenario.

Author Contributions

Conceptualization, F.S.A. and H.H.A.; methodology, F.S.A. and H.H.A.; software, F.S.A.; validation, F.S.A.; formal analysis, F.S.A. and H.H.A.; investigation, F.S.A.; resources, F.S.A. and H.H.A.; data curation, F.S.A.; writing—original draft preparation, F.S.A.; writing—review and editing, H.H.A.; visualization, F.S.A. and H.H.A.; supervision, H.H.A.; project administration, F.S.A. and H.H.A. All authors have read and agreed to the published version of the manuscript.

Funding

This research received no external funding.

Institutional Review Board Statement

Not applicable.

Informed Consent Statement

Not applicable.

Data Availability Statement

Data will be made available on request.

Conflicts of Interest

The authors declare no conflicts of interest.

References

  1. Atabani, A.; Badruddin, I.A.; Mekhilef, S.; Silitonga, A.S. A review on global fuel economy standards, labels and technologies in the transportation sector. Renew. Sustain. Energy Rev. 2011, 15, 4586–4610. [Google Scholar] [CrossRef]
  2. United States Environmenta Agency (EPA). Inventory of U.S. Greenhouse Gas Emissions and Sinks; Createspace Independent Publishing Platform: North Charleston, SC, USA, 2018.
  3. U.S. Environmental Protection Agency. Fast Facts on Transportation Greenhouse Gas Emissions; US Environmental Protection Agency: Washington, DC, USA, 2015.
  4. Alternative Fuels Data Center (A.F.D.C.). Electric Vehicle Benefits and Considerations; US Department of Energy: Washington, DC, USA, 2022; Volume 8.
  5. Chen, R.; Meng, Q.; Yu, J.J. Optimal government incentives to improve the new technology adoption: Subsidizing infrastructure investment or usage? Omega 2023, 114, 102740. [Google Scholar] [CrossRef]
  6. Archsmith, J.; Muehlegger, E.; Rapson, D.S. Future paths of electric vehicle adoption in the United States: Predictable determinants, obstacles, and opportunities. Environ. Energy Policy Econ. 2022, 3, 71–110. [Google Scholar] [CrossRef]
  7. Burra, L.T.; Al-Khasawneh, M.B.; Cirillo, C. Impact of charging infrastructure on electric vehicle adoption: A synthetic population approach. Travel Behav. Soc. 2024, 37, 100834. [Google Scholar] [CrossRef]
  8. Pamidimukkala, A.; Kermanshachi, S.; Rosenberger, J.M.; Hladik, G. Evaluation of barriers to electric vehicle adoption: A study of technological, environmental, financial, and infrastructure factors. Transp. Res. Interdiscip. Perspect. 2023, 22, 100962. [Google Scholar] [CrossRef]
  9. Kamis, A.; Abraham, P.S. Predictive models of electric vehicle adoption in the United States: Charging ahead with renewable energy. Transp. Res. Interdiscip. Perspect. 2024, 24, 101041. [Google Scholar] [CrossRef]
  10. Nicholas, M.; Hall, D.; Lutsey, N. Quantifying the electric vehicle charging infrastructure gap across US markets. Int. Counc. Clean Transp. 2019, 20, 1–39. [Google Scholar]
  11. Ledna, C.; Muratori, M.; Brooker, A.; Wood, E.; Greene, D. How to support EV adoption: Tradeoffs between charging infrastructure investments and vehicle subsidies in California. Energy Policy 2022, 165, 112931. [Google Scholar] [CrossRef]
  12. White, L.V.; Carrel, A.L.; Shi, W.; Sintov, N.D. Why are charging stations associated with electric vehicle adoption? Untangling effects in three United States metropolitan areas. Energy Res. Soc. Sci. 2022, 89, 102663. [Google Scholar] [CrossRef]
  13. Khan, H.A.U.; Price, S.; Avraam, C.; Dvorkin, Y. Inequitable access to EV charging infrastructure. Electr. J. 2022, 35, 107096. [Google Scholar] [CrossRef]
  14. Debnath, R.; Bardhan, R.; Reiner, D.M.; Miller, J. Political, economic, social, technological, legal and environmental dimensions of electric vehicle adoption in the United States: A social-media interaction analysis. Renew. Sustain. Energy Rev. 2021, 152, 111707. [Google Scholar] [CrossRef]
  15. Babic, J.; Carvalho, A.; Ketter, W.; Podobnik, V. A data-driven approach to managing electric vehicle charging infrastructure in parking lots. Transp. Res. Part D Transp. Environ. 2022, 105, 103198. [Google Scholar] [CrossRef]
  16. Illmann, U.; Kluge, J. Public charging infrastructure and the market diffusion of electric vehicles. Transp. Res. Part D Transp. Environ. 2020, 86, 102413. [Google Scholar] [CrossRef]
  17. Haidar, B.; Rojas, M.T.A. The relationship between public charging infrastructure deployment and other socio-economic factors and electric vehicle adoption in France. Res. Transp. Econ. 2022, 95, 101208. [Google Scholar] [CrossRef]
  18. Ou, S.; Lin, Z.; He, X.; Przesmitzki, S.; Bouchard, J. Modeling charging infrastructure impact on the electric vehicle market in China. Transp. Res. Part D Transp. Environ. 2020, 81, 102248. [Google Scholar] [CrossRef]
  19. Chen, R.; Fan, R.; Wang, D.; Yao, Q. Effects of multiple incentives on electric vehicle charging infrastructure deployment in China: An evolutionary analysis in complex network. Energy 2023, 264, 125747. [Google Scholar] [CrossRef]
  20. Langfelder, P.; Horvath, S. WGCNA: An R package for weighted correlation network analysis. BMC Bioinform. 2008, 9, 559. [Google Scholar] [CrossRef] [PubMed]
  21. Putnik, G.; Costa, E.; Alves, C.; Castro, H.; Varela, L.; Shah, V. Analysing the correlation between social network analysis measures and performance of students in social network-based engineering education. Int. J. Technol. Des. Educ. 2016, 26, 413–437. [Google Scholar] [CrossRef]
  22. Moni, M.A.; Liò, P. Network-based analysis of comorbidities risk during an infection: SARS and HIV case studies. BMC Bioinform. 2014, 15, 333. [Google Scholar] [CrossRef]
  23. Malisetty, S.; Ali, H.H.; Rastegari, E.; Siu, K.C. An innovative comparative analysis approach for the assessment of laparoscopic surgical skills. Surgeries 2023, 4, 46–57. [Google Scholar] [CrossRef]
  24. Thelagathoti, R.K.; Ali, H.H. A Correlation Network Model for Analyzing Mobility Data in Depression Related Studies. In Proceedings of the 16th International Conference on Health Informatics (HEALTHINF 2023), Lisbon, Portugal, 16–18 February 2023; pp. 416–423. [Google Scholar]
  25. Kim, S.; Thapa, I.; Ali, H.H. A Robust Network Model for Studying Microbiomes in Precision Agriculture Applications. In Proceedings of the 24th International Conference on Computational Science (ICCS 2024), Malaga, Spain, 2–4 July 2024; Springer: Cham, Switzerland, 2024; pp. 58–71. [Google Scholar]
  26. Gagarin, A.; Corcoran, P. Multiple domination models for placement of electric vehicle charging stations in road networks. Comput. Oper. Res. 2018, 96, 69–79. [Google Scholar] [CrossRef]
  27. Arkin, E.M.; Carmi, P.; Katz, M.J.; Mitchell, J.S.; Segal, M. Locating battery charging stations to facilitate almost shortest paths. Discret. Appl. Math. 2019, 254, 10–16. [Google Scholar] [CrossRef]
  28. Funke, S.; Nusser, A.; Storandt, S. Placement of loading stations for electric vehicles: No detours necessary! J. Artif. Intell. Res. 2015, 53, 633–658. [Google Scholar] [CrossRef]
  29. Funke, S.; Nusser, A.; Storandt, S. Placement of Loading Stations for Electric Vehicles: Allowing Small Detours. In Proceedings of the 26th International Conference on Automated Planning and Scheduling (ICAPS 2016), London, UK, 12–17 June 2016; AAAI Press: Washington, DC, USA, 2016; pp. 131–139. [Google Scholar]
  30. Agarwal, P.K.; Pan, J.; Victor, W. An efficient algorithm for placing electric vehicle charging stations. In Proceedings of the 27th International Symposium on Algorithms and Computation (ISAAC 2016), Sydney, Australia, 12–14 December 2016; Schloss-Dagstuhl-Leibniz Zentrum für Informatik: Wadern, Germany, 2016. [Google Scholar]
  31. Altundogan, T.G.; Yildiz, A.; Karakose, E. Genetic algorithm approach based on graph theory for location optimization of electric vehicle charging stations. In Proceedings of the 2021 Innovations in Intelligent Systems and Applications Conference (ASYU), Elazig, Turkey, 6–8 October 2021; IEEE: Piscataway, NJ, USA, 2021; pp. 1–5. [Google Scholar]
  32. Nigro, N. State EV Registration Data. Available online: https://www.atlasevhub.com/materials/state-ev-registration-data/ (accessed on 6 May 2024).
  33. Alternative Fueling Station Locator. Available online: https://afdc.energy.gov/stations (accessed on 6 May 2024).
  34. Newman, M.E.; Girvan, M. Finding and evaluating community structure in networks. Phys. Rev. E 2004, 69, 026113. [Google Scholar] [CrossRef] [PubMed]
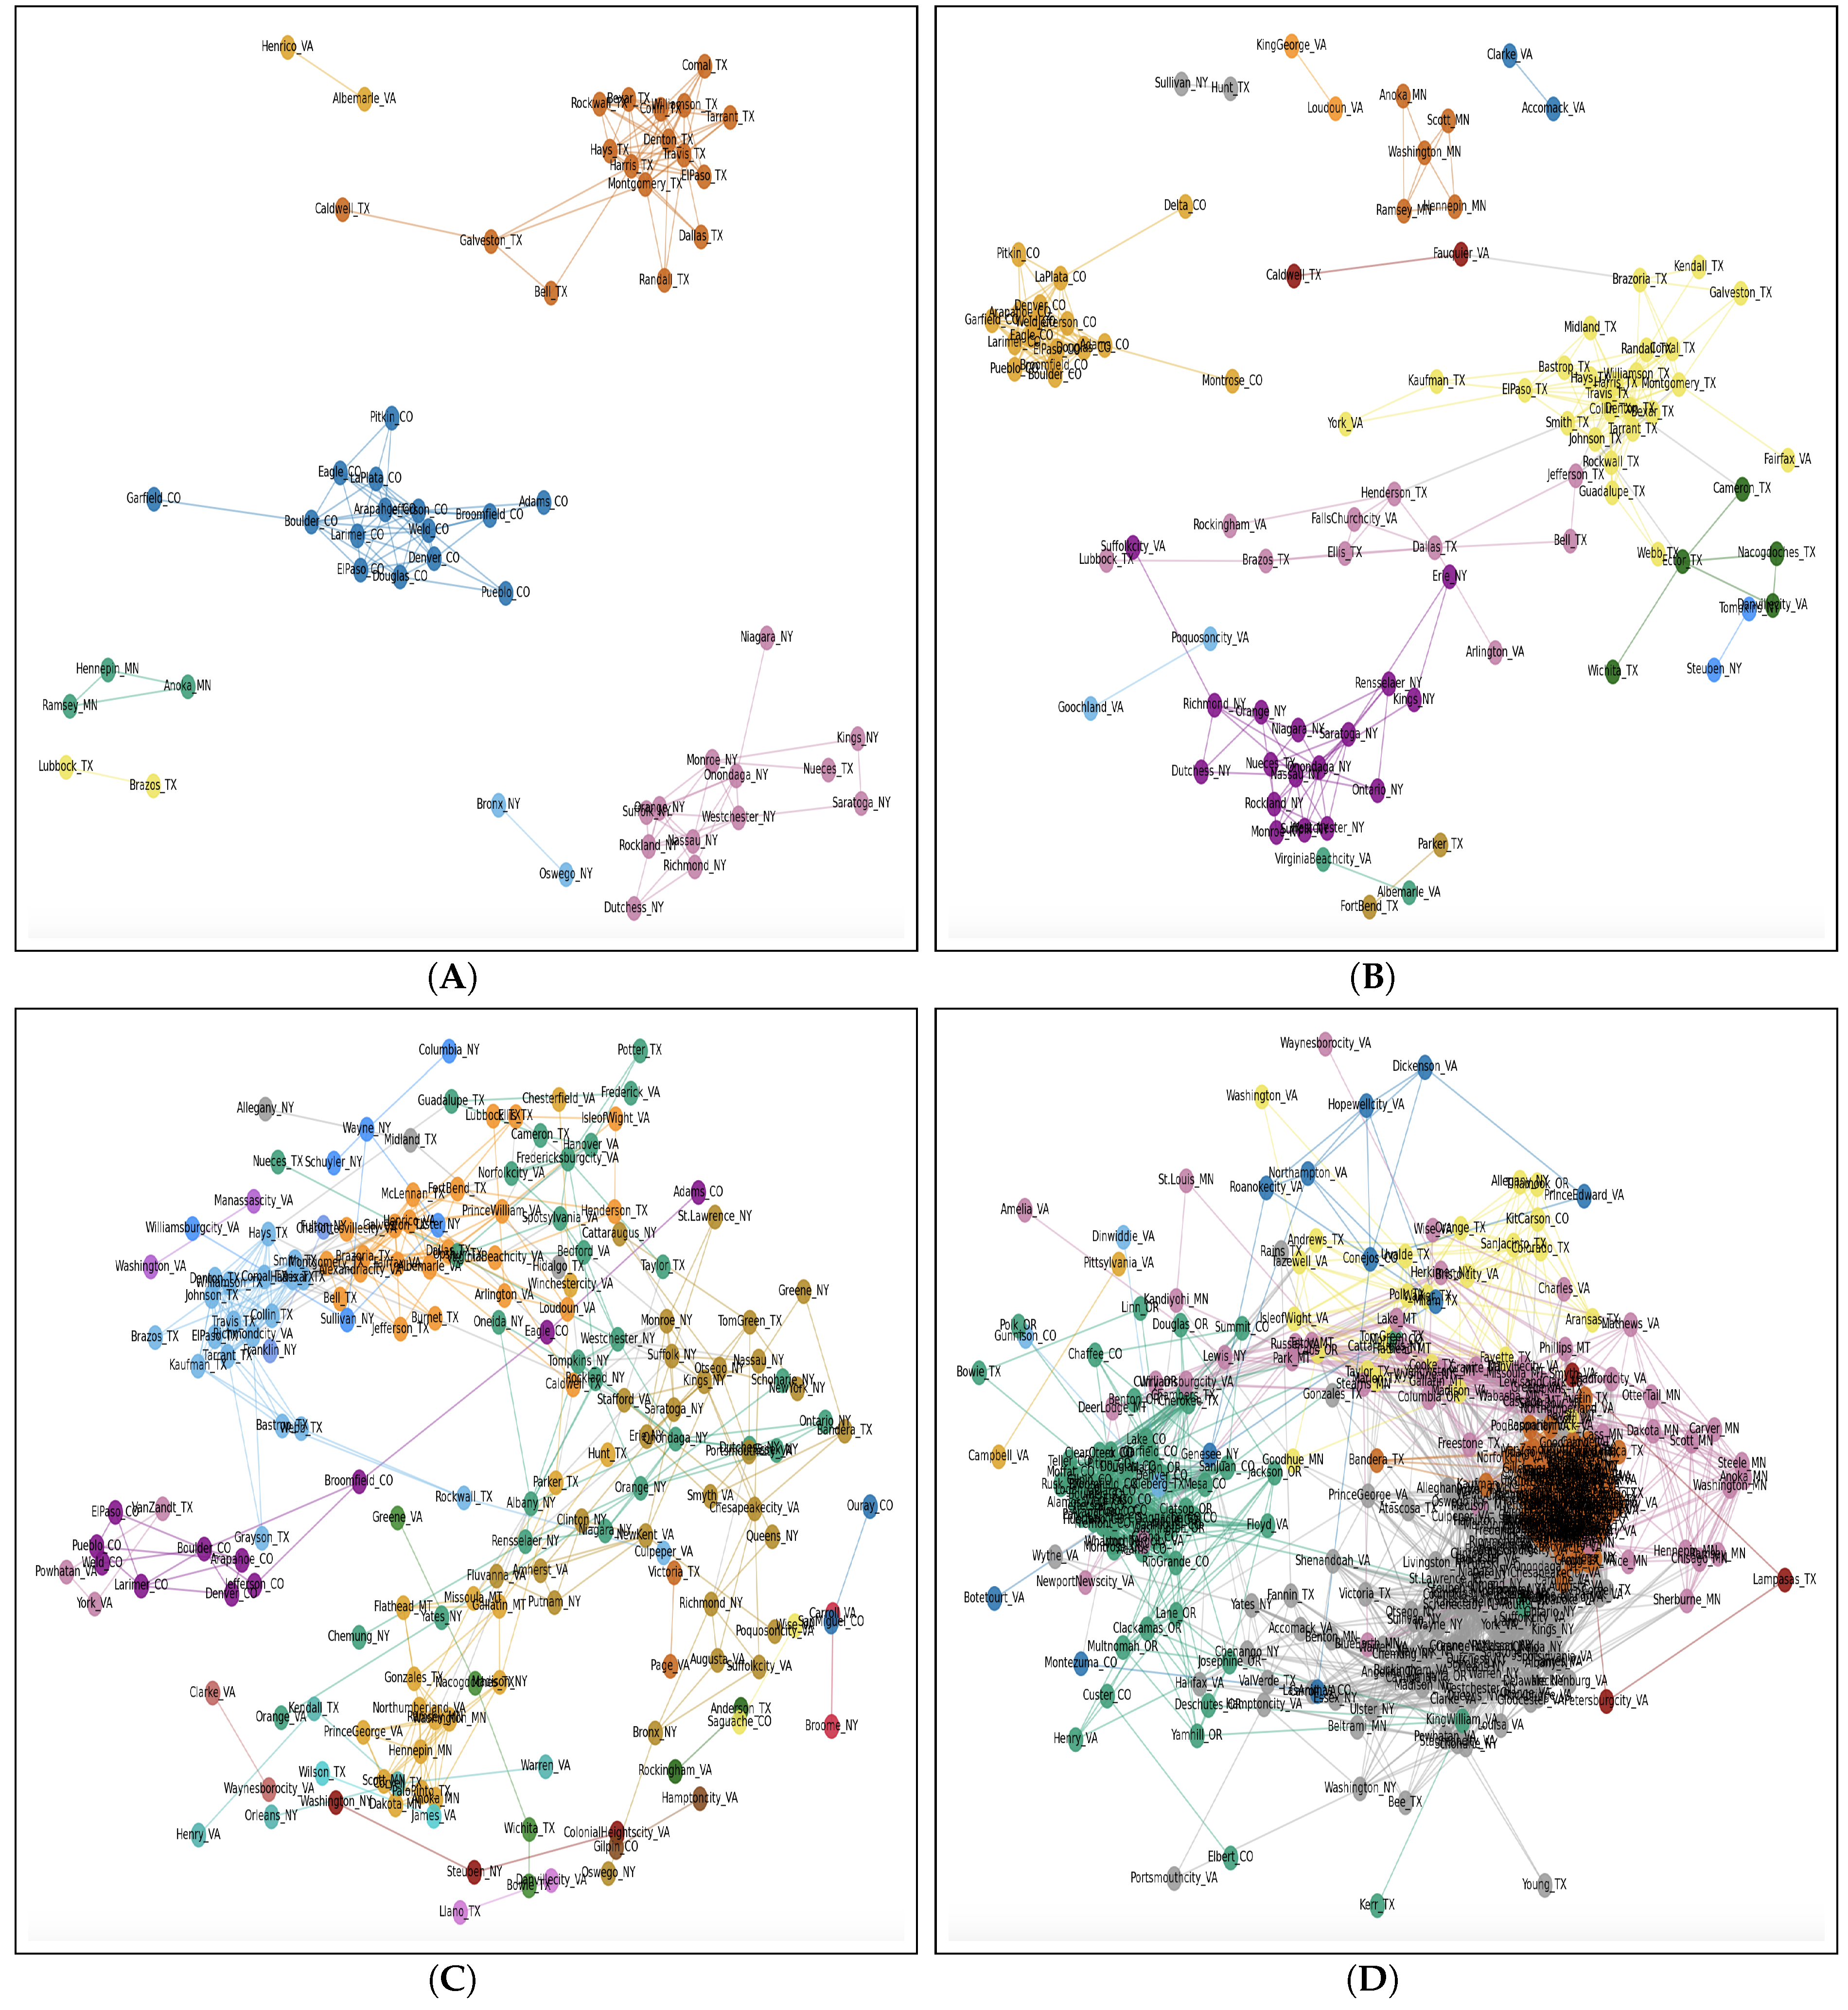
Figure 1. Correlation networks of EV adoption (2018–2022) used in Early Adoption Scenario using different time granularities. (A): Correlation network for monthly data—threshold: 0.7005. (B): Correlation network for bi-monthly data—threshold: 0.8015. (C): Correlation network for quarterly data—threshold: 0.8379. (D): Correlation network for bi-annually data—threshold: 0.8394.
Vehicles 07 00054 g001
Figure 2. Correlation networks of ALL types of chargers growth (2019–2023) used in Early Adoption scenario using different time granularities. (A): Correlation network for monthly data—threshold: 0.7000. (B): Correlation network for bi-monthly data—threshold: 0.7848. (C): Correlation network for quarterly data—threshold: 0.8439. (D): Correlation network for bi-annually data—threshold: 0.8500.
Vehicles 07 00054 g002
Figure 3. Correlation networks of EV adoption (2019–2023) used in Late Adoption scenario using different time granularities. (A): Correlation network for monthly data—threshold: 0.7020. (B): Correlation network for bi-monthly data—threshold: 0.8015. (C): Correlation network for quarterly data—threshold: 0.8379. (D): Correlation network for bi-annually data—threshold: 0.8394.
Vehicles 07 00054 g003
Figure 4. Correlation networks of ALL types of chargers growth (2018–2022) used in Late Adoption scenario using different time granularities. (A): Correlation network for monthly data—threshold: 0.7110. (B): Correlation network for bi-monthly data—threshold: 0.7848. (C): Correlation network for quarterly data—threshold: 0.8439. (D): Correlation network for bi-annually data—threshold: 0.8500.
Vehicles 07 00054 g004
Table 1. Number of completed counties by state.
NoState# of Completed Counties
1Colorado20
2Minnesota3
3Montana2
4New York48
6Texas30
7Virginia34
8Total137
Table 2. Correlation between the EV adoption correlation and the correlation of various charging infrastructure types (DC chargers, Level 2 chargers, and ALL chargers) for Early Adoption scenario, across different levels of temporal granularity.
GranularityEV vs. DCEV vs. Level 2EV vs. ALL
Monthly0.17720.22050.2305
Bi-monthly0.09720.13450.1416
Quarterly0.07150.06240.0543
Bi-annually0.01230.03660.0214
Table 3. Correlations between EV adoption and various charging infrastructure types (DC chargers, Level 2 chargers, and ALL chargers) for Late Adoption, across different levels of temporal granularity.
GranularityEV vs. DCEV vs. Level 2EV vs. ALL
Monthly0.14150.25290.2667
Bi-monthly0.18060.13470.1824
Quarterly0.08970.07370.0619
Bi-annually0.02630.03680.0203
Table 4. Number of counties rejecting null hypothesis of causal relationships in Early Adoption scenario where “EV” causes “ALL”.
Granularity\LagHalf-YearOne-YearTwo-YearThree-YearUnique
monthly1220161349
Bi-monthly1216181452
quarterly1719171557
Bi-annual91261530
Unique2838453393
Table 5. Number of counties rejecting null hypothesis of causal relationships in Late Adoption scenario where “ALL” causes “EV”.
Granularity\LagHalf-YearOne-YearTwo-YearThree-YearUnique
monthly18119937
Bi-monthly23941239
quarterly1564827
Bi-annual1787835
Unique4426202677
Table 6. Number of counties rejecting null hypothesis of causal relationships in Late Adoption scenario where “ALL” causes “EV”.
StateEV → ALLALL → EVUnique
New York362640
Texas152326
Virginia231627
Colorado16818
Minnesota222
Montana122
Unique9377115
Disclaimer/Publisher’s Note: The statements, opinions and data contained in all publications are solely those of the individual author(s) and contributor(s) and not of MDPI and/or the editor(s). MDPI and/or the editor(s) disclaim responsibility for any injury to people or property resulting from any ideas, methods, instructions or products referred to in the content.