Article

Optimization of Adaptive Cruise Control Strategies Based on the Responsibility-Sensitive Safety Model

School of Mechatronics and Vehicle Engineering, Chongqing Jiaotong University, Chongqing 400074, China
*
Author to whom correspondence should be addressed.
Vehicles 2025, 7(2), 28; https://doi.org/10.3390/vehicles7020028
Submission received: 15 January 2025 / Revised: 14 February 2025 / Accepted: 18 February 2025 / Published: 26 March 2025
(This article belongs to the Special Issue AI-Empowered Assisted and Autonomous Driving)

Abstract

:
The collision avoidance capability of autonomous vehicles in extreme traffic conditions remains a focal point of research. This paper introduces an Adaptive Cruise Control (ACC) strategy based on Model Predictive Control (MPC) and Responsibility-Sensitive Safety (RSS) models. Simulations were conducted in the CARLA environment, where the lead vehicle underwent various rapid deceleration scenarios to optimize the following vehicle’s braking strategy. By integrating the multi-step predictive optimization capabilities of MPC with the dynamic safety assessment mechanisms of RSS, the proposed strategy ensures safe following distances while achieving rapid and precise speed adjustments, thereby enhancing the system’s responsiveness and safety. The model also incorporates a secondary optimization to balance comfort and stability, thereby improving the overall performance of autonomous vehicles. The use of multi-dimensional assessment metrics, such as Time to Collision (TTC), Time Exposed TTC (TET), and Time Integrated TTC (TIT), addresses the limitations of using TTC alone, which only reflects instantaneous collision risk. The optimization of the model in this paper aims to improve the safety and comfort of the following vehicle in scenarios with various gap distances, and it has been validated through the SSM multi-indicator approach. Experimental results demonstrate that the improved ACC model significantly enhances vehicle safety and comfort in scenarios involving large gaps and short-distance emergency braking by the lead vehicle, validating the method’s effectiveness in various extreme traffic scenarios.

1. Introduction

With the advent of the 5G era, the automotive industry is experiencing a new wave of technological revolution and industrial transformation. The penetration rate of intelligent driving assistance systems in passenger vehicles in our country has been increasing year by year. One of the hallmark features of ADAS (Advanced Driving Assistance Systems) is the ACC (Adaptive Cruise Control) system. ACC systems enhance longitudinal control by assisting drivers with speed regulation and vehicle following, effectively reducing driving load and increasing traffic efficiency. Ensuring the safety of Autonomous Vehicles (AVs) during the following process presents an inevitable challenge in the realization of fully automated driving. According to the disengagement reports released by the California Department of Motor Vehicles (DMV), Waymo has driven 1.2 million miles in California, reducing the disengagement rate to 0.09 miles per 1000 miles driven. Although this rate places the company at the forefront among all firms, it also highlights that Autonomous Vehicles (AVs) cannot fully ensure safety under various extreme conditions [1]. Although existing ACC systems can maintain a safe following distance under certain conditions, they still face challenges regarding safety and response efficiency in complex traffic environments. Specifically, in situations involving sudden deceleration or emergency braking by the lead vehicle, traditional ACC systems may fail to react promptly and appropriately, overlooking the dynamic changes that may occur during driving. This leads to potential collision risks.
Vision zero and the safe system approach are two concepts that are currently being advocated for and explored worldwide [2]. Developed by Intel Mobileye, the Responsibility-Sensitive Safety (RSS) model serves as a mathematical framework for ensuring the safety of autonomous vehicles [3,4]. RSS formalizes “common sense” rules and human judgments about the meaning of safe driving, guaranteeing that autonomous vehicles maintain a “safe state” under all circumstances. Thus, RSS ensures that autonomous vehicles are never at fault in accidents. Consequently, RSS can be implemented as a constraint in the planning and control algorithms of AVs to enhance safety. The RSS model defines safe following distances and appropriate responses to avoid hazardous situations in driving scenarios. Moreover, RSS establishes a set of parameters that need to be calibrated to make autonomous vehicles safer and more efficient. Research indicates that different combinations of these parameters significantly impact traffic flow. Two deceleration parameters of the model and the response time of the vehicle controller are identified as critical factors. Although maximum deceleration also affects outcomes, its impact is less significant compared to other factors. Consequently, RSS serves as a safety mechanism, ensuring that autonomous vehicles timely perceive and respond to hazardous cut-in scenarios, thereby mitigating potential conflicts.
ACC has been commercially applied in the automotive market, not only improving traffic flow and driving comfort but also reducing traffic accidents [5,6]. Recent years have seen a diversification in research on the most critical aspect of ACC—spacing strategy [7]. Research has evolved from an initial fixed spacing strategy to a variable spacing strategy. Yanakiev et al. [8] proposed a variable time headway (VTH) strategy that considers relative velocity, suggesting that the time headway is correlated with relative speed. Yang Lei et al. [9] proposed an enhanced variable time headway strategy that accounts for the dynamic following characteristics of drivers. Additionally, Chen et al. [10] introduced a variable time headway strategy that incorporates macroscopic traffic flow theory, relative acceleration, and the acceleration of the lead vehicle, which further improves traffic flow stability and enhances road capacity. Mostafa H. et al. proposed an FCW model based on natural driving data, determining the minimum warning distance by analyzing the driver’s following behavior. However, the article only uses TTC to analyze and determine the results, which could be further expanded. Additionally, the reliability and robustness of the behavior-based model proposed in the paper need to be further validated in various real-world driving environments [11]. Research indicates that too small a following distance leads to frequent and intense acceleration and deceleration maneuvers to cope with complex and variable driving conditions, resulting in decreased comfort for drivers and passengers, increased fuel consumption, and a higher potential for rear-end collisions in emergency situations, thereby reducing safety. The majority of studies on collision risk early warning systems have utilized TTC as a key metric for alerts [12]. Winkler conducted research based on TTC to determine the optimal timing for alerts at different stages of collision warning systems [13]. Furthermore, Crundall and colleagues evaluated human drivers’ ability to assess collision risks in various scenarios using TTC as the benchmark [14]. Ye Li et al. developed an I2V integrated system that combines ACC and VSL, aiming to reduce rear-end collision risks on highways. The experiments also used indicators such as TIT and TET for evaluation and validation. However, the scenarios used in the study were limited, and the focus was primarily on vehicle safety, with less consideration given to aspects such as comfort [15]. Hao Wang et al. evaluated the impact of the IDM-based CACC model on reducing rear-end collision risks and quantified the risks using the SSM approach. However, while communication-based methods are currently susceptible to interference, the method proposed in this paper offers higher robustness and reliability [16].
Model Predictive Control (MPC), with its multi-step prediction and rolling optimization features, is widely applied in the longitudinal control strategy design of autonomous vehicles. This paper presents an improved longitudinal planning control framework, addressing the challenge of directly embedding the nonlinear constraints of RSS into the MPC optimization. The approach proposed here transforms the safety distance defined by RSS into a desired tracking trajectory for MPC, rather than a hard constraint. Additionally, multi-objective weight adjustment and secondary optimization mechanisms are introduced in the MPC objective function to balance vehicle safety and comfort. In the experiments, a multi-dimensional evaluation framework combining TTC, TET, and TIT is used to comprehensively validate the system’s overall performance in scenarios such as emergency braking and large gap distances.

2. Methods

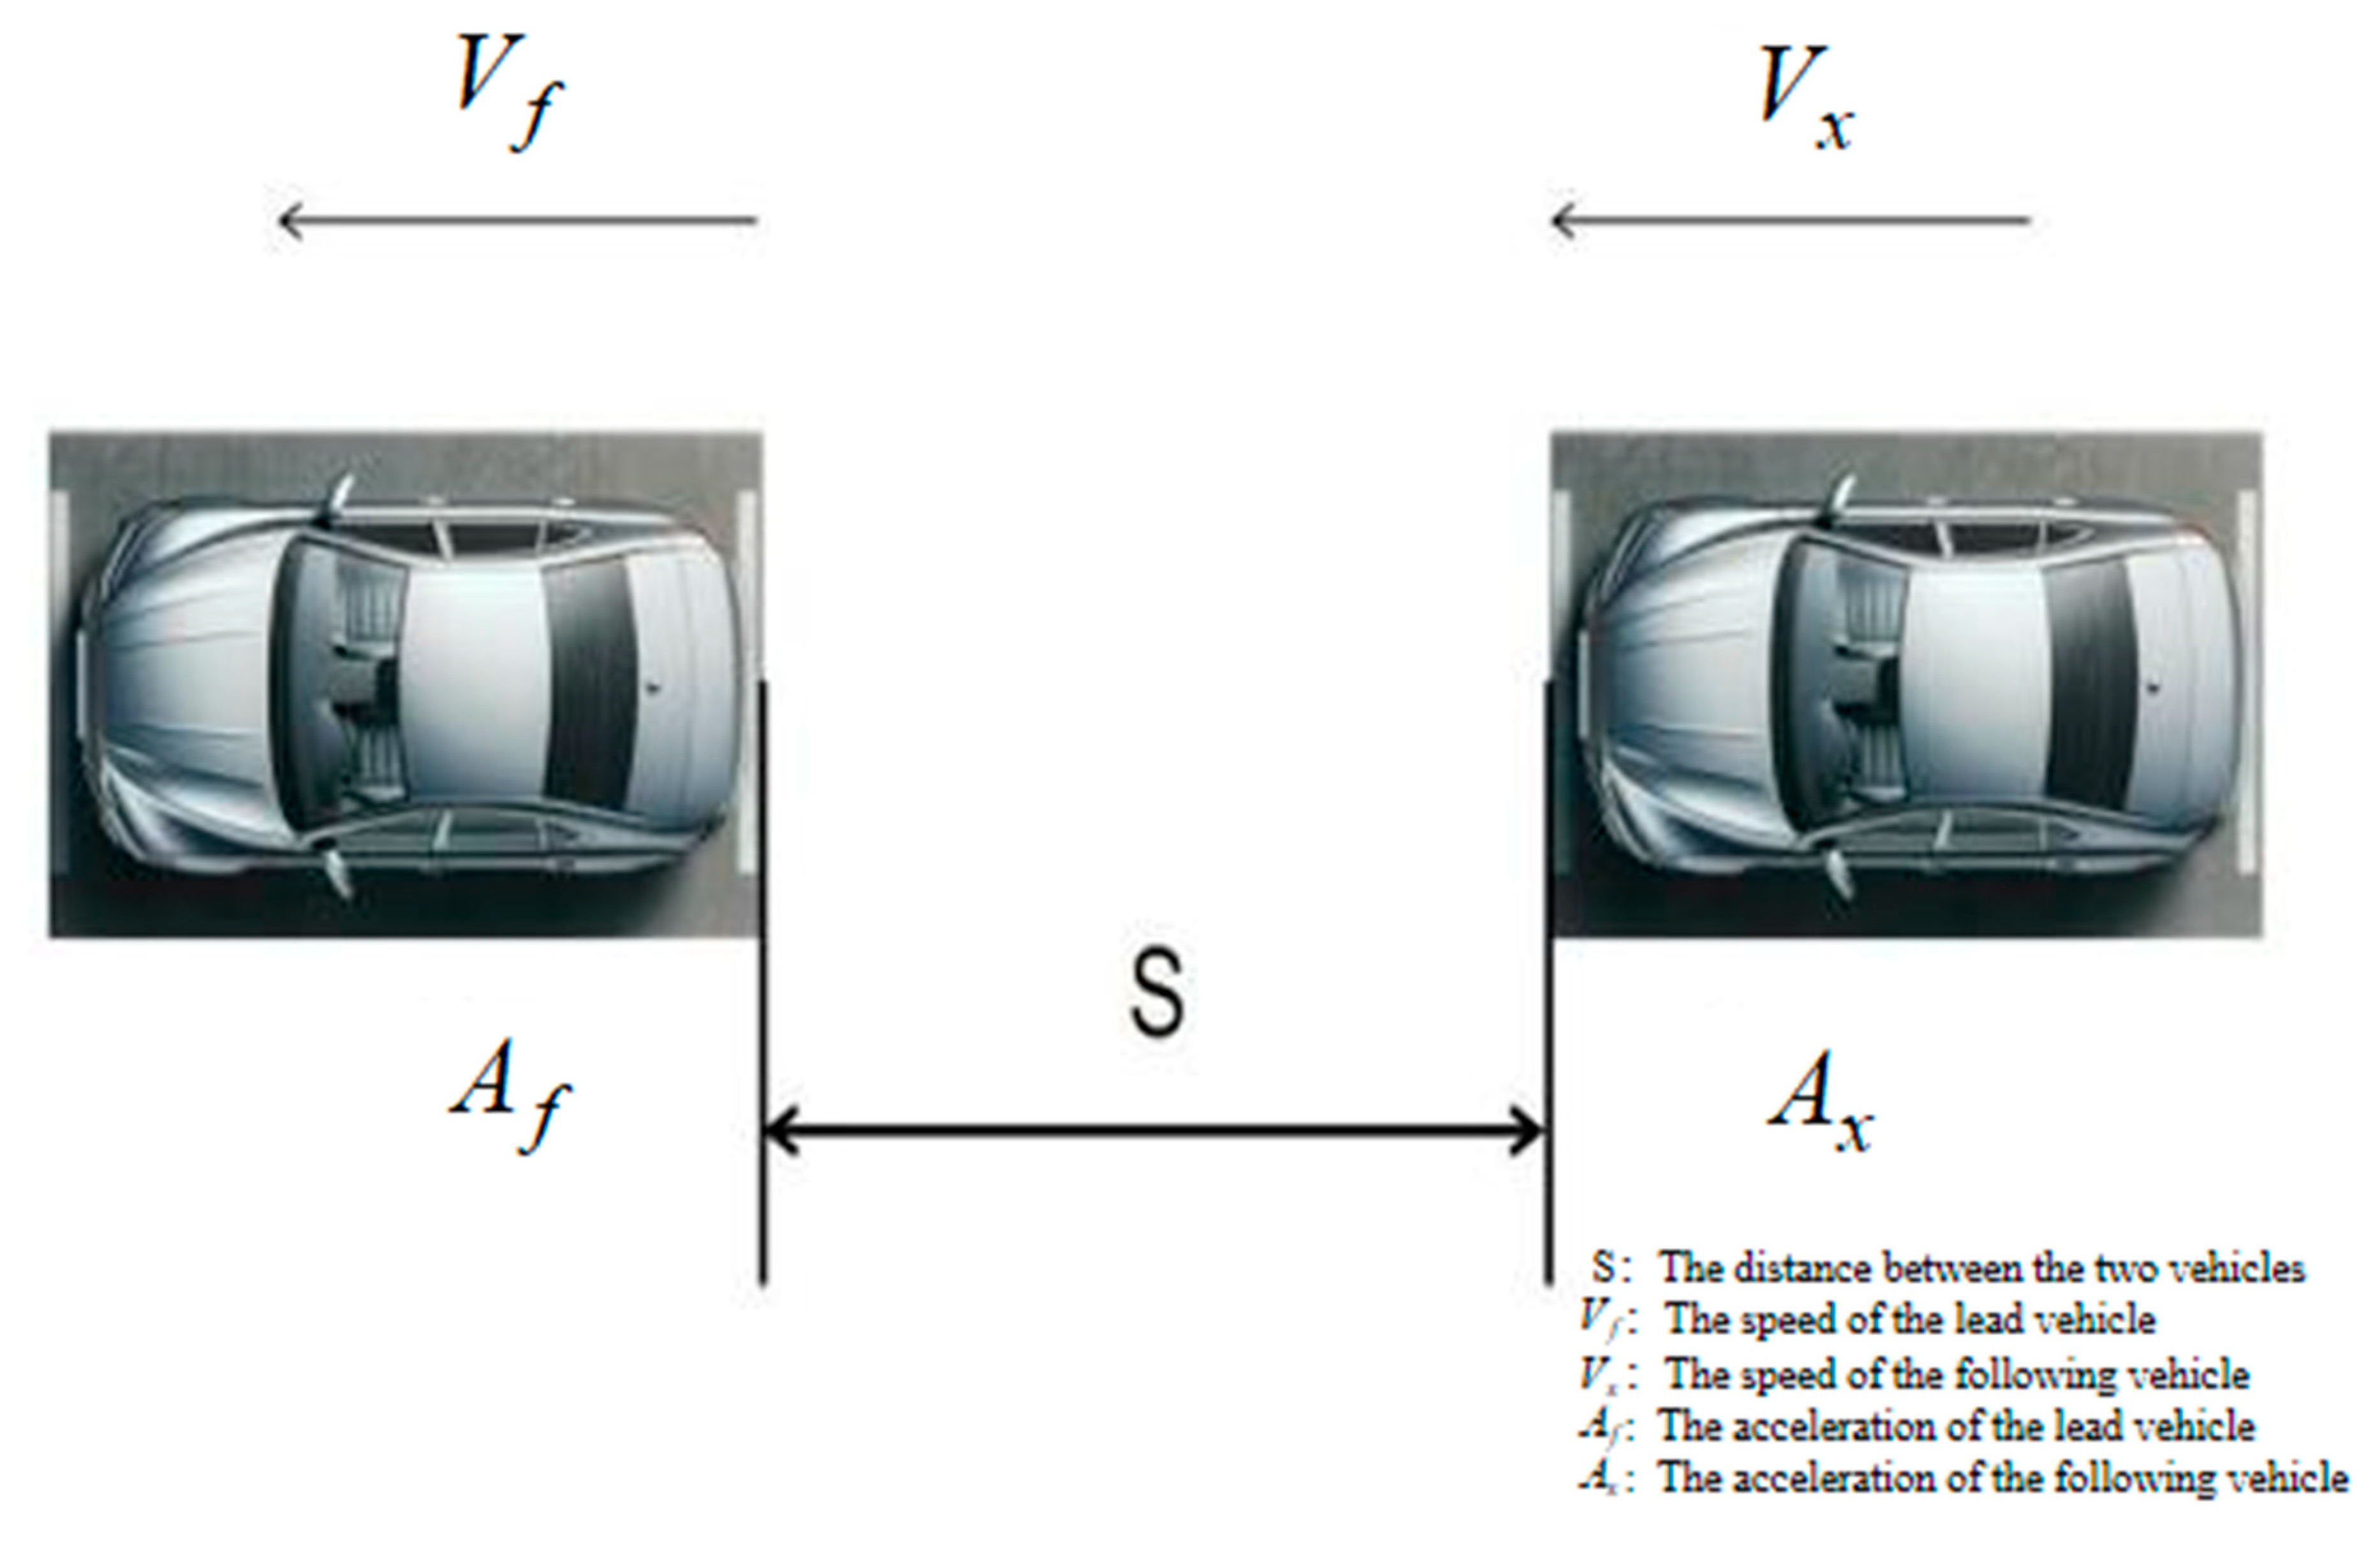
2.1. Following Cruise Framework Design

This paper establishes a dynamic model of the ego vehicle and the leading vehicle and designs an MPC controller to optimize following distance and vehicle speed, ensuring both driving safety and passenger comfort. It elaborately describes the system modeling, MPC control framework, solution methods for the optimization problem, and the analysis of simulation results, providing a reference for longitudinal planning control in autonomous driving. The improved ACC algorithm was validated on the CARLA platform, where tests were conducted in Town01 to compare the ACC algorithms embedded with RSS against the original ACC algorithms. The testing and evaluation were carried out using the Systematic Safety Margin (SSM) method.
The test vehicle is equipped with eight surround cameras providing, a 360-degree field of vision and a 250 m range forward. The vehicle used in CARLA has a weight of approximately 2500 kg, a maximum braking torque of around 5000 N m , and an engine power of approximately 300 HP. The model utilizes information from these sensors, such as the ego vehicle’s speed, the lead vehicle’s speed, and the relative velocity between the two vehicles, and feeds these data into algorithms. These algorithms then calculate the lead vehicle’s speed and a custom-defined ideal safe distance. Ultimately, the optimized ACC algorithm determines the following vehicle’s ideal acceleration based on these calculations. The kinematic model for vehicle following is illustrated in Figure 1. In this model, V f and V x represent the speeds of the lead and following vehicles, respectively, while A f and A x also denote the accelerations of the lead and following vehicles, respectively. S denotes the distance between the two vehicles.
The improved ACC system maintains a safe distance from the vehicle ahead based on the acceleration data of both the ego vehicle and the lead vehicle. Traditional ACC systems typically rely on a fixed time headway model to maintain the desired safe distance, as shown in the following equation:
D safe = D default + T gap × V x
In the formulation, parameters D default and T gap are design variables; D default represents the safe stopping distance, T gap is the time headway, and V x denotes the speed of the ego vehicle. To ensure the safety of autonomous vehicles during operation, a safety distance constraint has been designed to ensure that the relative distance always exceeds the safe distance, as outlined in the following equation:
D relative D safety 0

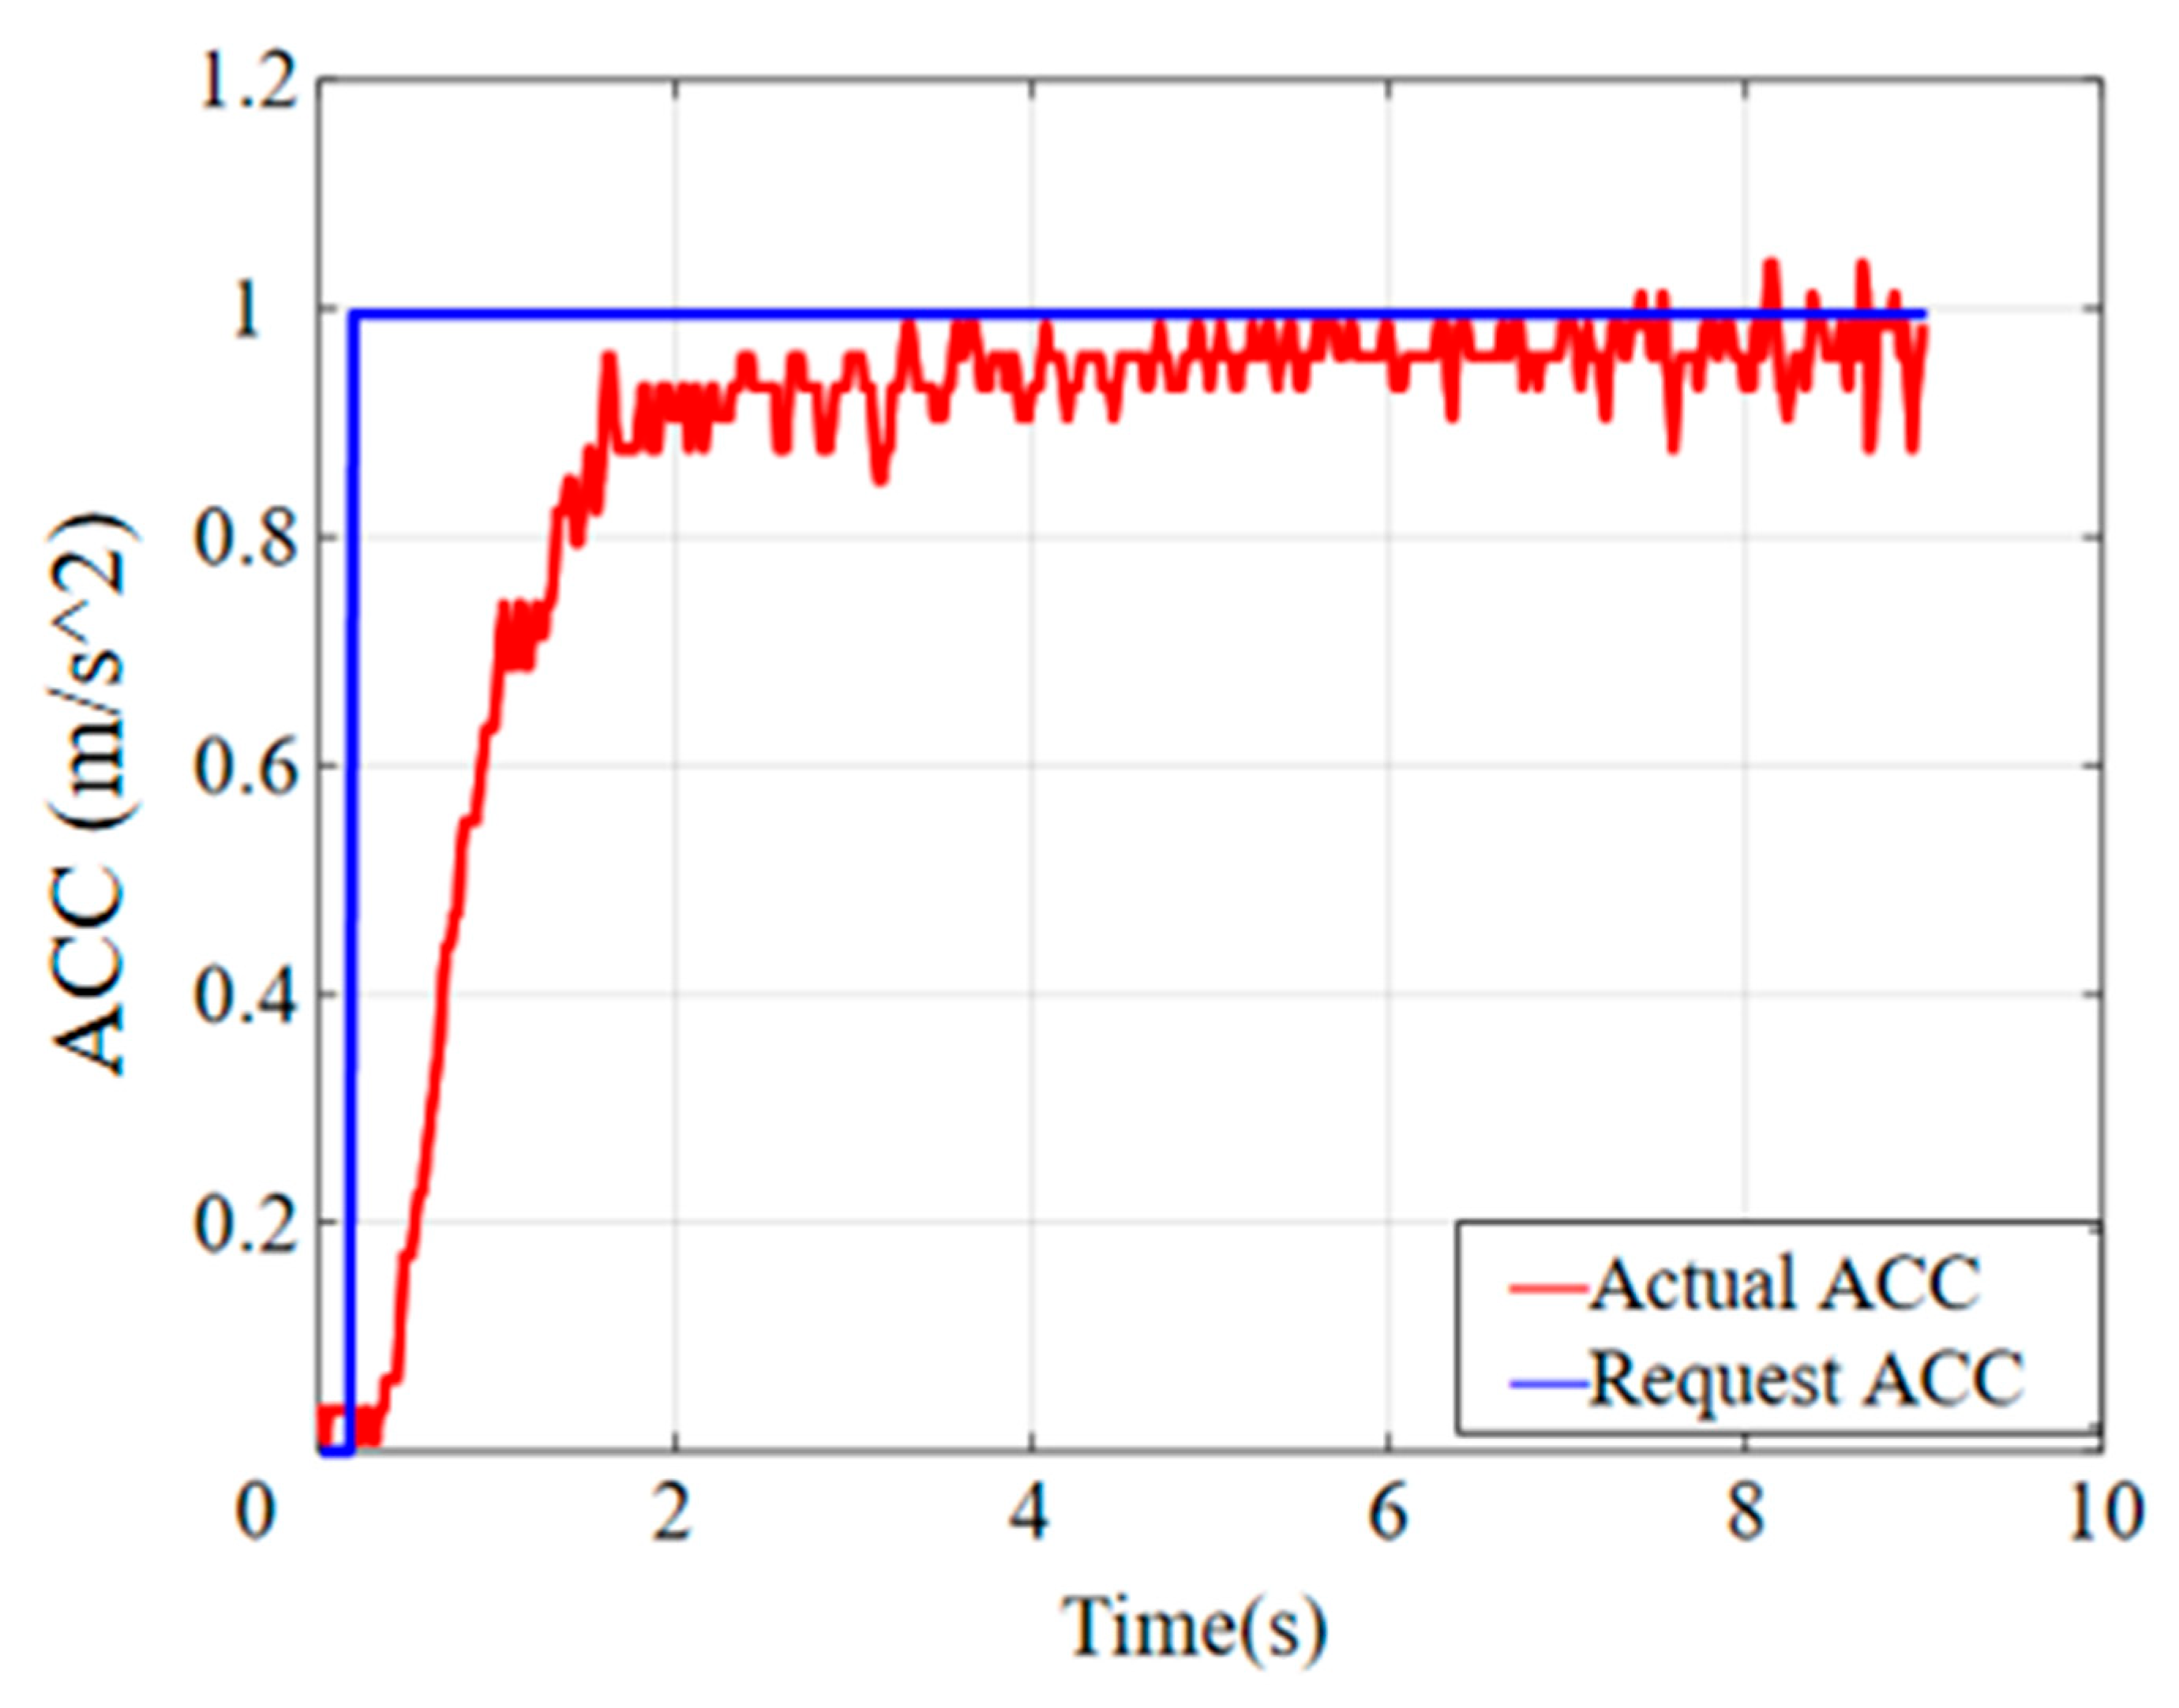
2.2. MPC Optimization Design

This paper is based on MPC, utilizing current moment information and the dynamic model of the process. A finite-time horizon optimization strategy is employed, which leverages the historical information of the controlled object and future inputs to perform online iterative optimization calculations. This approach compensates for uncertainties due to model inaccuracies in a timely manner, thereby enhancing the control effectiveness of the system and predicting future system responses. The MPC state equation is designed as follows:
S ( k + 1 ) v r ( k + 1 ) v e ( k + 1 ) = 1 T s 0 0 0 0 1 0 0 0 1 0 S ( k ) v r ( k ) v e ( k ) + T s 2 2 T s T s a req ( k ) + 0 1 0 v f ( k + 1 )
In the configuration, T s represents the time step interval for MPC updates, while S ( k + 1 ) , v r ( k + 1 ) , and v r ( k + 1 ) respectively denote the relative distance between the ego vehicle and the lead vehicle at time k + 1 , the relative speed at time k + 1 , and the ego vehicle’s speed at time k + 1 . The resulting system output equation is expressed as follows:
S ( k ) v r ( k ) = 1 0 0 0 1 0 S ( k ) v r ( k ) v e ( k )
The design of the state matrix, input matrix, output matrix, and direct transfer matrix is based on the state-space prediction equations X . = A X + B U and Y = C X + D U .
A = 1 T s 0 0 0 0 1 0 0 0 1 0 B = T s 2 2 T s T s G = 0 1 0
C = 1 0 0 0 1 0 X = S V r V e Y = S V r
The optimization step length of the strategy is set to N p , beginning at the current moment, labeled as k , and continuing up to moment k + N p . The system’s output trajectory during this interval is defined as follows:
Y τ = S x X ( k ) + S u + U + S G S v f
where Y τ , S x , S u , U , S G , and S v f represent the following:
Y τ = Y ( k + 1 ) Y ( k + 2 ) Y ( k + N p ) S x = C A C A 2 M C A N p S u = C B 0 0 C A B C B 0 0 C A N p 1 B C A N p 2 B C B
U = a req ( k ) a r e q ( k + 1 ) a req ( k + N p 1 ) S G = C G 0 0 C A G C G 0 0 C A N p 1 G C A N p 2 G C G S v f = v f ( k + 1 ) v f ( k + 2 ) v f ( k + N p )
The optimization objective of the final strategy is defined as follows:
arg min U J = ( Y τ Y r ) T Q ( Y τ Y r ) + U k T R U k + ( M U ) T P ( M U )
In the optimization framework, Q , R , and P represent weight matrices; D represents the differential matrix of U , which is used to compute the differences in continuous control inputs; Y τ refers to the predicted values after the rolling optimization of MPC; and Y r refers to the observation value of RSS, which is the desired value. MPC is solved by the difference between the predicted and observed values, thus avoiding the impact of the nonlinear characteristics of RSS on the MPC. Disregarding the constant terms, the problem is transformed into a quadratic programming problem, defined as follows:
min J = 1 2 U T H U + F U s . t . U min < U < U max
Within this context:
H = 2 ( S u T Q S u + R + M T P M )
F = 2 ( X T S x T Q S u Y r T Q S u + S v f T S G T Q T S u )
The quadprog solver is employed to solve the quadratic programming problem formulated by the MPC. This process generates the optimal sequence of accelerations, ensuring the minimization of the cost function and adherence to control constraints.
In order to collect more realistic data, this paper constructs an acceleration model based on actual vehicle behavior. The model processes the acceleration data derived from the enhanced MPC to simulate the true vehicle acceleration response characteristics. Considering the nonlinear properties of the vehicle’s longitudinal drive system, the study models the vehicle’s acceleration response as a first-order inertial element 1 T x s + 1 . This element compensates for the vehicle’s delayed output relative to the desired acceleration [17]. The experimental results are illustrated in Figure 2.
As illustrated in Figure 2, demonstrating the system’s quick response capability, the actual acceleration rapidly increases and progressively approaches the desired acceleration. Employing the identification method for first-order inertial elements, the time constant is determined when the response curve reaches 63.2% of its final value. The measured time constant T x is 0.65 s.

2.3. Integration of RSS into MPC

This paper embeds the RSS model into an MPC-based ACC system and evaluates its performance through simulations of various sudden deceleration scenarios. The experimental results demonstrate that the enhanced ACC system is capable of incorporating RSS functionality in most deceleration risk scenarios, achieving the goal of improving vehicle safety. Furthermore, the system exhibits superior performance in terms of vehicle response speed, comfort, and stability. The safe longitudinal distance for autonomous following is determined according to the RSS model, as outlined in the following equation:
d min = V x ρ + 1 2 α max ρ 2 + V x + ρ α max 2 2 β min V f 2 2 β max
In the aforementioned equation, d min represents the minimum safe distance in the RSS model, V x denotes the speed of the ego vehicle, ρ signifies the response time, α max indicates the maximum acceleration of the ego vehicle, β min refers to the minimum deceleration for braking in the RSS model, β max denotes the maximum deceleration for braking in the RSS model, and V f represents the speed of the lead vehicle. The RSS model is significantly influenced by its parameters. To select key parameters, this study refers to the Gipps following car model parameters calibrated for drivers in Shanghai [18]. The following car scenarios used for the experiments are designed according to the pre-collision scenarios specified by the National Highway Traffic Safety Administration (NHTSA), as shown in Table 1.

3. Surrogate Safety Measurements

3.1. Time to Collision

In the design and evaluation of ACC systems, safety is a paramount consideration. The Systematic Safety Margin (SSM) is often employed to quantify the potential occurrence and severity of vehicle conflicts. Measurements are typically based on analyses of vehicle actions, vehicle dynamics, collision safety margins, and risk-avoidance behaviors. TTC is one of the most commonly used safety indicators within these systems. It not only quantifies potential collision risks but also provides crucial insights for ACC control strategies. TTC is defined as the time remaining before a potential collision between two vehicles; thus, a smaller TTC indicates a more severe conflict. Typically, a TTC threshold is set at 3 s, and values below this threshold are recognized by the system as a risk state. The formula for calculating TTC is as follows:
T T C i ( t ) = x i 1 ( t ) x i ( t ) L i 1 V i ( t ) V i 1 ( t ) V i ( t ) > V i 1 ( t )             V i ( t ) V i 1 ( t )
In the aforementioned formula, x i ( t ) denotes the position of the ego vehicle at time stamp t , L i 1 represents the length of the lead vehicle, V i ( t ) indicates the speed of the ego vehicle at time stamp t , V i 1 ( t ) corresponds to the speed of the lead vehicle at time stamp t , and x i 1 ( t ) refers to the position of the lead vehicle at time stamp t .

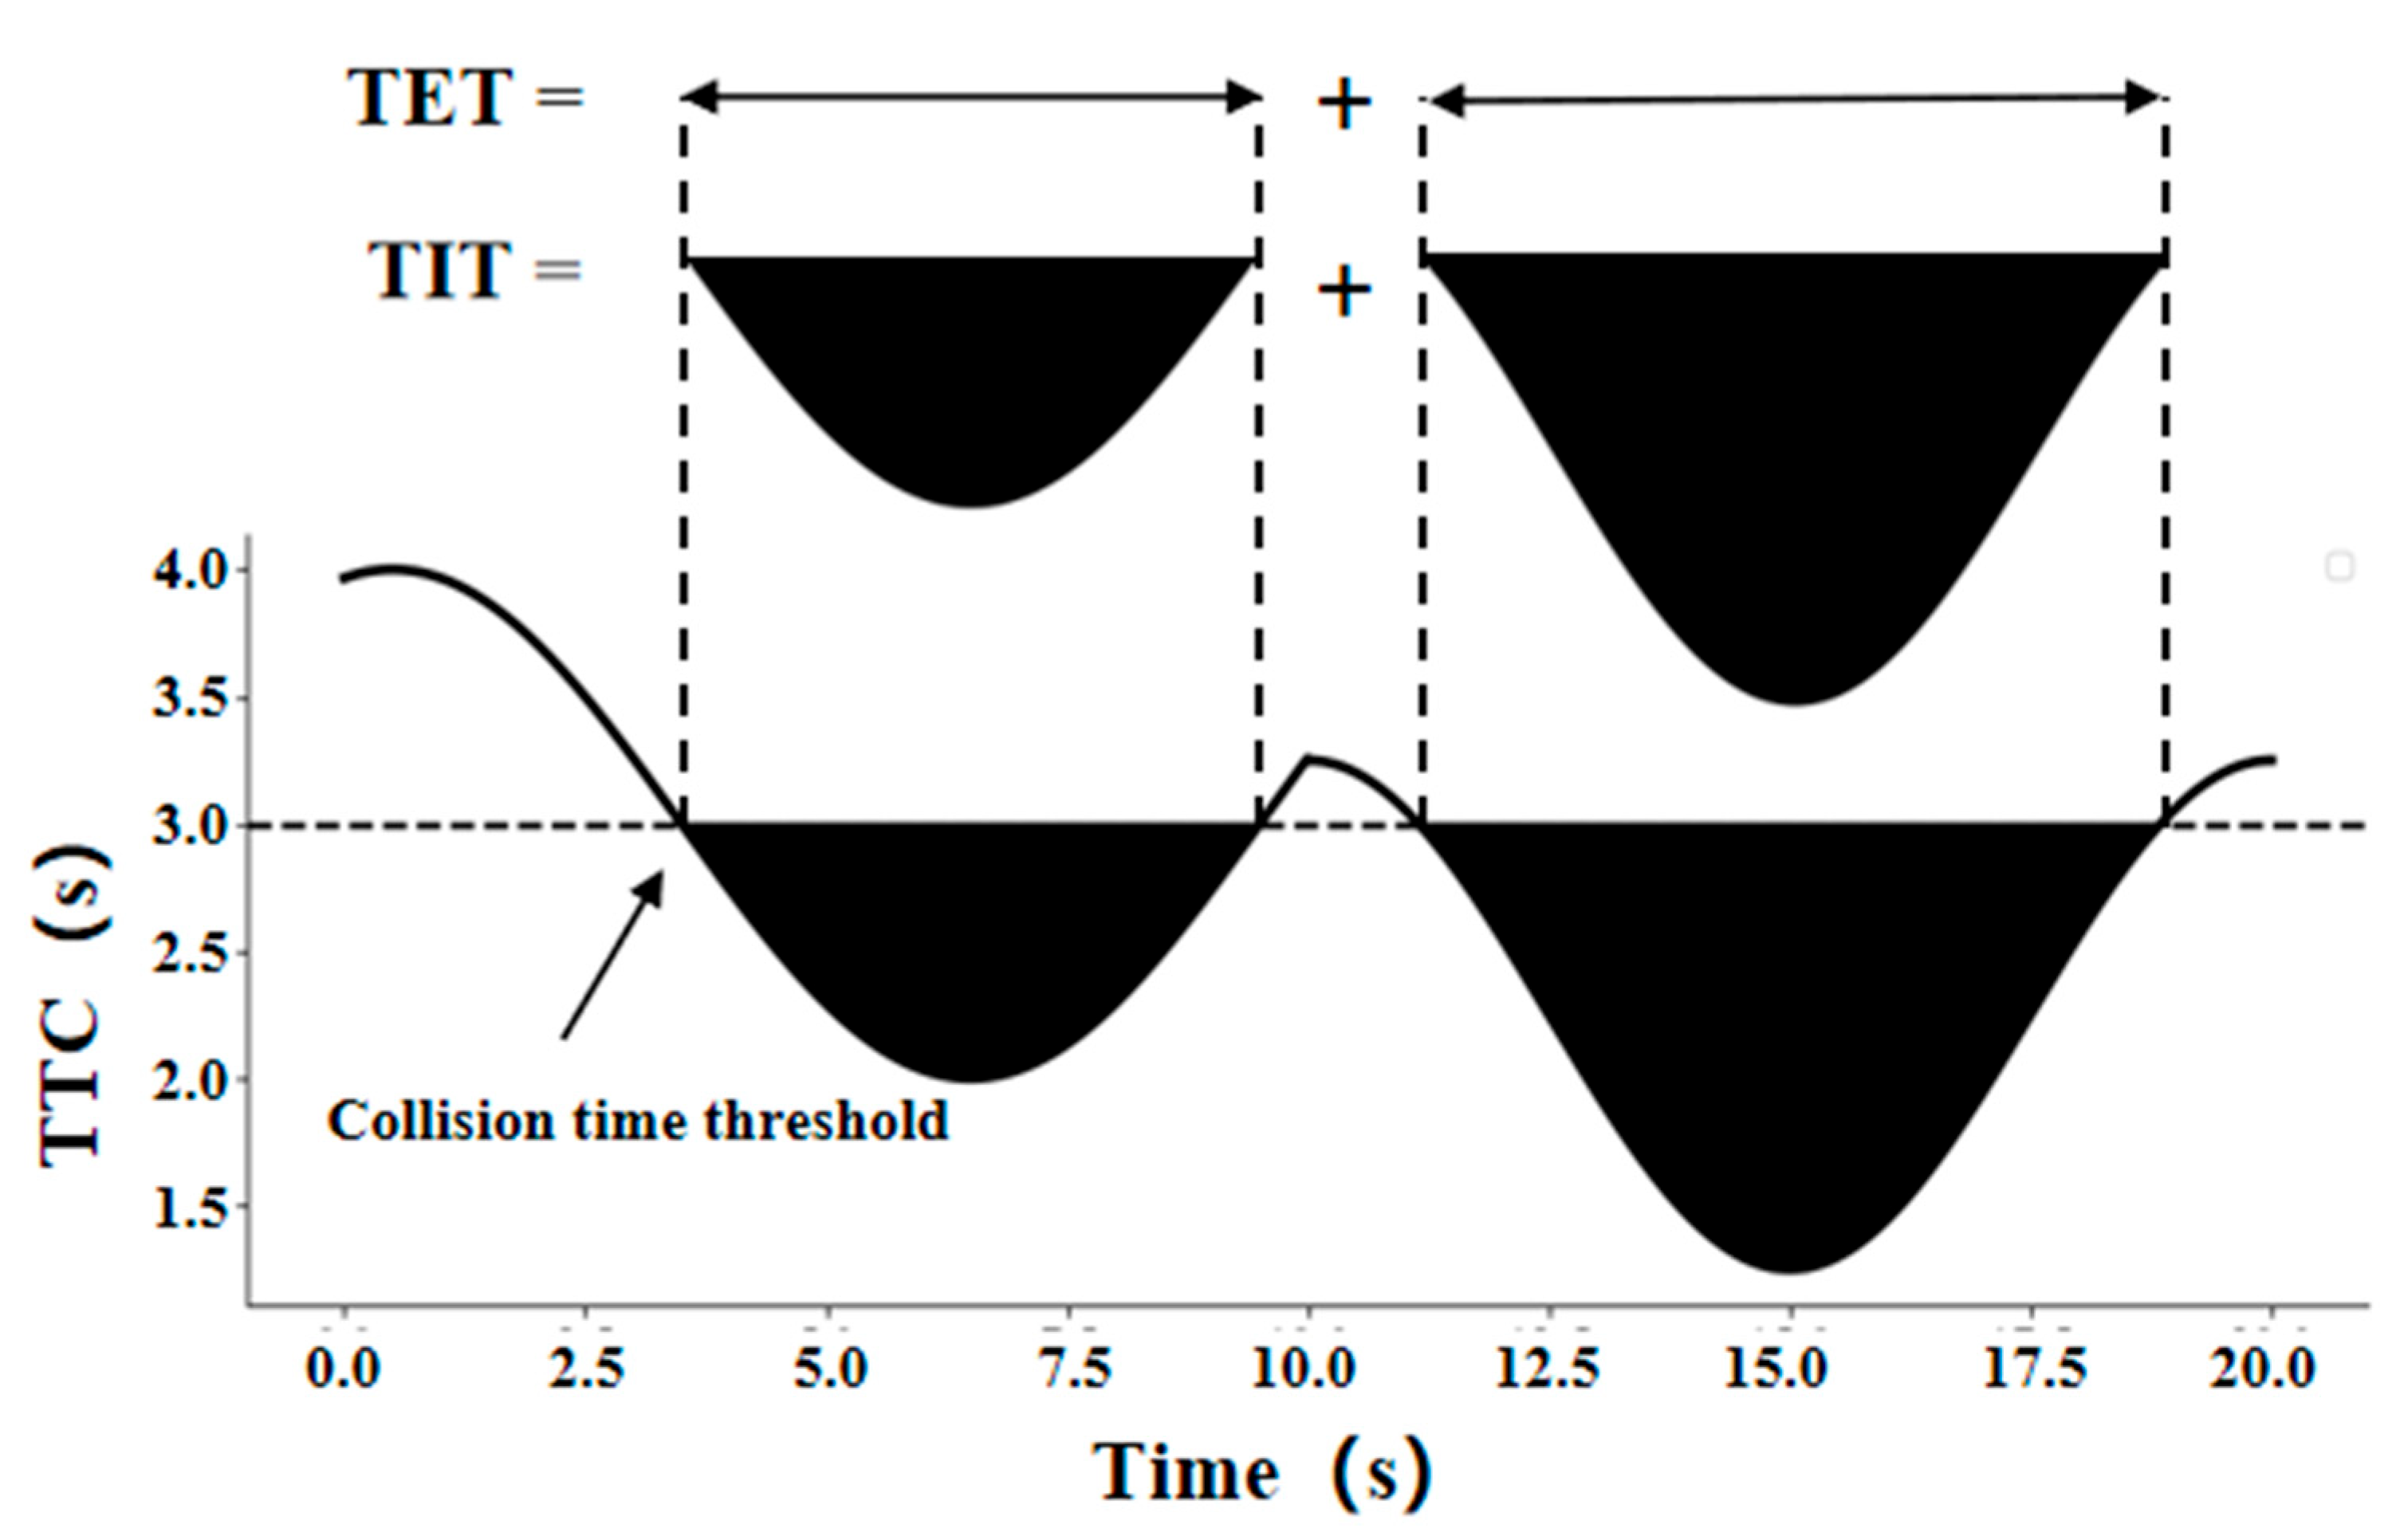
3.2. Time Exposed TTC and Time Integrated TTC

TTC is widely used for real-time monitoring of potential collision risks and to trigger emergency braking or active safety systems. However, as TTC is an instantaneous variable, it typically reflects the collision risk at a single moment. This characteristic reduces TTC’s accuracy in dynamic scenarios where vehicles accelerate or decelerate, making it challenging to cover all potential collision scenarios. This paper introduces Time Exposed TTC (TET) and Time Integrated TTC (TIT), derived from TTC, to accumulate and integrate risk exposure times, thereby assessing the duration and integral of TTC below a fixed threshold. TET and TIT consider vehicle space and dynamic behaviors comprehensively for events that occur infrequently but are highly dangerous when they occur. These metrics not only enable earlier identification of risks and potential collision scenarios but also better measure the overall level of risk experienced during this period. Together with TTC, they contribute to more comprehensive and effective safety measures, enhancing system responsiveness. The formulas for calculating TET and TIT are as follows:
T E T i = t = 0 N δ i ( t ) τ s c
δ i ( t ) = 1  ∀ 0 T T C i ( t ) T T C * 0       othersize
T I T i = t = 0 N T T C * T T C i ( t ) τ s c
0 T T C i ( t ) T T C *
where δ i ( t ) represents a switch variable and τ s c denotes the observation time interval, set at 0.1 s. T T C * represents the predefined T T C threshold of 3 s. These parameters are utilized in the calculations of TET and TIT. The definitions of TET and TIT are illustrated in Figure 3.
In Figure 3, the area under the curve represented by the shaded region corresponds to the TIT, which also indicates the degree of risk exposure below the TTC threshold. The sum of time segments where TTC is less than the 3 s threshold represents the TET. The integration of TET, TIT, and TTC enables comprehensive risk management and mitigation strategies.
While ensuring vehicular safety, the comfort of vehicle travel was also assessed. Luo and colleagues, through extensive experimental analysis, have indicated that lower acceleration 301and rate of change of acceleration in ACC-equipped vehicles correlate with higher riding comfort [19]. Therefore, the mean values of acceleration and its rate of change are used as indicators of comfort, as defined by the following formula:
I comf = 1 K k = 1 K ( | a f ( k ) | a * + | j ( k ) | j * )
where j * = 2.5   m / s 2 represents the average maximum rate of speed change as stipulated by GB/T 20608-2006, k denotes the total number of simulation samples, j ( k ) indicates the rate of acceleration change at the k-th sample point, and a f ( k ) refers to the acceleration at the k-th sample point.

4. Results

The CARLA simulation environment allows for the simulation and modification of all aspects related to the real-world environment, including the handling of sensor information and the connectivity between regulatory and perception modules. In this study, CARLA 0.9.13 was employed, using the Town01 map to evaluate the method’s safety and stability under various conditions. The experiments were conducted on a desktop computer equipped with an Intel i7-12700 processor, 16 GB of memory, and running at a frequency of 3.2 GHz. All models were implemented in Ubuntu 20.04 using Python 3.7.10.

4.1. Driving Data Collection

To ensure that expert demonstration trajectories cover a wide range of operating conditions, this paper conducts equidistant sampling in a three-dimensional space composed of relative distance, lead vehicle speed, and ego vehicle speed. The sampling points are set as the initial states for the expert trajectories. The sampling interval for relative distance is [10, 120] meters, with a 5 m interval; for lead vehicle speed, the interval is [5, 30] meters per second, with a 2 m/s interval; similarly, the ego vehicle speed is sampled within the same range and interval. These sampling points serve as the initial states from which the MPC-based virtual driver collects driving data within the simulation environment. For each initial state, the MPC-based virtual driver gathers 5 s of driving data as a single expert demonstration trajectory. The collected set of trajectories undergoes collision detection, and any trajectories involving collisions are removed.

4.2. Related Experiments

Based on the simulation parameters listed in Table 1, eighteen combinations of initial distances and speeds were tested. This paper simulates vehicle motion for each combination in CARLA’s Town01, highlighting several cases that are representative of typical conditions. Figure 4a,b illustrate vehicle following dynamics with and without the integration of RSS, respectively. The initial conditions were set at an 80 m distance and a 50 km/h speed. The lead vehicle traveled with an acceleration of −2 m/s2, and the velocities and TTC values of the following vehicle at each simulation time step were calculated under scenarios with and without RSS to preliminarily assess safety. Furthermore, since the simulation setup involved both vehicles starting at the same speed, the initial TTC should be infinite. To enhance computational efficiency, the maximum TTC value was capped at 18 s.
As illustrated in Figure 4, integrating RSS into the ACC system significantly enhances the TTC values, ensuring increased safety and markedly reducing the severity of potential vehicle conflicts. Throughout the simulation, the safety distance maintained by the ACC was consistently less than that of the RSS-integrated model. Consequently, the likelihood of conflicts occurring was substantially higher in the traditional model than in the improved system. Moreover, the RSS-integrated ACC algorithm demonstrated quicker responsiveness under identical conditions compared to the traditional ACC approach. Figure 4b shows that under a scenario with an 80 m gap, the traditional ACC prompted the vehicle to accelerate for nearly 4 s, subsequently requiring abrupt deceleration to maintain safety, with the TTC values remaining below the 3 s threshold for a significant period, thus being in a hazardous state. This issue arises because traditional ACC typically optimizes based on temporal parameters, which do not adjust as rapidly as distance changes when the lead vehicle decelerates suddenly from a large gap. In contrast, Figure 4a indicates that vehicles with RSS implemented decelerated just one second after acceleration, resulting in a more stable overall vehicle speed, reduced rate of acceleration change, and consistently safe TTC values. While ensuring safety, the RSS-integrated ACC also enhanced passenger comfort and vehicle stability. According to the comfort index formula (16), the comfort level of the RSS-integrated ACC was measured at 0.4054 compared to 0.5692 for the traditional ACC, with values closer to 0 indicating higher comfort. The comfort of the RSS-integrated ACC system improved by 40.40% over the traditional ACC system.
The experiments also simulated conditions such as sudden deceleration of the lead vehicle at short distances. Figure 5a,b depict the vehicle following dynamics without and with the integration of RSS, respectively. The initial distance was set at 30 m, and the initial speed was 60 km/h. The lead vehicle decelerated at an acceleration of −2 m/s2. The x-axis represents the simulation time, the left y-axis shows the vehicle speeds, and the right y-axis indicates the TTC values.
As observed in Figure 5a, under traditional ACC conditions, the vehicle exhibits a delayed response. In the first 2 s of the simulation, the ego vehicle continues to accelerate, and although the TTC values remain within safe limits, this results in the vehicle initiating a sharp deceleration after 2 s, only gradually reducing acceleration by the ninth second. This delay adversely affects passenger comfort and reduces vehicle stability. In contrast, the RSS-integrated ACC algorithm enhances the vehicle’s early response capability even in scenarios with small gaps and significant deceleration, ensuring safety through proactive deceleration and optimizing comfort and stability. According to the comfort assessment formula (16), the comfort level for the traditional ACC algorithm is 0.297, while for the RSS-integrated ACC algorithm, it is 0.208. Thus, under the given conditions, the RSS-integrated ACC algorithm improves driving comfort by 29.76% compared to the traditional ACC algorithm.
In the 18 experimental setups conducted, the RSS-integrated ACC algorithm demonstrated rapid responsiveness in scenarios with arbitrary initial gaps and significant deceleration by the lead vehicle. The vehicle’s response time with RSS-integrated ACC was noticeably faster than that of traditional ACC, allowing for earlier deceleration. Throughout the simulation, vehicles maintained a safe distance and quickly stabilized. In contrast, the traditional ACC algorithm resorted to abrupt deceleration in some scenarios, leading to instances of overreaction. The increased deceleration time with the RSS-integrated ACC algorithm facilitated a smoother vehicle acceleration profile. While ensuring safety, this approach also prioritized ride comfort and optimized vehicle stability.

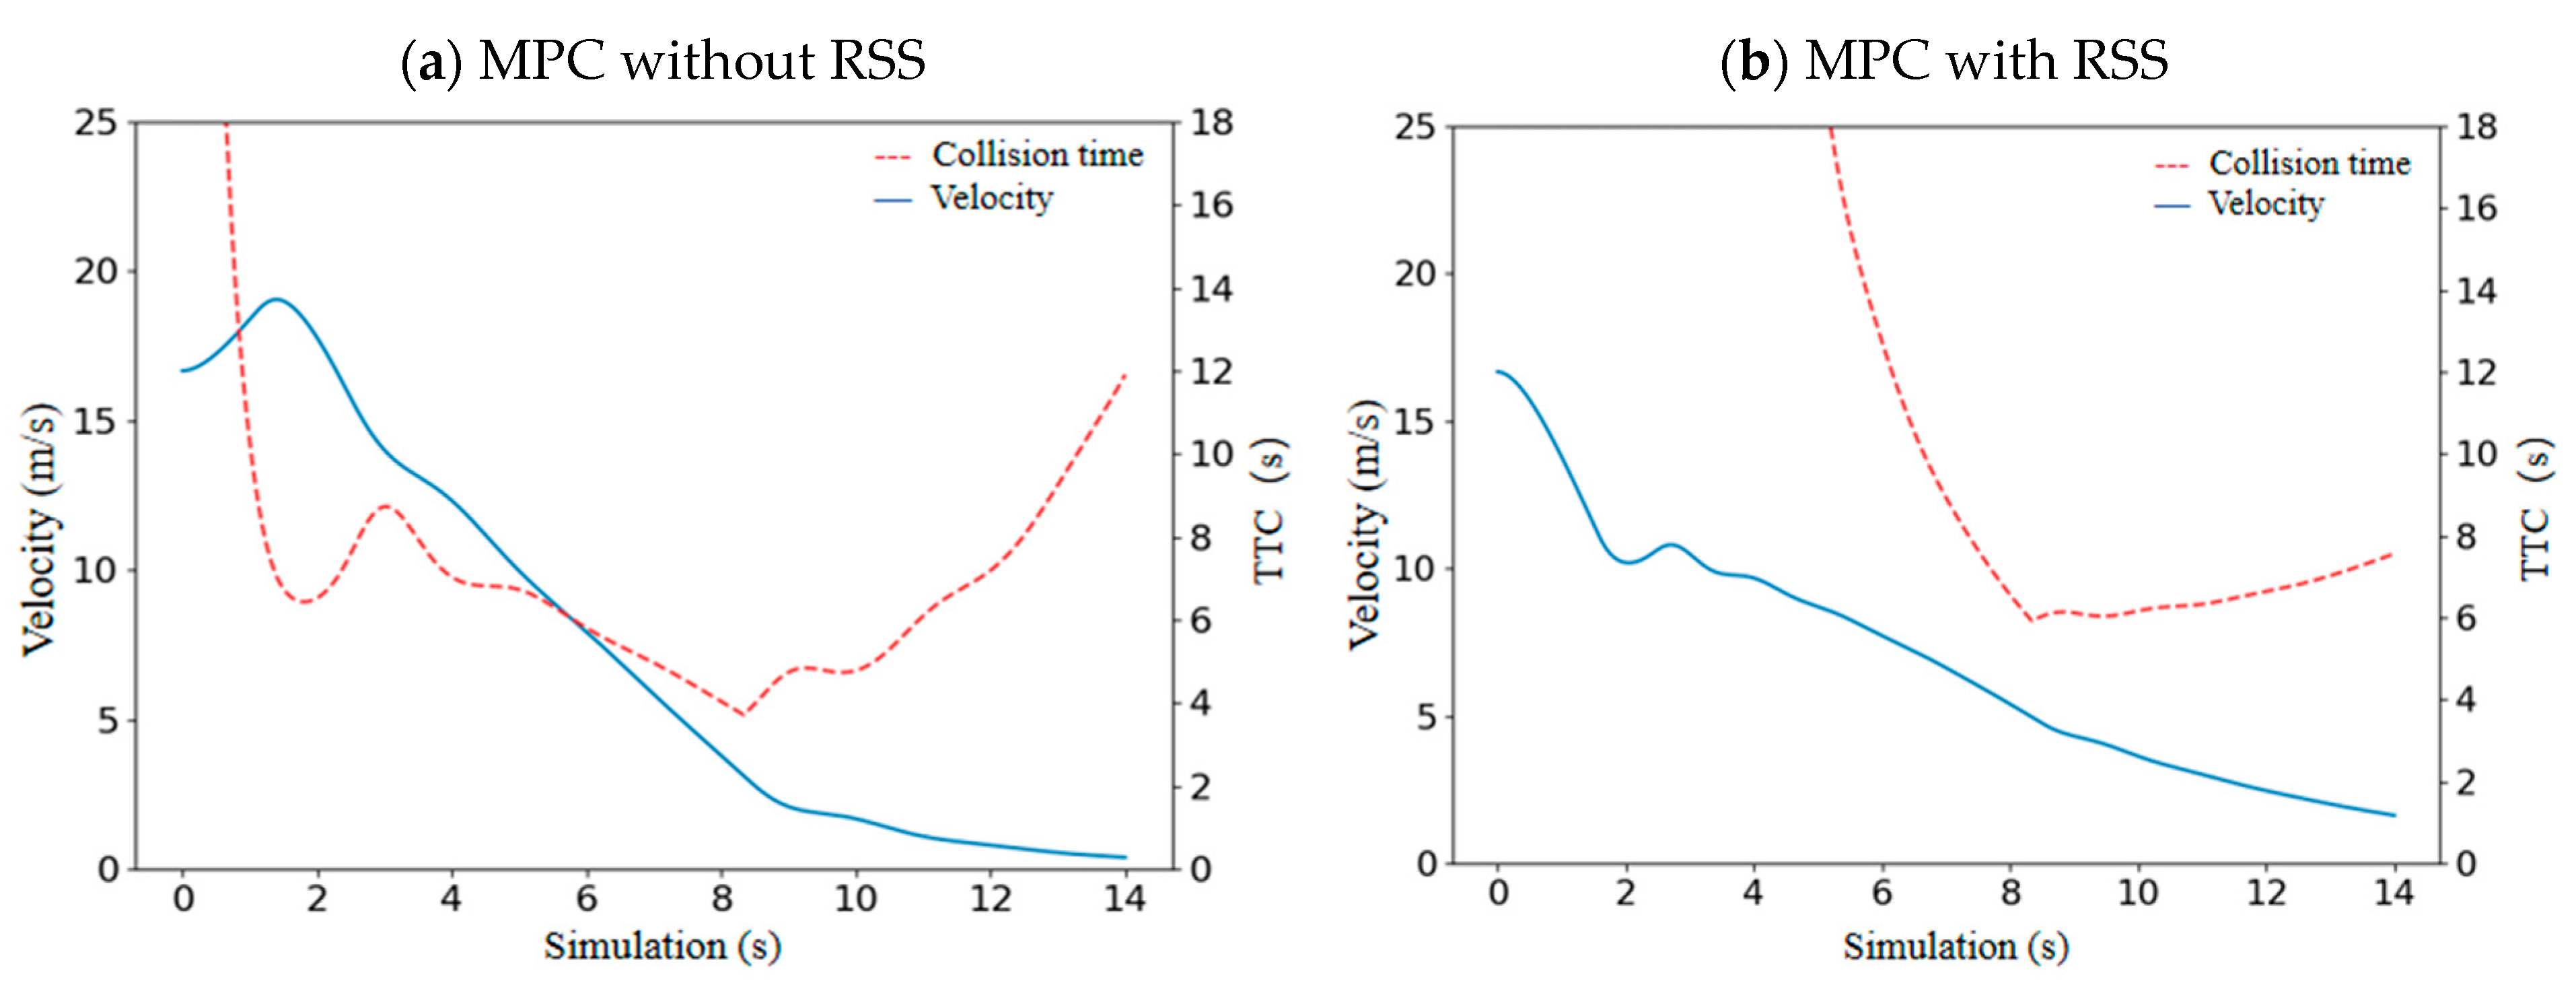
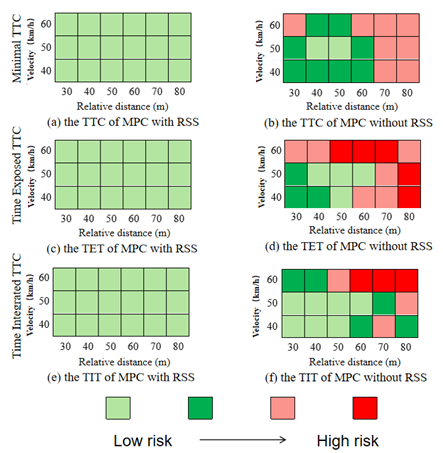
4.3. Safety Assessment Based on SSM

Figure 6 summarizes the vehicle safety assessment results for each experiment after simulation, mainly by calculating TET and TIT based on the 3 s TTC threshold. In this paper, four safety levels were defined based on Surrogate Safety Measurements (SSM), including Time to Collision (TTC), Time Exposed over Threshold of TTC (TET), and Time Integrated over Threshold of TTC (TIT). The safety levels are categorized as high, moderate, low, and very low based on the following criteria: High safety level is characterized by a TTC greater than 3 s, a TET less than 1.5 s, and a TIT less than 0.5 s, indicating sufficient time to avoid a collision and minimal exposure to dangerous conditions. The moderate safety level is defined by a TTC between 2.5 and 3 s, a TET between 1 and 2 s, and a TIT between 0.5 and 1 s, suggesting potential risk but still within a manageable range. The low safety level is represented by a TTC between 2 and 2.5 s, a TET between 2 and 3 s, and a TIT between 1 and 2 s, signifying a higher risk with prolonged exposure to dangerous conditions. Finally, the very low safety level is identified by a TTC of less than 2 s, a TET greater than 3 s, and a TIT greater than 2 s, indicating an extremely high risk of collision with insufficient time for avoidance. This classification offers a clear framework to evaluate the safety performance of autonomous systems and their ability to handle critical driving scenarios, as depicted in Figure 6.
According to Figure 6b,d,f, safety levels decrease under simulated conditions with large initial gaps and high relative speeds. Traditional ACC systems prioritize time headway as a key parameter and use optimization algorithms to maintain desired speeds and optimize vehicle motion relative to time gaps. Consequently, this leads to slower deceleration responses in high-speed and large-gap scenarios, which reduces passenger comfort and vehicle stability. The improved ACC system takes into account vehicle dynamics and environmental factors more comprehensively. Due to RSS primarily deriving from driver responses to acceleration, the updated ACC is more sensitive to deceleration of the vehicle ahead compared to traditional ACC. By leveraging the advantages of multi-step prediction and optimization control, and guided by the SSM, the improved ACC provides a more comprehensive safety guarantee for vehicular operation. When RSS is integrated, TTC, TET, and TIT indicators are significantly improved, indicating that RSS can not only shorten the duration of conflicts but also reduce the severity of conflicts.

5. Conclusions

Addressing the limitations of traditional ACC systems in extreme traffic scenarios, this paper proposes and validates an ACC strategy that integrates MPC with the RSS model. By incorporating the RSS model within the MPC framework, this approach achieves a more precise and dynamic safety assessment of vehicle behavior, significantly enhancing collision avoidance capabilities under conditions of high speed and large following distances. Results from 18 experiments indicate that the RSS-integrated ACC system responds more quickly and maintains safer distances, significantly reducing collision risks. Additionally, the implementation of a secondary optimization technique that limits the rate of acceleration change effectively reduces frequent vehicle acceleration and deceleration, thereby enhancing ride stability and comfort. In scenarios with an initial distance of 80 m at 50 km/h, ride comfort was improved by 40.40%. In scenarios with a distance of 40 m at the same speed, comfort was increased by 29.76%.
This paper comprehensively evaluated the differences between RSS-integrated ACC models and traditional ACC models under various front gap and speed conditions, using safety performance indicators such as TTC, TET, and TIT. This approach addresses the limitations of relying solely on TTC for safety performance assessment, shifting from a momentary and singular metric to a more complete evaluation through temporal accumulation and integration. Experimental results demonstrate that RSS effectively enhances the safety performance of ACC. Comparing the safety performance of vehicles with and without RSS indicates that the shortcomings of such autonomous driving algorithms can be mitigated by incorporating RSS. This significant enhancement in collision avoidance capabilities under extreme traffic conditions and improvement in ride comfort lays a solid foundation for achieving safer and more comfortable autonomous driving systems. However, its impact on traffic efficiency remains to be studied. Additionally, variations in RSS model parameters can significantly affect the response of the autonomous driving system and vehicle stability, which requires further investigation.

Author Contributions

Conceptualization, T.Y. and R.C.; methodology, Y.T.; software, Y.T.; validation, S.Z., T.Y. and Y.T.; formal analysis, T.Y. and R.C.; investigation, Y.T.; resources, R.C.; data curation, Y.T.; writing—original draft preparation, Y.T.; writing—review and editing, T.Y.; visualization, Y.T.; supervision, R.C.; project administration, Y.T.; funding acquisition, Y.T. All authors have read and agreed to the published version of the manuscript.

Funding

This research received no external funding.

Data Availability Statement

Data are contained within the article.

Acknowledgments

This research is supported by the Chongqing Science and Technology Bureau—Key Project of Technological Innovation and Application Development, focusing on Research and Application of Accelerated Simulation Testing Technologies for High-Level Autonomous Driving Systems (Z2310210006).

Conflicts of Interest

The authors declare no conflict of interest.

References

  1. Autonomous Vehicle Disengagement Reports 2018. California’s Department of Motor Vehicles (DMV). Available online: https://www.dmv.ca.gov/portal/dmv/detail/vr/autonomous/disengagement_report_2018 (accessed on 4 April 2019).
  2. Eustace, D. Emerging Transportation Safety and Operations: Practical Perspectives. Vehicles 2024, 6, 2251–2256. [Google Scholar] [CrossRef]
  3. Shalev-Shwartz, S.; Shammah, S.; Shashua, A. On a formal model of safe and scalable self-driving cars. arXiv 2017, arXiv:170806374. [Google Scholar]
  4. Hasuo, I. Responsibility-sensitive safety: An introduction with an eye to logical foundations and formalization. arXiv 2022, arXiv:2206.03418. [Google Scholar]
  5. Moser, D.; Schmied, R.; Waschl, H.; del Re, L. Flexible Spacing Adaptive Cruise Control Using Stochastic Model Predictive Control. IEEE Trans. Control. Syst. Technol. 2018, 26, 114–127. [Google Scholar] [CrossRef]
  6. Dang, R.; Wang, J.; Li, S.E.; Li, K. Coordinated Adaptive Cruise Control System with Lane-Change Assistance. IEEE Trans. Intell. Transp. Syst. 2015, 16, 2373–2383. [Google Scholar] [CrossRef]
  7. Xiao, L.; Gao, F.; Wang, J. On Scalability of Platoon of Automated Vehicles for Leader Predecessor Information Framework. In Proceedings of the 2009 IEEE Intelligent Vehicles Symposium, Xi’an, China, 3–5 June 2009; IEEE: Piscataway, NJ, USA, 2009; pp. 1103–1108. [Google Scholar]
  8. Yanakiev, D.; Kanellakopoulos, I. Nonlinear Spacing Policies for Automated Heavy-Duty Vehicles. IEEE Trans. Veh. Technol. 1998, 47, 1365–1377. [Google Scholar] [CrossRef]
  9. Yang, L.; Mao, J.; Liu, K.; Du, J.; Liu, J. An adaptive cruise control method based on improved variable time headway strategy and particle swarm optimization algorithm. IEEE Access 2020, 8, 168333–168343. [Google Scholar] [CrossRef]
  10. Chen, J.; Zhou, Y.; Liang, H. Effects of ACC and CACC Vehicles on Traffic Flow Based on an Improved Variable Time Headway Spacing Strategy. IET Intell. Transp. Syst. 2019, 13, 1365–1373. [Google Scholar] [CrossRef]
  11. Tawfeek, M.H.; El-Basyouny, K. A perceptual forward collision warning model using naturalistic driving data. Can. J. Civ. Eng. 2018, 45, 899–907. [Google Scholar] [CrossRef]
  12. Yu, W.; Zhao, C.; Wang, H.; Liu, J.; Ma, X.; Yang, Y.; Li, J.; Wang, W.; Hu, X.; Zhao, D. Online legal driving behavior monitoring for self-driving vehicles. Nat. Commun. 2024, 15, 408. [Google Scholar] [CrossRef] [PubMed]
  13. Winkler, S.; Werneke, J.; Vollrath, M. Timing of Early Warning Stages in A Multi Stage Collision Warning System: Drivers’ Evaluation Depending on Situational Influences. Transp. Res. Part F Psychol. Behav. 2016, 36, 57–68. [Google Scholar] [CrossRef]
  14. Crundall, D.; Kroll, V. Prediction and perception of hazards in professional drivers: Does hazard perception skill differ between safe and less-safe fire-appliance drivers? Accid. Anal. Prev. 2018, 121, 335–346. [Google Scholar] [CrossRef] [PubMed]
  15. Li, Y.; Wang, H.; Wang, W.; Liu, S.; Xiang, Y. Reducing the risk of rear-end collisions with infrastructure-to-vehicle (I2V) integration of variable speed limit control and adaptive cruise control system. Traffic Inj. Prev. 2016, 17, 597–603. [Google Scholar] [CrossRef] [PubMed]
  16. Li, Y.; Wang, H.; Wang, W.; Xing, L.; Liu, S.; Wei, X. Evaluation of the impacts of cooperative adaptive cruise control on reducing rear-end collision risks on freeways. Accid. Anal. Prev. 2017, 98, 87–95. [Google Scholar] [CrossRef] [PubMed]
  17. Al-Gabalawy, M.; Hosny, N.S.; Aborisha, A.S. Model predictive control for a basic adaptive cruise control. Int. J. Dyn. Control 2021, 9, 1132–1143. [Google Scholar] [CrossRef]
  18. Zhu, M.; Wang, X.; Tarko, A. Modeling car-following behavior on urban expressways in Shanghai: A naturalistic driving study. Transp. Res. Part C Emerg. Technol. 2018, 93, 425–445. [Google Scholar] [CrossRef]
  19. Luo, L.H.; Liu, H.; Li, P.; Wang, H. Model predictive control for adaptive cruise control with multi-objectives: Comfort, fuel-economy, safety and car-following. J. Zhejiang Univ. Sci. A 2010, 11, 191–201. [Google Scholar] [CrossRef]
Figure 1. Cruising and following driving state.
Vehicles 07 00028 g001
Figure 2. Acceleration responses.
Vehicles 07 00028 g002
Figure 3. Definitions of TIT and TET.
Vehicles 07 00028 g003
Figure 4. Simulation comparison of MPC embedded with RSS (distance = 80 m, initial velocity = 50 km/h).
Vehicles 07 00028 g004
Figure 5. Simulation comparison of MPC embedded with RSS (distance = 30 m, initial velocity = 60 km/h).
Vehicles 07 00028 g005
Figure 6. Safety levels under various conditions. (a,b) represent the TTC of MPC with RSS, respectively; (c,d) represent the TET values before and after embedding RSS into MPC, respectively; (e,f) represent the TIT values before and after embedding RSS into MPC, respectively.
Vehicles 07 00028 g006
Table 1. Related parameter settings.
SymbolValue
Deceleration rate of front vehicle 2   m / s 2
Velocity of front vehicle(40, 50, 60) km/h
Initial distance(30, 40, 50, 60, 70, 80) m
Initial (cruise) velocity(40, 50, 60) km/h
RSS reaction time
RSS maximum brake rate
RSS minimum brake rate
1 s
8   m / s 2
3   m / s 2
ACC time gap1 s
ACC default space
ACC reaction time
3.5 m
0.5 m
Disclaimer/Publisher’s Note: The statements, opinions and data contained in all publications are solely those of the individual author(s) and contributor(s) and not of MDPI and/or the editor(s). MDPI and/or the editor(s) disclaim responsibility for any injury to people or property resulting from any ideas, methods, instructions or products referred to in the content.

