1. Introduction
All vehicles intended for sale must include fuel consumption data in their documentation. This consumption is determined in the laboratory during testing according to a predefined test procedure. Consumption data can also be marked as type-approved. The data provided in the type-approval documents often represent a basic tool for consumer purchases. The majority of new owners take into account improvements in terms of the economic efficiency of new vehicles and their environmental impact. Therefore, it is important that the fuel consumption determined in laboratory conditions corresponds to the fuel consumption in real driving conditions.
A pan-European problem is the continuous monitoring of the differences between fuel consumption under laboratory conditions and fuel consumption in the real world [
1,
2,
3]. According to scientific data from the International Clean Transport Council, the fuel consumption gap between laboratory and real driving conditions in light commercial vehicles in Europe increased from 8% in 2001 to 40% in 2014 [
4].
According to studies by Ntziachristos et al. and Wang et al., the increasing gap in fuel consumption may lead to biased predictions of energy consumption or CO
2 emissions and may hinder the effectiveness of policies aimed at saving energy or reducing emissions [
3,
5]. Therefore, it is very important to understand the difference in fuel consumption with regard to its range and variability. It is necessary to assess the factors that contribute to its expansion with the ultimate goal of reducing and, ideally, eliminating the difference in fuel consumption.
The fuel consumption of any vehicle is one of the most important parameters of operation. Special attention must be paid to the fact that the number of motor vehicles has been increasing in recent years, and the price of one liter of fuel is rising worldwide [
6]. Fuel consumption is relevant both for a person who wants to buy a car and for car owners who already use their motor vehicle. In many cases, the fuel consumption of vehicles rarely matches the data given in the vehicle certificate. There are several methods for determining the fuel consumption of a motor vehicle [
7,
8]. Fuel consumption can be determined both on a road test when the vehicle is in real motion and in laboratory conditions when the driving conditions are simulated using a cylinder dynamometer. Several methods can be used to track fuel consumption when investigating fuel consumption. Studies by Pirs et al. used several methods to investigate fuel consumption. Among them, it is possible to include the volume method (determining the amount of fuel consumed), the weight method (determining the weight of fuel consumed), and the flow method (determining the amount of fuel consumed in volume or weight units) [
9].
This research deals with issues related to the official measurement of fuel consumption in the Slovak Republic. It is a specific type of measurement that is carried out by authorized persons based on Act no. 142/2000 Coll., which refers to metrology. This type of measurement is mostly carried out because the vehicles have their fuel consumption stated in their registration certificate, which is determined as a result of type-approval tests in laboratory conditions (WLTP or NEDC cycle). In real operations, however, the consumption is often higher. Official measurements make it possible to prove this fact and claim higher tax expenses on fuel. Official measurements can also be ordered by control authorities, for example, when fuel consumption data manipulation is suspected [
10,
11].
The official measurement of fuel consumption can only be carried out by authorized persons who meet strict professional competence and technical equipment requirements. An entity that has created organizational, spatial, technical, and personnel conditions for the activity in question, with demonstrated continuity in their used standards and measures, and that has built a corresponding quality system according to STN EN ISO/IEC 17025 or another comparable quality system can be authorized. One of the other requirements is that the entity has a responsible representative appointed for the activity being authorized, and this representative must have competence in the field of metrology, with a document proving this fact issued by the Slovak Metrological Institute. The list of authorized persons is published by the Office for Standardization, Metrology, and Testing of the Slovak Republic [
12]. Two companies are currently carrying out this activity in the Slovak Republic.
Entities performing this activity for natural and legal persons have a “Certificate of authorization for official measurement of fuel consumption”, including the scope of authorization.
Table 1 shows the scope of the entities authorized for the performance of official fuel consumption measurement in the Slovak Republic.
The official measurement of fuel consumption takes place according to precisely defined procedures. Based on the analysis of the scope of authorization, it can be concluded that in the Slovak Republic, official measurements of fuel consumption are carried out by the direct method, i.e., by installing a flowmeter in the fuel system of the vehicle and measuring the volume of fuel flow during the vehicle test. The actual operating fuel consumption is measured under different conditions (for example, at different speeds and vehicle loads). The result of the measurement is an official measurement certificate, which serves as proof of the actual fuel consumption. Each authorized person has developed their own methodical procedure, on the basis of which they determine the driving conditions of the vehicle during the official measurement of fuel consumption.
The official measurement of fuel consumption is, therefore, currently applied in real practice based on the following characteristics:
the subject must be an authorization holder,
the measurement is carried out in the form of a driving test (city, outside the city, highway, etc.) based on methodological procedures and customer requirements,
the fuel consumed is recorded by installing a flowmeter in the vehicle’s fuel system.
However, there are no strict requirements regarding the measurement of real fuel consumption with an installed flowmeter and in the form of driving tests when issuing authorization in the Slovak Republic. Therefore, in this study, the authors implemented a series of practical measurements that aimed to use other methods of measuring real fuel consumption. Both methods of performance measuring fuel consumption are considered—in laboratory conditions and via driving tests during the normal operation of a road vehicle. Alternative options for recording and tracking the amount of fuel consumed by a road vehicle are also analyzed. Different methods of calculating fuel consumption from the production of exhaust gases, data available from the vehicle’s engine control unit (OBD), and a conventional volumetric flowmeter are investigated.
From the point of view of scientific importance, the aim of this research is to determine the basic statistical parameters of the repeatability of individual methods of measuring fuel consumption. According to a detailed analysis of the task of measuring fuel consumption by various methods, it is also appropriate to calculate the uncertainties of the measurements, which mainly depend on the various gauges used, their accuracy, and the method of calculating the final fuel consumption.
2. Research Methodology
As part of this research, various methods were used to measure vehicle fuel consumption. A standardized test procedure known as the WLTP cycle (Worldwide Harmonized Light Vehicles Test Procedure) was used to reliably ensure the repeatability of the driving cycle as a basis for the measurement route. The WLTP cycle represents an internationally harmonized test regime that simulates real driving conditions on a measuring circuit. The main goal of this cycle is the accurate and consistent determination of fuel consumption and emissions. In the case of this investigation, it was only a matter of moving the measuring route into the cylindrical dynamometer; the repeatability of the measurements would therefore be ensured.
Figure 1 breaks down the determination of fuel consumption into three separate methods. The first method involves identifying fuel consumption based on emission regulations established by the ECE regulation no. 101, which sets standards for determining the amount of emissions and fuel consumption observed while driving. The second method focuses on obtaining data directly from the engine control unit (ECU) through the OBD (on-board diagnostics) interface, which provides detailed information about the vehicle’s operation. The third method uses the direct application of a flowmeter to measure the flow of fuel, which allows the accurate determination of the amount of fuel consumed while driving.
Each of these methods is designed to provide accurate and reliable data on fuel consumption, considering various aspects and technological procedures. The flowchart emphasizes the importance of the WLTP cycle as a universal framework for measuring fuel consumption, which represents the basis (measurement path) of the procedures chosen to obtain the most accurate results.
In order to ensure the repeatability of measurements based on the WLTP driving cycle, the research was carried out in a laboratory environment on a MAHA MSR 1050 cylinder dynamometer. During the performance of the driving tests on the cylinder dynamometer, the measurement conditions had to be observed; these included the temperature and humidity of the air in the laboratory, the pressure of the vehicle’s tires, the prescribed speed of the vehicle during the driving cycle, and shifting gears at the prescribed points. The cylinder dynamometer is used in many studies to perform repeated measurements [
14,
15].
In
Figure 2, the research methodology and the flow of individual measurement posts are visualized. During testing, the vehicle moved on a cylinder dynamometer and driving was simulated according to specific WLTP conditions. In the following picture (
Figure 3), it is possible to observe the location of the measured vehicle on the cylinder dynamometer. A KIA Ceed vehicle was used to investigate fuel consumption, depending on the method used. The vehicle on which the tests were conducted was equipped with a mildhybrid system. During the tests, data on the mildhybrid system (battery charge level, etc.) were not recorded because the fuel consumption measurements were performed simultaneously. The vehicle specification is shown in
Table 2.
The Maha MSR 1050 roller dynamometer can measure the most important operating characteristics of the vehicle, including the engine power, torque and fuel consumption. It is also possible to connect an exhaust gas analyzer to the control panel of the roller dynamometer, which allowed us to record data from both devices in one file. Vehicle cooling during the test was provided by external ventilation units [
16,
17].
The basic technical parameters of the cylinder performance test room are shown in
Table 3 [
18].
2.1. Fuel Consumption Measurement According to Regulation No 101
Measuring the vehicle’s fuel consumption and emissions on the cylinder test bed according to the WLTP test cycle involved several steps performed under controlled laboratory conditions. During the measurement, the vehicle was placed on a cylinder dynamometer, which enabled the simulation of various driving situations without the vehicle moving in a real environment. Before testing, the vehicle was subjected to a standard conditioning process to ensure the correct temperature of the engine and other systems.
During the measurement, the vehicle was loaded according to its actual weight, including the simulation of aerodynamic drag and rolling friction, which were adjusted based on previous measurements. After setting the input data, the test vehicle was subjected to the WLTP driving cycle, which consisted of four phases—low, medium, high, and very high load—with each of these phases representing different driving conditions, from slow city driving to dynamic highway driving. According to a study by Tsokolis et al., the driving cycle should correspond highly to the real operation of the vehicle [
19].
Fuel consumption was indirectly calculated based on the amount of CO
2 emissions the vehicle emitted during testing. The procedure aimed to determine the amount of fuel consumed by vehicles with an internal combustion engine with regard to EEC regulation no. 101, which describes the requirements for the homologation of passenger motor vehicles powered exclusively by an internal combustion engine or powered by a hybrid electric powertrain with regard to the measurement of carbon dioxide emissions and fuel consumption or the measurement of electrical energy consumption, as well as the range and vehicles of category M1 and N1 powered exclusively by an electric powertrain with regard to the measurement electricity consumption and range. The relationship between fuel consumption and emissions was used to calculate the fuel consumption, which resulted from the methodological procedure of EEC no. 101 [
20]. During the test, the amount of exhaust gas emissions produced was continuously recorded. These data were recorded by the MAHA MGT 5 exhaust gas analyzer and also saved using the MAHA Emission Viewer (1.0.4.380) software. The fuel consumption was calculated indirectly based on the amount of CO
2 emitted, which was made possible by the fact that the burning of each type of fuel is has a precisely defined ratio that compares between CO
2 emissions and the fuel consumed. The procedure performed represents a standardized measurement to ensure the reproducibility of the results and the objective evaluation of vehicles of different manufacturers and technical specifications.
For the purpose of measuring exhaust gas components, the Maha MGT 5 exhaust gas analyzer was used. This is an exhaust gas analyzer that is approved in the Slovak Republic for the purpose of measuring emissions during regular emission inspection. It is a 5-component exhaust gas analyzer that allows the evaluation of the CO (carbon monoxide), CO
2 (carbon dioxide), HC (hydrocarbons), O
2 (oxygen) and the air fuel ratio. Our laboratory exhaust gas analyzer was also supplemented with a NOx sensor (nitrogen oxides). The software part of the utility program was extended by the Emission Viewer, which allows you to create a measurement record with an unlimited time trace. After the measurement, we exported the data in xlsx format and worked with them. The technical data are shown in
Table 4.
In
Figure 4, you can see the location of the flue gas probe at the mouth of the exhaust pipe. The procedure for measuring carbon dioxide emissions and the fuel consumption of vehicles powered exclusively by an internal combustion engine is set out in Annex 6—Regulation no. 101, which describes the requirements for the homologation of passenger motor vehicles powered exclusively by an internal combustion engine or powered by a hybrid electric powertrain with regard to the measurement of carbon dioxide emissions and fuel consumption or the measurement of electrical energy consumption and range and vehicles of categories M1 and N1 powered exclusively by an electric powertrain with regard to the measurement of consumption electricity and range. The measurement of the cylinder dynamometer was carried out in accordance with the regulation, while the fuel consumption value was calculated according to the emission of hydrocarbons, carbon monoxide, and carbon dioxide determined from the measurement results. The fuel consumption, expressed in liters per 100 km or in m
3 per 100 km, was calculated using the following formula:
where:
FC—fuel consumption in liters per 100 km or in m3 per 100 km,
HC—measured hydrocarbon emissions in g/km,
CO—measured carbon monoxide emissions in g/km,
CO2 = measured carbon dioxide emissions in g/km,
D = density of test fuel.
2.2. Fuel Consumption Measurement According to OBD and Data from the Engine Control Unit
The fuel consumption measurement workflow, which is based on the evaluation of data from the engine control unit via OBD, began with the preparation of the vehicle and the measuring equipment. Before the measurement, the vehicle was placed on the MAHA MSR 1050 cylindrical test bed in laboratory conditions, where constant external factors such as the temperature and pressure were ensured. During the measurement, the diagnostic device was connected to the engine control unit via the OBD port, and the monitoring of real data on fuel consumption and the operation of the motor vehicle was ensured.
Before the measurement started, the measuring equipment was installed. The chosen method of measurement ensured the reliability of the results and the repeatability of the measurements. Subsequently, the vehicle was subjected to a driving test, which was performed according to the prescribed WLTP cycle, which includes low, medium, high, and very high-speed phases. Data on the fuel flow, engine speed, and other parameters related to fuel consumption were continuously recorded while driving.
After the completion of the first measurement, the analysis and evaluation of the obtained data were carried out. To ensure the repeatability of the test, the whole process was repeated five times under the same conditions. After all measurements were completed, the obtained results were analyzed and checked to ensure their reliability. Based on the obtained data, the average fuel consumption and possible deviations between individual measurements were evaluated, thus ensuring the reliability of the measured values.
The next step during the recording of data was the correct selection of the diagnostic device and the application used to record the data. The measurements were performed using the Torque Pro mobile application (they were also analyzed using the Bosch KTS 540, AutoCom diagnostics, Trollhättan, Sweden). An ELM 327 (ELM Electronics, Puslinch, ON, Canada) diagnostic device with the Torque Pro mobile application was chosen for the measurement. The ELM 327 is capable of displaying and recording real-time data such as the engine speed, calculated engine load, coolant temperature, fuel system status, vehicle speed, and more.
The Bluetooth version of the Torque Pro application was selected for the implementation of the research. In order to log (upload) data, it was necessary to pair the devices with the mobile application. In this environment, the data began to be recorded using the engine control unit before the driving itself was started. The measuring device and the mobile application can be seen in
Figure 5. After the end of the measurement (starting the WLTP cycle), the data recording was stopped, and the data that were obtained were evaluated.
When determining fuel consumption, it is possible to proceed on the basis of Equation (2).
where:
X—represents the amount of fuel consumed in liters,
Y—the distance that the vehicle has travelled in kilometers (the traveled distance will be the same as the route of the WLTP cycle).
After substituting the obtained data into the equation, it is possible to obtain data on fuel consumption in liters per 100 km, which is the standard unit used to evaluate the efficiency of vehicle consumption. Equation (2), when measuring fuel consumption using flowmeter data, presents the fuel consumption data derived directly from measuring the amount of fuel flowing through the vehicle’s fuel system. The engine control unit records the volume of fuel consumed by the engine while driving, and these data are combined with the distance traveled by the vehicle as part of the WLTP driving test. The resulting value of fuel consumption in liters per 100 km enables the accurate quantification of fuel consumption under the given test conditions.
2.3. Measurement of Fuel Consumption According to the Fuel Flowmeter
The measurement of fuel consumption by means of an AIC 1204 (AIC System AG, Allschwil, Switzerland) fuel flowmeter in laboratory conditions was carried out as a third means of investigation in order to determine the fuel consumption of the vehicle when driving according to the WLTP cycle. The measurement, as well as the course of the test, was almost identical to the measurement performed according to the OBD and data from the ECU, but there was a difference in the recording of data. In this case, consumption data were not logged from the engine control unit but directly from the flowmeter connected to the fuel system of the measured vehicle. The tested vehicle was placed on a cylinder dynamometer, which ensured the simulation of real driving conditions, while the fuel system was connected to the AIC 1204 flow meter.
Before the start of the test, the flow meter was installed in the fuel system of the vehicle. The schematic diagram of the installation can be seen in
Figure 6.
The vehicle was then driven according to the prescribed WLTP cycle, which consists of four phases simulating different driving modes—low, medium, high, and very high speed. During the entire test, the flowmeter continuously recorded the volume of fuel consumed while the speed over time and other operating parameters of the vehicle were monitored in parallel. After the test was completed, the measured data were transferred to the computer system, where the total fuel consumption was calculated according to Formula (2), expressing the consumption per 100 km according to the ratio of the total amount of fuel consumed to the distance traveled.
In order to minimize possible deviations and ensure the reliability of the results, the test was repeated five times under the same conditions. After all measurements were completed, the obtained data were analyzed, and their variability was evaluated. The results were then compared with other methods of measuring fuel consumption, such as OBD or the measurement of fuel consumption through emission production. This method enables the repeatable measurement of fuel consumption under controlled laboratory conditions, which can provide data for evaluating the fuel efficiency of a vehicle within a standardized test cycle [
21].
3. Measurement Results
In the following part of the research, we present the results of measuring the fuel consumption obtained in laboratory conditions using different measurement methods. All measurements were carried out based on driving on a cylinder test bed according to the standardized WLTP cycle, with the tests repeated five times in order to ensure the accuracy and repeatability of the data. The analyzed values include the fuel consumption, which was calculated based on the procedures defined above. The obtained results are compared with the data obtained by other measurement methods. The measurement outputs provide a comprehensive overview of the fuel efficiency of the tested vehicle and enable the evaluation of differences between individual measurement procedures.
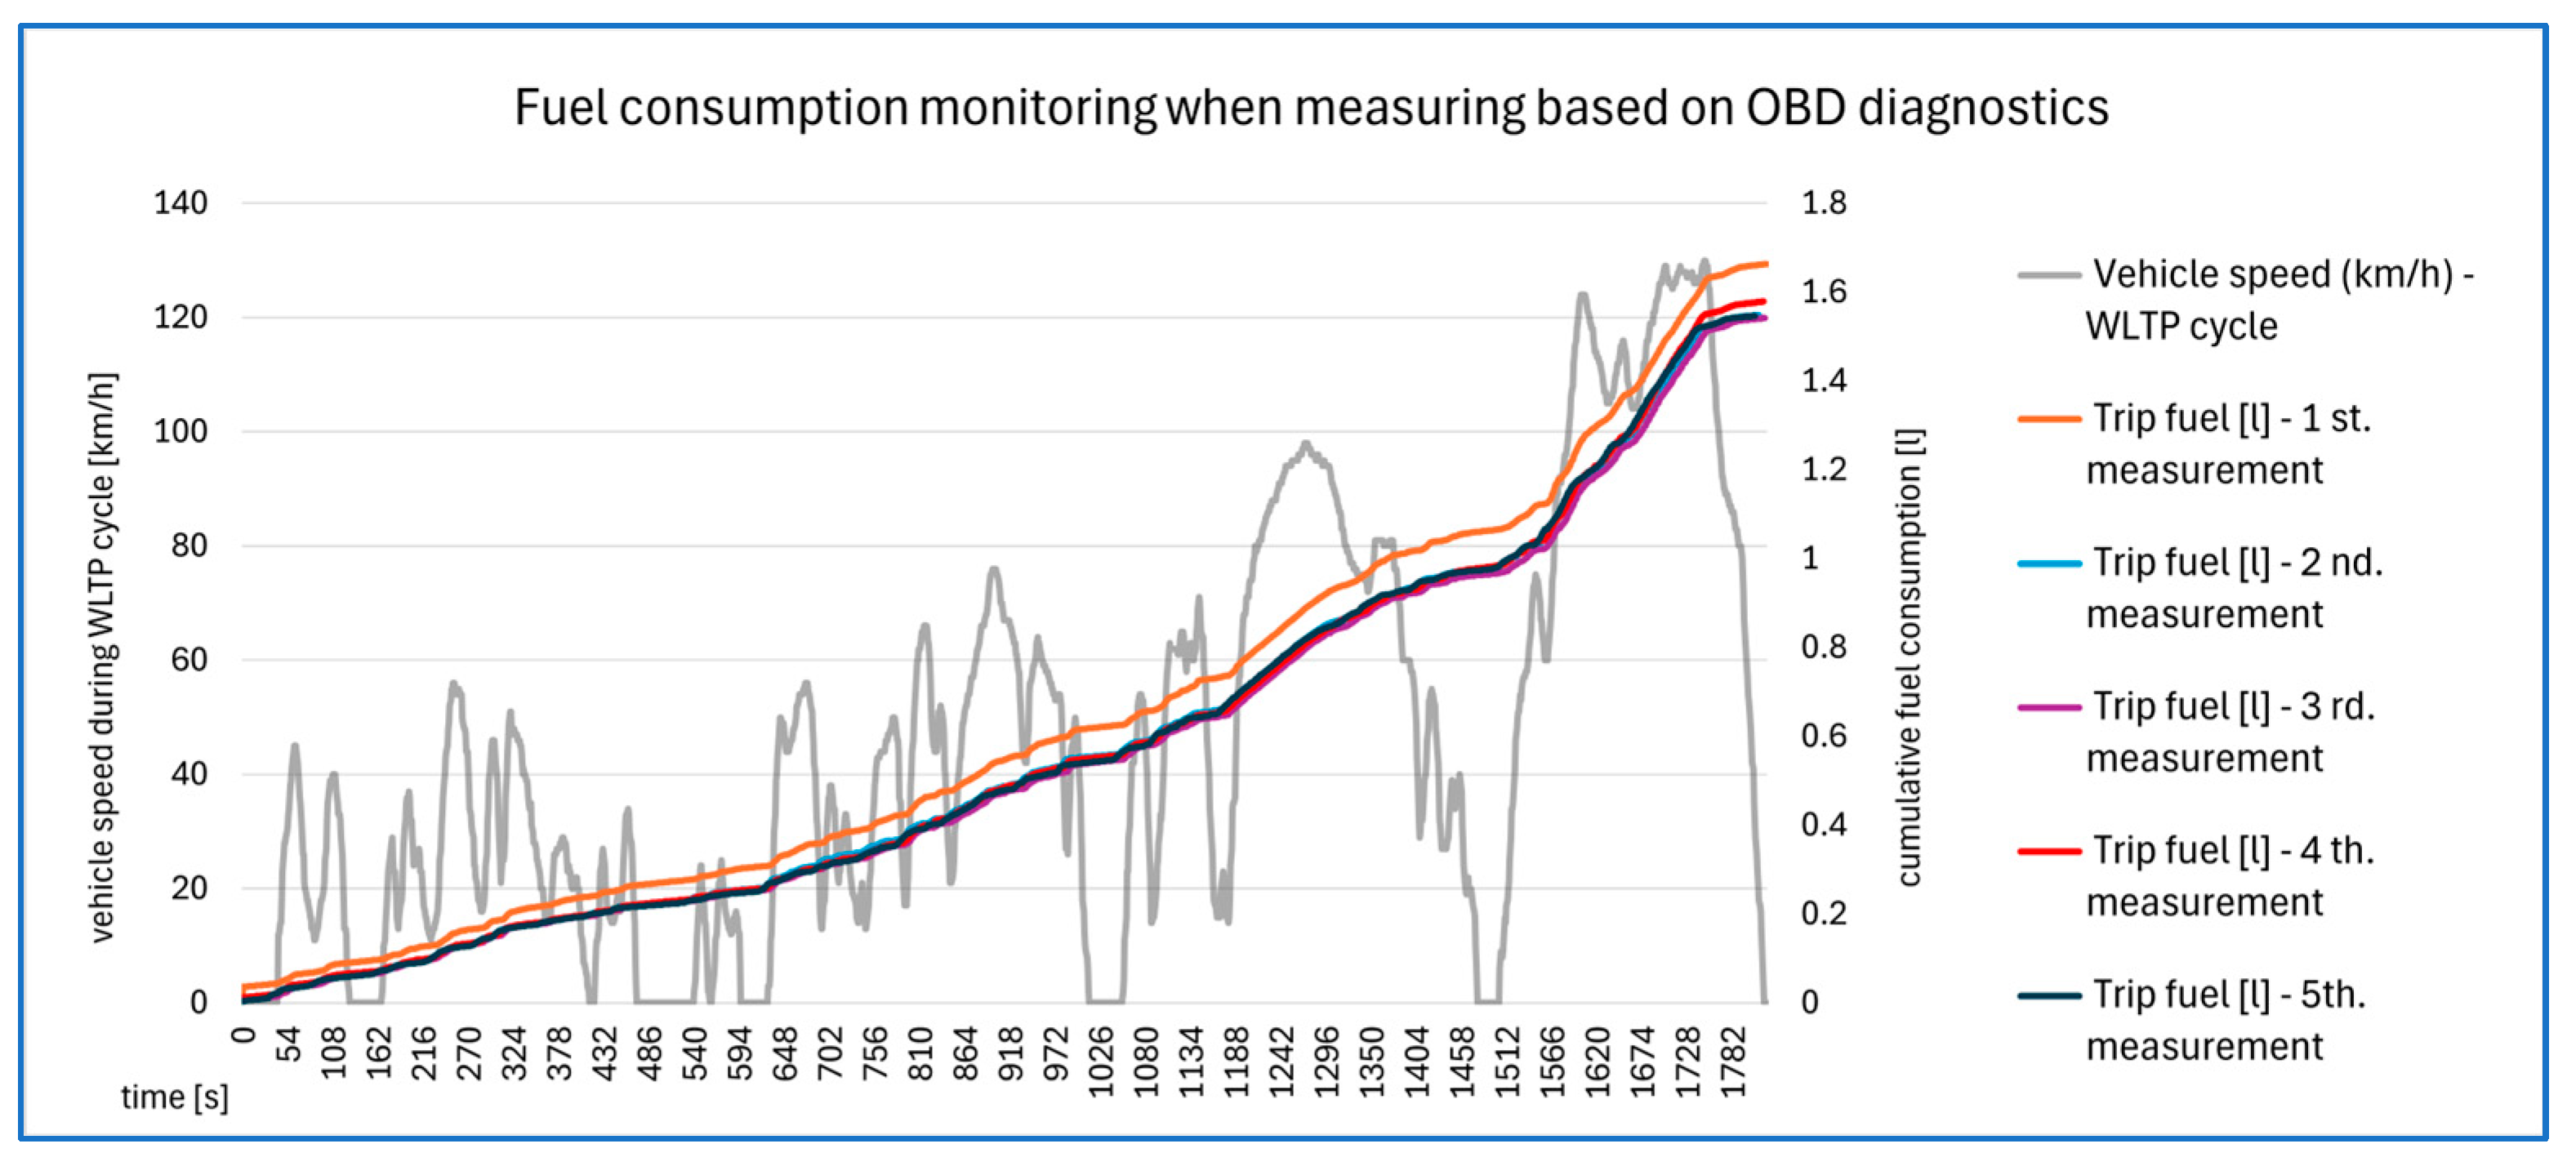
The graph (
Figure 7) shows the cumulative fuel consumption and vehicle speed during testing based on the WLTP cycle. The time in seconds is recorded on the
X-axis and ranges from 0 to 1800 s. The primary
Y-axis on the left shows the vehicle speed in kilometers per hour, while the secondary
Y-axis on the right shows the cumulative fuel consumption in liters.
The vehicle speed profile (gray curve) follows the profile of the WLTP driving cycle, which includes phases with changing dynamics. The initial speed values are zero and gradually increase in the individual phases of the cycle, reaching a maximum of 130 km/h in the final part of the test. The fuel consumption, shown by colored curves representing different measurements (from the first to the fifth), gradually increases as the time increases. All curves have a similar shape and demonstrate the consistency of the results of individual measurements.
The maximum cumulative fuel consumption reaches approximately 1.6 L, which is consistent across all measurements. The speed and fuel consumption show a positive trend, where the increase in speed directly affects the increase in cumulative fuel consumption. The overall result shows that the measurements are consistent, while the deviations between the individual fuel consumption curves are minimal. This indicates the stability of the measurement method and the repeatability of the testing conditions within the WLTP cycle.
The graph in
Figure 8 shows the results of the fuel consumption measurement based on the fuel flow during the WLTP driving cycle. The time in seconds is displayed on the
X-axis and ranges from 0 to 1800 s. The
Y axes are dual, with the primary axis presenting the vehicle speed in kilometers per hour and the right axis presenting the cumulative fuel consumption in liters during the measurement.
The course of the vehicle’s speed, shown by the gray curve, follows the prescribed profile of the WLTP cycle. The speed values start from zero, gradually increase, and reach a maximum value of 130 km/h in the final phase of the test. The curve contains typical accelerations, decelerations and steady speeds that are characteristic of the different phases of the WLTP cycle.
The cumulative fuel consumption, represented by colored curves (green, blue, purple, pink and dark green) for individual measurements, shows a gradual increase throughout the test. The curves for the individual measurements are almost identical, which indicates the high consistency of the results. The initial values are zero and the cumulative consumption gradually increases, reaching approximately 1.6 L at the end of the test.
The overall result confirms that the chosen measurement method based on fuel flow can be evaluated as reliable, and that repeatable results can be provided. This graph also demonstrates that the fuel consumption profile correlates precisely with the course of the WLTP driving cycle, where changes in speed affect the dynamics of the increase in cumulative consumption.
The graphical results of the measurements in
Figure 9 present the results of the investigation of fuel consumption depending on the methodology used, while the
Y axis shows the fuel consumption in liters during the measurement depending on the chosen measurement method. Each type of methodology is represented by a box fence, which shows the range of values, the median, and possible deviations.
The measurement methodology using the AIC 1204 fuel flowmeter shows the most stable results with the smallest dispersion of values, while the median consumption is around 1.65 L. Using OBD and data from the engine control unit, the consumption is slightly lower, with a median of about 1.60 L, but at the same time, a wider range of values is recorded, indicating a higher variability in the measurements. The measurement of fuel consumption based on the analysis of gas emissions results in the highest median consumption, at approximately 1.70 L, and at the same time shows the largest range of values, which may indicate the higher sensitivity or different accuracies of the determination of fuel consumption.
The overall comparison shows that the fuel consumption results depend on the chosen methodology, with the method using a fuel flowmeter proving to be the most effective. The method of data collection via OBD presents lower consumption values, and the measurement of consumption through the monitoring of emissions production shows higher consumption with a larger range. This variability could be caused by different measurement principles or the settings of individual methodologies.
The histogram shown in
Figure 10 presents the distribution of the probability of fuel consumption using different measurement methods. The
x-axis shows the fuel consumption in liters, while the
y-axis represents the probability of individual values. Each measurement method is represented by a different color:
fuel consumption determined by the flowmeter (light blue) shows the highest concentration at around 1.65 L, while the distribution is relatively symmetrical,
fuel consumption determined on the basis of OBD (red) shows a greater spread of values, with a mean value of approximately 1.55 L, while the distribution is wider and less consistent,
consumption determined on the basis of the flow of exhaust emissions (dark blue/green) has a mean value of approximately 1.67 L, while a slight asymmetry in the distribution is visible.
The vertical dashed lines indicate the average values for the individual methods, thus indicating systematic differences between them. It is clear from the results that the OBD method shows the most significant variability in its measurements, while the calculation based on emissions is more stable. The probability density curve indicates the overall distribution of values, with a visible overlap between methods, indicating that although the mean values differ, they may produce similar results in some cases. These graph thus clearly demonstrate the differences in the accuracy and reliability of the individual methods of measuring fuel consumption.
The graphic comparison in
Figure 11 shows the results of the fuel consumption measurements depending on the measurement methodology used. Individual test repetitions can be followed on the horizontal axis, while the vertical axis represents the measured fuel consumption in liters. The trend in the values indicates that the results obtained by the AIC 1204 flowmeter and OBD show less variability, while the values are mutually comparable. In contrast, the fuel consumption derived from emission production shows higher values and greater variance between individual repetitions. The maximum measured value occurs in the first test for the emission-based method, where it reaches 1.783 L. The lowest value was recorded by the OBD method in the fifth measurement, with a value of 1.547 L.
The overall result points to the differences between the individual methodologies used to measure fuel consumption. The emission-based method systematically shows higher values than the other two approaches, indicating a possible systematic bias in this method. The AIC 1204 flowmeter and the OBD provide similar results, with the OBD showing slightly lower values on average. The results indicate that the method based on the direct measurement of fuel flow repeatedly provides more accurate and consistent data.
When analyzing the results in
Table 5, the Z-score method shows how individual measurements of fuel consumption deviated from the average value within each of the methods used. When assessing the fuel consumption measurements obtained with a flowmeter, it turns out that measurement no. 3 shows the largest deviation (Z-score = 0.1267), but it is not a statistically significant extreme (
p > 0.05). Other measurements have relatively low Z-score values, indicating that they are close to the mean, and that their values can be presented as stable.
When measuring fuel consumption through OBD, the largest deviation was recorded in measurement no. 1 (Z-score = 1.713), which indicates greater variability in the data obtained using this method. Other measurements have lower Z-score values, while measurement no. 4 shows an extremely low value, which may indicate the consistency of the measurements.
When measuring fuel consumption via the monitoring of exhaust gas emissions, measurement no. 1 had the highest deviation (Z-score = 1.640), but it was also not a statistically significant extreme (p > 0.05). Other measurements have lower Z-score values, while measurement no. 2 is closest to the average value.
Overall, the analysis shows that although there are some deviations between the measurements, none of them are extreme, and all remain within an acceptable range. The determination of fuel consumption through OBD shows higher variability compared to the other methods, which may indicate the lower accuracy of this method in measuring fuel consumption.
The graphs in
Figure 12 show the results of measuring fuel consumption using different methods during five repetitions of the test. The horizontal axis shows individual measurements, while the vertical axis represents fuel consumption in liters per 100 km. In this case, it is a recalculation of the absolute amount of fuel consumed relative to the total distance traveled by the vehicle during the WLTP cycle. After multiplying the result by the number 100 according to Formula (2), it is possible to obtain consumption data in units of L/100 km. In addition to individual consumption data, the graph also shows the average values of fuel consumption for each method.
The highest measured consumption value occurs during the first measurement obtained using the calculation method based on emissions, where it reaches 7.716 L/100 km. Conversely, the lowest value was recorded in the third measurement using OBD, where the measured value was 6.622. The average consumption calculated on the basis of emissions is the highest, while the OBD method shows systematically lower values. The consumption measured by the flowmeter is stable compared to other methods and reaches an average value for OBD and the calculation based on emissions.
When comparing the individual methods, it can be observed that the fuel consumption calculated on the basis of emissions is systematically higher compared to the other approaches, while the difference between this method and the flowmeter is around 6 to 9%. The average difference between OBD and the AIC flowmeter ranges from 2% to 4%, with OBD showing lower values. Overall, it can be concluded that direct fuel measurement methods are more accurate and consistent compared to emission-based calculations, which show higher variability and systematically overestimate results.
Figure 13 shows the overall results of the fuel consumption investigation depending on the measurement method. It is clear from the graph that the highest fuel consumption was unequivocally obtained when measuring the produced emissions (7.301 L/100 km). The flowmeter measurements show consumption (7,1L/100 km). The fuel consumption measured using OBD (6.766 L/100 km) was the lowest average value recorded between these two values.
For a better understanding of the differences between the measurement methods, it is possible to determine the percentage changes in fuel consumption. A detailed comparison can be seen in
Table 6.
The data in
Table 6 show the percentage differences in the fuel consumption measurements between the three methods. The diagonal of the table (top left to bottom right) shows the comparison of each method against itself, so there are zeros in these cells. The other cells of the table show the percentage change between the two methods. For example, a value of −4.94% in the first row and second column means that the OBD recorded a 4.94% lower fuel consumption than the flowmeter. On the contrary, the value of 2.83% in the first row and the third column means that the measurement of fuel consumption through emissions showed a 2.83% higher consumption than the flowmeter. Similarly, the values in the second row of the first column (4.94%) and the third column (−7.91%) correspond to the percentage changes when comparing the OBD with the flowmeter and the calculation obtained using the recorded emissions (UN/ECE methodology No. 101). In the third row and the first and second columns, the percentage changes for the comparison of emissions with a flowmeter (−2.75%) and OBD (−7.33%) are shown.
4. Discussion
The aim of the research was to verify the accuracy and reliability of various methods designed to determine the fuel consumption of a road vehicle. The results of the investigation also identify possible differences between the official data regarding fuel consumption listed in the documents of the vehicle and the fuel consumption achieved by the vehicle during real operation. The research methodology was focused on three different ways of monitoring the production of emissions:
fuel consumption measurement based on the fuel flowmeter,
diagnostics, which is connected to the ECU via the OBD connector,
the calculation of consumption based on the production of emissions.
The goal of the investigation was also to determine the accuracy and correctness of the methods used. In order to assess and compare the measurements with each other as a basis for the implementation of the driving test, the WLTP driving cycle was used and the test drives were performed on a cylinder dynamometer. The absolute fuel consumption that the vehicle achieved by passing the measuring section (WLTP cycle) was evaluated in liters.
The results of the research showed that the differences in the measured values of fuel consumption are significant and largely depend on the measurement method used. The vehicle was in an unchanged condition during testing. In the same way, the input parameters of the testing, such as the weight of the vehicle and the activation of additional equipment (air conditioning, etc.), were unchanged for the entire duration of the tests. Scientific studies show an increase in fuel consumption depending on the weight of the vehicle [
22]; according to [
23], an increase in the weight of a vehicle by 100 kg can increase its fuel consumption by 5–9%. Likewise, similar research points to the use of auxiliary systems (e.g., air conditioning, lighting, or media player), with test results indicating that the use of air conditioning can increase the fuel consumption of a conventional vehicle by more than 25%, especially for short trips (less than 10 km road distance) [
24,
25,
26]. By observing the results of three different methods, it was proven that each method provides different results, with some showing more consistency and reliability than others. A study by Pengfei et al. pointed out the impacts of selected factors and their influence on the difference in fuel consumption between driving conditions in the laboratory and real driving conditions [
27].
Measurements made using a fuel flowmeter showed that the fuel consumption ranged from 1.609 L to 1.654 L per route. The average value was around 1.635 L, with the highest recorded value being 1.651 L and the lowest being 1.609 L. From the point of view of statistical analysis, the value with the highest Z-score of 0.828 did not represent a significant deviation, which indicates that this method provides relatively stable results without the presence of extreme values. This method of measuring fuel consumption has the advantage in the Slovak Republic of being the only method for which authorizations have been issued. Flow meters with excellent parameters are on the market today (an accuracy better than 1% and a repeatability better than 0.2%—according to the data of a renowned manufacturer of AIC 1200 series flowmeters). The advantage of these flowmeters is that they can be connected directly to a roller dynamometer, and data processing is thus automatic in the control panel. The disadvantage of flowmeters is the complexity of their connection to the vehicle’s fuel system, or rather the problems associated with it. This is a method that requires intervening in the engine’s fuel system.
On the other hand, measurements carried out using a diagnostic device connected to the ECU via OBD showed a significantly greater dispersion of values. The highest recorded consumption reached up to 1.663 L, while the lowest was only 1.578 L. This wide variability suggests that the diagnostic equipment and the OBD system may be susceptible to incorrect readings or errors caused by modifications to the software of the control unit [
28]. Z-score analysis revealed that the highest measured value had a Z-score of 1.713, meaning that this value was the most different within a given set of measurements. Despite the fact that this is a significant deviation, it was still not classified as statistically extreme. This result points to the fact that OBD can, in some cases, provide unreliable or misleading data that can distort the real picture of fuel consumption. Pavlovic et al. and Zheng et al. also proved in their research that instantaneous fuel consumption can also be obtained through the OBD interface. When comparing the value of fuel consumption determined on the basis of OBD with the emission test method, they proved that the difference between the fuel consumption determined via OBD and emissions was only −1.9 ± 0.8% [
29,
30]. On the other hand, it is necessary to prove that the OBD solution is more cost-effective. Szalay et al. proved that OBD devices have less information available and have a much shorter replenishment time than the FMS-CAN or CAN of a proprietary vehicle. It follows that OBD-based fuel consumption measurement methods still present certain challenges in the field of calibration [
31]. The advantages of this method are mainly the quick installation of the device and quick processing of the results. The disadvantage is that the amount of fuel consumed is a value calculated by the control unit from electronic data regarding the preparation of the fuel mixture. During the official measurement of fuel consumption in Slovak conditions, this method appears to be feasible, especially due its cost-effectiveness and ability to save time.
The third method is based on fuel consumption calculations based on the analysis of emissions production. The measured values ranged from 1.636 L to 1.783 L, while the average value was at the level of 1.685 L. The highest measured value was 1.783 l, and its Z-score was 1.64042. This value was the most different from the rest of the data, but it still moved within the limits of the statistical norm. The overall results indicate that the emission-based calculation method provides relatively stable data. The advantage of this method is that it is a non-interventional way of measuring fuel consumption, and that it is enough to install a sampling probe in the exhaust manifold. The disadvantages of this method are the relatively high price of the equipment and the time it takes to obtain a final calculation of the fuel consumption. During the official measurement of fuel consumption in the Slovak Republic, this method is very difficult to apply due to the described disadvantages.
Several important conclusions can be drawn from the research results:
the differences between the methods used indicate that choosing the correct fuel consumption measurement procedure is key to obtaining results,
the fuel consumption monitoring method based on the analysis of exhaust emissions proved to be the most reliable, while the consumption monitoring method based on OBD showed the most variability, indicating that its data may be affected by other factors such as software updates or vehicle control algorithms,
the results confirm that the measurement methodology can have a significant impact on the interpretation of fuel consumption, which is important in terms of data transparency and the regulation of emissions in the automotive industry.
The research results are of practical importance not only for regulatory authorities but also for the consumers themselves. A change in the measurement methodology can affect the official fuel consumption values found in the technical documentation of the vehicles and, thus, the drivers’ expectations regarding the vehicle’s real operational consumption. These findings, therefore, highlight the need for a more transparent and accurate way of reporting data to minimize the differences between laboratory and real-world driving conditions.


 ,
, 


