

A Vehicle Density Estimation Traffic Light Control System Using a Two-Dimensional Convolution Neural Network


Abstract
:1. Introduction
- Manual control: As the name implies, traffic control involves human intervention. To manage traffic, traffic police are posted in a specific location;
- Traditional traffic lights with fixed timers: Timers are used to control this. The timer is set to a constant value. The timer value determines when the lights automatically turn from red to green [6];
- Electronic sensors: Another state-of-the-art option is to place proximity or loop detectors beside the road. This sensor collects information about traffic in vehicles. The traffic lights are managed by means of sensor data [7].
2. Related Work
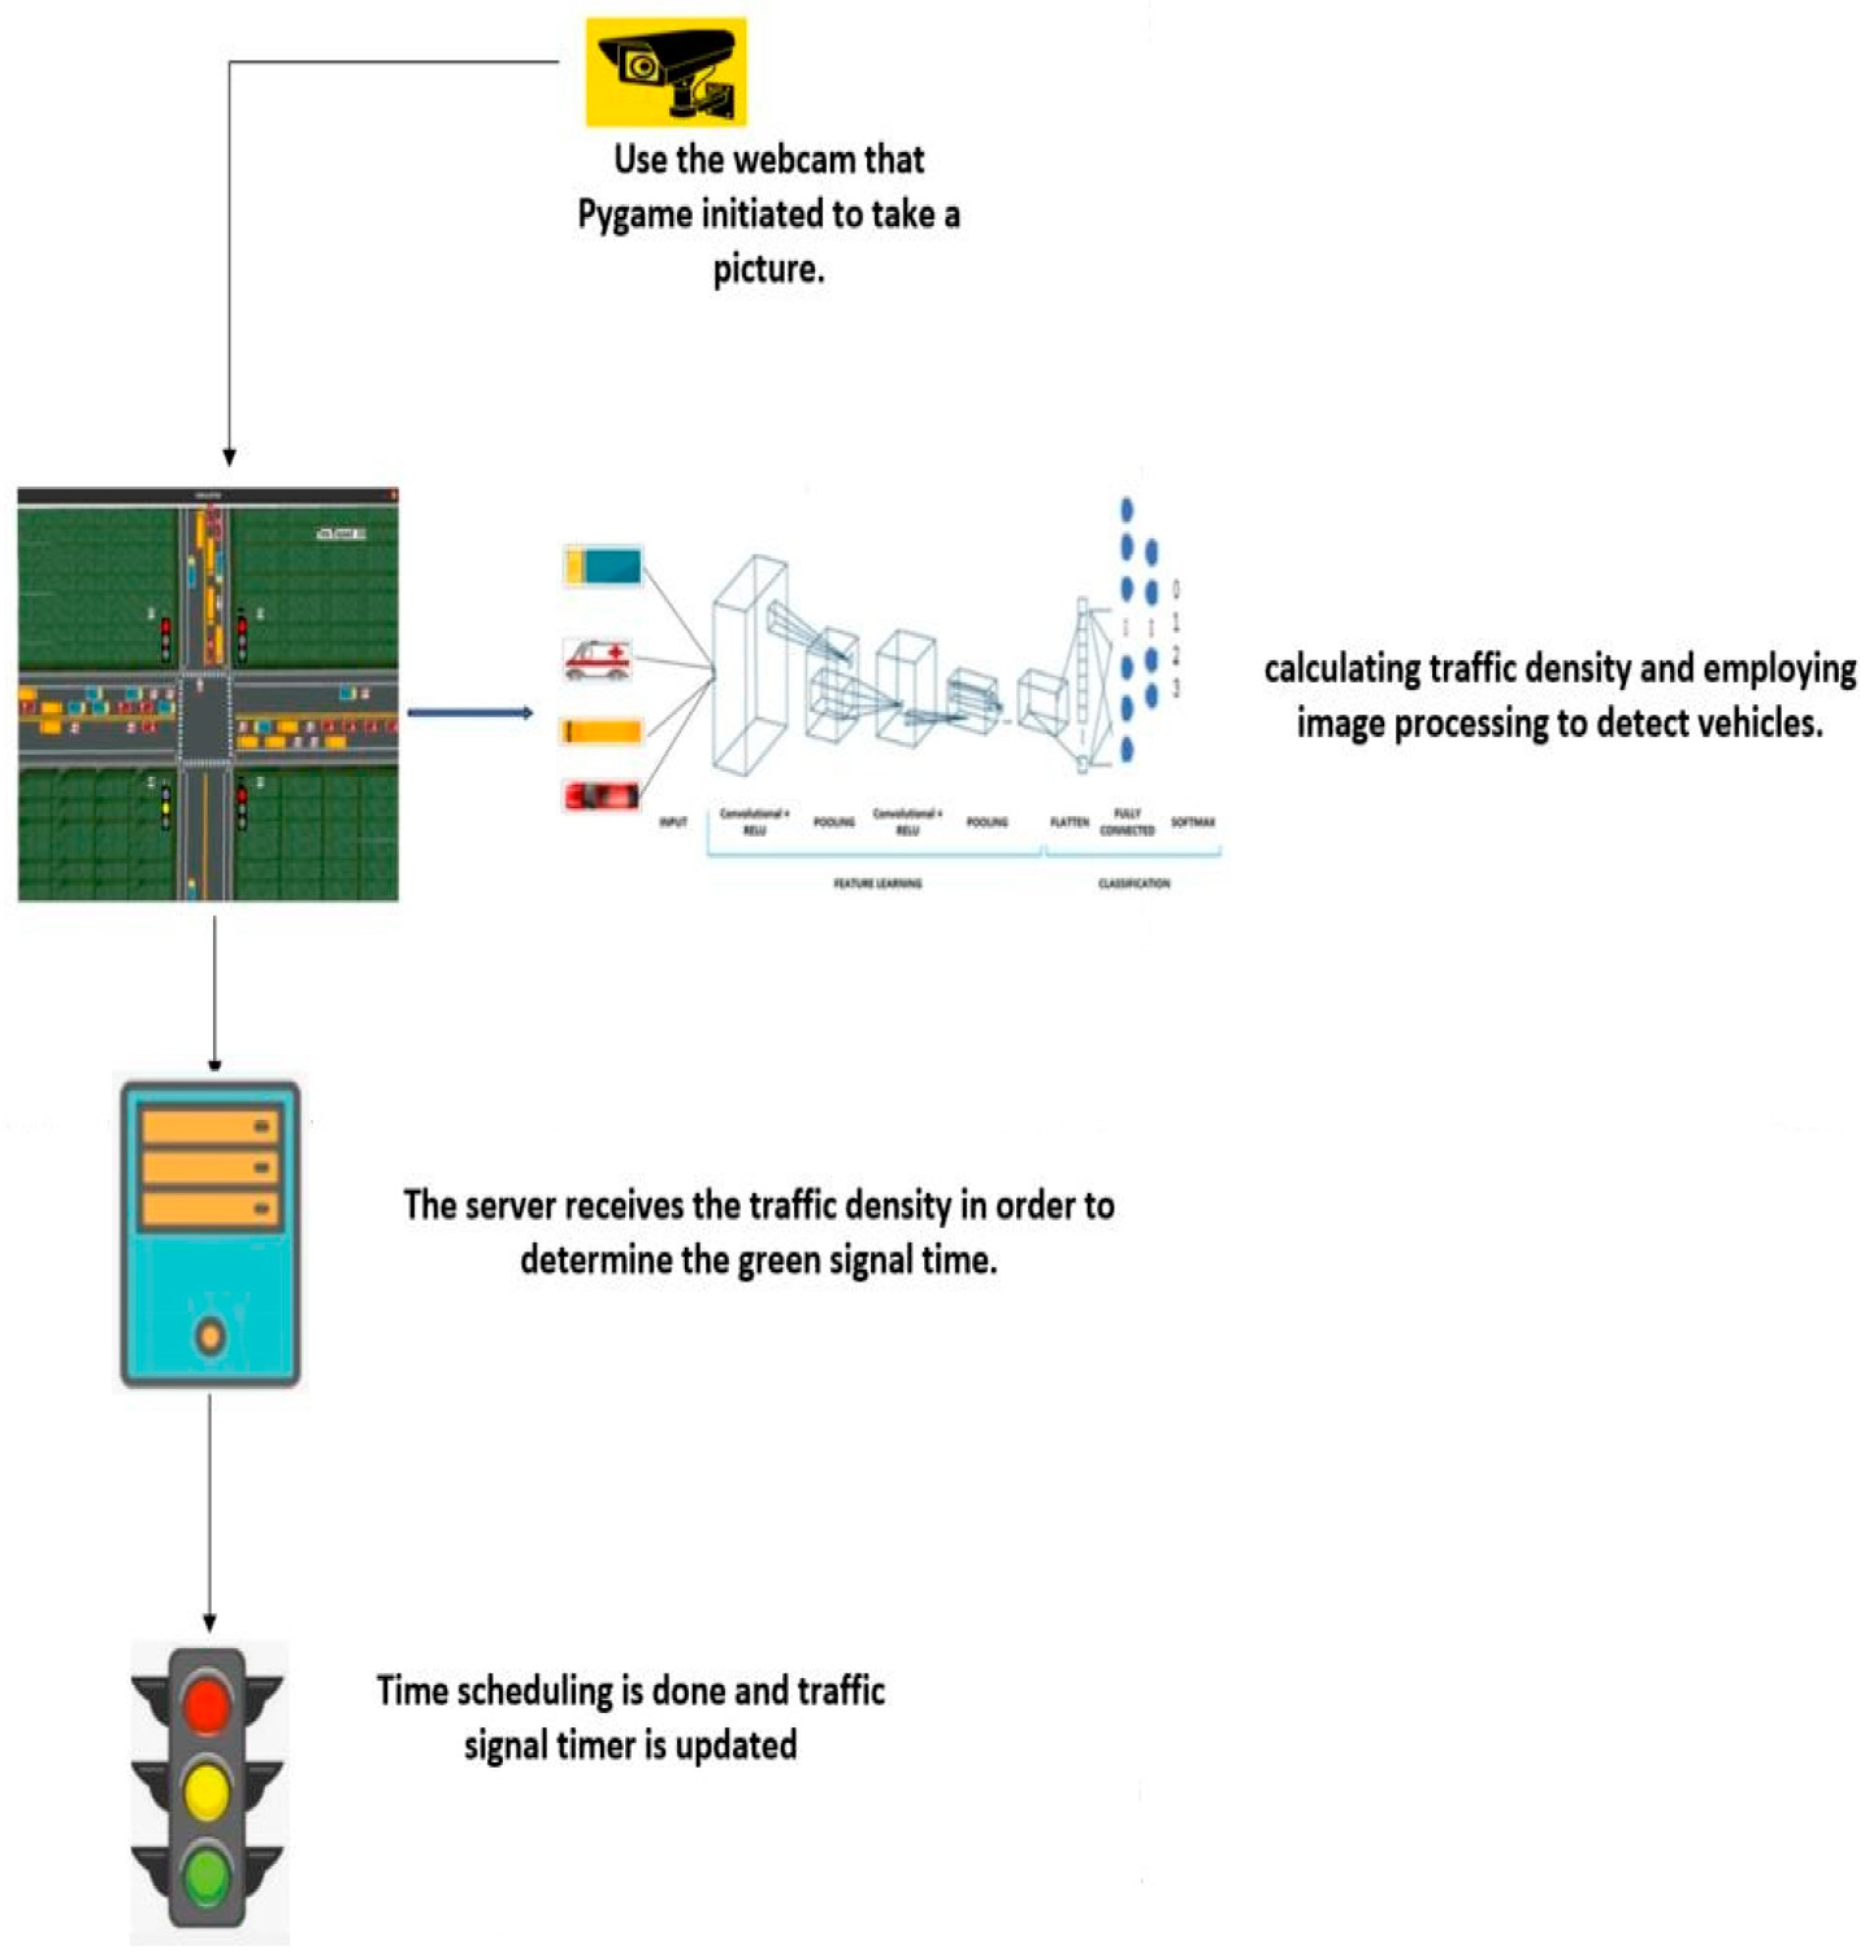
3. Proposed Methodology and Model
- Emergency vehicles enter the intersection from both directions at the same time. In this case, the suggested system is designed in such a way that it prioritizes lanes with heavy traffic, and there is no emergency vehicle preemption, which is accomplished through the program;
- Intersection accidents. The proposed system lacks an accident detection method and instead focuses on vehicle density and emergency vehicle preemption. It was designed with the assumption that no accidents would ever occur at the intersection and that traffic would flow freely.
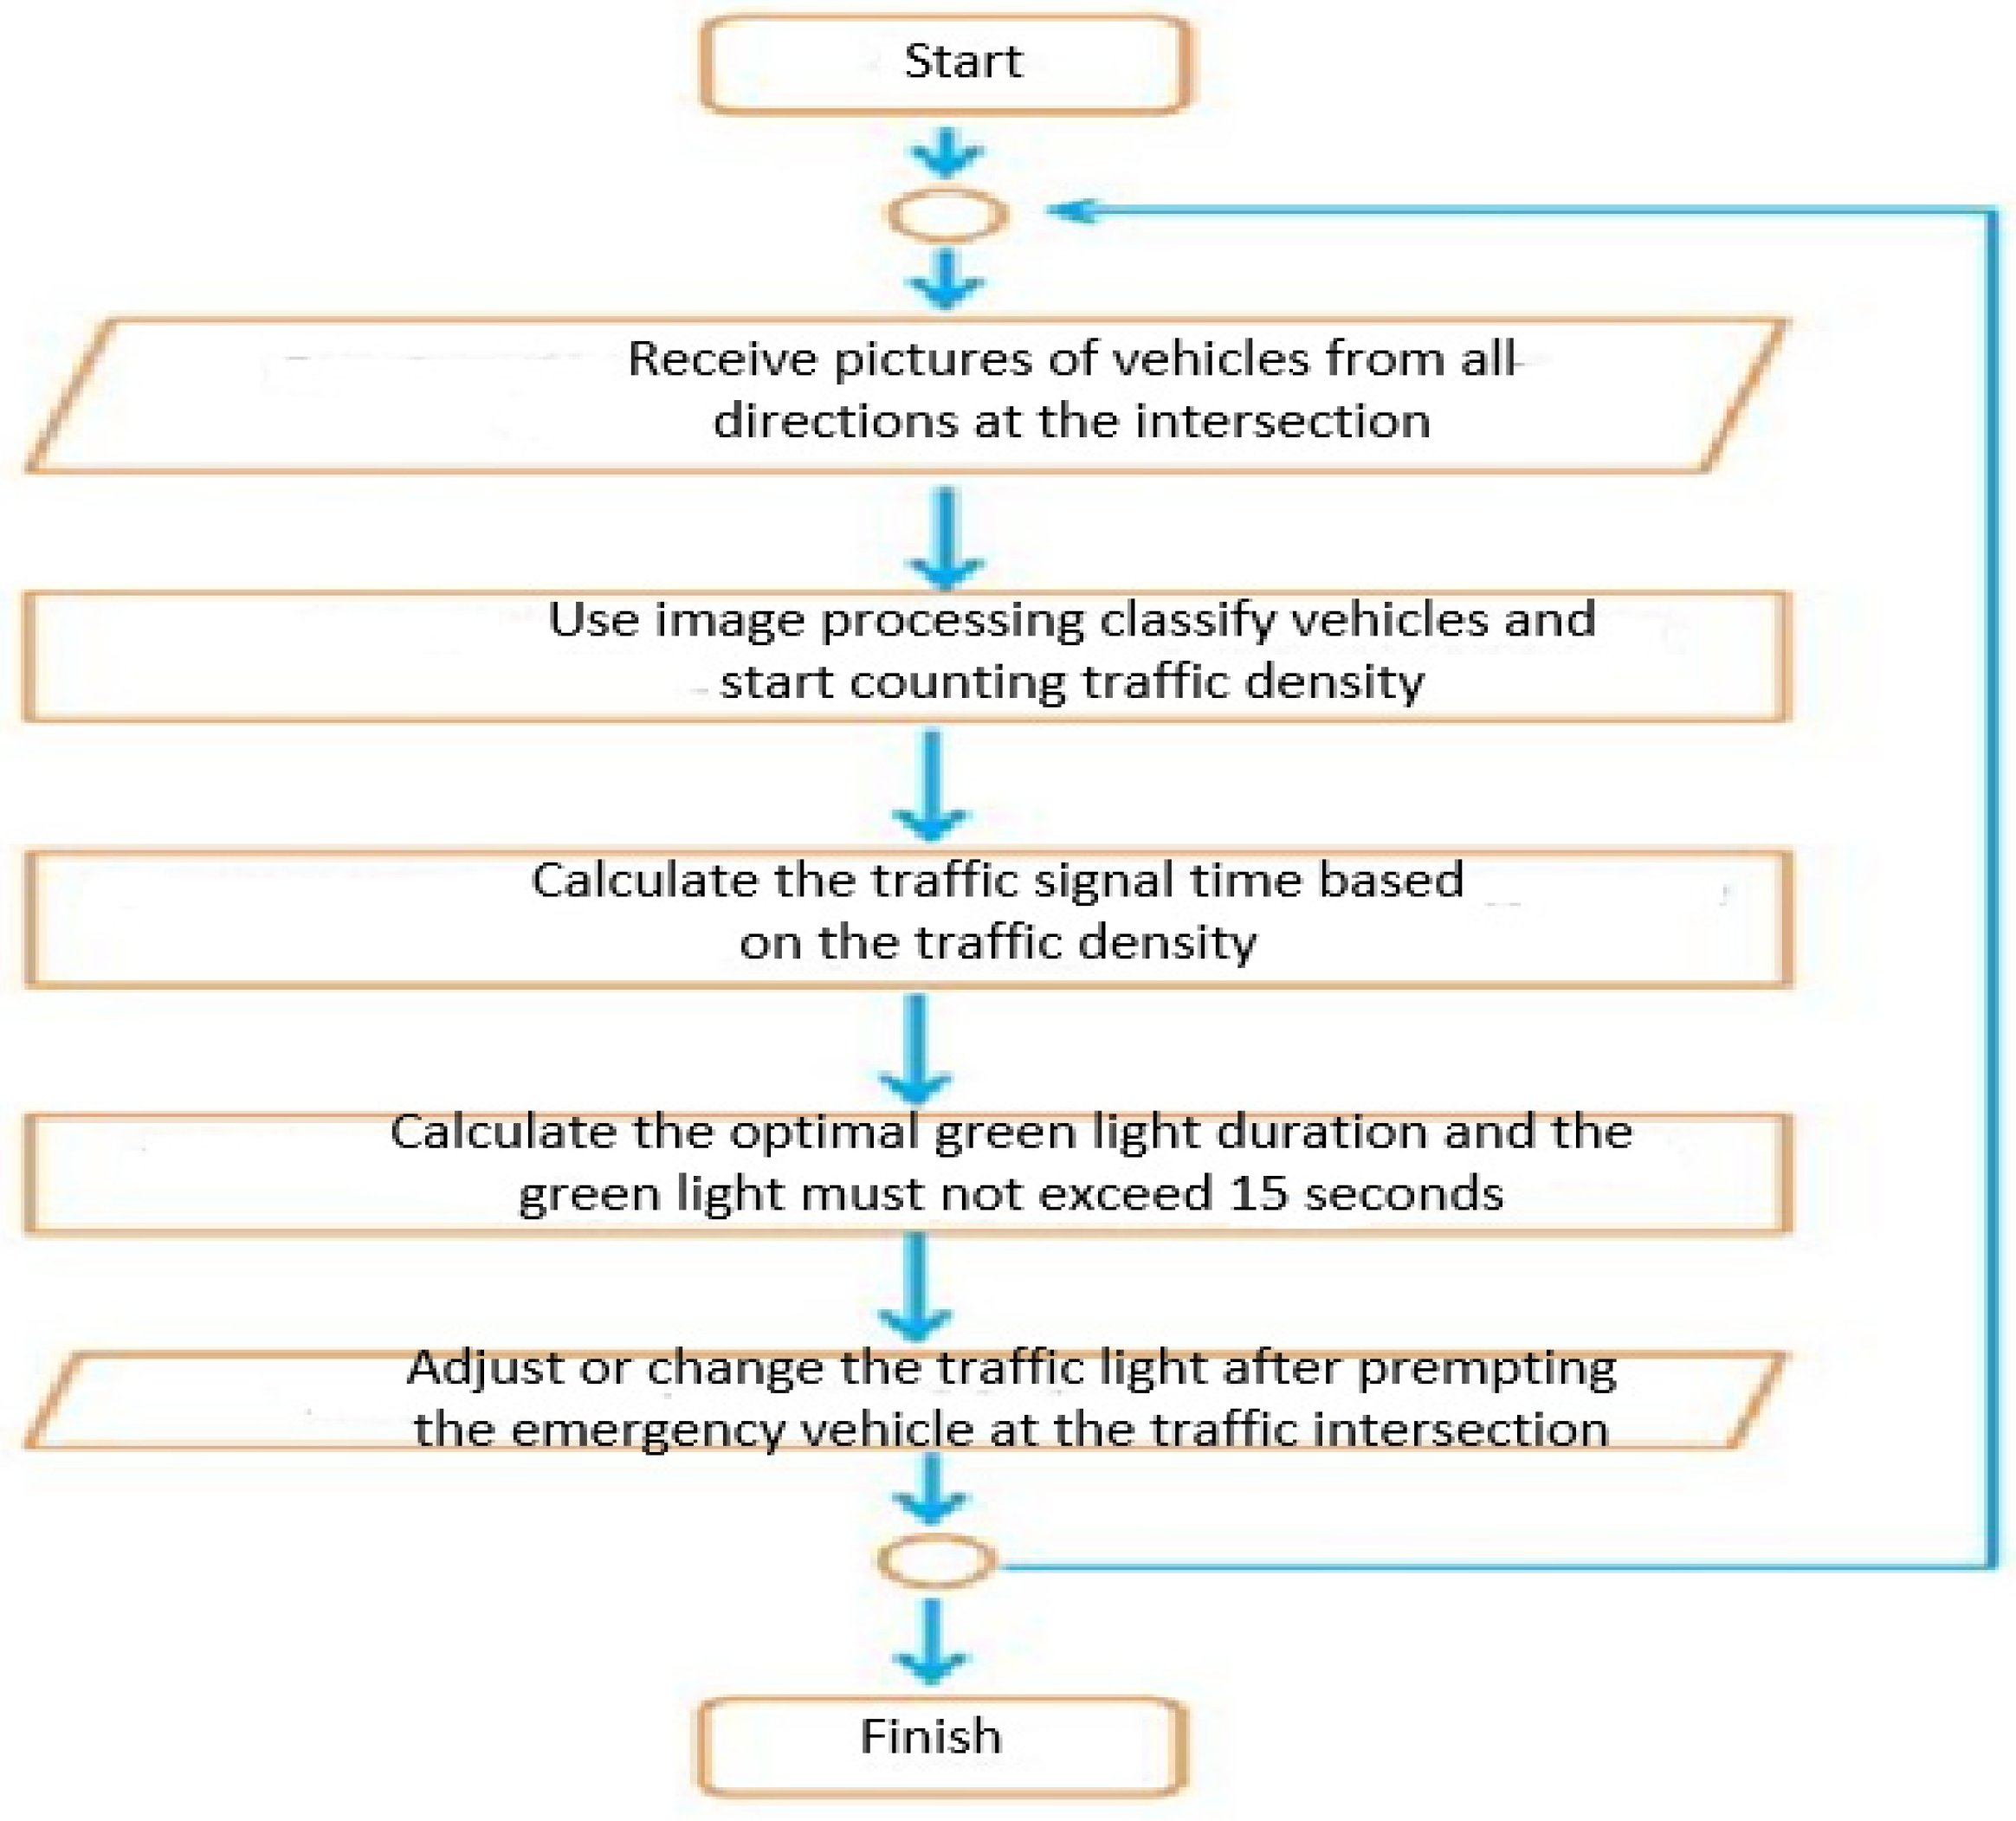
3.1. Traffic Density Estimation and Prioritization
- TD is the traffic density calculated using the simulation’s current load of vehicles;
- The vehicle detection module determines the length of the string NoOfAutomobileGroup, which encodes the number of cars from each class present at the signal;
- The intersection’s lane count is given by the parameter NoOfTrafficLanes.
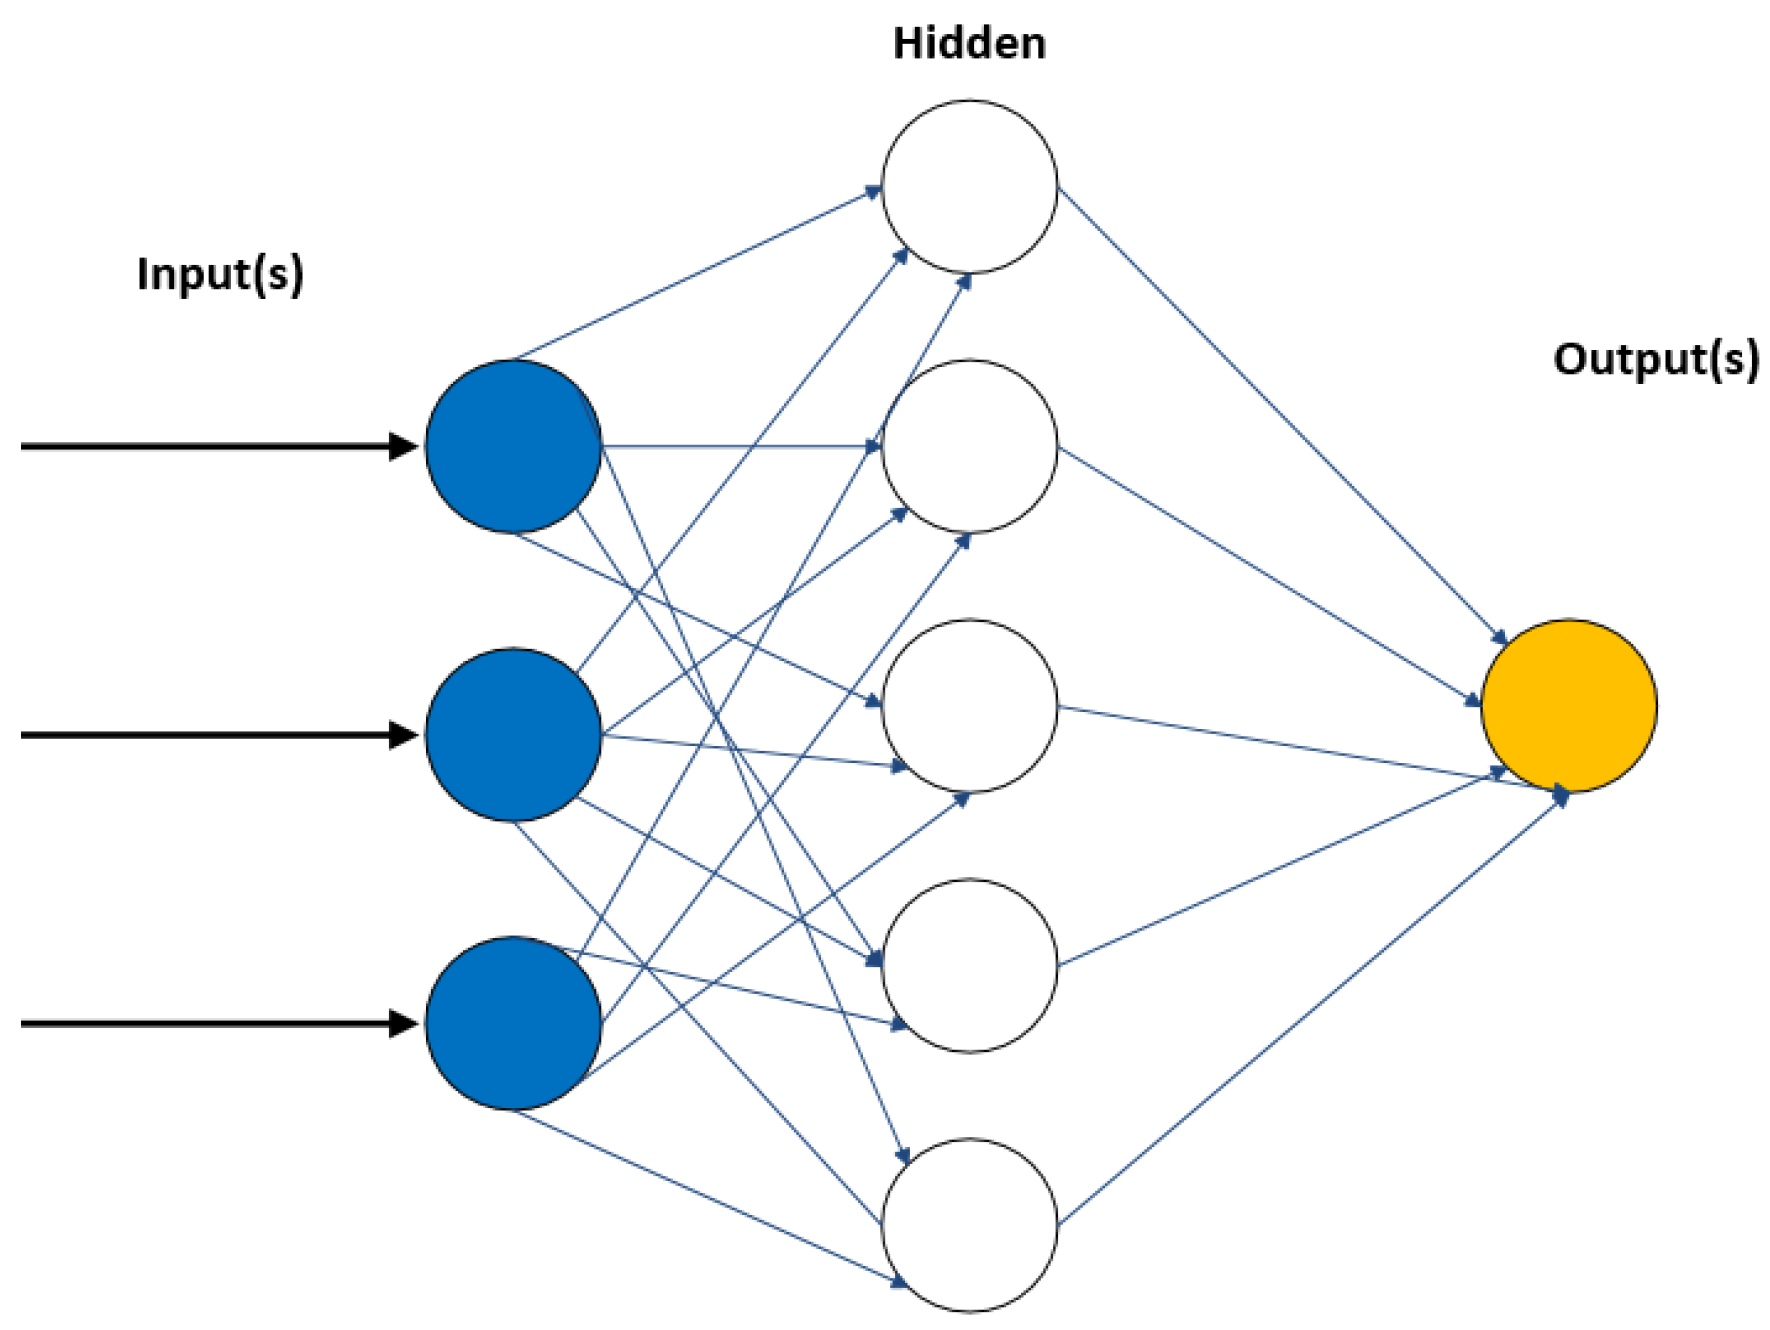
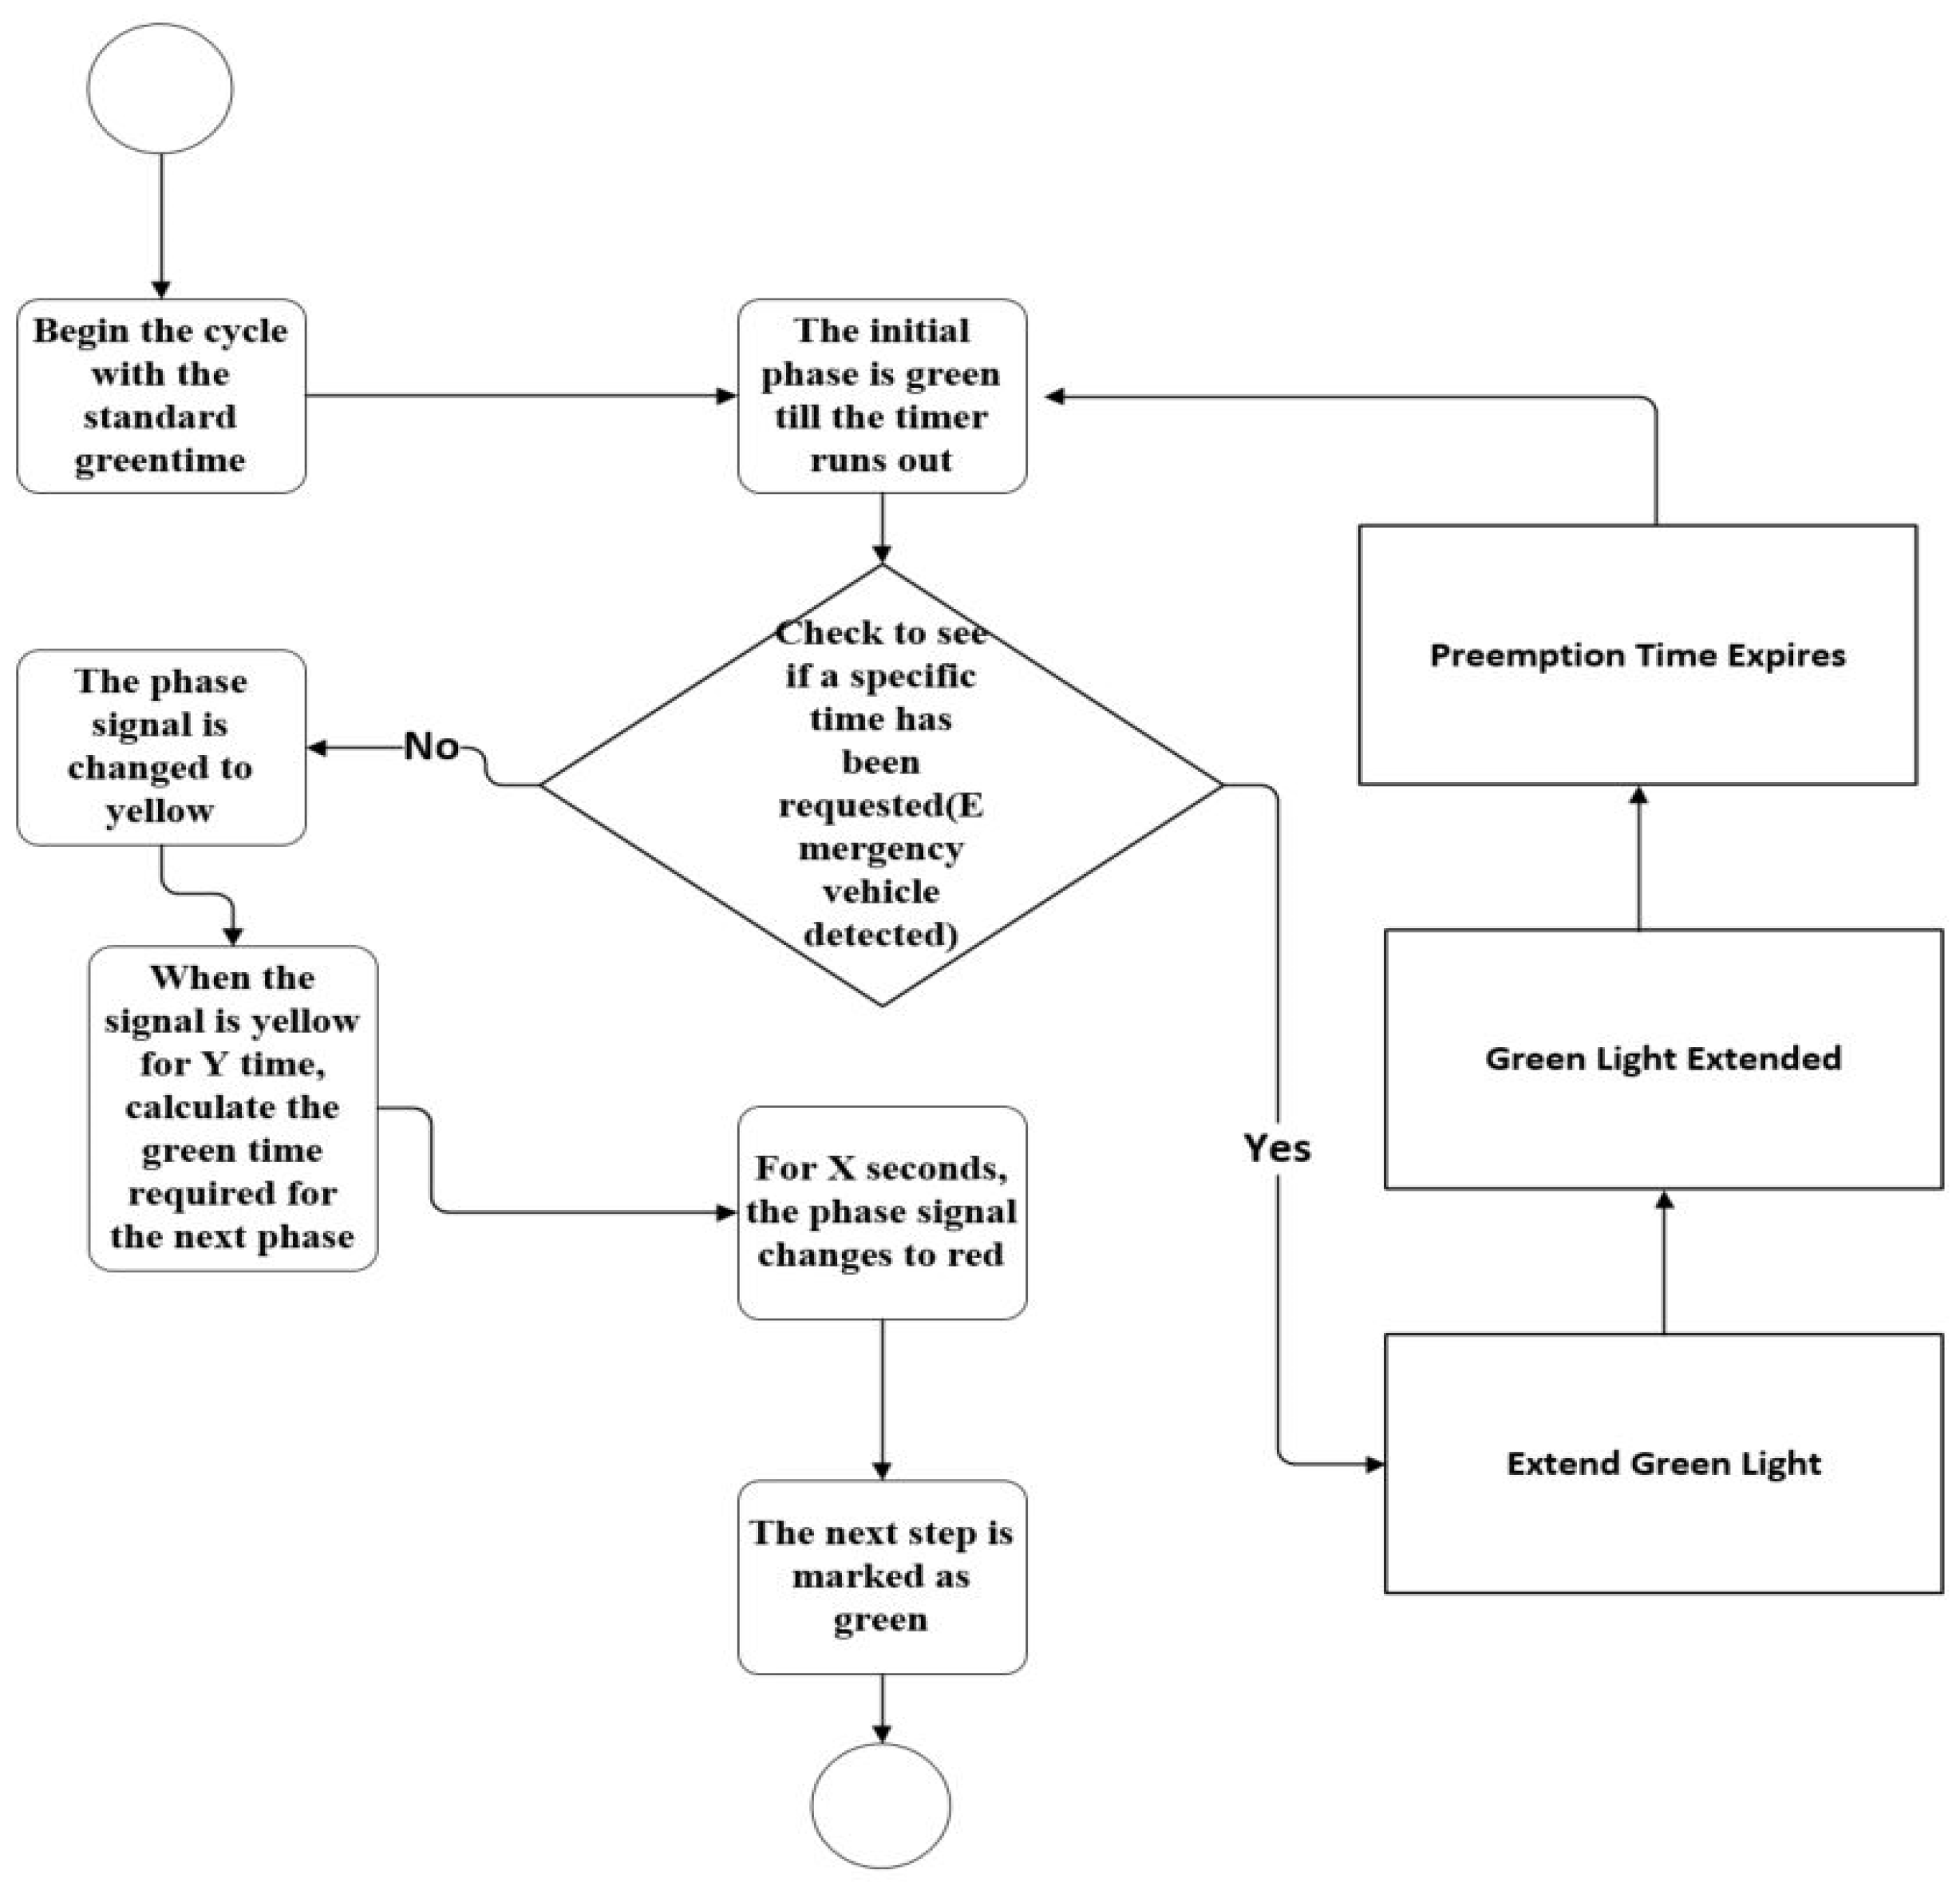
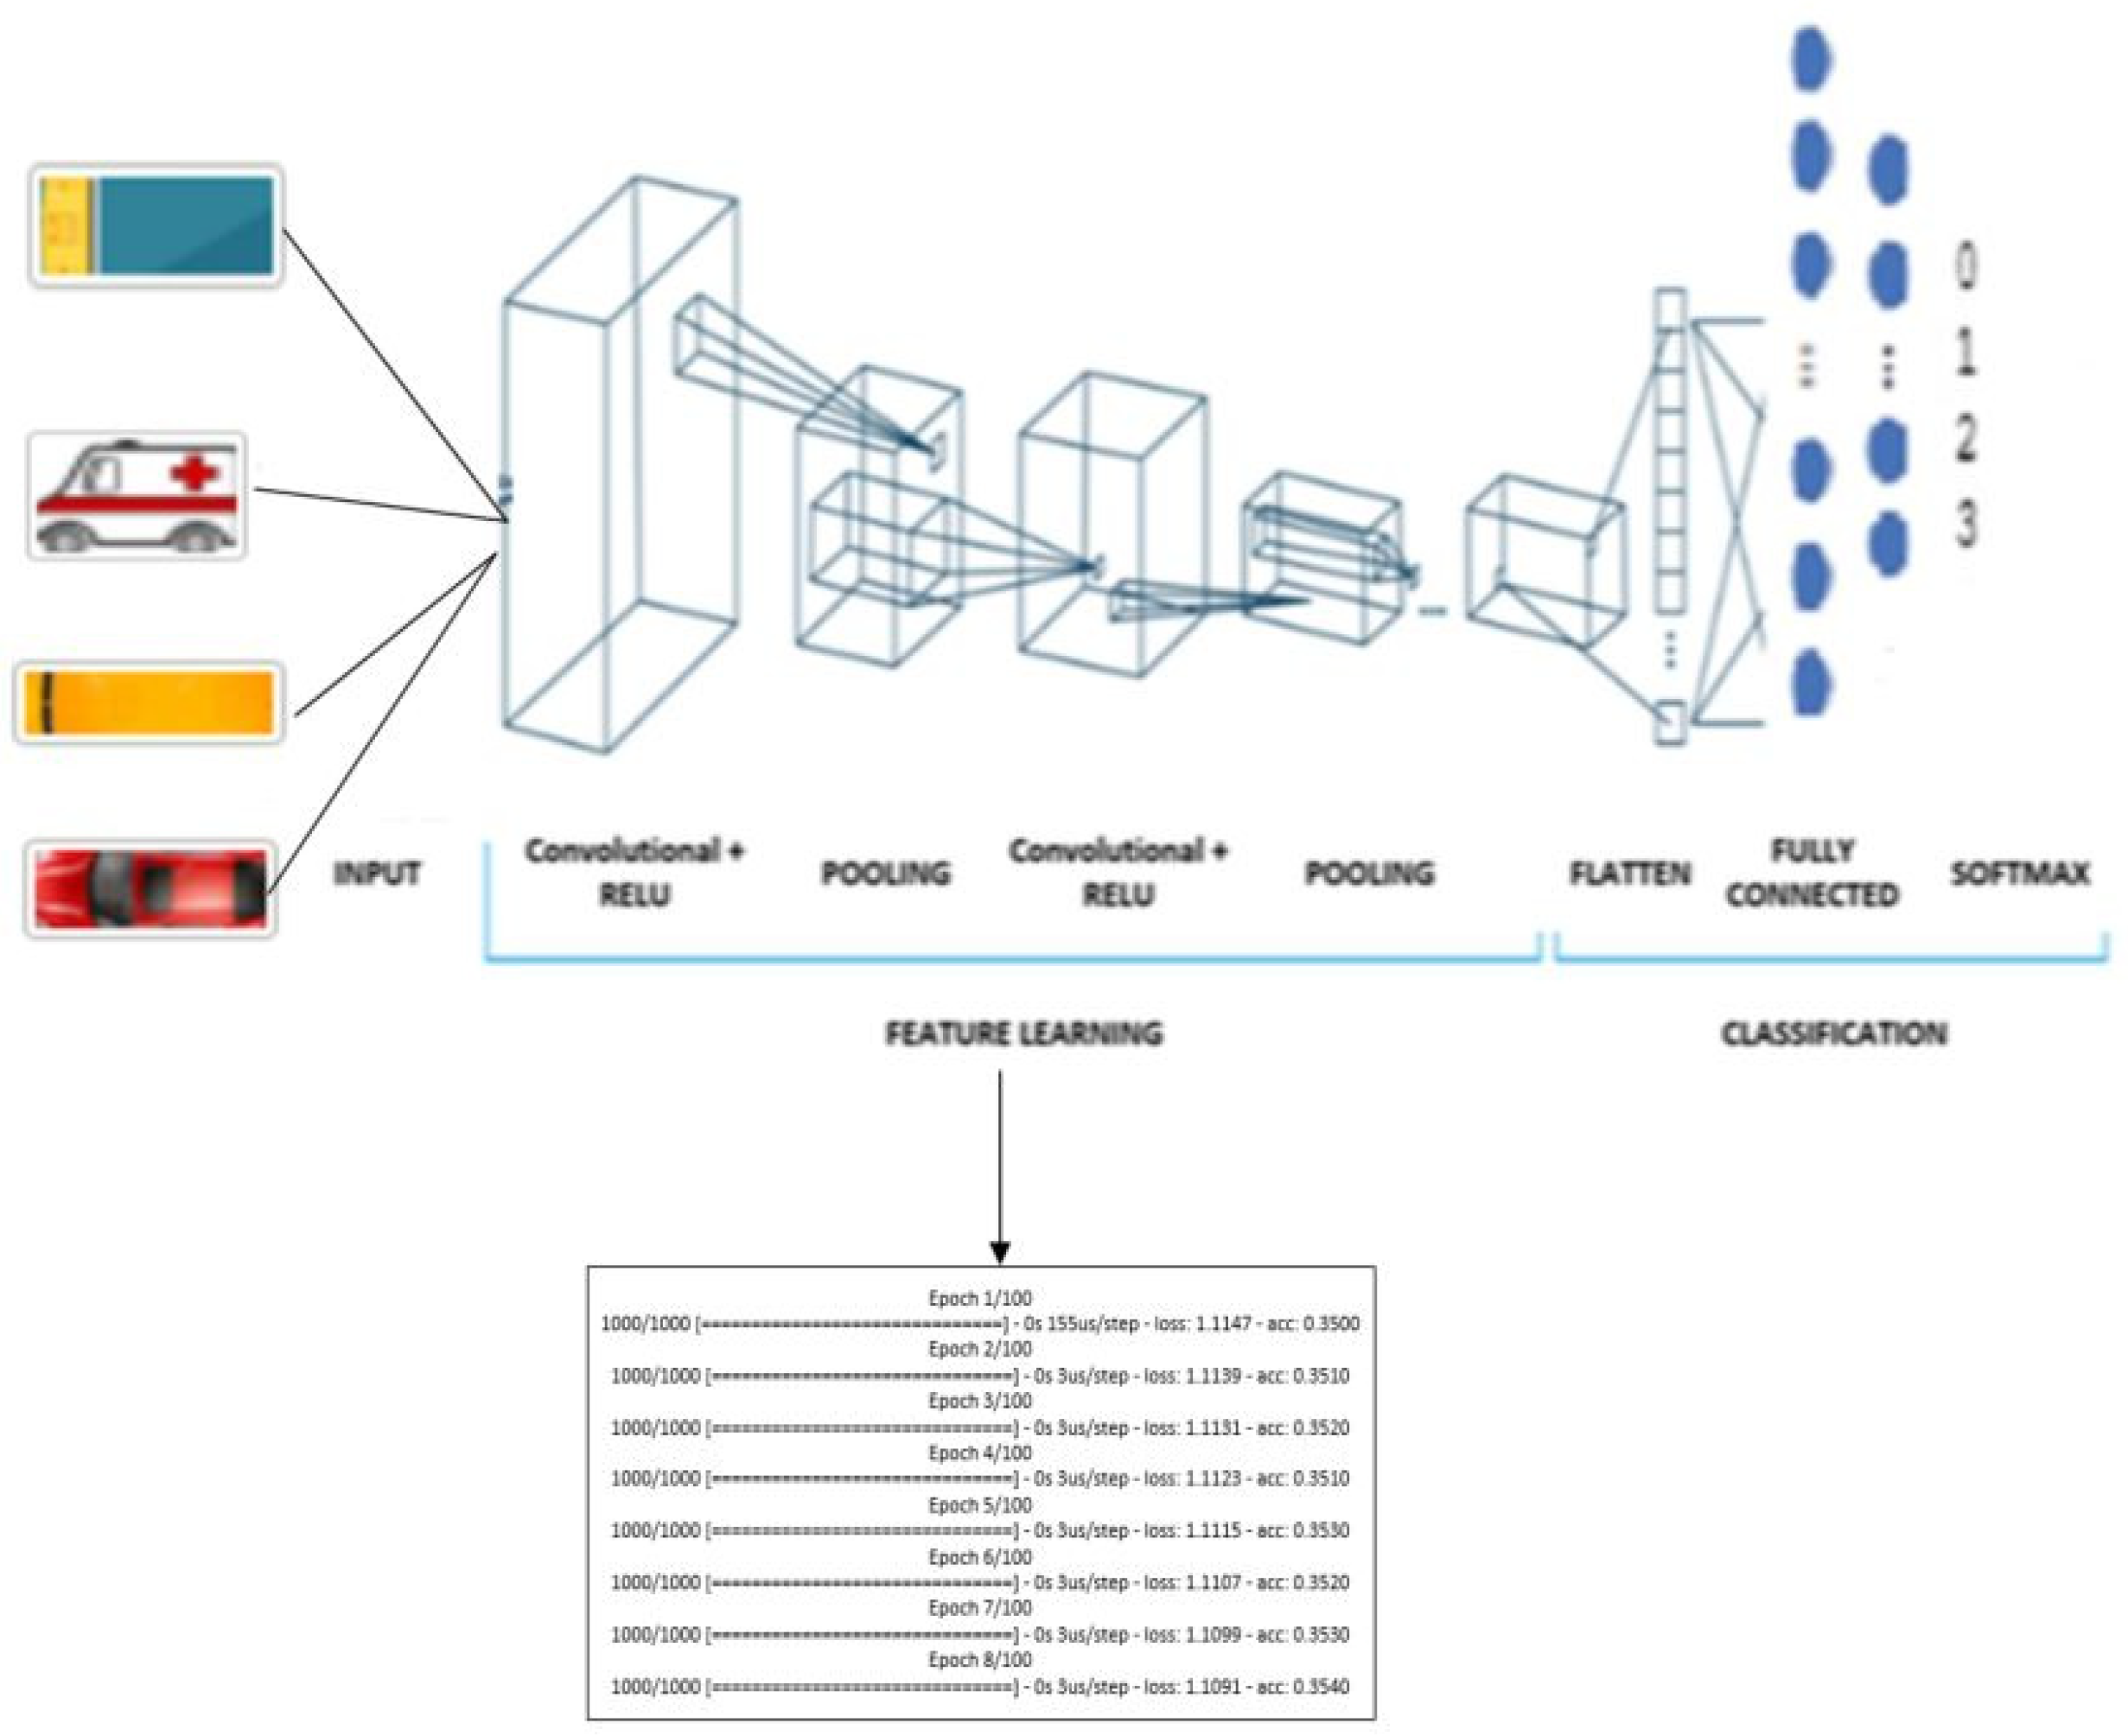
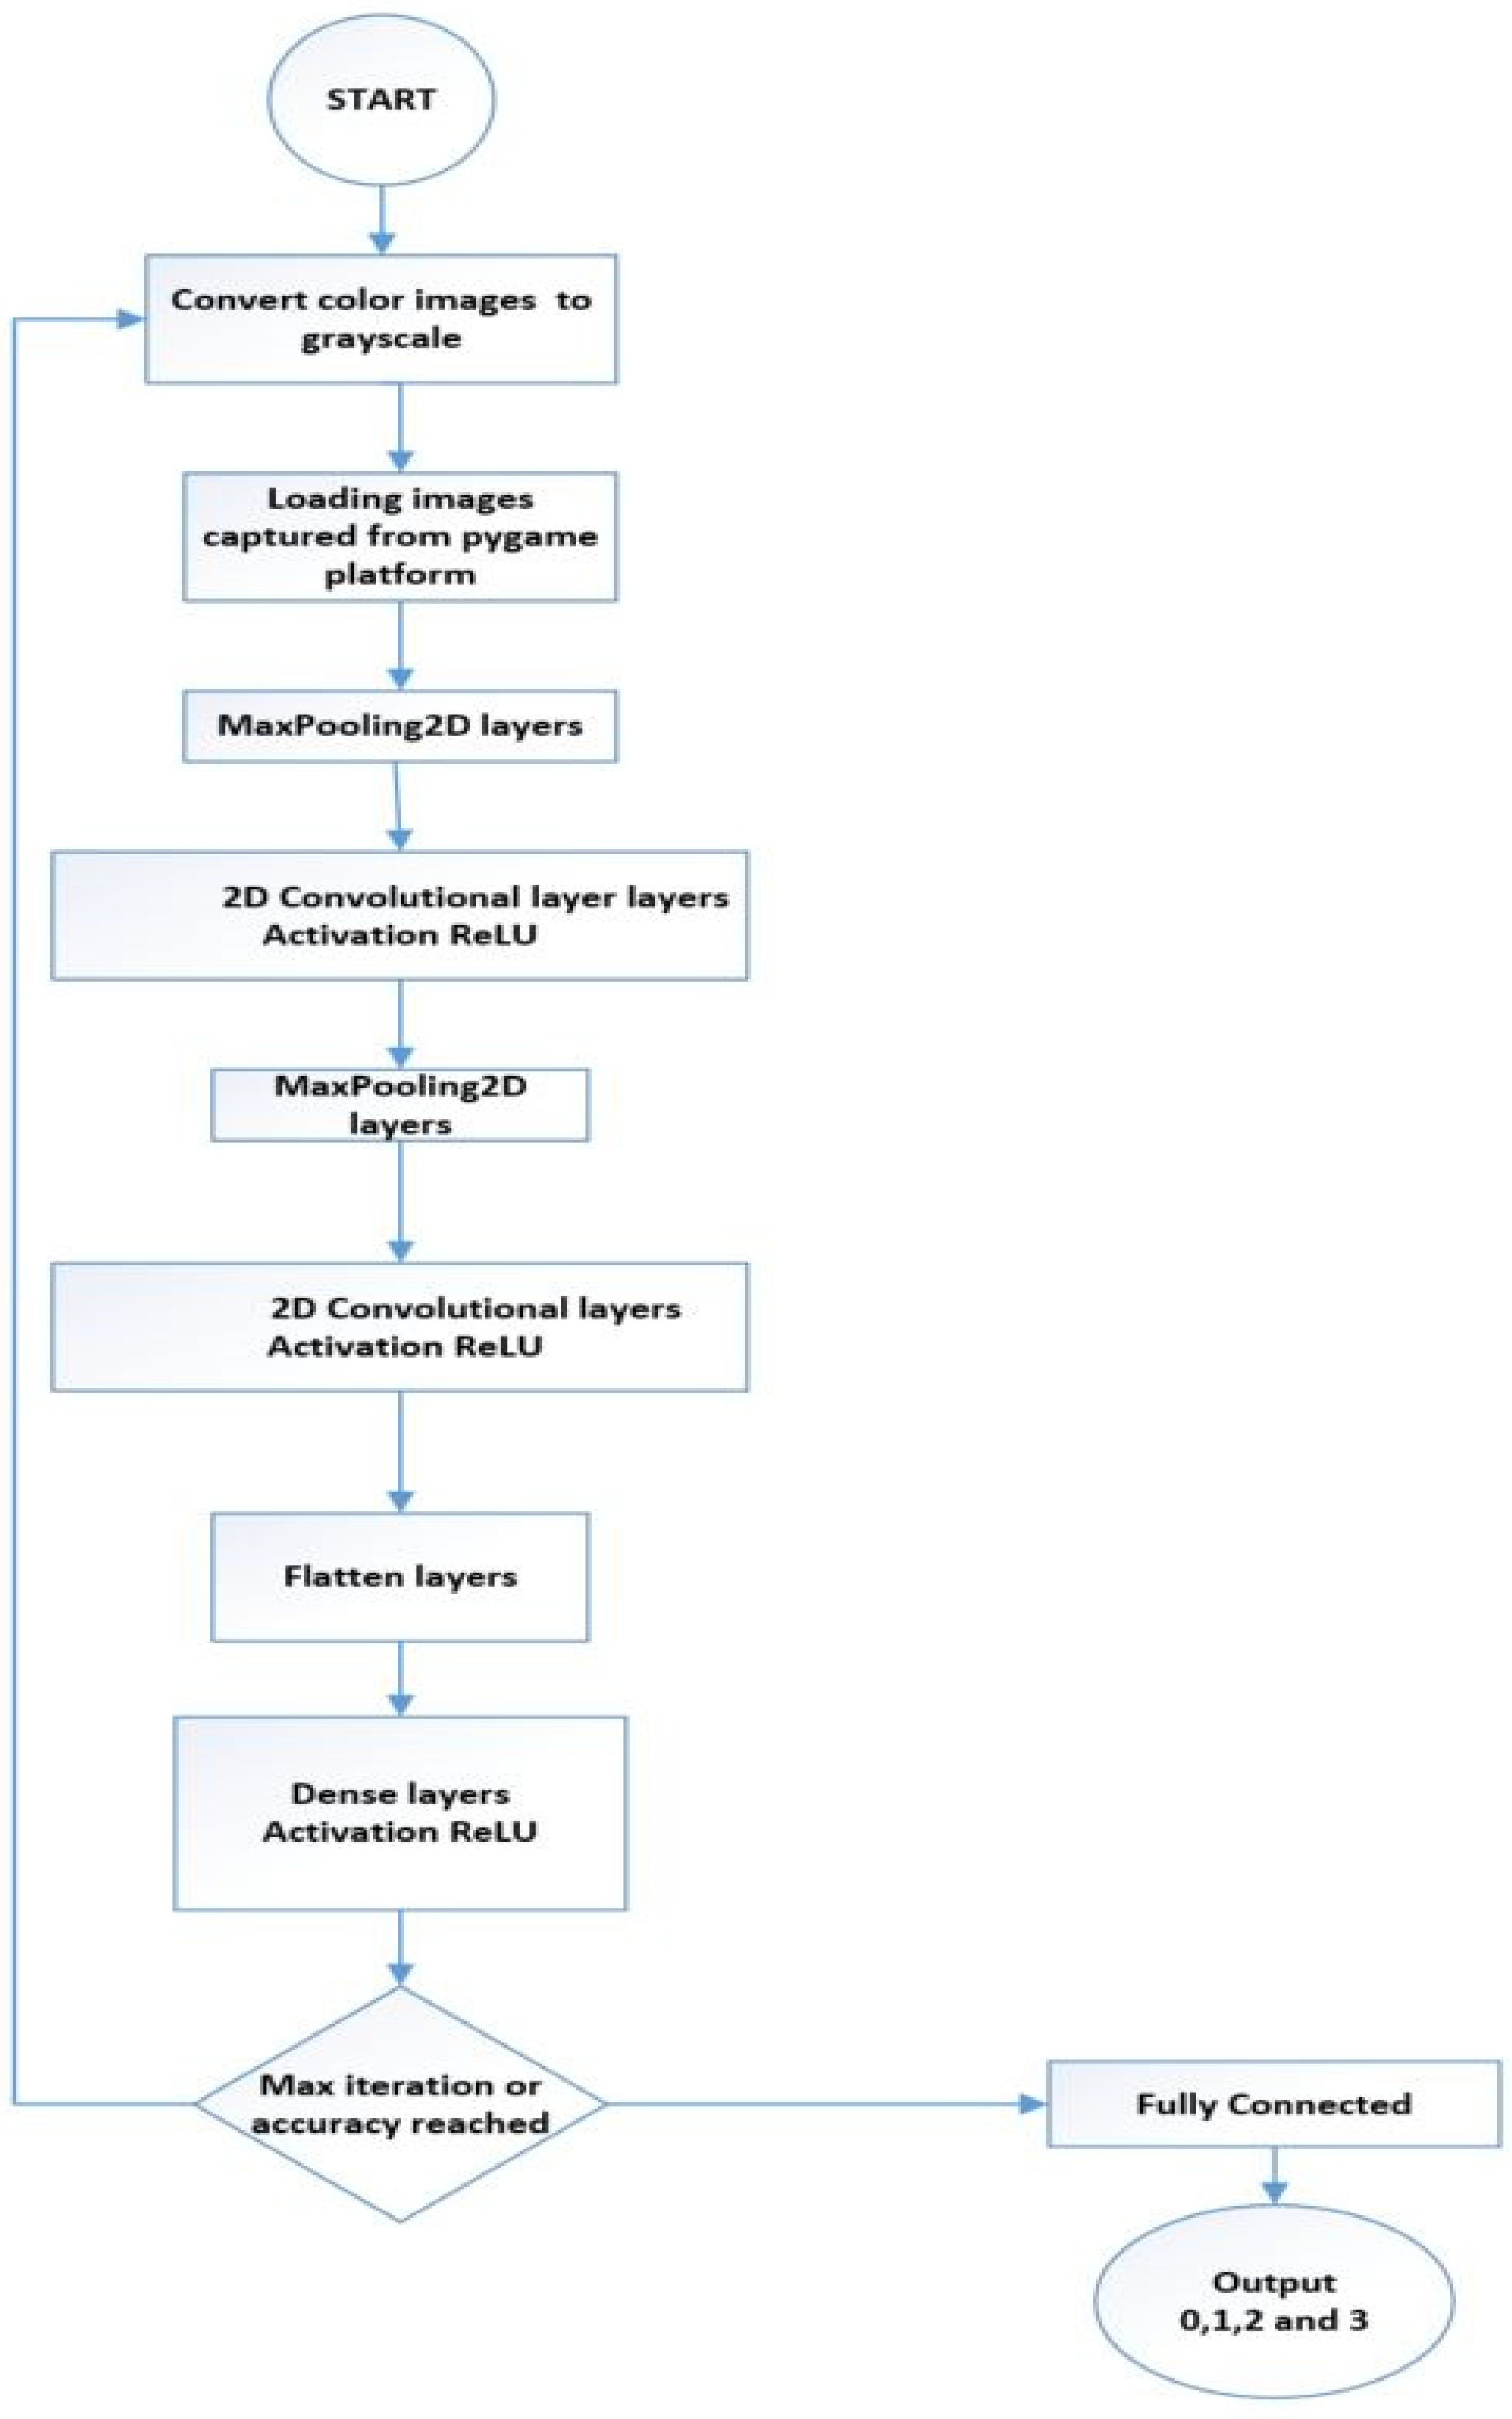
3.2. Emergency Vehicle Preemption Using a 2D-CNN
- Import various python libraries (TensorFlow, Numpy, cv2);
- Make a folder containing the labels for the training and testing datasets;
- Divide the features and labels into sets for testing, validation, and training;
- Prepare the images by applying effects such as grayscale conversion, image augmentation, and dataset normalization;
- Make an image generator so that there are enough images available for use;
- A convolution and a max pooling layer should be added, along with several hidden layers. Depending on the number of features required, flatten and dropout;
- For process optimization, use the ReLU activation function and Adam optimizer;
- The accuracy score of the evaluation metric should be used to assess the neural network’s performance;
- The accuracy score will indicate how well the CNN model operates on the test dataset.
- True positive is denoted by TP and false positive is represented by FP;
- The number of vehicles that were accurately detected is indicated by false negative (FN);
- TGST is the traffic signal time for the green light;
- The string number of automobile group encodes, as decided by the vehicle detection module, the quantity of each kind of vehicle at the signal;
- Average time measures the typical amount of time that it takes a vehicle in that group to cross an intersection;
- The intersection’s lane configuration is the number of lanes.
- Total delay (TD) is the total of all car delays over a certain period measured in seconds;
- Total number of vehicles (N) is the entire count of automobiles that traversed the junction or segment of road during the same duration.
- Vehicle queue length ( is the number of cars in the line at any moment;
- N is the total number of vehicles in the entire simulation.
| Algorithm 1 Vehicle delay |
| Total vehicles = 0 Total loss time = 0 Total queue length = 0 class Automobile: location waiting_time, speed, and waiting_start_time function update(): If position = waiting_location, then waiting_start_time = current_time if waiting_start_time is null. otherwise: if waiting_start_time is not null: wait vehicle movement based on speed start up the cars Set up the simulation’s parameters. As the simulation is running, for every vehicle in the vehicles: vehicle.update() display the state of the simulation the check_simulation_end_condition function If some vehicle has finished, then: total vehicles += 1 total lost time += calculate lost time for completed vehicle() total queue length += calculate queue length for completed vehicle() advance time for simulation Total lost time/total vehicles equals average lost time. Total queue length/total vehicles equals average queue length. |
4. Simulation, Experimental Data, and Results Analyses
4.1. Simulation Tools
4.2. Experimental Data
4.3. Simulation Results and Analysis
- (a)
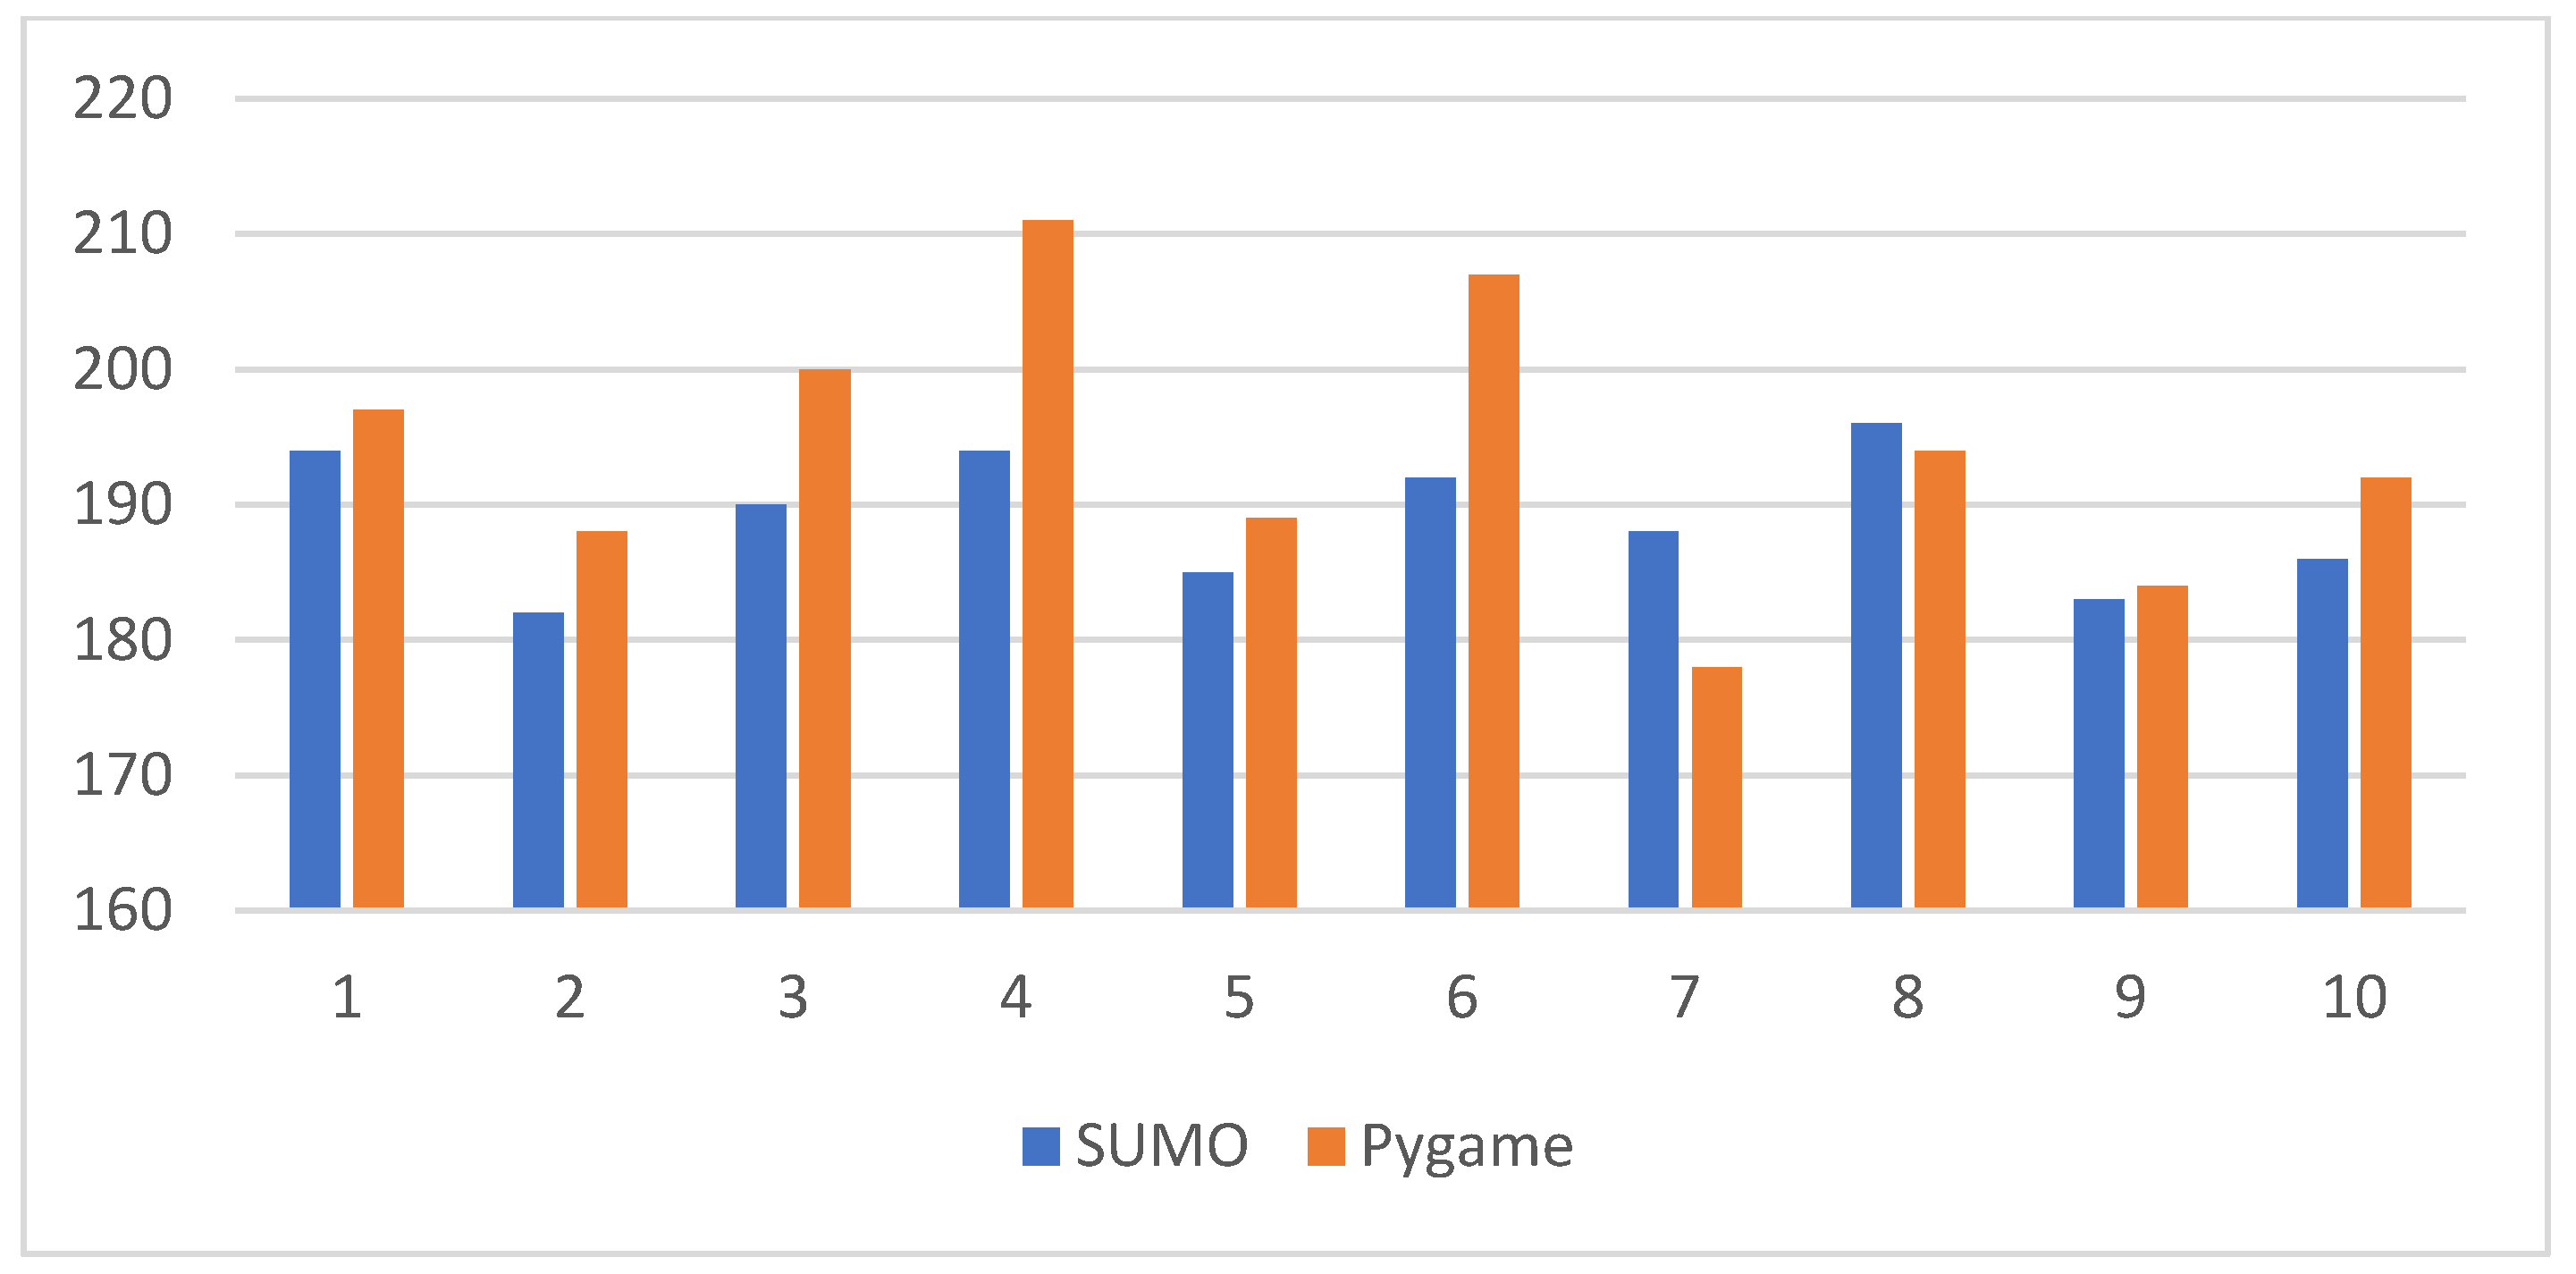
- Simulation using SUMO
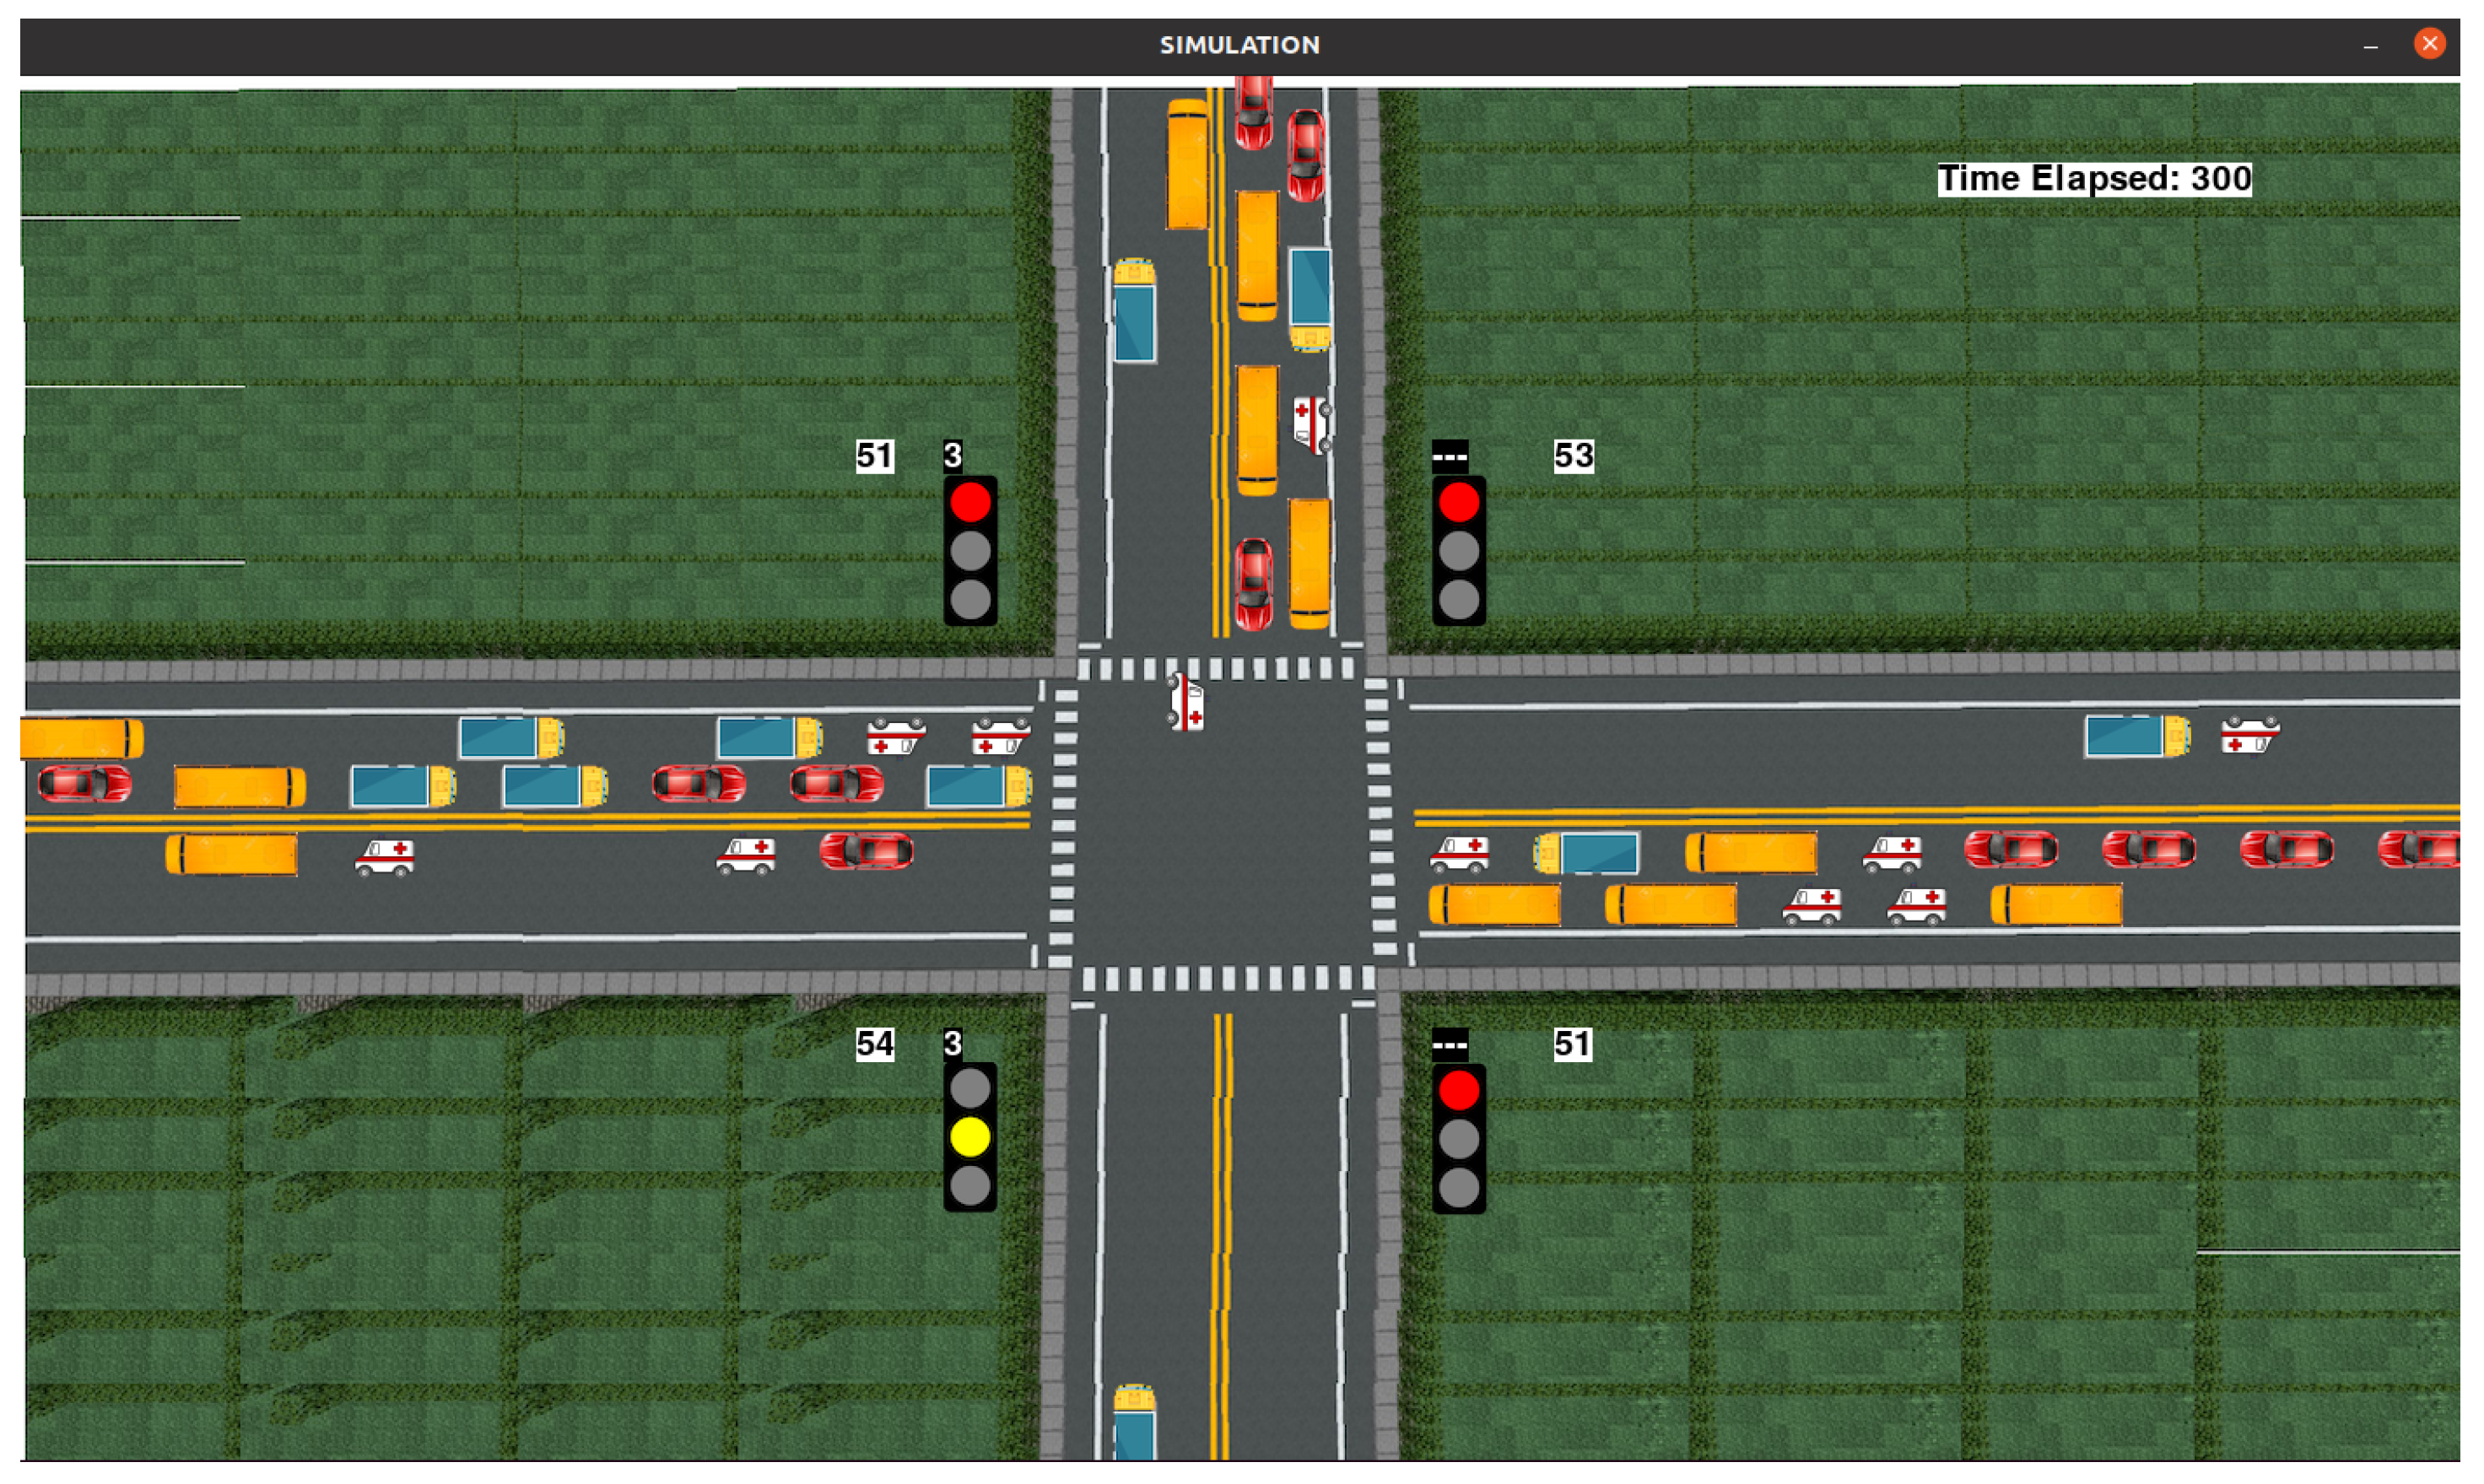
- (b)
- Simulation using Pygame
- (c)
- Results Analysis
5. Conclusions
Author Contributions
Funding
Data Availability Statement
Conflicts of Interest
References
- Deepajothi, S.; Rajan, D.P.; Karthikeyan, P.; Velliangiri, S. Intelligent traffic management for emergency vehicles using convolutional neural network. In Proceedings of the 2021 7th International Conference on Advanced Computing and Communication Systems (ICACCS), Coimbatore, India, 19–20 March 2021; pp. 853–857. [Google Scholar]
- Cristiani, A.L.; Immich, R.; Akabane, A.T.; Madeira, E.R.M.; Villas, L.A.; Meneguette, R.I. Atrip: Architecture for traffic classification based on image processing. Vehicles 2020, 2, 303–317. [Google Scholar] [CrossRef]
- Mall, P.K.; Narayan, V.; Pramanik, S.; Srivastava, S.; Faiz, M.; Sriramulu, S.; Kumar, M.N. FuzzyNet-Based Modelling Smart Traffic System in Smart Cities Using Deep Learning Models. In Handbook of Research on Data-Driven Mathematical Modeling in Smart Cities; IGI Global: Genval, Belgium, 2023; pp. 76–95. [Google Scholar]
- Zhou, B.; Cao, J.; Zeng, X.; Wu, H. Adaptive traffic light control in wireless sensor network-based intelligent transportation system. In Proceedings of the 2010 IEEE 72nd Vehicular Technology Conference-Fall, Ottawa, ON, Canada, 6–9 September 2010; pp. 1–5. [Google Scholar]
- Cano, M.-D.; Sanchez-Iborra, R.; Freire-Viteri, B.; Garcia-Sanchez, A.-J.; Garcia-Sanchez, F.; Garcia-Haro, J. A self-adaptive approach for traffic lights control in an urban network. In Proceedings of the 2017 19th International Conference on Transparent Optical Networks (ICTON), Girona, Spain, 2–6 July 2017; pp. 1–4. [Google Scholar]
- Zavala, B.; Alférez, G.H. Proactive control of traffic in smart cities. In Proceedings of the International Conference on Artificial Intelligence (ICAI), Las Vegas, NV, USA, 27–30 July 2015; p. 604. [Google Scholar]
- Guerrero-Ibáñez, J.; Zeadally, S.; Contreras-Castillo, J. Sensor technologies for intelligent transportation systems. Sensors 2018, 18, 1212. [Google Scholar] [CrossRef] [PubMed]
- Ahmed, F.; Hawas, Y. An integrated real-time traffic signal system for transit signal priority, incident detection and congestion management. Transp. Res. Part C Emerg. Technol. 2015, 60, 52–76. [Google Scholar] [CrossRef]
- Kareem, D.M. Coverage in Wireless Sensor Networks. Master’s Thesis, Çankaya University, Çankaya, Turkey, 2015. [Google Scholar]
- bin Che Mansor, M.A.H.; Kamal, N.A.M.; bin Baharom, M.H.; bin Zainol, M.A. Emergency Vehicle Type Classification using Convolutional Neural Network. In Proceedings of the 2021 IEEE International Conference on Automatic Control & Intelligent Systems (I2CACIS), Shah Alam, Malaysia, 26 June 2021; pp. 126–129. [Google Scholar]
- Chen, L.; Li, S.; Bai, Q.; Yang, J.; Jiang, S.; Miao, Y. Review of image classification algorithms based on convolutional neural networks. Remote Sens. 2021, 13, 4712. [Google Scholar] [CrossRef]
- Survarachakan, S.; Pelanis, E.; Khan, Z.A.; Kumar, R.P.; Edwin, B.; Lindseth, F. Effects of enhancement on deep learning based hepatic vessel segmentation. Electronics 2021, 10, 1165. [Google Scholar] [CrossRef]
- Rajasekar, T.; Mohanraj, P.; Abishek, R.; Haries, M. Adaptive Traffic Congestion Control Approach with Emergency Vehicle Protocol. In Proceedings of the 2023 8th International Conference on Communication and Electronics Systems (ICCES), Coimbatore, India, 1–3 June 2023; pp. 613–620. [Google Scholar]
- Pamula, T. Road traffic conditions classification based on multilevel filtering of image content using convolutional neural networks. IEEE Intell. Transp. Syst. Mag. 2018, 10, 11–21. [Google Scholar] [CrossRef]
- Li, Z.; Liu, F.; Yang, W.; Peng, S.; Zhou, J. A survey of convolutional neural networks: Analysis, applications, and prospects. IEEE Trans. Neural Netw. Learn. Syst. 2021, 33, 6999–7019. [Google Scholar] [CrossRef] [PubMed]
- Sun, X.; Lin, K.; Jiao, P.; Lu, H. Signal timing optimization model based on bus priority. Information 2020, 11, 325. [Google Scholar] [CrossRef]
- Jia, X.; Sun, C. Research on Intelligent Monitoring Technology of Traffic Flow Based on Computer Vision. In Proceedings of the 2023 IEEE International Conference on Sensors, Electronics and Computer Engineering (ICSECE), Jinzhou, China, 18–20 August 2023; pp. 557–561. [Google Scholar]
- Yogheshwaran, M.; Praveenkumar, D.; Pravin, S.; Manikandan, P.; Saravanan, D.S. IoT based intelligent traffic control system. Int. J. Eng. Technol. Res. Manag. 2020, 4, 59–63. [Google Scholar]
- Aggarwal, S.; Bali, R.S. A vehicular dynamics based technique for efficient traffic management. In Proceedings of the 2015 International Conference on Advances in Computing, Communications and Informatics (ICACCI), Kochi, India, 10–13 August 2015; pp. 2133–2138. [Google Scholar]
- Cheng, J.; Wu, W.; Cao, J.; Li, K. Fuzzy group-based intersection control via vehicular networks for smart transportations. IEEE Trans. Ind. Inform. 2016, 13, 751–758. [Google Scholar] [CrossRef]
- Rashid, H.; Ashrafi, M.J.F.; Azizi, M.; Heydarinezhad, M.R. Intelligent traffic light control based on clustering using vehicular ad-hoc networks. In Proceedings of the 2015 7th Conference on Information and Knowledge Technology (IKT), Urmia, Iran, 26–28 May 2015; pp. 1–6. [Google Scholar]
- Younes, M.B.; Boukerche, A. Intelligent traffic light controlling algorithms using vehicular networks. IEEE Trans. Veh. Technol. 2015, 65, 5887–5899. [Google Scholar] [CrossRef]
- Guo, Q.; Li, L.; Ban, X.J. Urban traffic signal control with connected and automated vehicles: A survey. Transp. Res. Part C Emerg. Technol. 2019, 101, 313–334. [Google Scholar] [CrossRef]
- Rosayyan, P.; Paul, J.; Subramaniam, S.; Ganesan, S.I. An optimal control strategy for emergency vehicle priority system in smart cities using edge computing and IOT sensors. Meas. Sens. 2023, 26, 100697. [Google Scholar] [CrossRef]
- Nellore, K.; Hancke, G.P. Traffic management for emergency vehicle priority based on visual sensing. Sensors 2016, 16, 1892. [Google Scholar] [CrossRef] [PubMed]
- Kavitha, Y.; Satyanarayana, P.; Mirza, S.S. Sensor based traffic signal pre-emption for emergency vehicles using efficient short-range communication network. Meas. Sens. 2023, 28, 100830. [Google Scholar] [CrossRef]
- Chung, J.; Kim, G.; Sohn, K. Transferability of a Convolutional Neural Network (CNN) to Measure Traffic Density. Electronics 2021, 10, 1189. [Google Scholar] [CrossRef]
- Mandal, V.; Mussah, A.R.; Jin, P.; Adu-Gyamfi, Y. Artificial intelligence-enabled traffic monitoring system. Sustainability 2020, 12, 9177. [Google Scholar] [CrossRef]
- Luo, H.; Yang, Y.; Tong, B.; Wu, F.; Fan, B. Traffic sign recognition using a multi-task convolutional neural network. IEEE Trans. Intell. Transp. Syst. 2017, 19, 1100–1111. [Google Scholar] [CrossRef]
- Li, Q.; Peng, Z.; Feng, L.; Duan, C.; Mo, W.; Zhou, B. ScenarioNet: Open-Source Platform for Large-Scale Traffic Scenario Simulation and Modeling. arXiv 2023, arXiv:2306.12241. [Google Scholar]


| Reference Number | Methodology | Main Contribution | Limitations |
|---|---|---|---|
| [16] | A signal timing optimization model based on bus priority. | The classic approach to a signal timing optimization problem was combined with the idea of bus priority. A new methodology that specifically considered passenger delay during the signal timing optimization process was presented as a solution to this issue. | The traffic data collected in a fixed period, such as peak time, is the only factor considered by the optimization model when updating the signal timing scheme. This may not be feasible for traffic data collected in near real-time. |
| [17] | Intelligent monitoring technology of traffic flow based on computer vision. | The method uses vehicle identification and localization to provide real-time, accurate, and robust traffic flow data collection on road segments. | The technique needs to be improved in terms of processing data collected on the road segments, and it is limited when it comes to high-resolution images. |
| [13] | An adaptive traffic congestion control approach with emergency vehicle protocol. | To allow for minimal traffic congestion, the divider is adjusted in accordance with the number of vehicles on the road. When there is traffic congestion, it is challenging to move when an ambulance is passing on the road. Using an RFID reader and an RFID tag, this concept avoids this issue. | The system counts the number of cars and recognizes an ambulance using image processing techniques. Machine learning algorithms may be used in the future to monitor different kinds of emergency vehicles, such as police cars and fire trucks, and to increase the accuracy of vehicle identification. |
| [18] | An IOT-based traffic controlling system. | A suggested technique for priority-based vehicle identification makes use of techniques from the picture processing industry. If an emergency vehicle is identified, that lane will take precedence over all other lanes. | The vehicle count mechanism that would prioritize other lanes with heavier traffic in addition to emergency vehicles is absent from the proposed system. |
| [10] | Emergency vehicle type classification using a convolutional neural network. | The pre-trained model in this work, VGG-16, had a smaller convolutional layer and filter size. The experiment yielded a 95% accuracy rate for the suggested method. | The module may have learned from the color of the feature and needs some tweaks because it recognizes a typical red car as a firetruck and a white car as a police car. |
| A bidirectional vehicle platooning-based intelligent transportation system. | This work proposes an intelligent transportation system that can monitor nearby vehicles and signals to monitor other vehicles to prevent accidents and shorten wait times at busy intersections by giving drivers access to pertinent data. | The proposed methodology does not have intelligence in controlling the traffic lights, and no emergency vehicles are given priority at the intersection. |
| Vehicle Type | Vehicle Groups | Average Speed |
|---|---|---|
| 0 | car | 2.25 m/s |
| 1 | bus | 1.8 m/s |
| 2 | truck | 1.8 m/s |
| 3 | ambulance | 2.5 m/s |
| Number | Architecture Details |
|---|---|
| 1 | Input image size (640, 480) |
| 2 | Total number of layers: 2 Total MaxPooling2D layers used: 2 Total fully connected layers used: 3 Activation layers: 4 Dropout layer: 2 |
| 3 | Kernal size at each Conv2D layer: 3 × 3 |
| 4 | Pool size at each maxPooling2D layer: (2,2) |
| 5 | Output class labels: 3 |
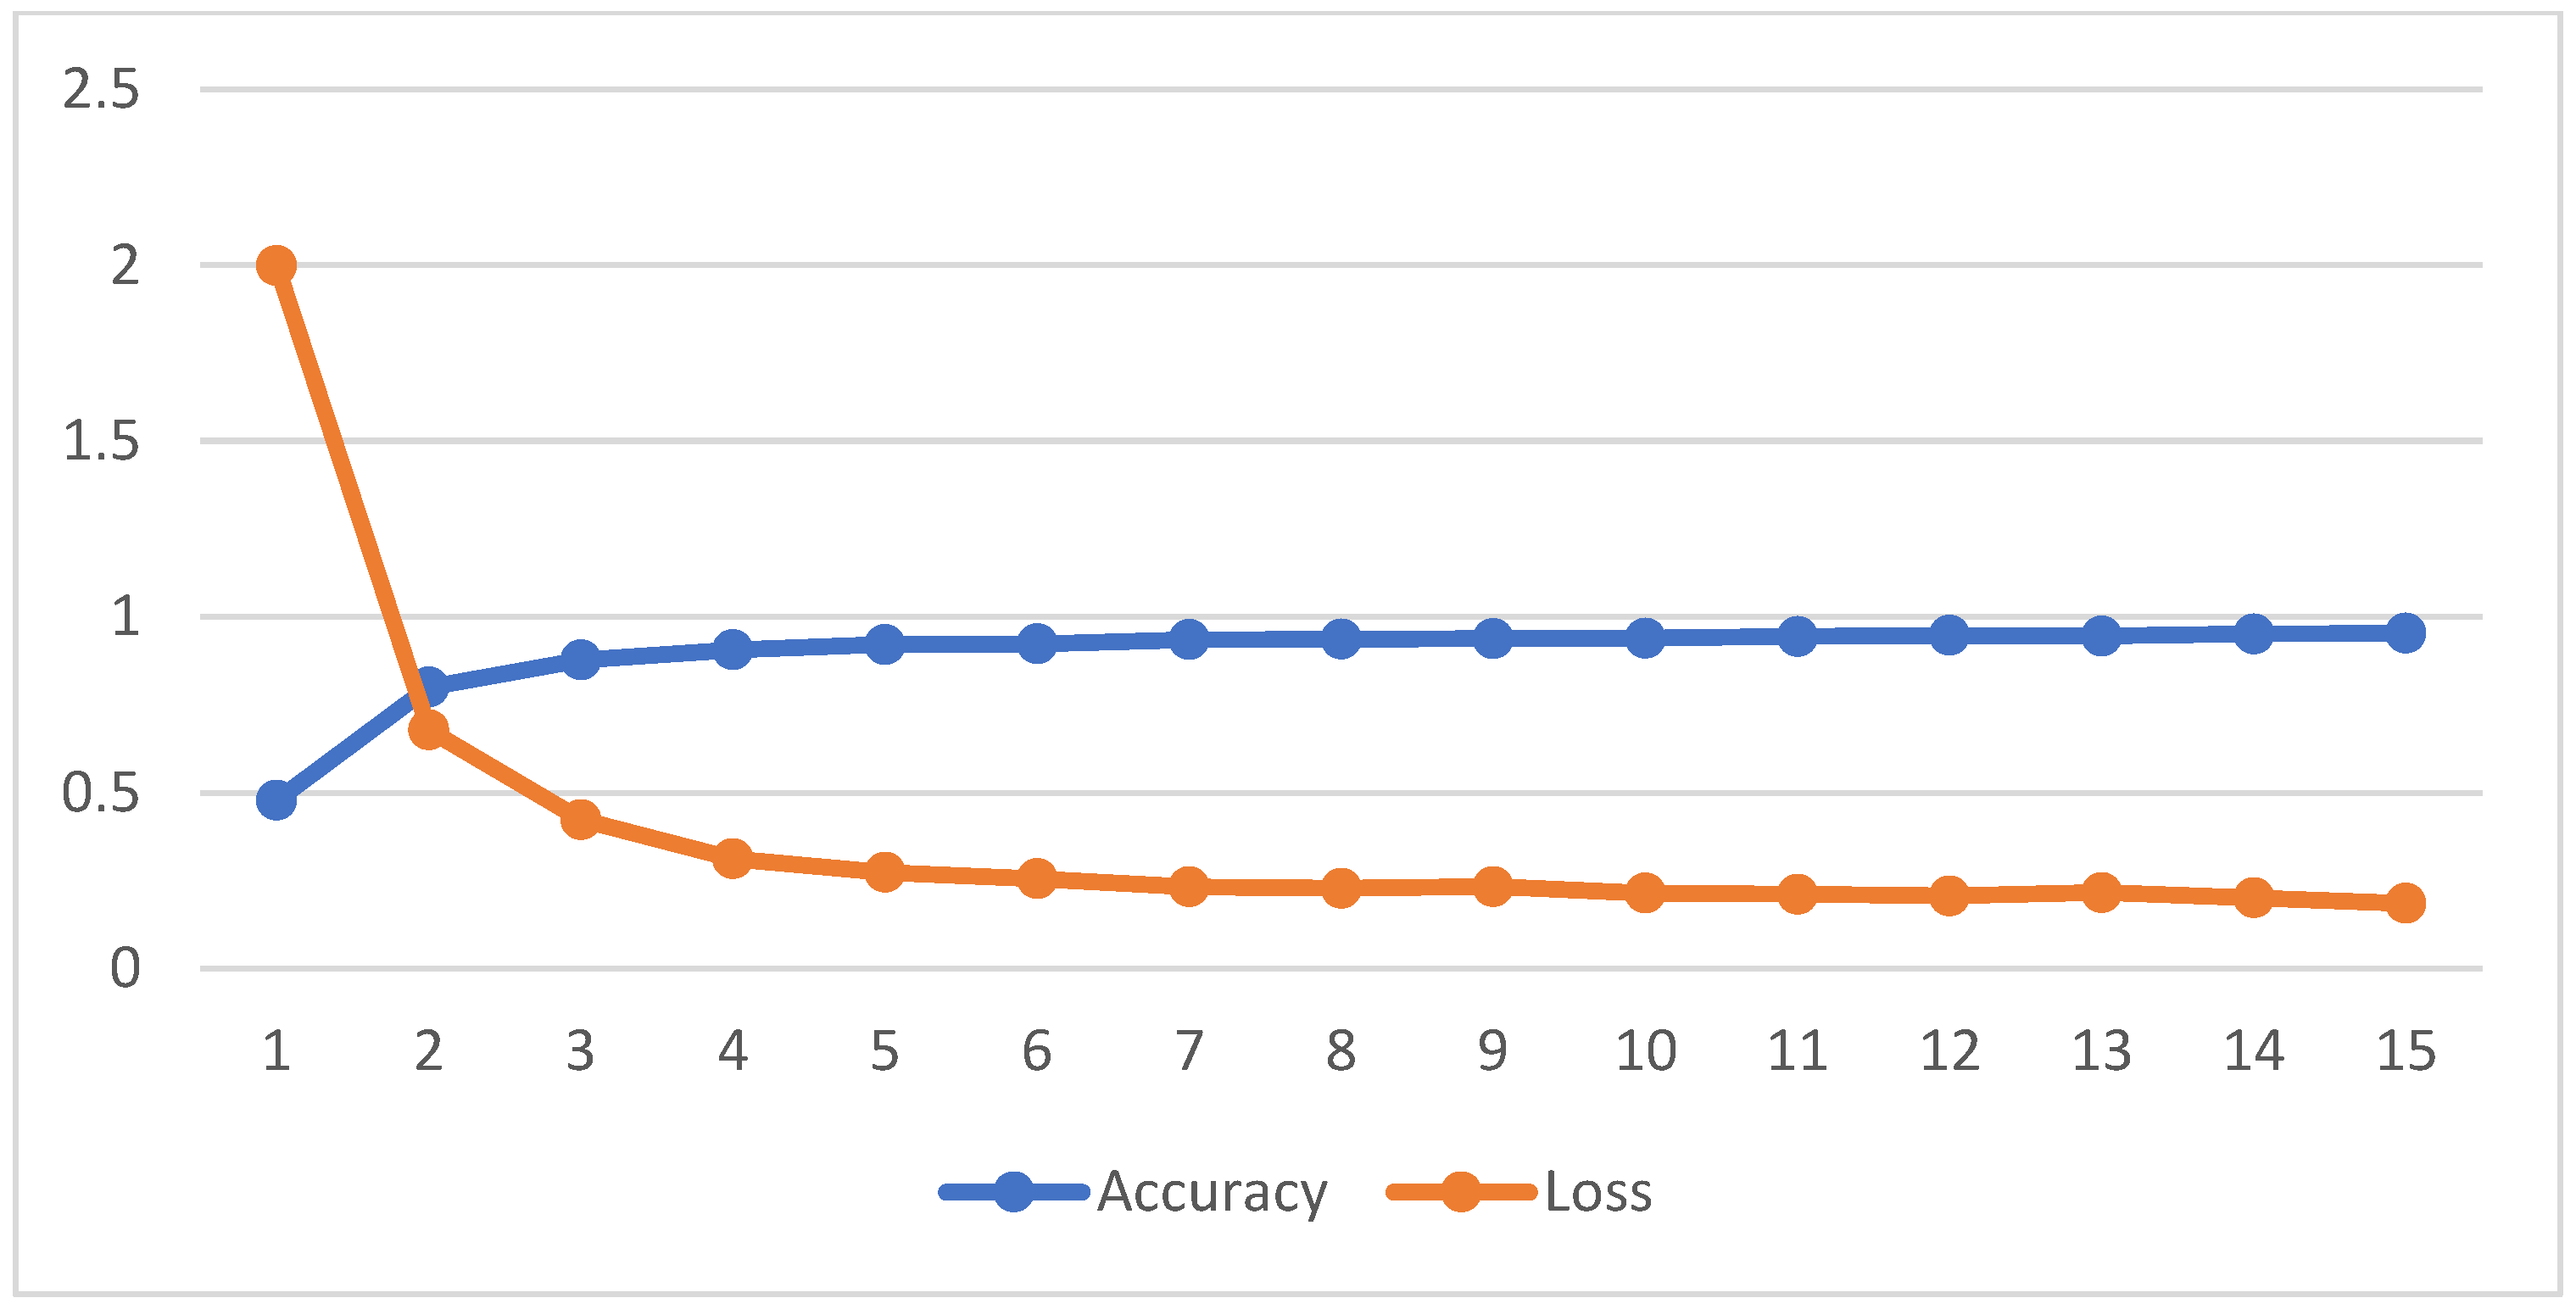
| Epoch | Time Taken(s) | Accuracy | Loss |
|---|---|---|---|
| 1 | 11 | 0.478 | 1.998 |
| 2 | 9 | 0.800 | 0.678 |
| 3 | 10 | 0.877 | 0.423 |
| 4 | 11 | 0.906 | 0.312 |
| 5 | 11 | 0.921 | 0.273 |
| 6 | 10 | 0.923 | 0.255 |
| 7 | 11 | 0.935 | 0.232 |
| 8 | 12 | 0.936 | 0.228 |
| 9 | 11 | 0.938 | 0.233 |
| 10 | 9 | 0.939 | 0.214 |
| 11 | 11 | 0.944 | 0.211 |
| 12 | 11 | 0.947 | 0.206 |
| 13 | 9 | 0.945 | 0.216 |
| 14 | 11 | 0.951 | 0.201 |
| 15 | 10 | 0.953 | 0.186 |
| Number | Direction 1 | Direction 2 | Direction 3 | Direction 4 | Total |
|---|---|---|---|---|---|
| 1 | 48 | 46 | 43 | 57 | 194 |
| 2 | 43 | 43 | 51 | 45 | 182 |
| 3 | 44 | 51 | 45 | 50 | 190 |
| 4 | 52 | 50 | 55 | 37 | 194 |
| 5 | 43 | 47 | 51 | 44 | 185 |
| 6 | 50 | 54 | 38 | 50 | 192 |
| 7 | 54 | 61 | 38 | 35 | 188 |
| 8 | 42 | 48 | 55 | 51 | 196 |
| 9 | 48 | 41 | 51 | 43 | 183 |
| 10 | 53 | 49 | 43 | 41 | 186 |
| Number | Direction 1 | Direction 2 | Direction 3 | Direction 4 | Total |
|---|---|---|---|---|---|
| 1 | 55 | 57 | 42 | 43 | 197 |
| 2 | 43 | 43 | 57 | 45 | 188 |
| 3 | 49 | 51 | 45 | 55 | 200 |
| 4 | 55 | 53 | 56 | 47 | 211 |
| 5 | 43 | 47 | 51 | 48 | 189 |
| 6 | 46 | 54 | 53 | 54 | 207 |
| 7 | 44 | 61 | 40 | 33 | 178 |
| 8 | 42 | 46 | 55 | 51 | 194 |
| 9 | 48 | 41 | 51 | 44 | 184 |
| 10 | 58 | 50 | 43 | 41 | 192 |
Disclaimer/Publisher’s Note: The statements, opinions and data contained in all publications are solely those of the individual author(s) and contributor(s) and not of MDPI and/or the editor(s). MDPI and/or the editor(s) disclaim responsibility for any injury to people or property resulting from any ideas, methods, instructions or products referred to in the content. |
© 2023 by the authors. Licensee MDPI, Basel, Switzerland. This article is an open access article distributed under the terms and conditions of the Creative Commons Attribution (CC BY) license (https://creativecommons.org/licenses/by/4.0/).
Share and Cite
Mathiane, M.J.; Tu, C.; Adewale, P.; Nawej, M. A Vehicle Density Estimation Traffic Light Control System Using a Two-Dimensional Convolution Neural Network. Vehicles 2023, 5, 1844-1862. https://doi.org/10.3390/vehicles5040099
Mathiane MJ, Tu C, Adewale P, Nawej M. A Vehicle Density Estimation Traffic Light Control System Using a Two-Dimensional Convolution Neural Network. Vehicles. 2023; 5(4):1844-1862. https://doi.org/10.3390/vehicles5040099
Chicago/Turabian StyleMathiane, Malose John, Chunling Tu, Pius Adewale, and Mukatshung Nawej. 2023. "A Vehicle Density Estimation Traffic Light Control System Using a Two-Dimensional Convolution Neural Network" Vehicles 5, no. 4: 1844-1862. https://doi.org/10.3390/vehicles5040099
APA StyleMathiane, M. J., Tu, C., Adewale, P., & Nawej, M. (2023). A Vehicle Density Estimation Traffic Light Control System Using a Two-Dimensional Convolution Neural Network. Vehicles, 5(4), 1844-1862. https://doi.org/10.3390/vehicles5040099