Abstract
This paper proposes a combined system (OPREVU-AES) that integrates optimized AEB and Automatic Emergency Steering (AES) to generate evasive maneuvers, and it provides an assessment of its effectiveness when compared to a commercial AEB system. The optimized AEB system regulates the braking response through a collision prediction model. OPREVU is a research project in which INSIA-UPM and CEDINT-UPM cooperate to improve driving assistance systems and to characterize pedestrians’ behavior through virtual reality (VR) techniques. The kinematic and dynamic analysis of OPREVU-AES is conducted using CarSim© software v2020.1. The avoidance trajectories are predefined for speeds above 40 km/h, which controls the speed and lateral stability during the overtaking and lane re-entry process. In addition, the decision algorithm integrates information from the lane and the blind spot detectors. The effectiveness evaluation is based on the reconstruction of a sample of vehicle-to-pedestrian crashes (INSIA-UPM database), using PCCrash© software v. 2013, and it considers the probability of head injury severity (ISP) as an indicator. The incorporation of AEB can avoid 53.8% of accidents, with an additional 2.5–3.5% avoided by incorporating automatic steering. By increasing the lateral activation range, the total avoidance rate is increased to 61.8–69.8%. The average ISP reduction is 65%, with significant reductions achieved in most cases where avoidance is not possible.
1. Introduction
At present, with the aim of increasing road safety and ensuring an effective vehicle response when a hazardous situation occurs, Autonomous Emergency Braking (AEB) systems are being designed to detect potential collisions and activate the brakes to help prevent or mitigate the impact and thereby reduce the severity of the damage as much as possible. These systems consist of a fusion sensor, which combines the performance of a camera with radar and/or Laser Imaging Detection and Ranging (LIDAR) devices.
Ongoing research aims to improve both pedestrian behavior identification algorithms and safe avoidance maneuvers [1]. Some authors point to possible areas where AEB systems can be automized, such as in the regulation of the autonomous braking response by controlling the deceleration curve and the maximum steady-state pressure value as a function of the pedestrian’s speed [2].
The characterization of pedestrian behavior has been studied from the perspective of the prediction of a pedestrian’s trajectory and reaction type, using Kalman filters for image analysis [3], while other authors focus on the development of Markov decision process (MDP) models to enhance emergency braking systems and autonomous vehicles [4]. The Histogram of Oriented Gradient (HOG) detection method, which is used to recognize pedestrians’ limb motions, is also proposed for accident avoidance [5]. This procedure allows for image processing and enables the detection of objects through their appearance and shape.
When traffic speeds are high, the braking distance may not be sufficient; so, new collision avoidance maneuvers are contemplated for the development of Advanced Driver Assistance Systems (ADASs) embedded in new-generation vehicles. Notably, the Automatic Emergency Steering (AES) system is placed within the Euro NCAP 2025 roadmap for primary safety [6].
The integration of an autonomous avoidance system with an AEB system has been studied for the avoidance of near-miss collisions between two vehicles. The combination of both ADASs was tested in both simulations and real tests, incorporating a predictive trajectory system, an autonomous electro-hydraulic braking system, and an emergency avoidance system with active front steering [7].
Evasive maneuvers at high speeds require sufficient space and the calculation of intervention points in the decision-making algorithm, which implies a constant calculation of times and distances. Trajectory planning can involve the integration of a steering feedforward and feedback controller for evasive maneuvers [8]. This approach is similar to the design of optimal passing maneuvers involving the parameterization of geometric and dynamic constants and maneuver end conditions [9].
This survey focuses on the avoidance of pedestrian accidents. The design of the avoidance system can revolve around mapping a trajectory with a fuzzy-like control over the steering wheel [10]. Furthermore, the combination of the AEB system and the evasive steering system was studied in [11], where its decision-making was tested below 50 km/h in different scenarios involving potential collision situations.
In order to obtain a broader and more realistic understanding of pedestrian crossing behavior, the use of VR techniques was included in this proposal. Recent articles have investigated the applicability of VR technology in the study of the safety and risk perceptions of pedestrians when crossing in different virtual environments with different roads [12]. Additionally, it was concluded that the deployment of VR-controlled environments was valid for the study of pedestrian behavior, since the walking speeds were congruent with the average speed of pedestrians crossing in the real world, and the sense of immersion and usability denoted the practicality of this methodology [13].
Through the study of pedestrian–vehicle interactions, some authors estimated critical zones by calculating collision probability based on the relative lateral and longitudinal distance [14]. Evaluating pedestrians’ whole-body kinematics when reacting in potential collision situations allows for the characterization of user behavior and generates avoidance patterns for cases of backward and forward motion.
For the implementation of such improvements, the effectiveness of new systems in reducing injuries to vulnerable road users should be evaluated prior to their market release [15]. The effectiveness measurement indicator used in this paper is the Injury Severity Probability (ISP), which estimates the probability of injury to the pedestrian’s head as a function of the collision speed and the impact area of the head on the frontal area of the vehicle [16,17].
The OPREVU project aims to optimize systems for identifying vulnerable users by characterizing their behavior in potential pedestrian collision situations in urban environments using VR techniques. One of the main outputs was the development of machine learning techniques to predict collisions based on pedestrians’ kinematics, attention level, and visual perception [18]. The incorporation of an adaptation of this predictive model into a commercial AEB system is proposed in this paper, in addition to the integration of the AES system. This combination of the optimized AEB system and AES is called OPREVU-AES; it is capable of regulating the braking response at low speeds and generating an automatic evasive maneuver for high speeds in conditions of maximum safety and stability when the distance required to execute full braking pressure means that the accident cannot be avoided.
Likewise, this research compares the effectiveness of OPREVU-AES with that of a commercial AEB system. Furthermore, a comparative study of collision speed and ISP reduction is conducted for three scenarios: a vehicle without ADAS, a vehicle with an AEB system, and a vehicle with OPREVU-AES.
2. Materials and Methods
2.1. Methodology
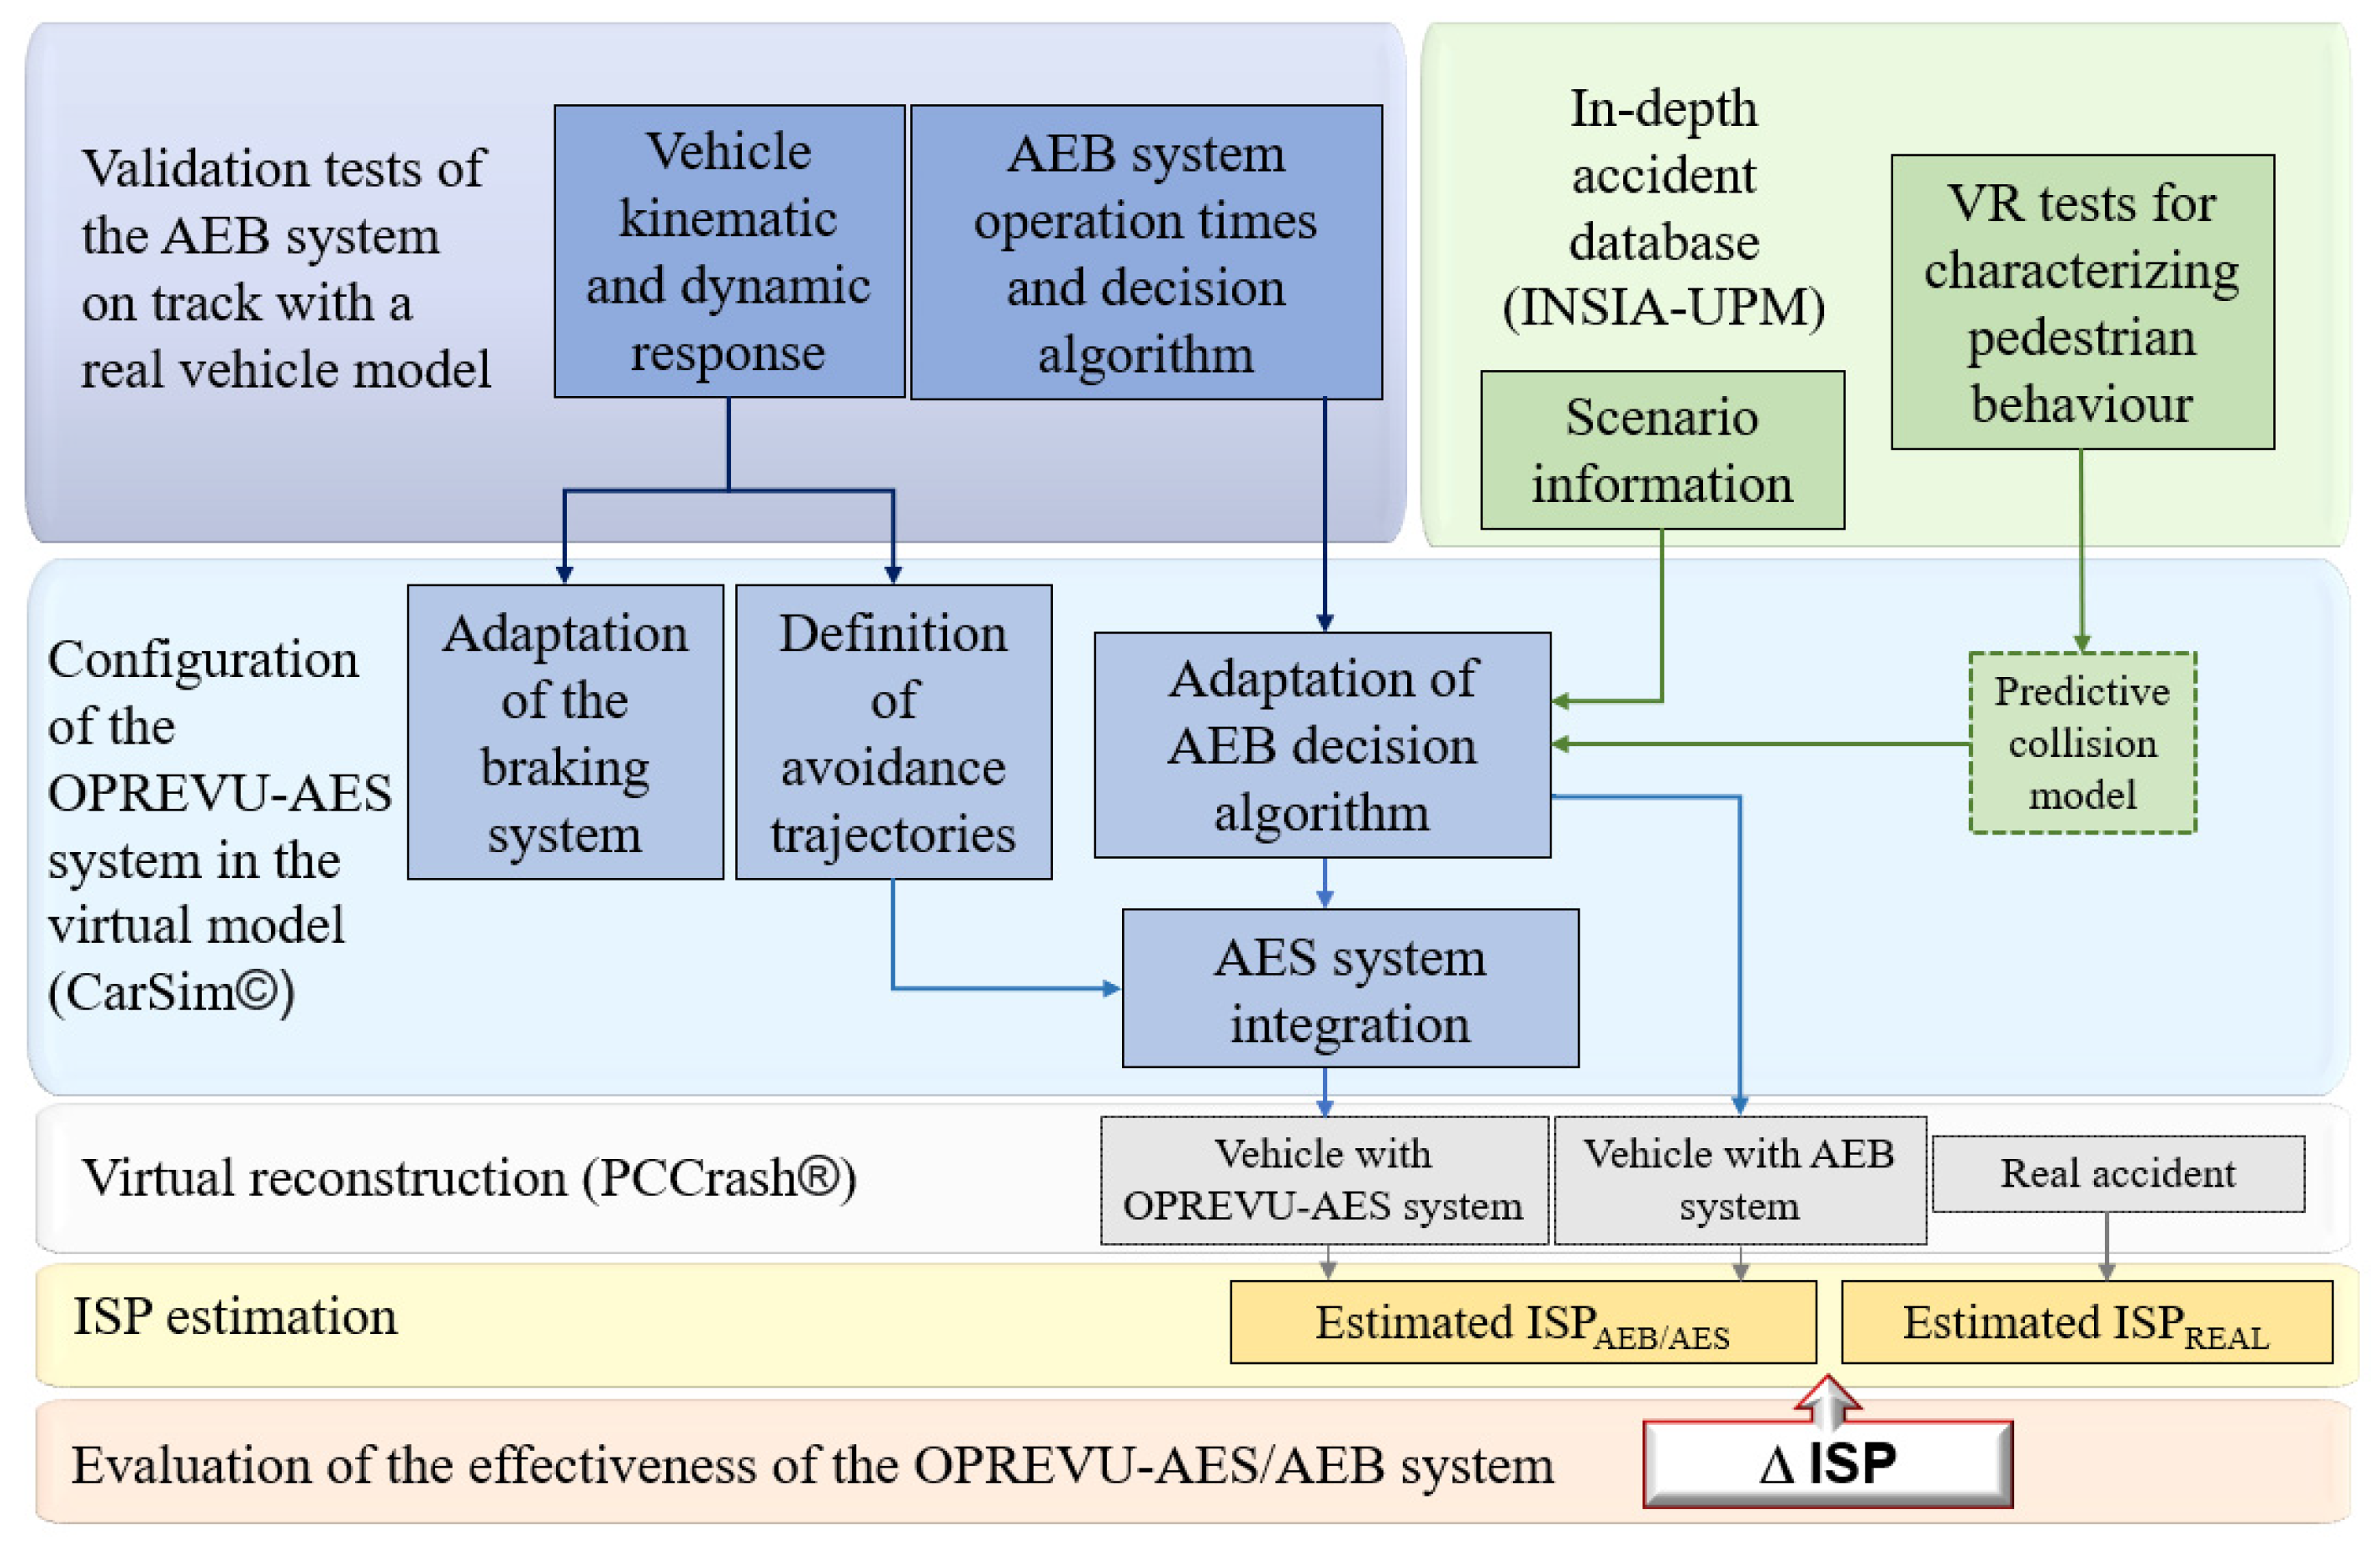
The methodological process (Figure 1) starts with the analysis of the decision algorithm of a commercial AEB system and the kinematic and dynamic response of the real vehicle. Simultaneously, an INSIA-UPM accident database is used to generate virtual reality urban scenarios and to obtain from the results a predictive collision system based on pedestrians’ behavior. Then, the evolution from the original AEB system to OPREVU-AES is conducted by modeling the CarSim© braking system of the virtual vehicle, generating the overtaking trajectories and incorporating the predictive system in its decision logic. The simulations in CarSim© are performed in scenarios based on those of the INSIA-UPM database.
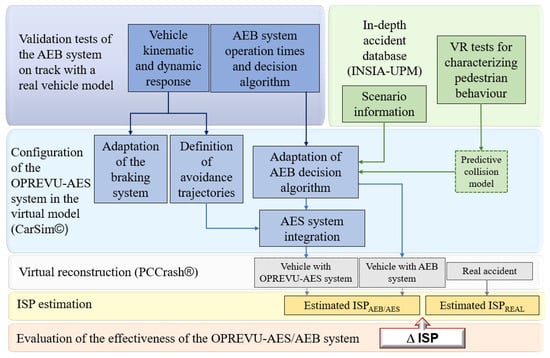
Figure 1.
Methodology scheme of the OPREVU-AES modeling and effectiveness evaluation.
The virtual reconstruction is performed in PCCrash© v2020.1 and considers the vehicle without ADAS, with the AEB system, and with the new OPREVU-AES. The evaluation of the effectiveness considers the avoidance and reduction in the impact speed and the probability of head injury (ISP) if the accident is not avoidable.
2.2. Accident Study and Setup of the Virtual Reconstruction
A database of 100 accidents in Madrid involving vulnerable users was studied (INSIA-UPM database) [19]. For the reconstruction phase using PCCrash© software, the subsample analyzed included a total of 40 pedestrian crashes. The sampling was based on three main criteria:
- The selected accidents occurred in urban areas.
- The vehicle involved was a passenger car, an SUV (Sport Utility Vehicle), or a light van.
- The pedestrian was hit by the front of the vehicle.
No vehicle had an AEB system. No restrictions were imposed on pedestrian characteristics (such as sex, age, height, or weight). Aspects such as victim information, the vehicle, impact type, severity of injuries, road characteristics and the urban environment, ambient light, weather conditions, and traffic density were considered in the design of the test scenarios.
The reconstruction process in PCCrash© starts from information gathered at the scene by the investigation team, in collaboration with law enforcement. Injury information is acquired from emergency services and hospital data and is used in the analysis phase to determine the mechanisms of injury.
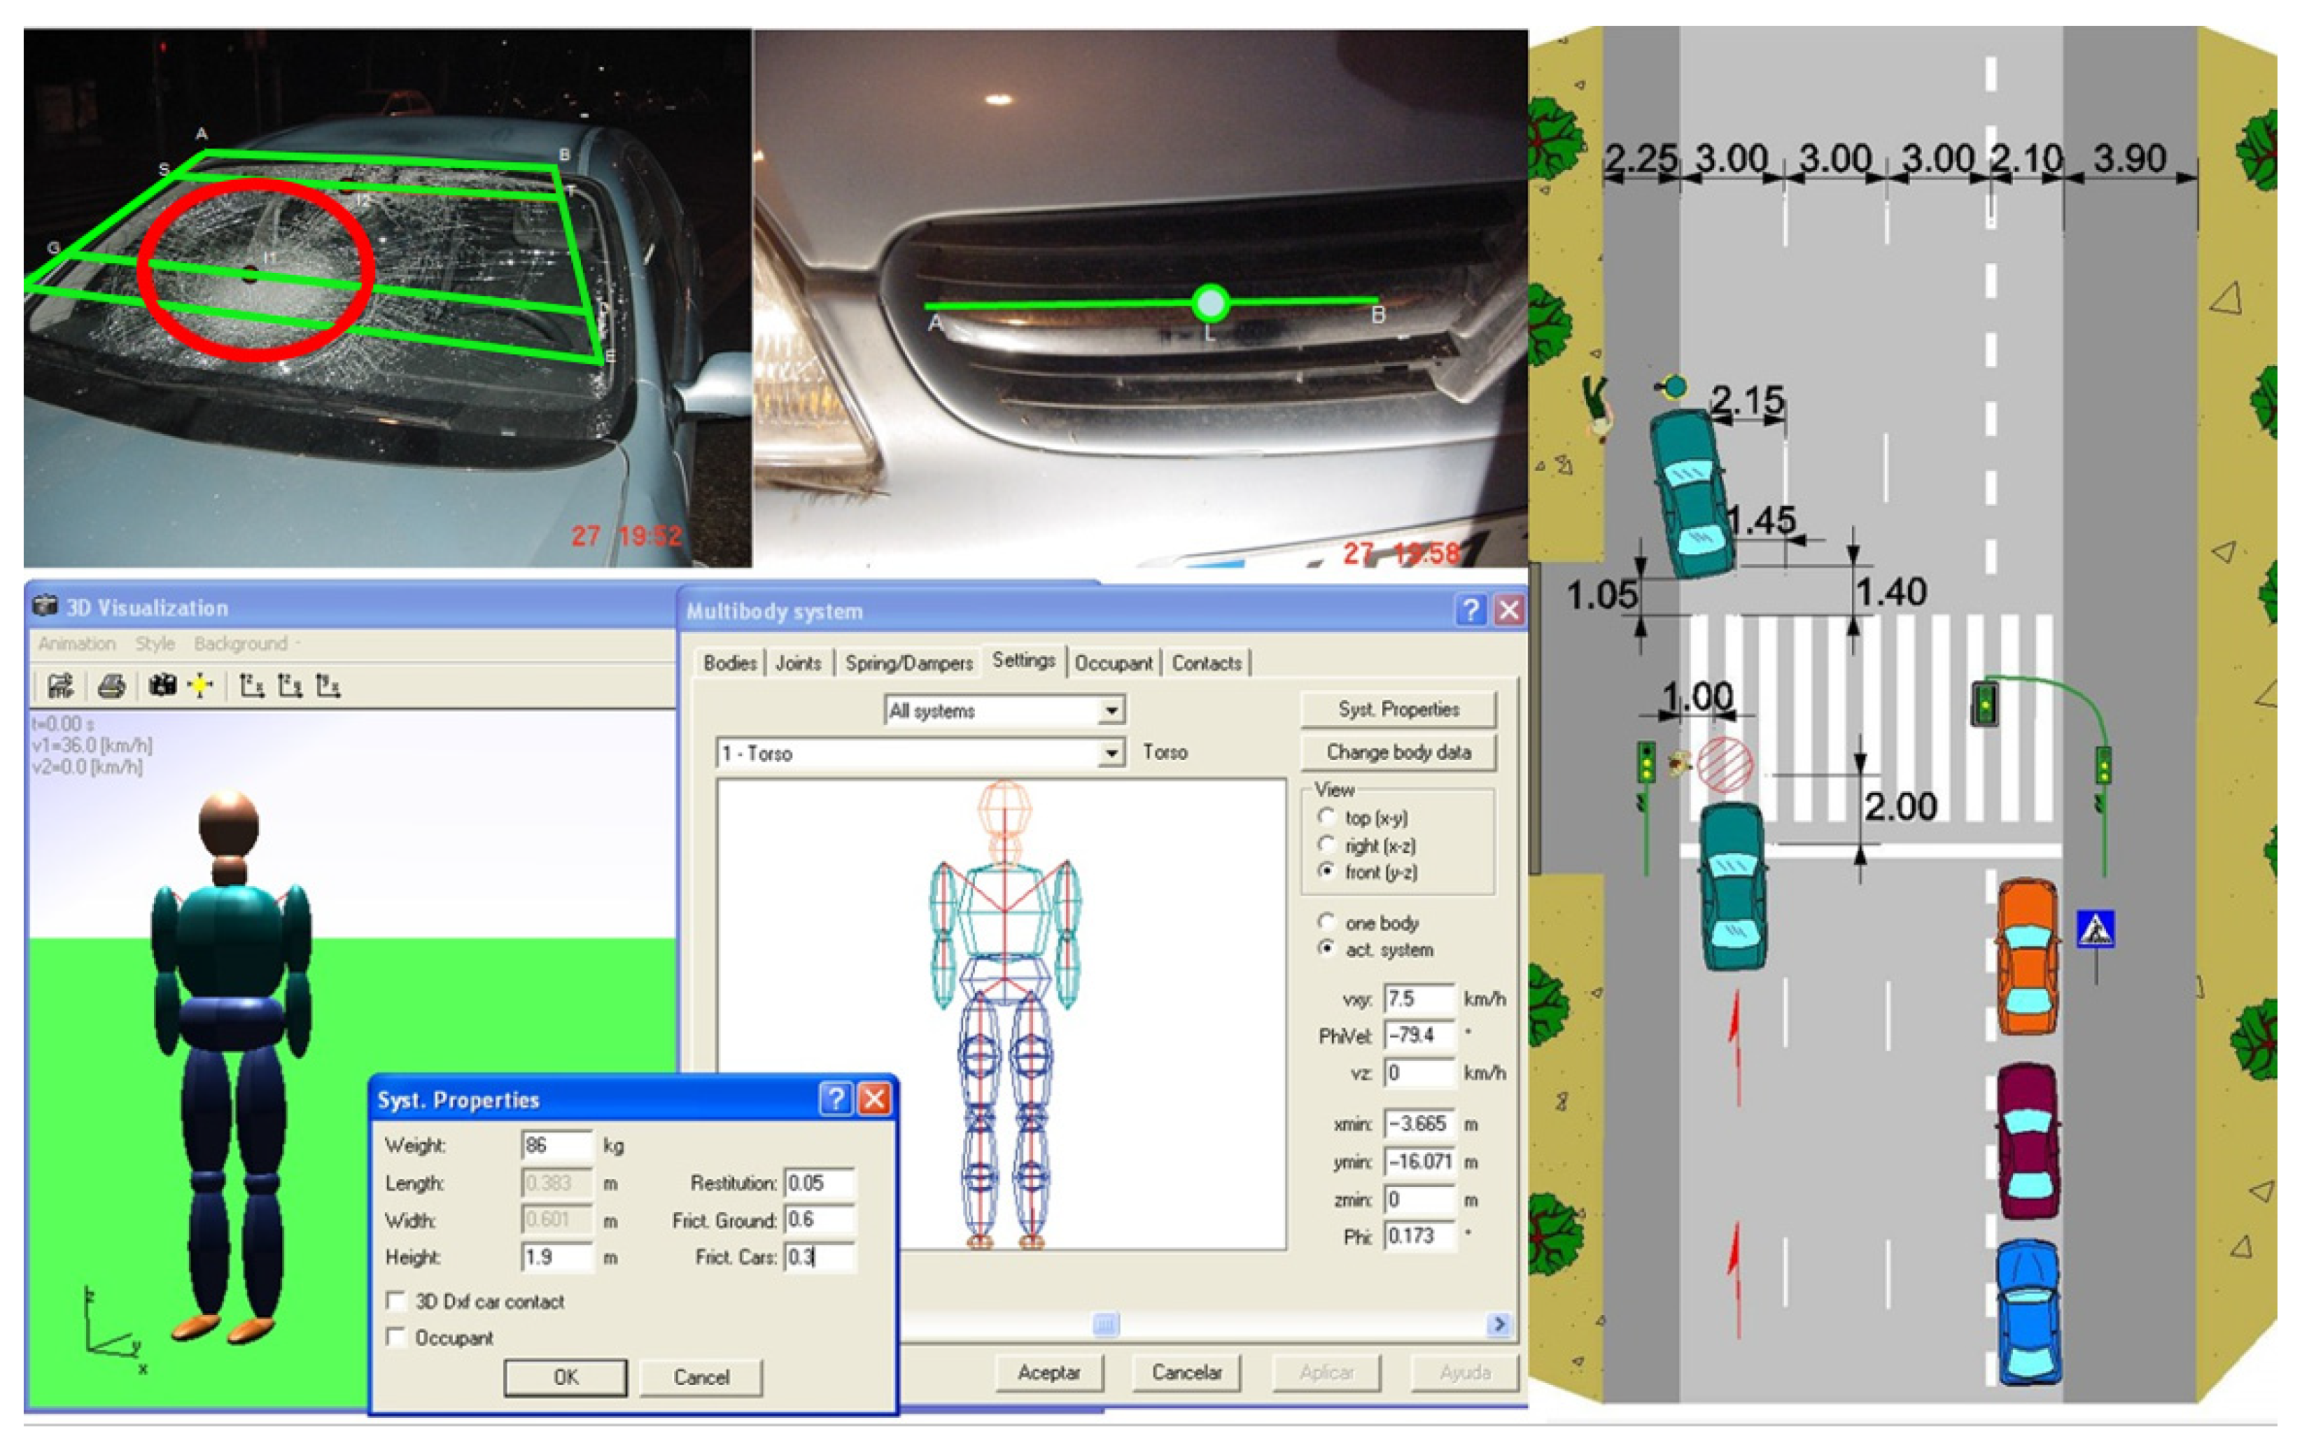
The scene is recreated in the software using detailed scale sketches, with geometry, infrastructure elements, braking traces, collision point, and final position of the subjects after impact. The pedestrian model in PCCrash© uses a validated multibody (MB) system [20,21], which is based on anthropometric studies [22,23] that represent the male and female Spanish population. The parameters of the MB model of the pedestrian are adjusted (according to height, weight, age, and gender).
Figure 2 shows the reconstruction of the impact and the scene, as well as the configuration of the MB model.

Figure 2.
Setting the initial conditions of the reconstruction in PCCrash©, considering the multi-body model of the pedestrian and the impact zone.
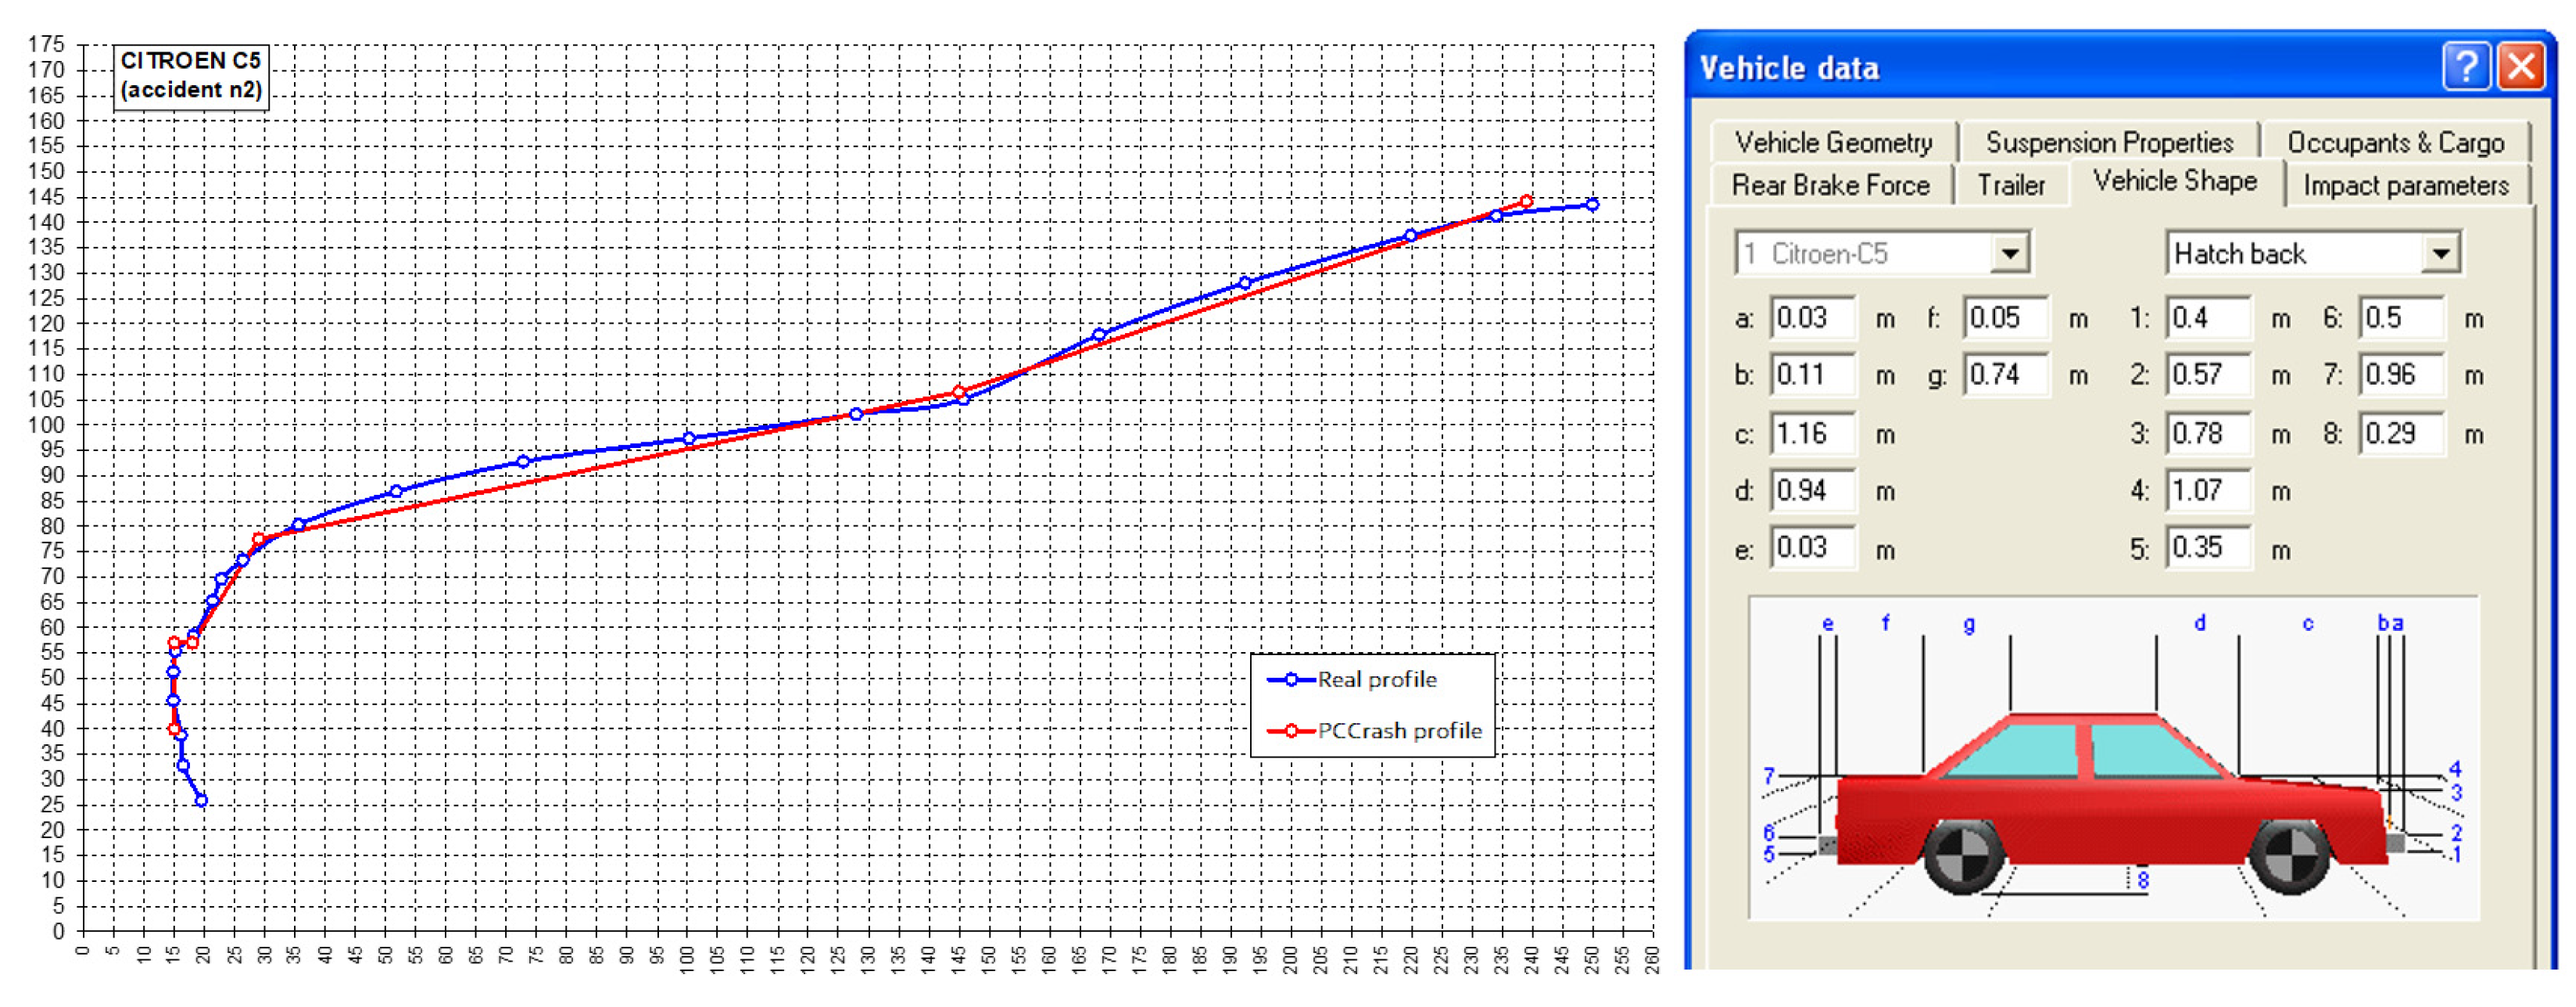
The corresponding vehicle is selected for each case from the PCCrash© database, taking into account parameters such as make, model, and manufacturing year. For this purpose, the frontal geometry of the real vehicles is precisely measured in order to adjust it to the dimensions and geometry of the real model (Figure 3).
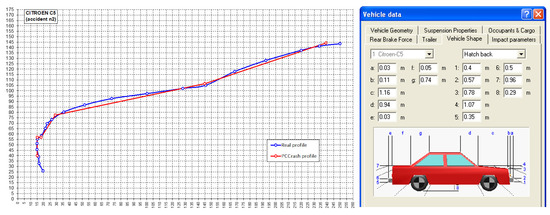
Figure 3.
Setting of the vehicle front-end profile in PCCrash© and configuration of the individual body dimensions.
Finally, the friction properties are adjusted by considering the coefficient of friction between the MB model and the ground or the vehicle, the static friction coefficient of the scenario, and the non-linear tire model. The initial conditions have a strong influence on the reconstruction kinematics [24]. The collision speed (Sc) value is decisive for the injury mechanisms (impact intensity and severity) and the final vehicle and pedestrian positions when matching them with those obtained in the real scene. Sc is estimated by considering post-crash information: the final position of the vehicle and pedestrian (as well as the pedestrian throw distance), damage to the vehicle and impact zone, brake marks (if any), and impact point.
On the other hand, the approach speed (Sa) is computed through an iterative process in which different combinations of vehicle position and maneuvers, pedestrian movement, and Sc value are tested. Some upfront hypotheses were uniformly established and executed in all the reconstructions:
- The driver’s reaction time is 1 s in all cases [25]. This assumption is different to that given in [26], where 1 s is the reaction time needed by a driver to respond to an unexpected and sudden braking event in traffic.
- The delay for a conventional braking system is 0.25 s. This value was chosen following a consideration of the deceleration curves of the commercial vehicle on the tested track (Section 2.5.1). Moreover, this value is close to the default value set by the PCCrash© software [27].
- Three intensity levels were set for the braking force before collision: no braking, medium-intensity braking (most of the crashes), and full braking (according to evidence, such as tire marks).
The probability of a pedestrian being killed increases with the speed. While the probability of suffering fatal injuries is lower than 5% in a pedestrian collision at 30 km/h, it rises to 15% at 50 km/h and is close to 20% from 60 km/h [28]. Figure 4 shows the scatter plot of the collision speed (Sc) values for each approach speed (Sa) value in the database. In the sample of collisions analyzed, the collision speed exceeds 30 km/h in 62.8% of the cases, and 50 km/h in 11.6%.
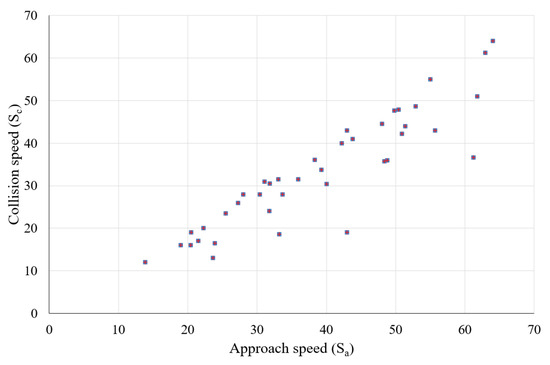
Figure 4.
Scatter plot of the collision speed (Sc) values for each approach speed (Sa) value in the sample accidents.
2.3. Estimation of Injury Severity Probability (ISP)
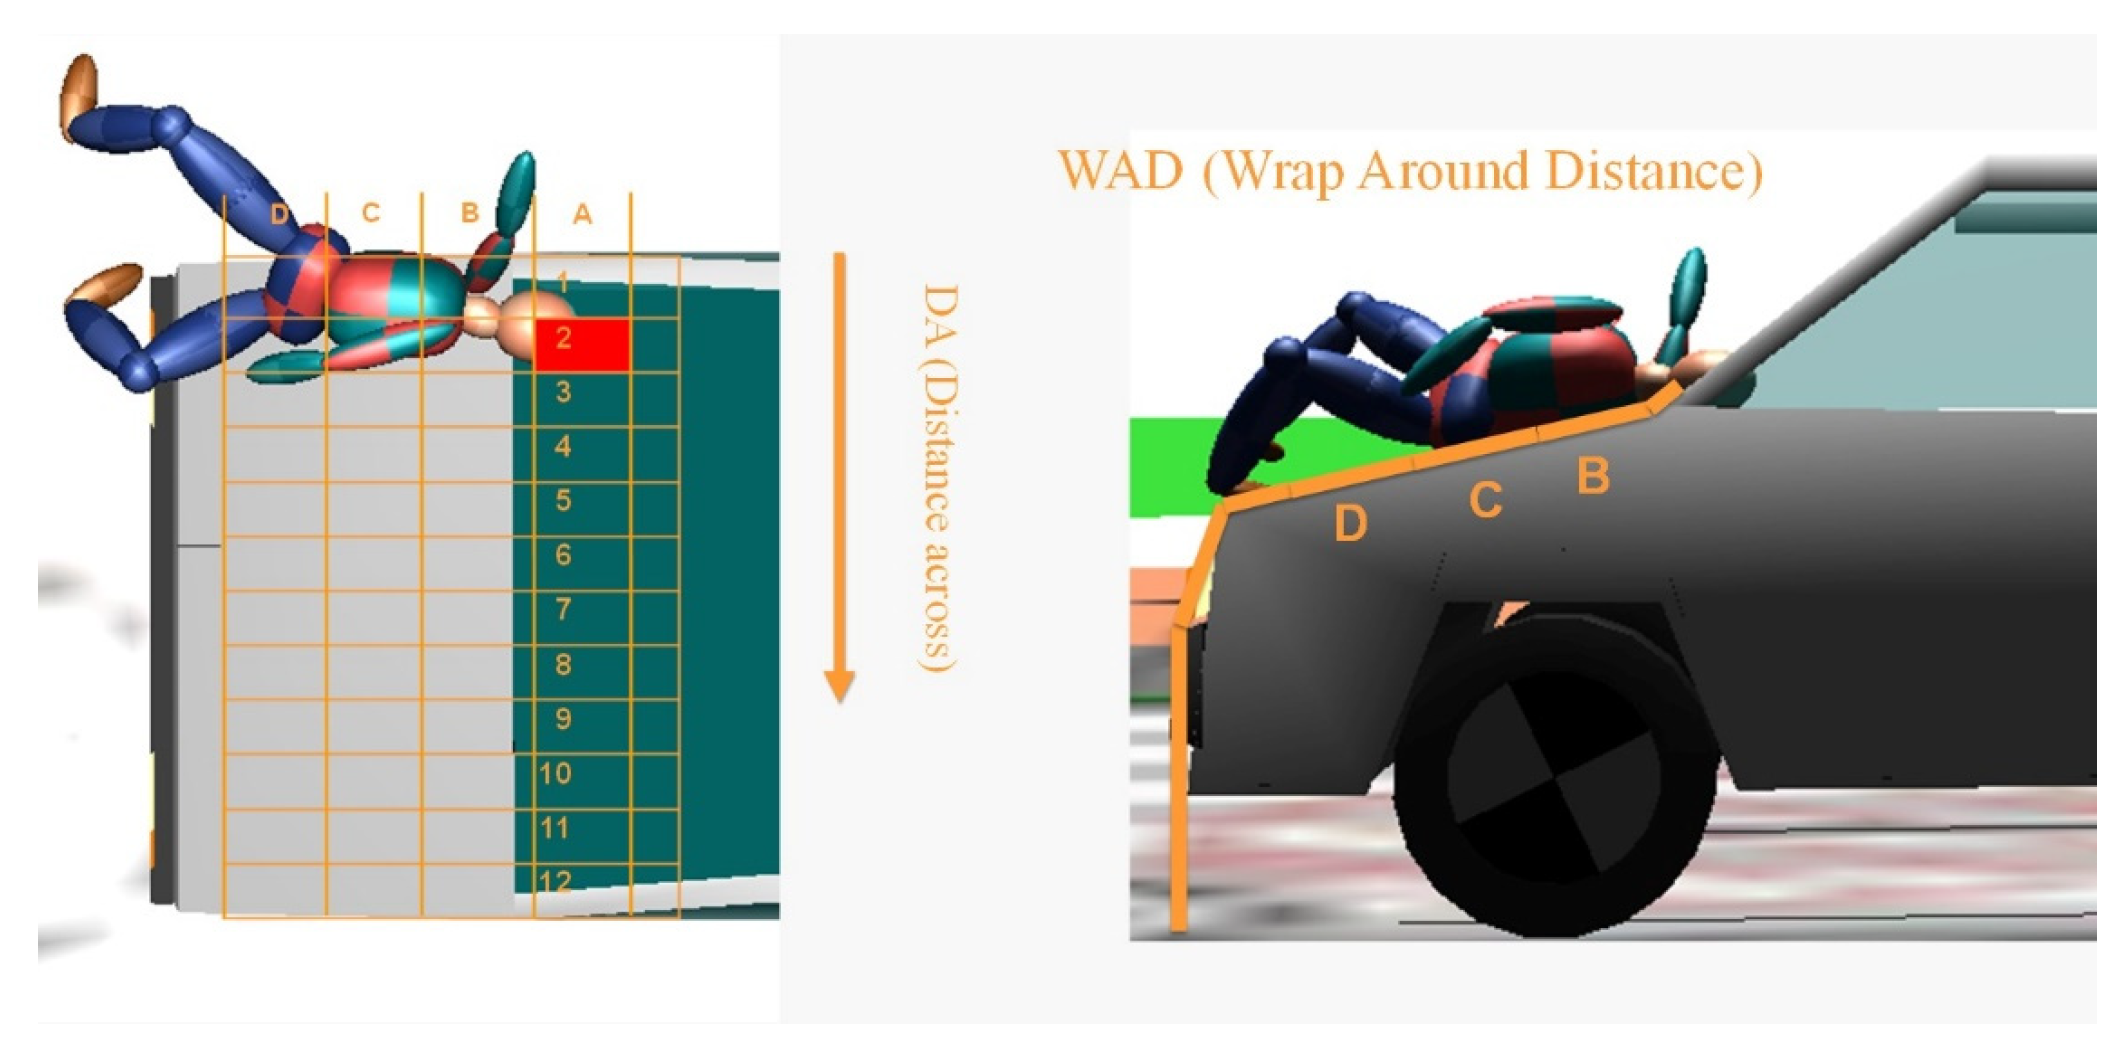
The severity depends on parameters such as Sc and the head impact point. The position of the head impact point was obtained from the virtual reconstruction and was represented by a row and a column corresponding to the WAD (Wrap Around Distance) and the distance across the front, DA (Distance Across), respectively, according to the front-end mesh specified by Euro NCAP [29] for pedestrian tests (Figure 5).
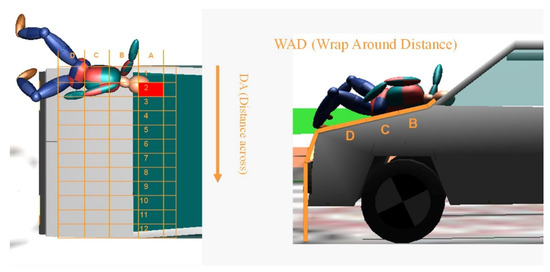
Figure 5.
Estimation of the impact cell from the reconstruction using PCCrash©.
The intensity of head impact is usually assessed using the Head Injury Criterion (HIC). The use of PCCrash© to obtain the necessary kinematic parameters and to evaluate the influence of vehicle geometry and the angle and type of impact for the calculation of the HIC has been validated in recent papers [30,31].
For this case study, data from several laboratory tests performed at Applus+ IDIADA are used to estimate the HIC (FIT–370,100–2007–51 project) [16]. The head impact velocity obtained from the reconstructions was correlated with the closest available velocity from the tests, and the HIC value was adjusted by interpolation. Finally, to estimate the severity of the head injury, the estimated HIC value allowed for the determination of the probability of suffering a severe head injury (AIS3+, Abbreviated Injury Scale) (ISPHIC,H,3), based on the correlation specified in (Equation (1)) and in Figure 6 [17,32]:
where i represents the index of the subdivision in the longitudinal direction of the front-end mesh in which the impact occurred, and j is the corresponding index in the transverse direction.
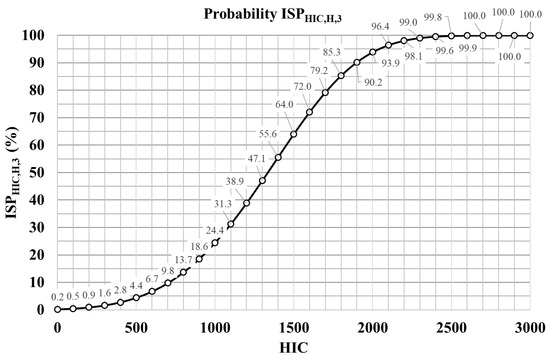
Figure 6.
Evolution of the ISP as a function of Head Injury Criterion (HIC) value.
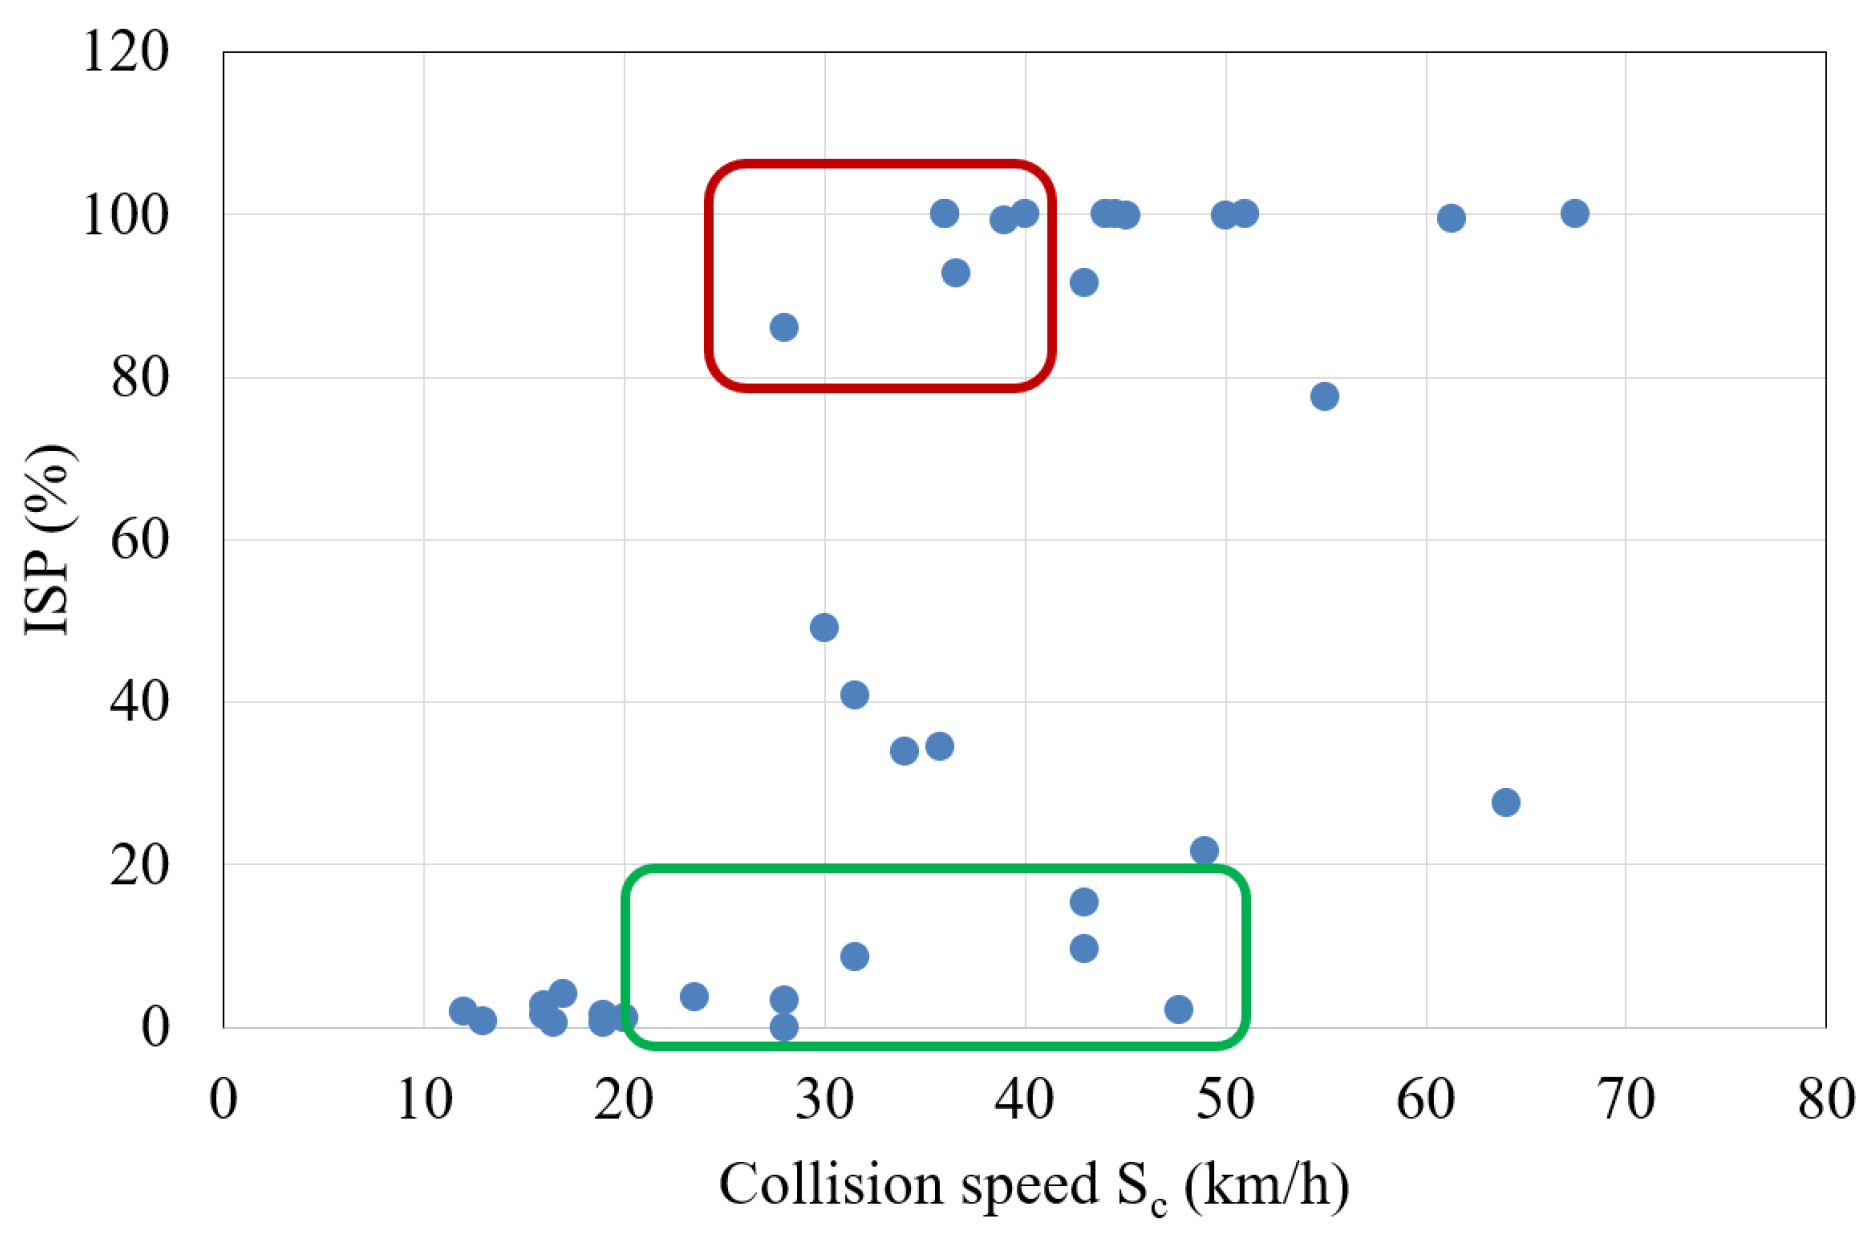
The evolution of the ISP value as a function of Sc in the sample accidents is also shown (Figure 7). Sc is the main influencing variable; thus, higher values of Sc tend to correspond to higher ISP values. However, there are some cases that do not follow this trend:
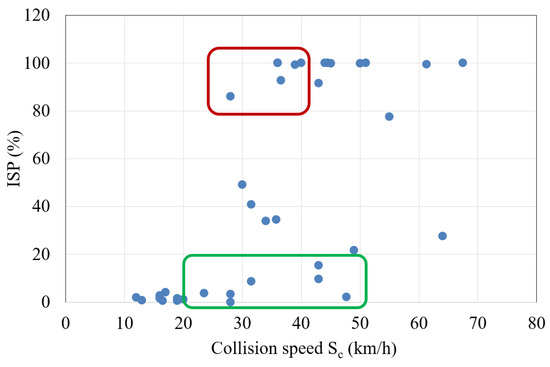
Figure 7.
Evolution of the ISP as a function of collision speed in the sample accidents.
In 50% of the cases with very low ISP values (0–20), Sc is equal to or higher than 20 km/h due to head impacts on cells with energy absorption capacity (green box).
In 43% of the collisions with very high ISP values (80–100), Sc is equal to or lower than 40 km/h due to head impacts on cells with high stiffness (red box).
2.4. Pedestrian Behavior Modeling
For the characterization of pedestrian behavior and the generation of a model adaptable to the decision algorithm of the AEB system, the most significant collision type in the INSIA-UPM database was considered: collision at a crosswalk regulated by traffic lights, with an impact of over 40 km/h in most cases. The tests were performed using an HP GZ V2 Backpack computer and HTC Vive glasses. The tests were conducted with a sample comprising 57 subjects (age: 20–30 years; gender: 28% female, 72% male).
From the analysis of the data recorded during the VR tests, the following results were obtained: 25.6% of the users accelerated to cross the crosswalk completely to the median; 32.6% stopped and returned to the sidewalk, and 41.8% did not react.
To define the percentage of time that the pedestrian spends looking at the vehicle approach zone (Percentage of Attention Time, PAT), a minimum angle was defined, below which the user is considered to be looking at the zone where the vehicle could appear and enter the crosswalk. This angle is defined as the “Minimum Angle of Attention, MAA”, and it takes into account the maximum distance the pedestrian must travel to a point of the crossing where the collision is possible and the minimum distance the piloted vehicle would need to brake completely from cruising speed. The PAT is calculated as the percentage of time used by the pedestrian to look with a head rotation angle that is less than the MAA. The MAA and PAT calculations are shown in detail in the paper in [18].
The database included individual records for each user; these records considered the following variables: PAT; the reaction type (accelerate, stop and step backward, no reaction); the reaction zone (before hit lane, within hit lane, no speed change); the average error in distance estimation in VR (average error DVR), speed estimation in VR (average error VVR), distance estimation with real objects (average error DR), and the safety TTC.
Likewise, among the supervised learning classification methods, the formulation of a type of classification method known as “White box” (which is closer to human logical reasoning) was proposed. Also, as models whose computational expense is the lowest possible are preferred when speeding up the processing time in the optimized AEB system, an individual decision tree model was chosen (Figure 8). The sample was split into a training set (80%, n = 45) and a test set (20%, n = 12), and the final accuracy in the test set was equal (81%) to that of a random forest model.
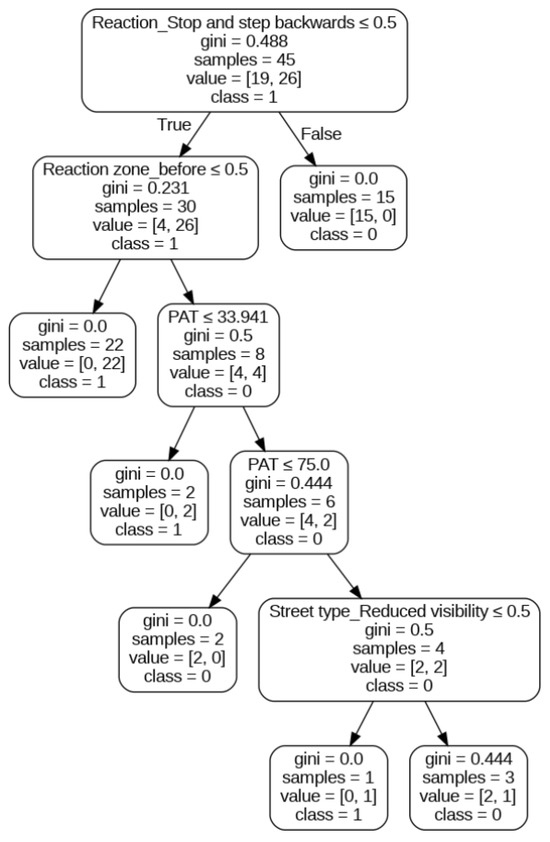
Figure 8.
Collision predictive model based on an individual decision tree.
At each node of the decision tree, it is asked whether each category is False (0) or True (1). Branching to the left indicates that the node’s condition is false, while branching to the right indicates the opposite. In the case that the pedestrian stops and moves backward, the accident is avoided. Accelerating or not reacting after reaching the hit lane entails an accident. For cases where the pedestrian accelerates early, before the lane in which the vehicle travels, the PAT value is below 33.9% since the vehicle that started the simulation implies an accident; if the PAT value is between 33.9% and 75%, the collision is avoided. When the PAT value exceeds 75%, the crash is only avoided in urban scenarios where there is no visibility.
2.5. Design of OPREVU-AES and CarSim© Integration
2.5.1. Analysis of the Commercial AEB System
Track tests were performed to validate the AEB system in a commercial vehicle (Hyundai Ioniq 1.6 GDI 104 Kw, 2020-model), taking as a reference the Euro NCAP CPNA-50 and CPNA-25 (Car-to-Pedestrian Nearside Adult) validation tests (Euro NCAP, 2022). The objective was to analyze the kinematic and dynamic response of the car during the autonomous braking process, as well as the response times for the Forward Collision Warning (FCW) and for the activation of the automatic braking (Time-to-Collision (TTC) threshold).
The data obtained were exported and analyzed in previous researchers’ work [2], yielding the following operating conditions:
- The camera covers a range of ±26°, according to the OEM (Original Equipment Manufacturer).
- Pedestrian identification is performed at a maximum distance of 30 m (98 ft). The FCW signal is always activated below this value.
- The lateral distance between the pedestrian and the longitudinal axis of the vehicle must be less than 1 m.
- The FCW warning signal (TFCW) is activated when the TTC drops to 1.8 s.
The instantaneous value of the TTC must be less than a certain threshold value for the initiation of autonomous braking, which is variable with the car kinematics.
2.5.2. Definition of OPREVU-AES Evasive Trajectories
The vehicle system integrated in CarSim© was adapted to the real vehicle tested on a track. In order to generate stable avoidance maneuvers, point trajectories were defined in the CarSim© Double Lane Change, Tight w/o ESC dataset for each of the speeds between 40 and 70 km/h. The lower limit of 40 km/h was chosen because from this speed the AES system could initiate the maneuver with a margin of 12 m, which is exactly the distance it would need to stop the vehicle with AEB braking (according to the track tests). Above 40 km/h, the braking distance of the AEB increases, while the AES can maintain the trajectory initiation at a distance of 12 m, which allows it to react if the identification occurs at a shorter distance than the AEB needs to fully brake the vehicle. Likewise, the collisions analyzed in the database revealed that the maximum speed reached was below 70 km/h; so, this was established as the upper limit of action.
Stable trajectories were obtained between 40 km/h and 55 km/h, 12 m from the pedestrian/target, while between 56 km/h and 65 km/h the trajectory was stable starting at 18 m from the user. Between 66 km/h and 70 m/h, the relative distance must be at least 24 m.
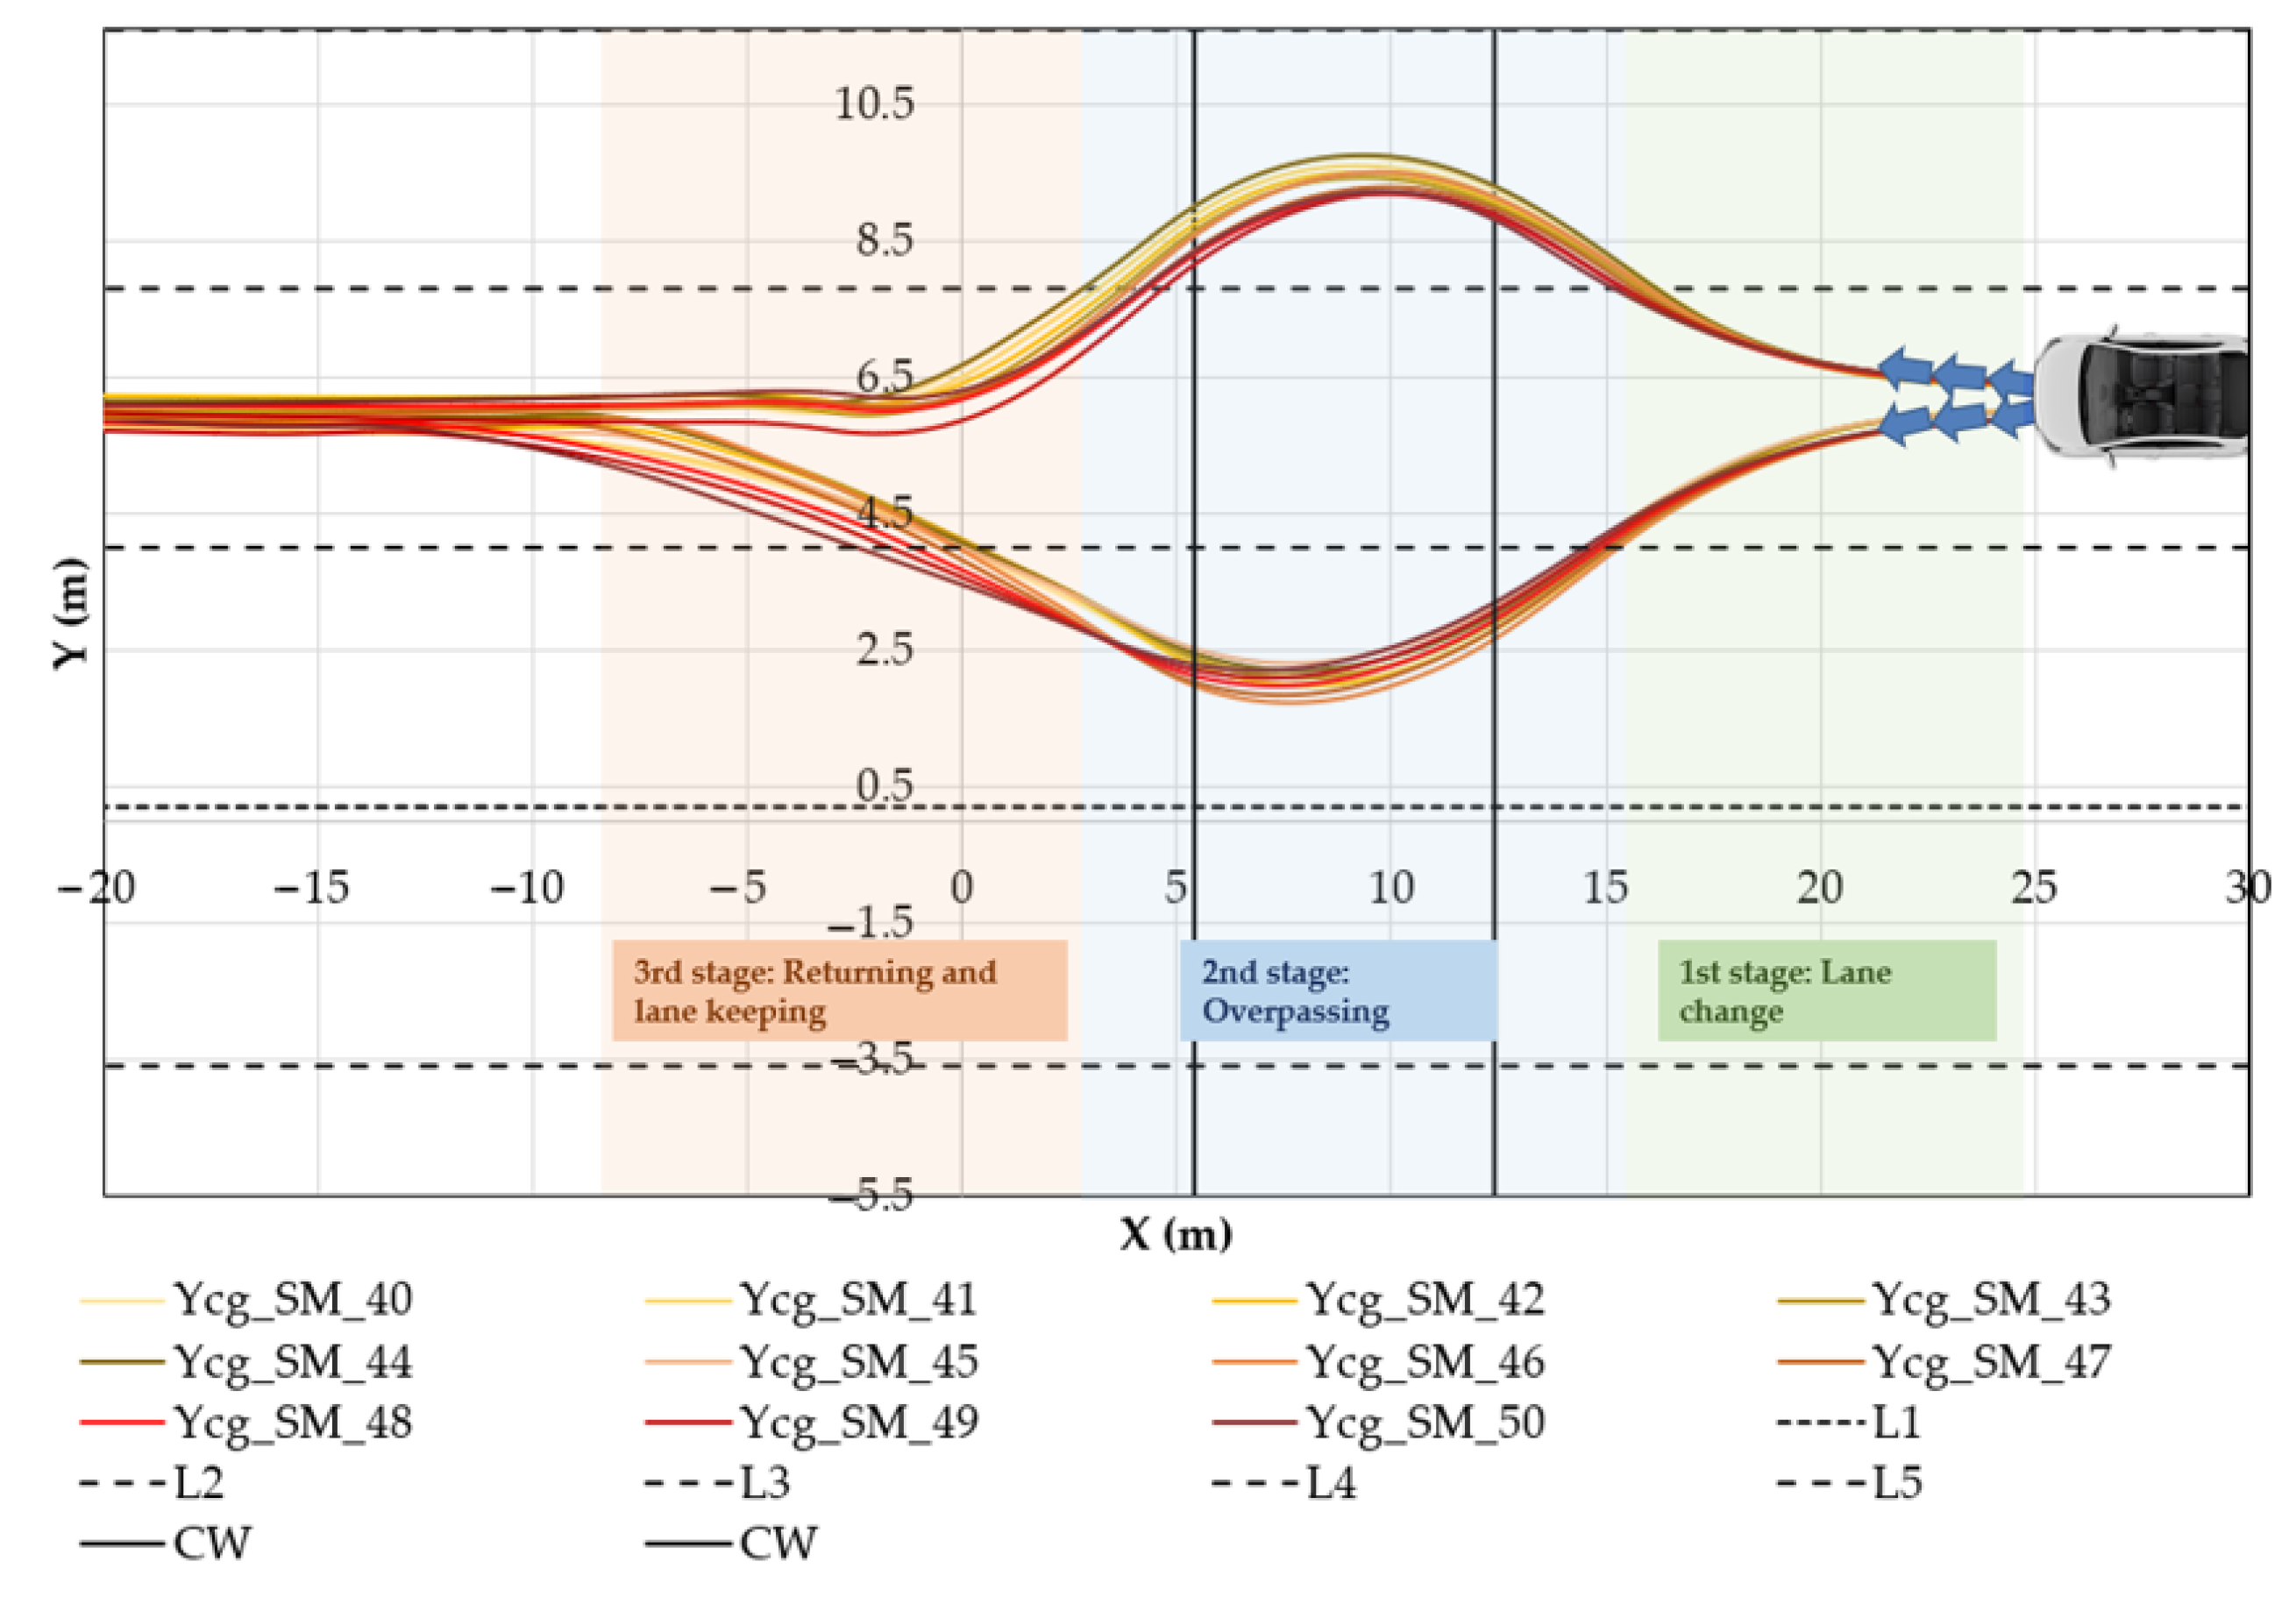
Figure 9 shows the trajectories corresponding to the speed range between 40 km/h (minimum operating speed for the AES system) and 50 km/h (maximum speed allowed in urban areas). The CW lines represent the width of the crosswalk, and L represents the lane lines. The colored stripes represent the three stages of the complete maneuver: first—lane change (green); second—overtaking (blue); and third—re-entry (orange). The ESC performance allows lateral acceleration to be controlled, and the steering wheel turning profile and yaw rate always allow for the conclusion that the overtaking tests (both sides) comply with the ECE R13H standard [33].
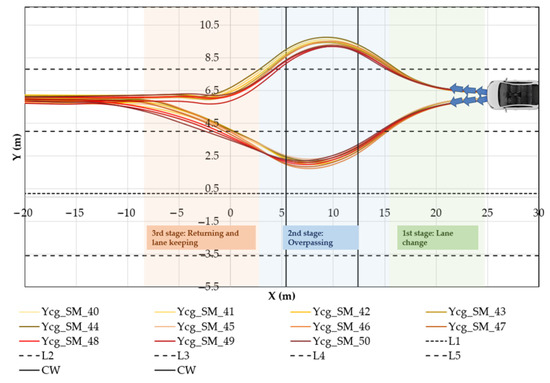
Figure 9.
Avoidance trajectories for 40 km/h–50 km/h range.
2.5.3. Integration of the Predictive Collision Model and OPREVU-AES Setup
The AEB system optimization involved introducing the predictive collision model obtained through the VR tests. The performance limitations of the original AEB consisted mainly of a 1 m lateral activation range and the non-inclusion of pedestrian behavior in the decision algorithm to regulate the braking response.
Subsequently, the set of blocks for calculating the following variables was defined within Simulink: reaction type, which considers pedestrian speed and acceleration; the reaction lane, which requires the relative position of the pedestrian with respect to the vehicle lane; the PAT, obtained by measuring the pedestrian’s head rotation; and the detection of lateral obstacles on the roadway (parked vehicles) through the fusion sensor.
The detection of the frontal area of the vehicle is deployed by the same fusion sensor that allows for pedestrian identification, measuring the distance and bearing angle to the nearest object and to the second nearest object.
To determine the reaction type, according to the VR results, if the absolute value of the acceleration is greater than 1.05 m/s2, the pedestrian is accelerating or decelerating (depending on the sign). The acceleration is measured using a transport delay block over the speed profile (0.2 s).
For the calculation of the reaction location, an “If Subsystem” set allows the lateral offset value in which this change occurred to be saved. To evaluate the reaction zone, the information obtained by the five-point lane detector is used.
Moreover, the PAT calculation is obtained by capturing the heading angle of the test pedestrian and comparing it with the MAA limit value. A facial–ocular recognition system is integrated into the fusion sensor camera.
A MATLAB function block contains the decision tree code of the predictive pedestrian model. To design the AES system, the steering wheel turning, forward coordinate, and braking pressure data are exported for each speed and overtaking side. Finally, a blind spot sensor is added, with rear traffic recognition up to 5 m behind the vehicle.
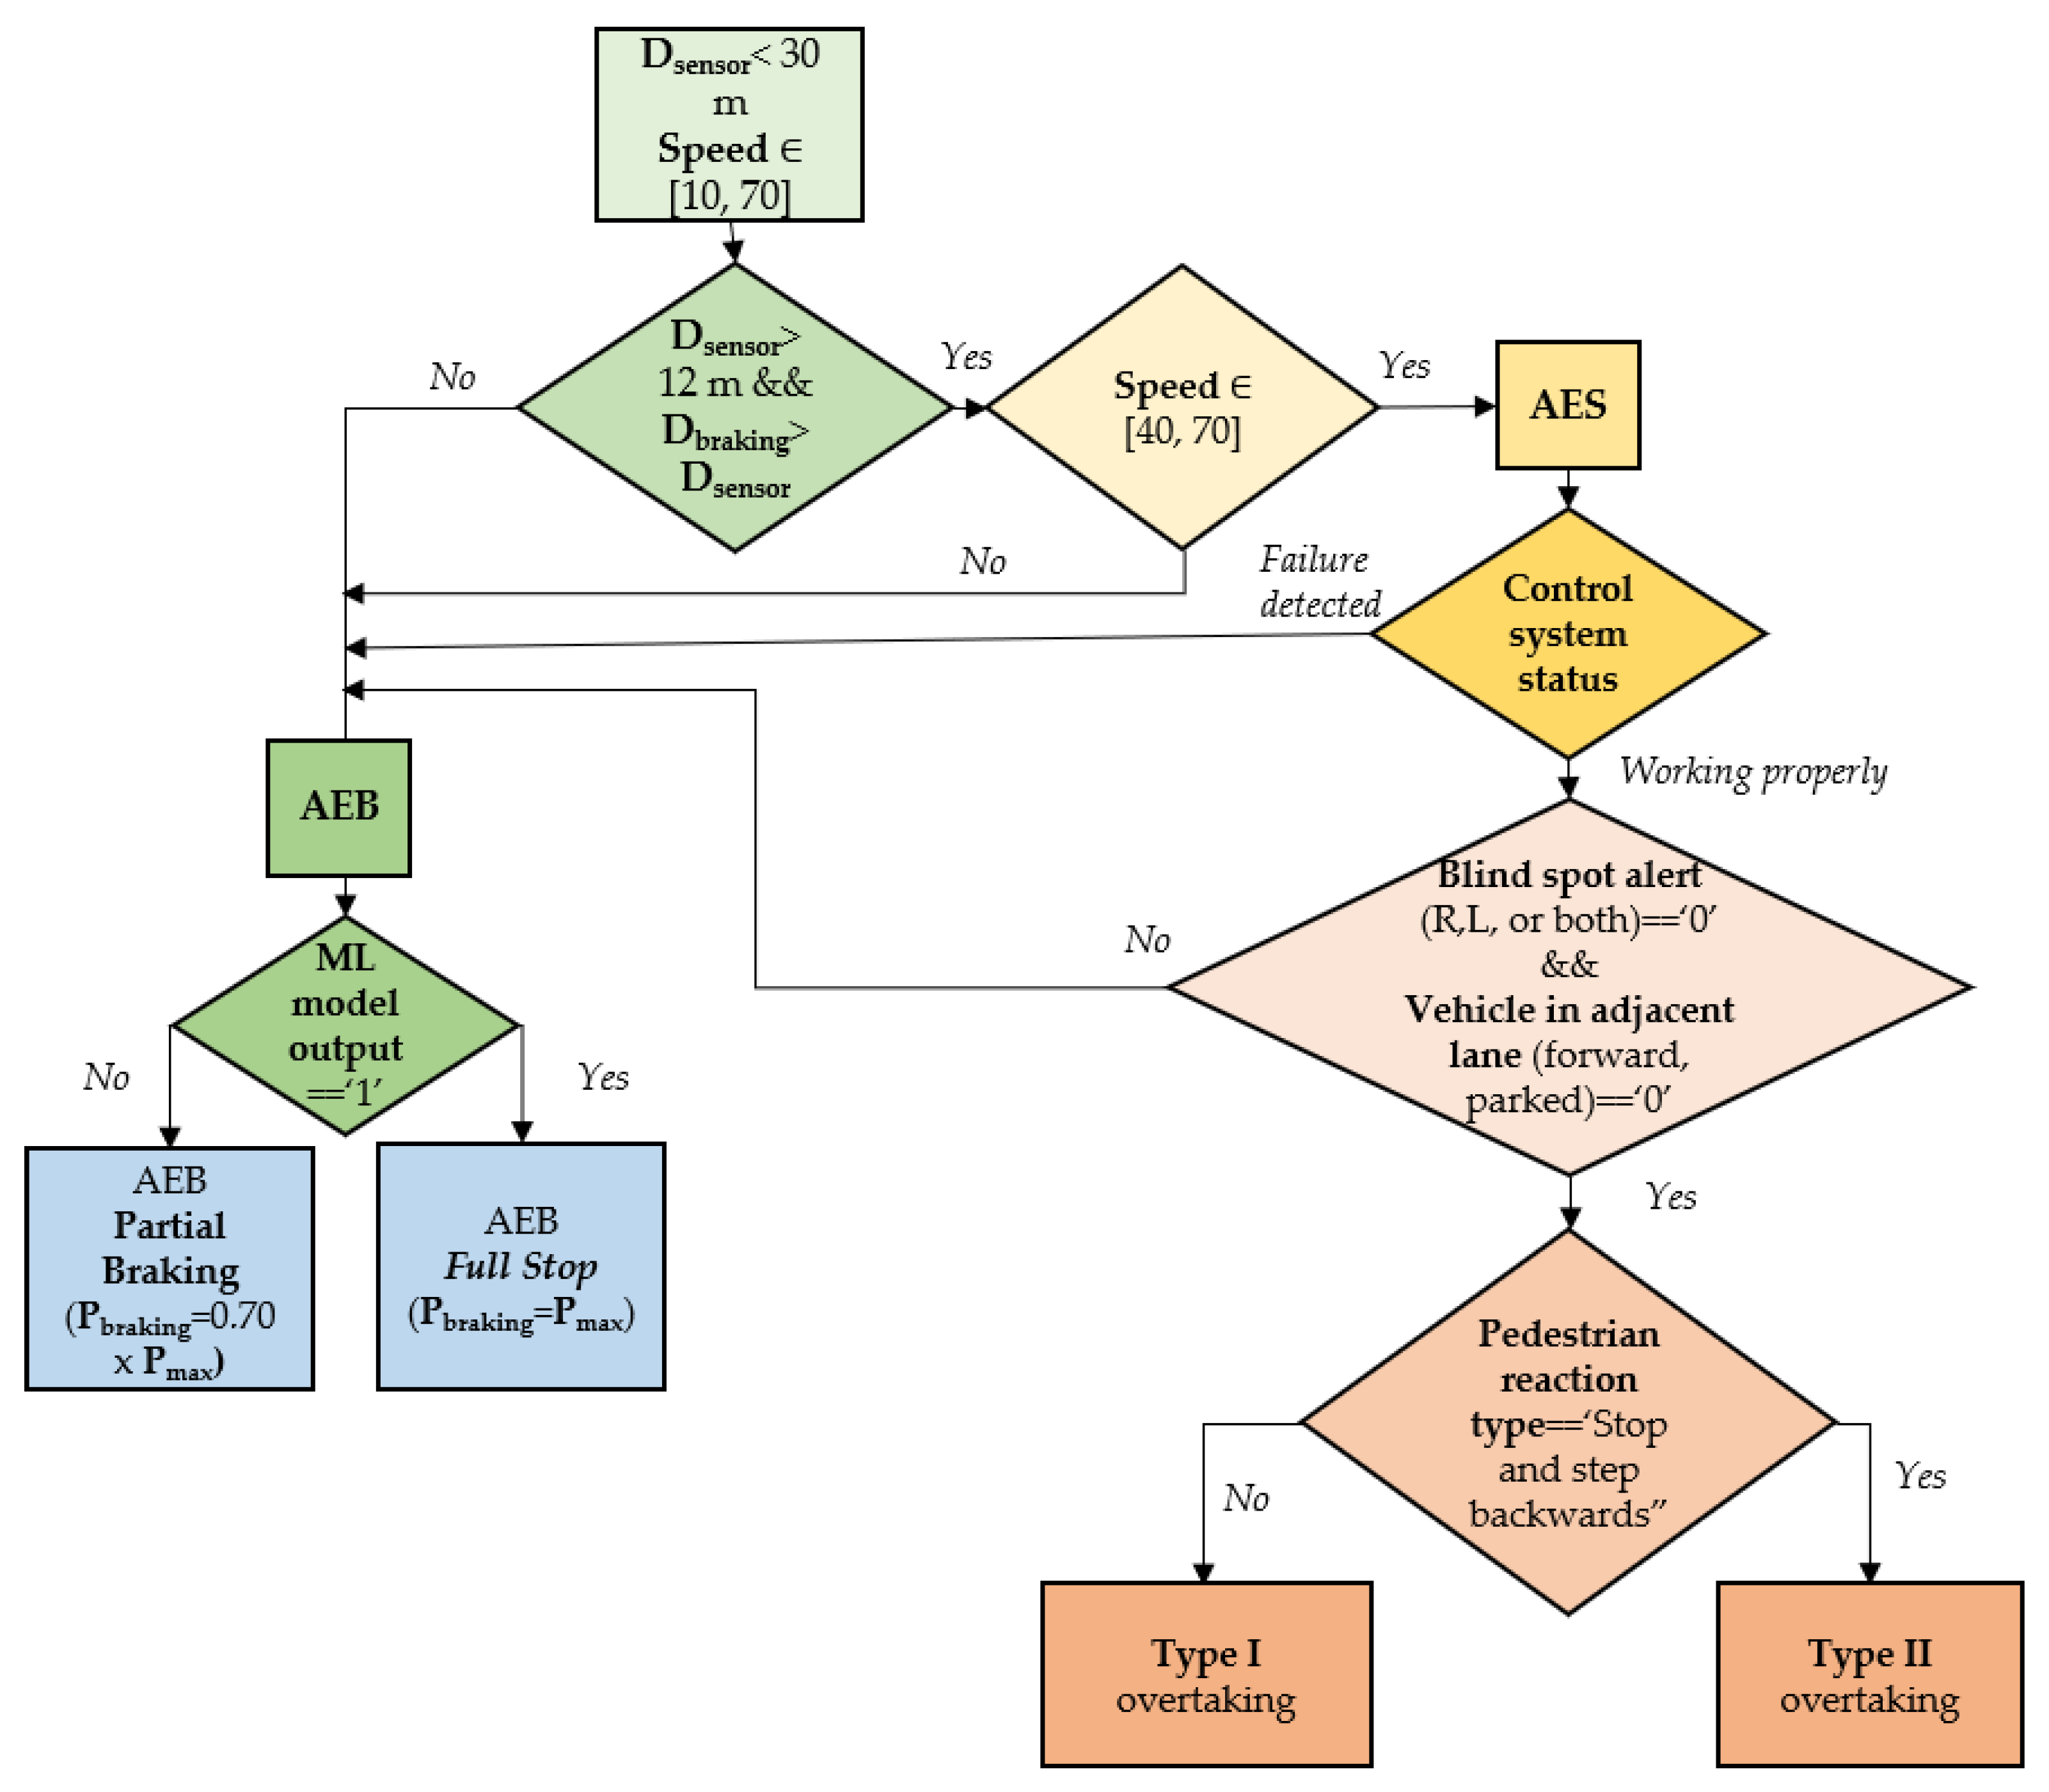
The avoidance direction when the AES is activated is determined by the pedestrian reaction type and movement direction when entering the crosswalk. If the pedestrian reacts by accelerating or not reacting, the avoidance is performed with the Type I maneuver, while, in the case of stopping and stepping backward, the overtaking is performed by turning the steering wheel according to the Type II maneuver. Type I overtaking occurs when the vehicle merges into the lane opposite the one the pedestrian is moving toward (if the pedestrian is moving from right to left from the driver’s perspective, the initial turn of the steering wheel would be to the right; if the pedestrian is moving from left to right, the initial turn would be to the left).
Similarly, Type II overtaking occurs when the vehicle moves into the same lane as the pedestrian; in this case, the turns of the steering wheel are the opposite of those in Type I. Moreover, the value obtained by the collision prediction algorithm takes into account the above values, and its coding is performed following the decision tree logic that was discussed previously.
The final block integrates AEB and AES selection, yielding three possible categorical values for pressure and steering wheel angle (left-side avoidance, right-side avoidance, AEB braking). A switch case block outputs the resulting value. Likewise, in the case of AEB activation and a null prediction by the predictive collision model, a gain factor (0.70) multiplies the maximum braking pressure value, regulating the deceleration response.
Figure 10 shows a schematic of the operation of the decision algorithm of OPREVU-AES.
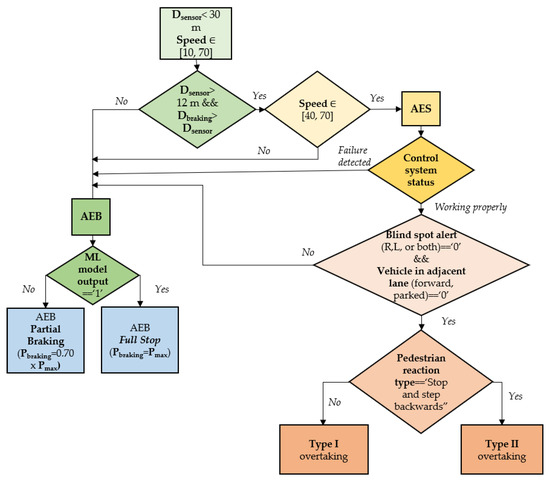
Figure 10.
Flowchart of the OPREU-AES system decision-making.
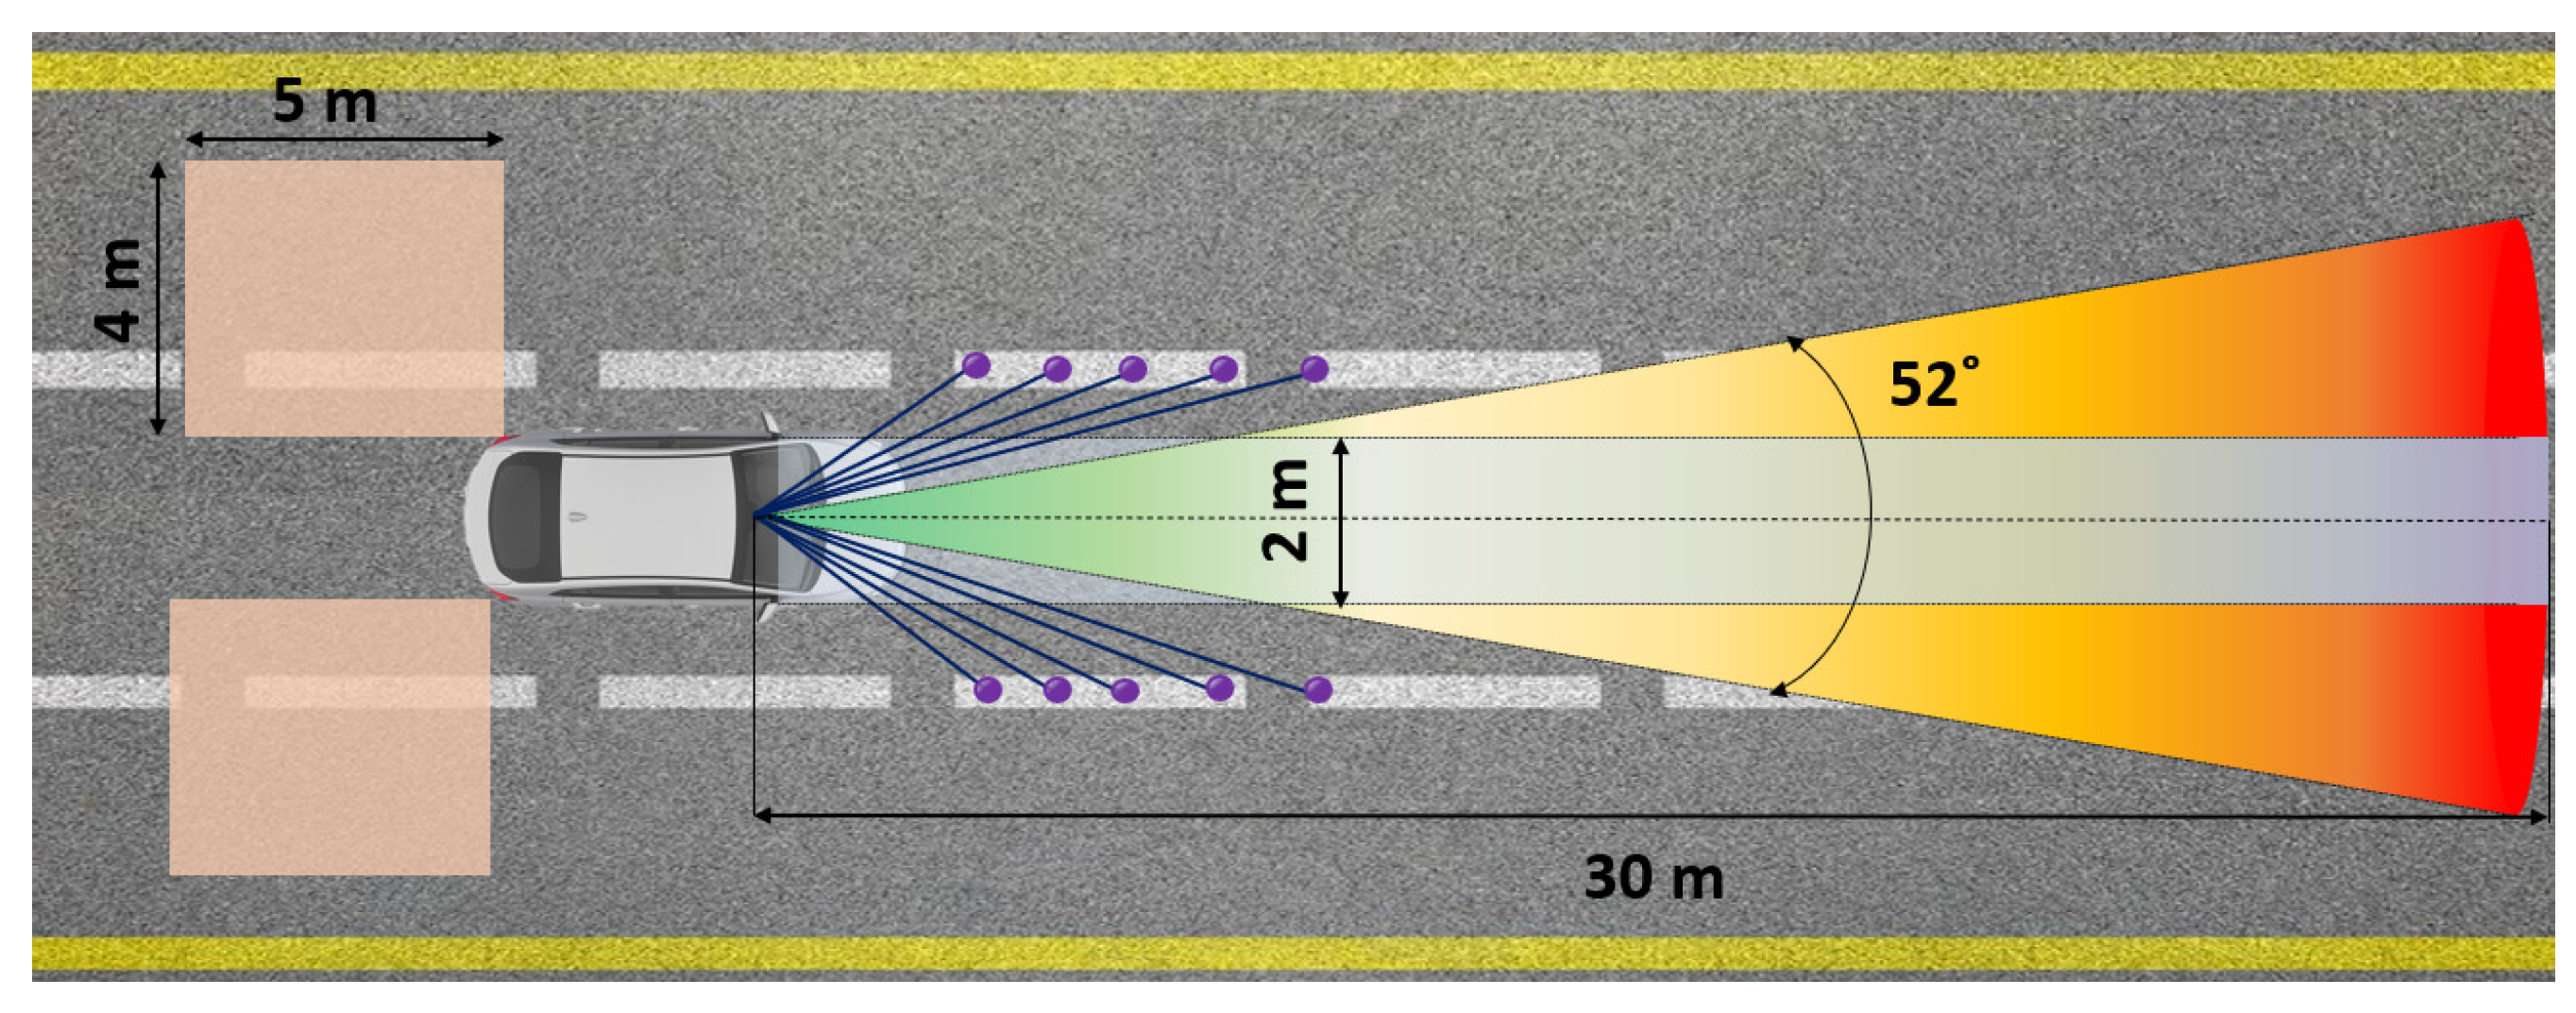
The detection and actuation range of OPREVU-AES is shown in Figure 11, as well as that of the complementary driving assistance systems. The vision range of the fusion sensor is 30 m and has a total opening of 52°, and the total lateral activation range (blue) is 2 m. The five-point lane detector (purple) allows the position of the lane edges to be obtained. The blind spot detector covers an area of 4 m × 5 m on each side (orange).
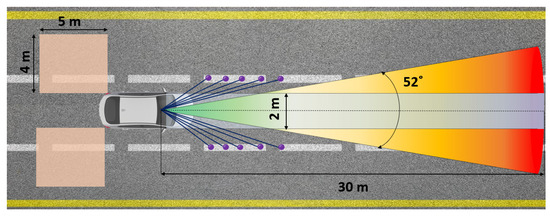
Figure 11.
Detection and actuation range of OPREVU-AES.
3. Results
3.1. Decision-Making Algorithm of OPREVU-AES
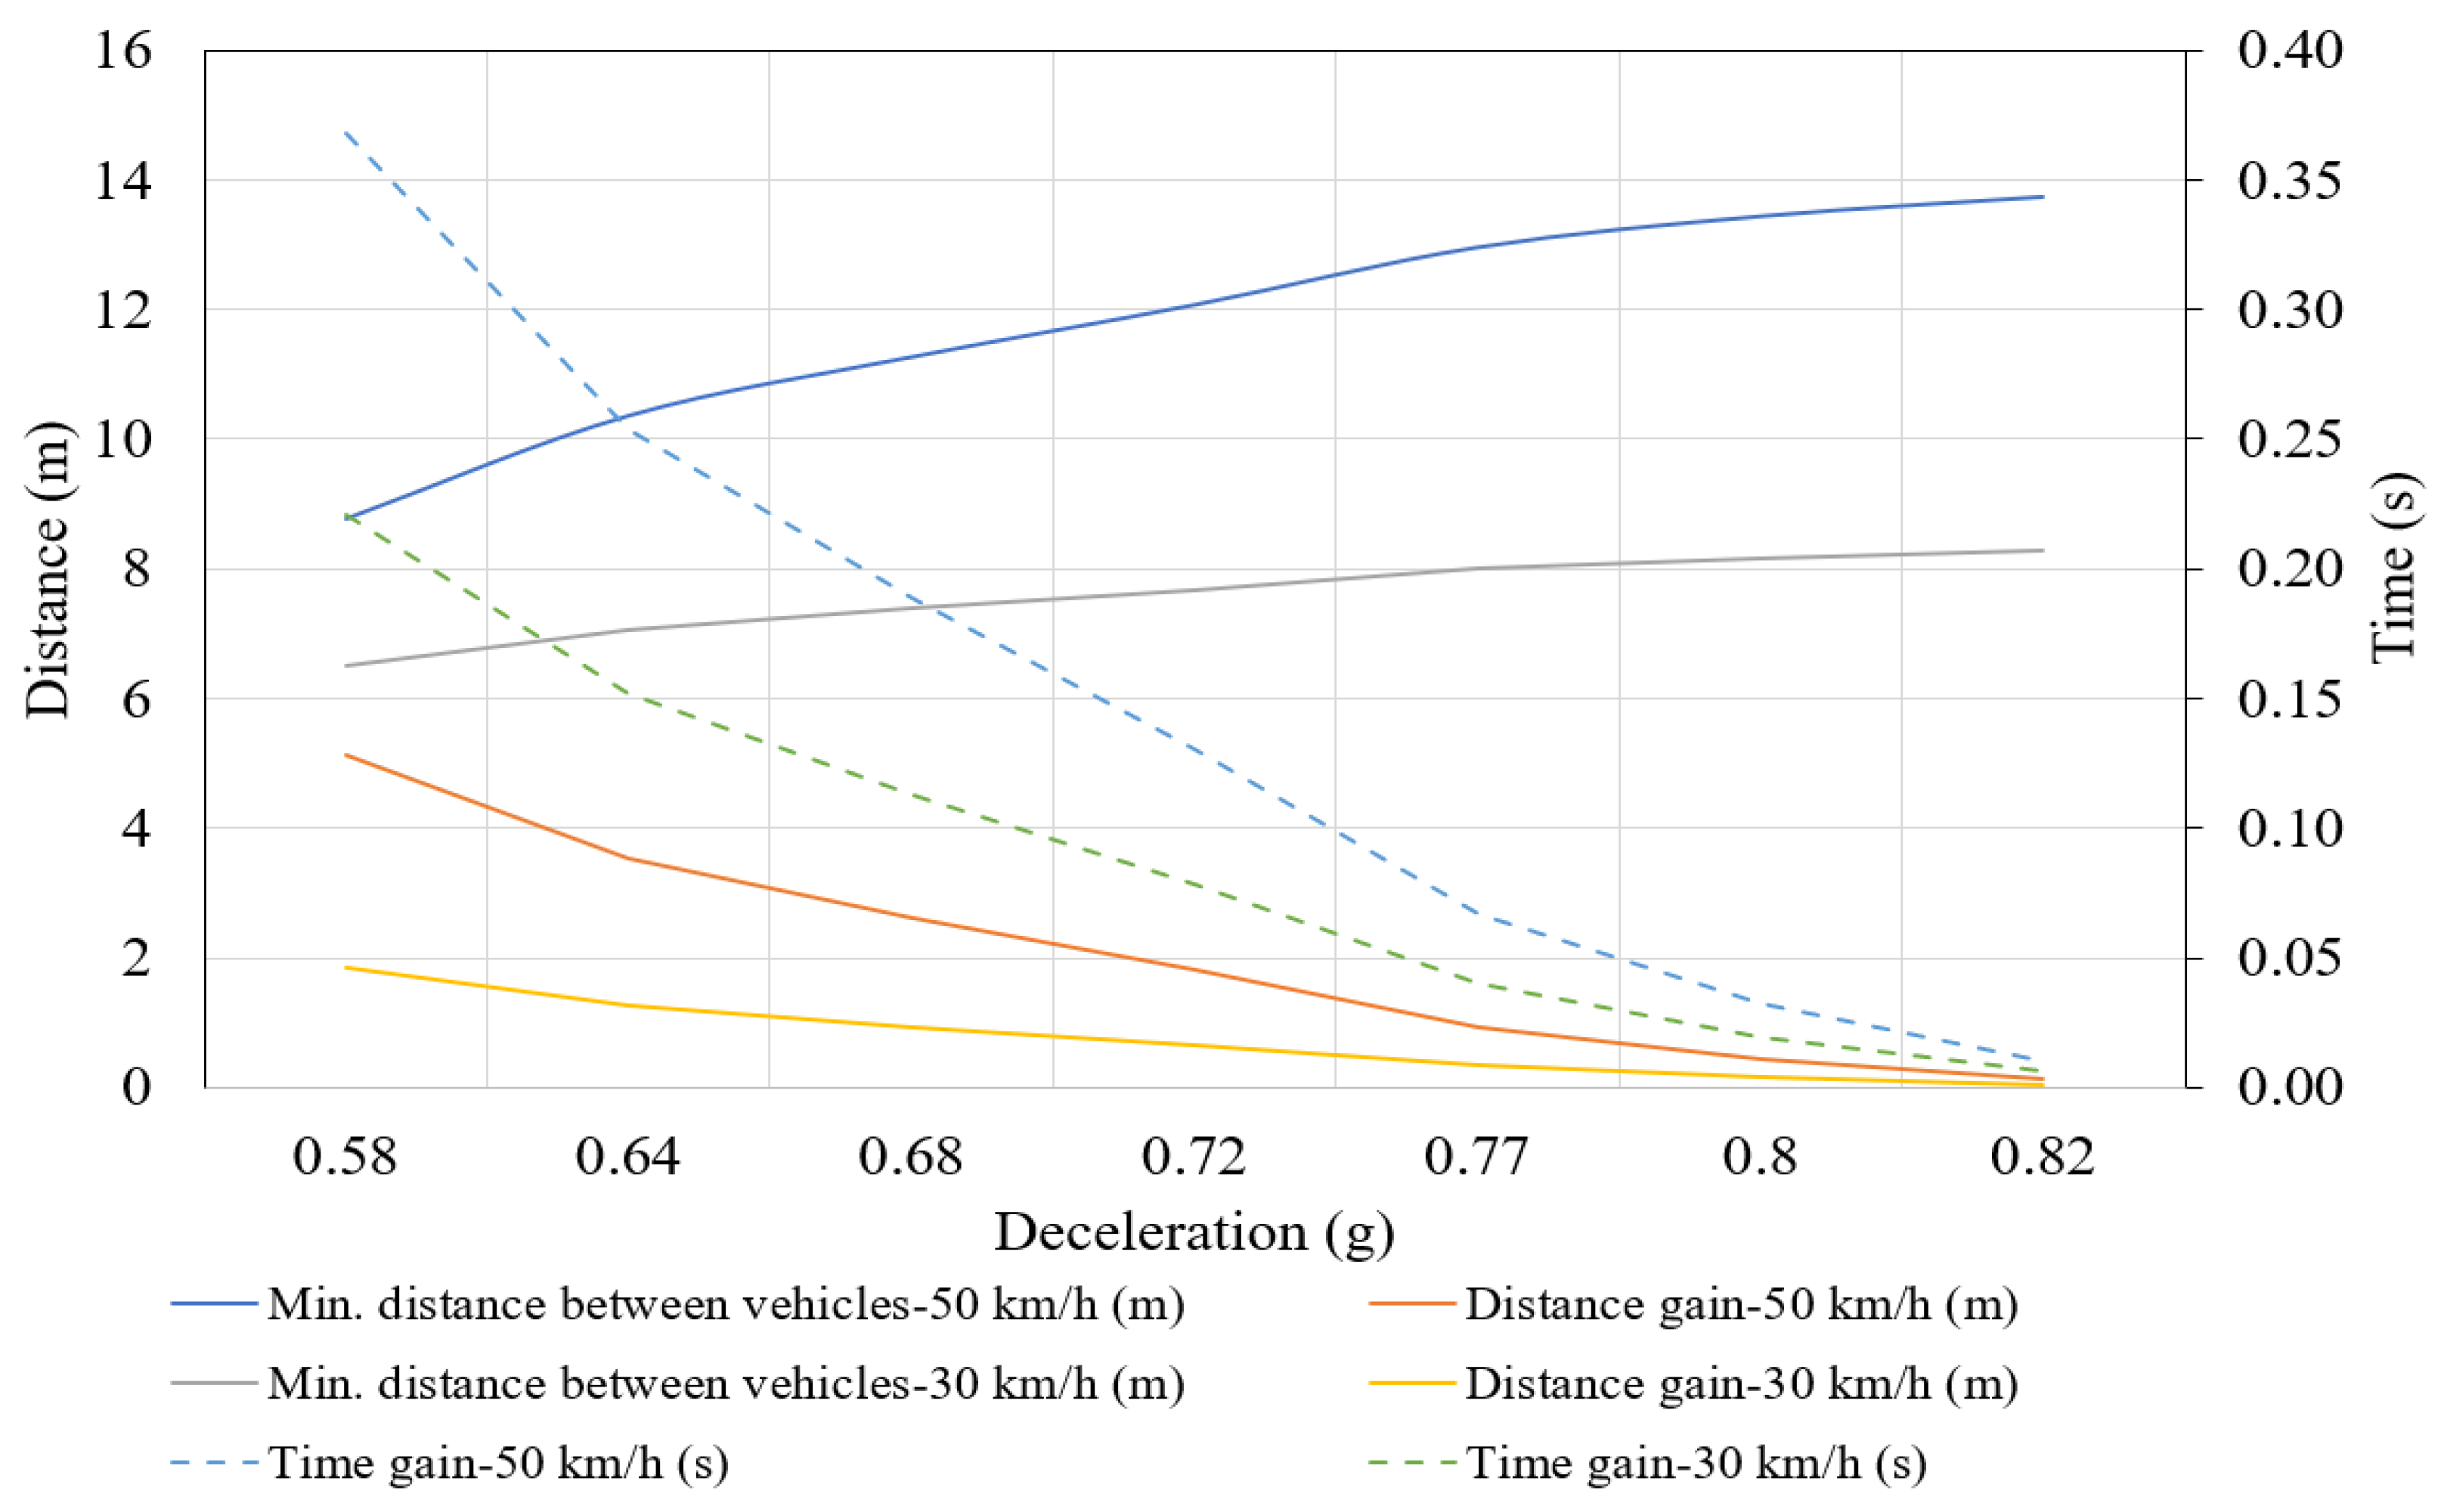
In emergency braking situations, the sudden deceleration response of the ego vehicle with onboard OPREVU-AES may result in the driver of a hypothetical vehicle not being able to react in time, causing a potential rear-end crash. The choice of partial pressure was then fostered by the increase in the minimum gap necessary to avoid a rear-end collision between them. Figure 12 shows how the evolution of the minimum distance would occur to avoid a possible impact between both vehicles and for there to be a gain in reaction time for the following driver, for different maximum deceleration values during emergency braking. Equal traffic speeds (30 km/h and 50 km/h) were considered for both vehicles, and the reaction time of the driver of the rear car was 1 s. The following vehicle brakes with the maximum deceleration (0.83 g) in both cases.
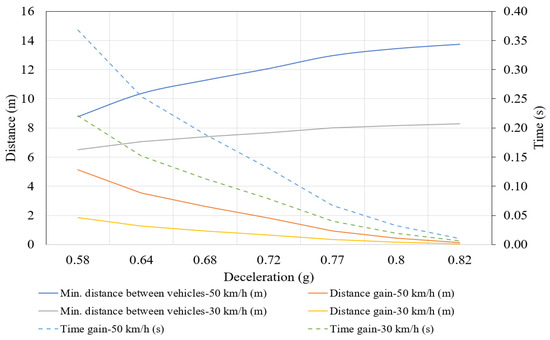
Figure 12.
Minimum distance between vehicles and distance and time gains, for 30 km/h and 50 km/h, after applying partial emergency braking.
In the case of the partial braking of the preceding vehicle, the minimum gap obtained with 70% of the maximum pressure is 1.27 m and 3.52 m for 30 km/h and 50 km/h, respectively. Both values represent 29.7% of the total braking distance at 0.83 g deceleration. Likewise, the driver of the following vehicle has a gain of 0.15 s at 30 km/h and 0.25 s at 50 km/h. Above 0.64 g, the minimum gap curves and the reaction time gain decrease more progressively; so, this deceleration value is optimal to ensure safe braking and less wear on the braking system.
3.2. Effectiveness of the Conventional AEB System and OPREVU-AES in the Reconstruction of Real Accidents
Each of the pedestrian accidents in the sample was reconstructed three times:
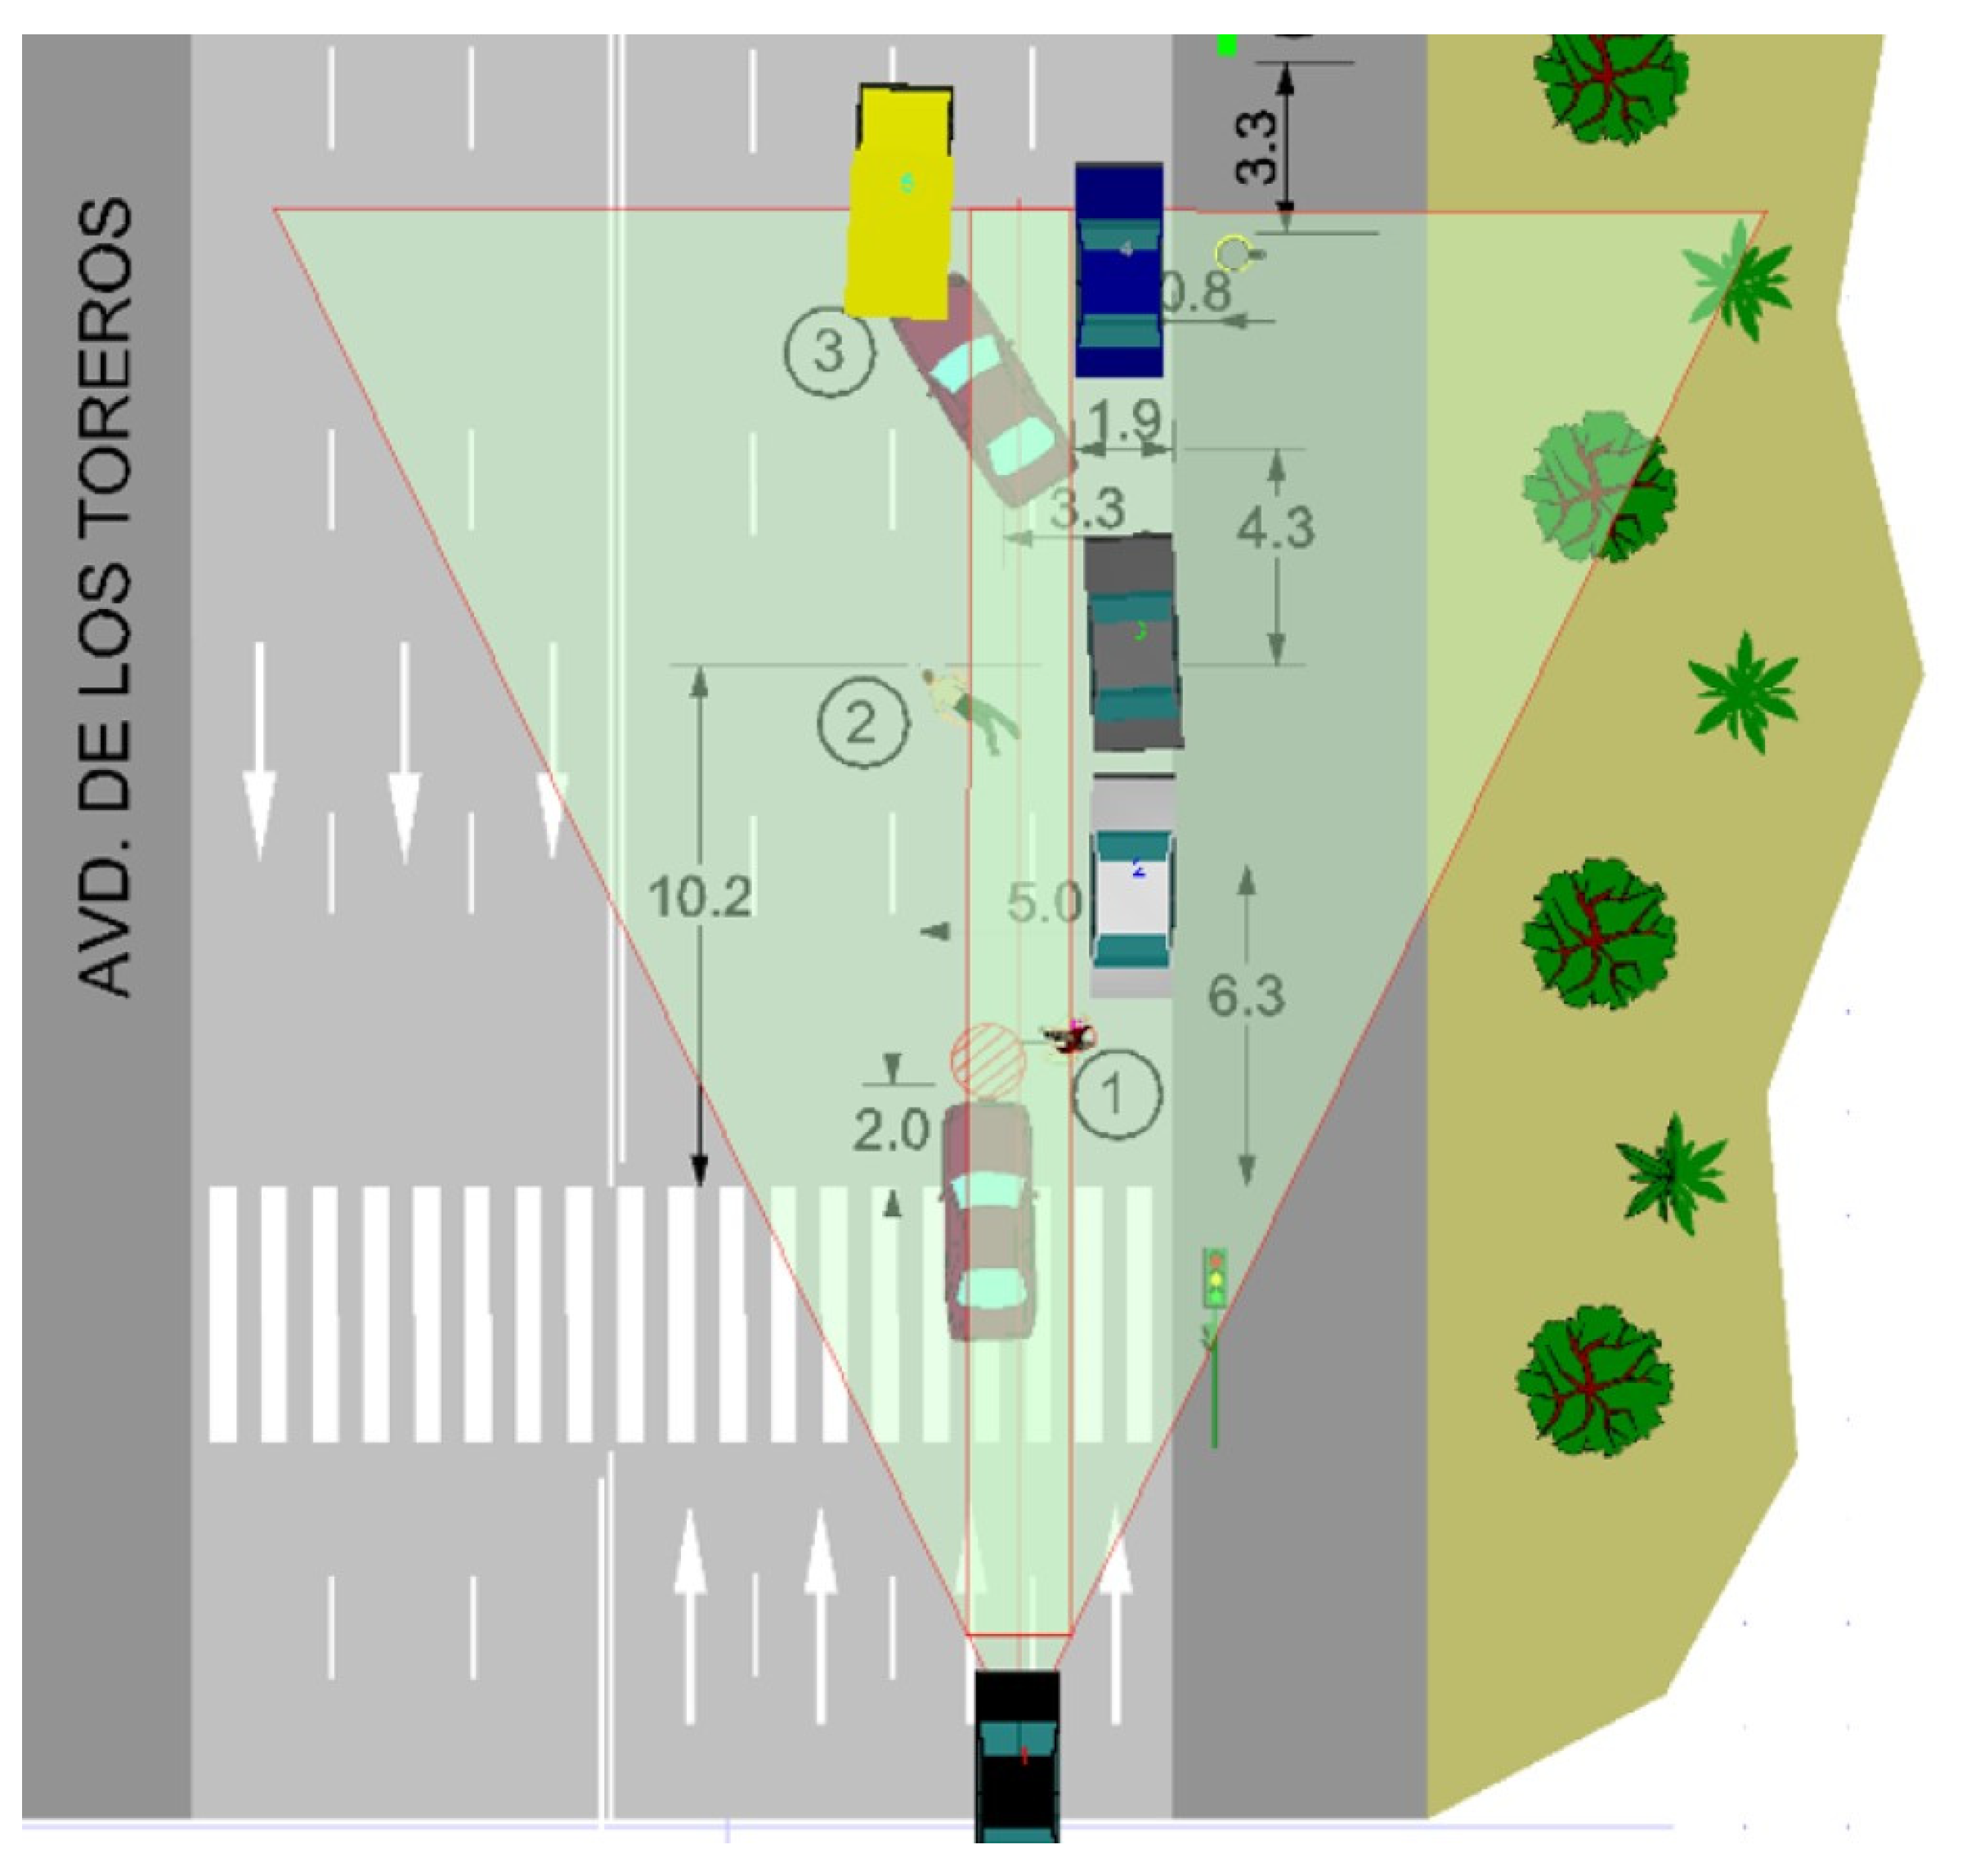
- Under real conditions. Figure 13 shows an example of one of the PCCrash© reconstruction scenarios, corresponding to one of the sample collisions. The zone in green corresponds to the detection and actuation range of on-vehicle commercial AEB and OPREVU-AES systems.
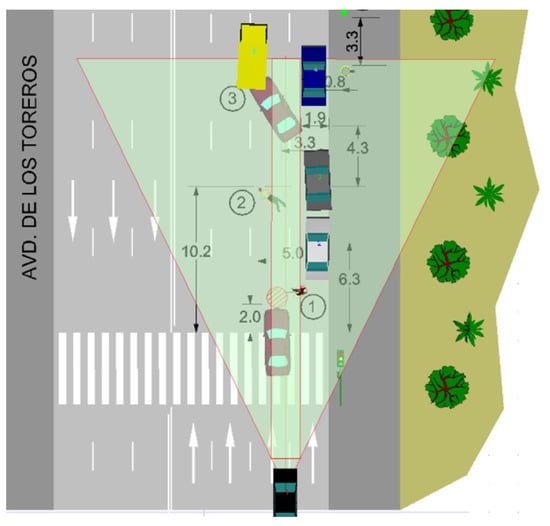 Figure 13. Simulation in PCCrash© of commercial AEB and OPREVU-AES for pedestrian collision reconstruction in one of the sample scenarios.
 - Considering the modification of the pre-crash phase through the installation of the commercial AEB system. After the emergency braking activation, new values for head impact speed (SH), WAD, and DA were calculated, and the new ISP indicator was estimated.
- Simulating the pre-crash phase by installing OPREVU-AES. In the event that, in a range between 12 m (minimum distance for overtaking) and 30 m (maximum sensor identification range), the distance required for braking is greater than the relative distance between the vehicle and the pedestrian (Dpv), the AES system initiates its operation. If, before reaching the 12 m relative distance, there is rear traffic or there are vehicles approaching head on from either side or both sides, the trajectory is canceled. In each case, the variation in the Sc, SH, WAD, DA, and ISP was evaluated.
3.3. Commercial AEB System
Starting from the reconstruction under real conditions, the pre-crash phase was generated by running the software backward and estimating Sa. Then, the autonomous braking function, which was present in the two systems proposed in this document (pre-crash phase in PCCrash©), was activated when a pedestrian entered the activation zone.
If Dstop < Dpv, the pedestrian collision could be avoided by installing the autonomous braking function. Otherwise, the new Sc value was calculated.
The AEB system made it possible to avoid 53.8% of the sample crashes; these were the cases in which Dstop < Dpv. Moreover, the average reduction in the Sc in these accidents was 62.7%.
This avoidance capacity was conditioned by the vehicle speed in the pre-collision stage and the pedestrian speed (since the pre-impact activation time is related to the instant when the pedestrian enters the narrow activation zone of the AEB system).
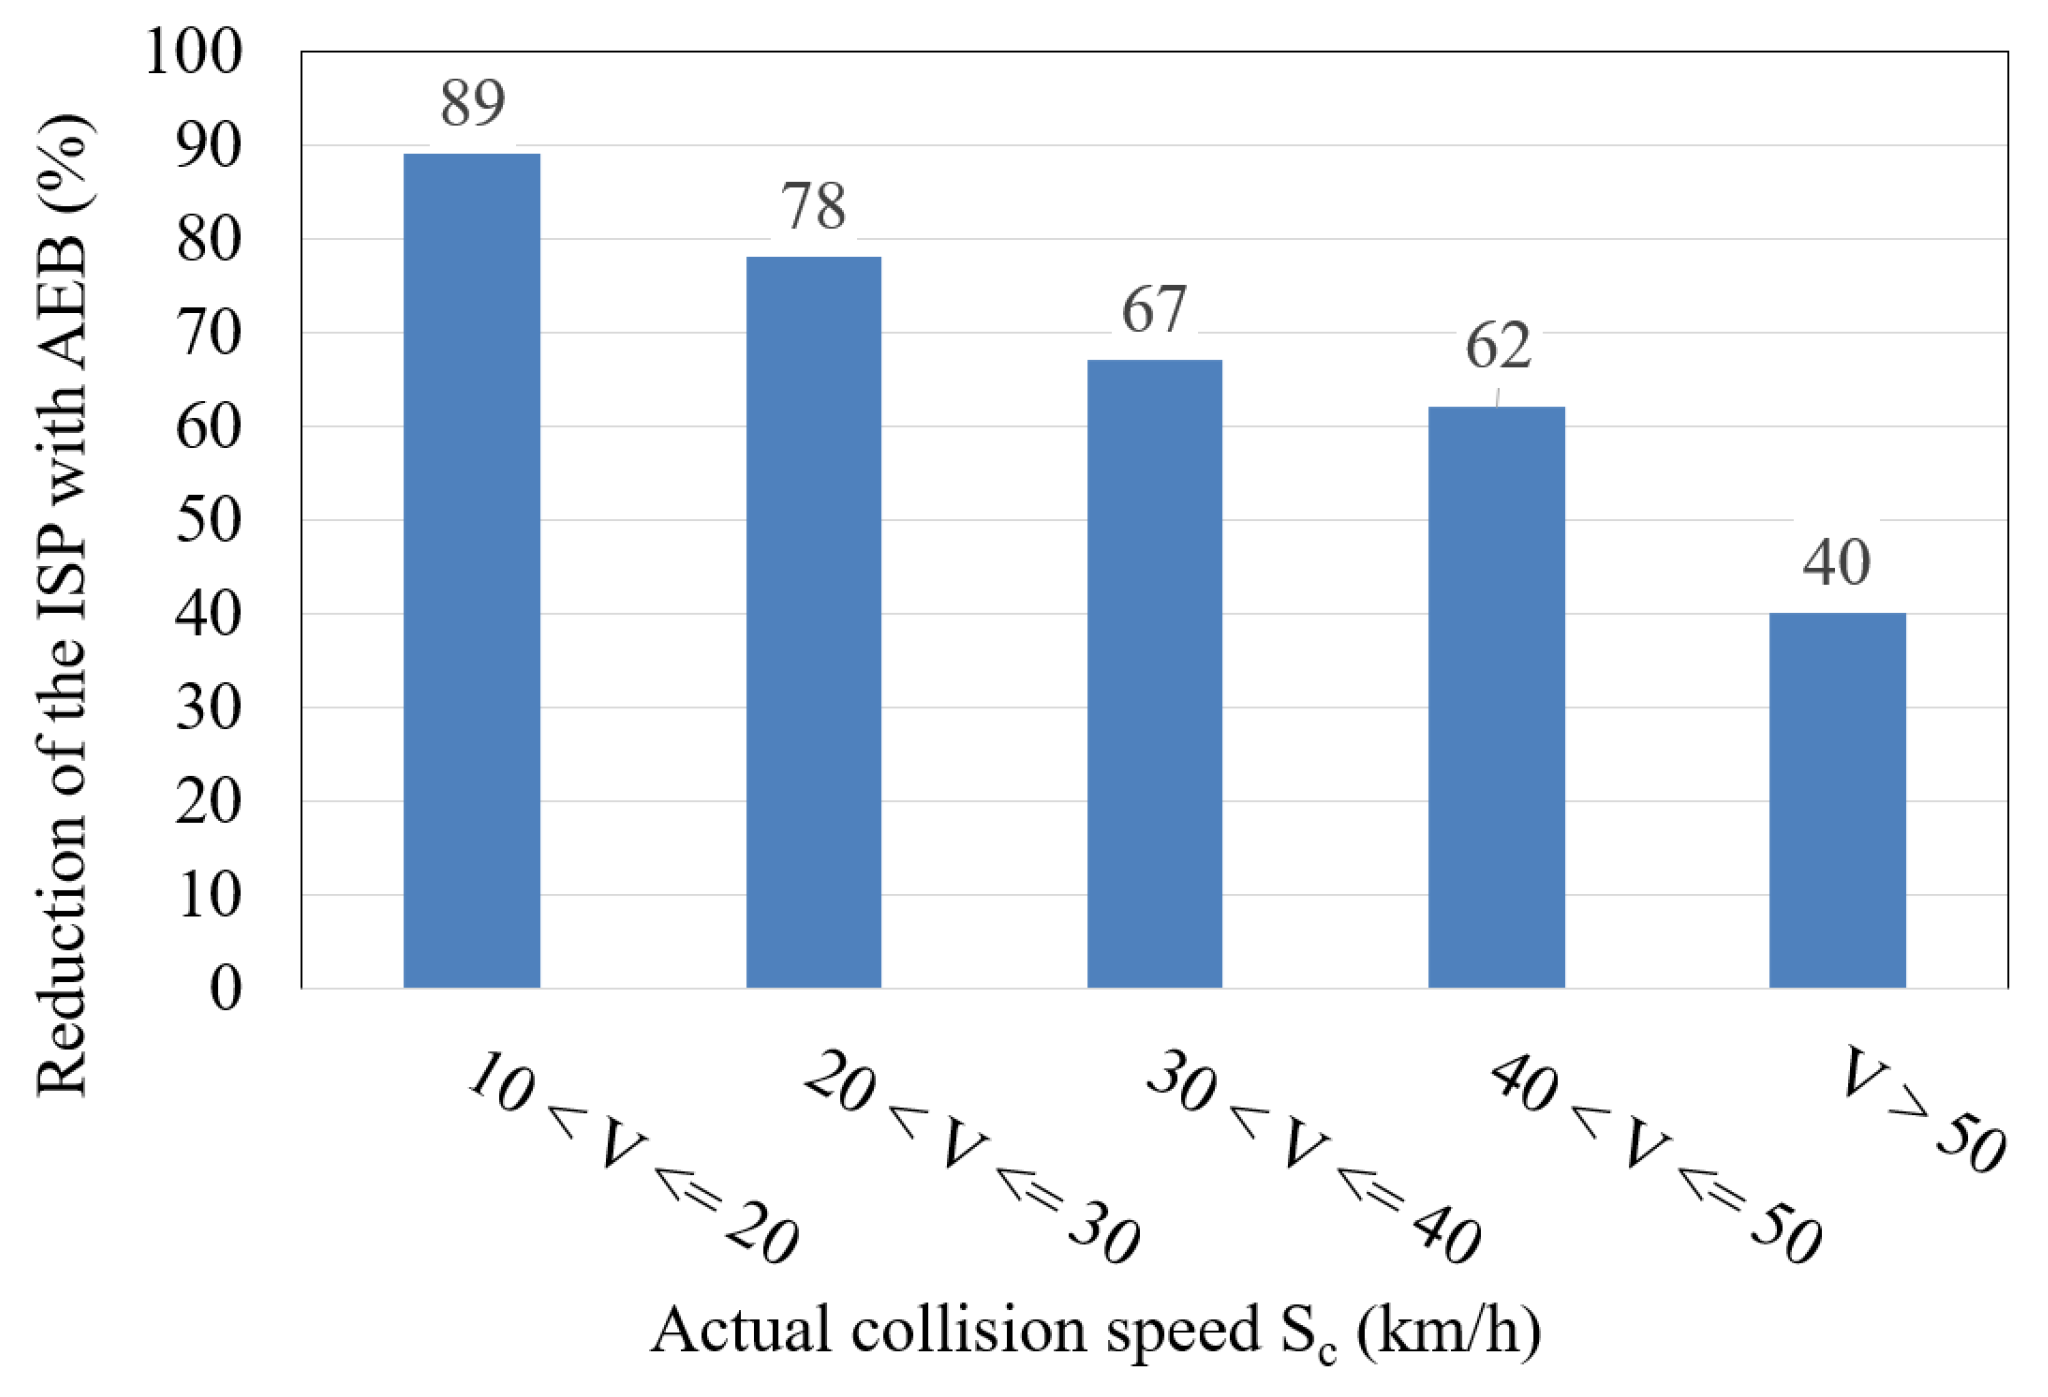
In addition to the above, the ability of the AEB system to reduce the probability of head injury severity (ISP) when considering the new pedestrian impact point and Sc after the AEB activation is shown in Figure 14. The average ISP reduction in the sample crashes was 65%, and in 64% of the samples, the ISP reduction exceeded 80%.
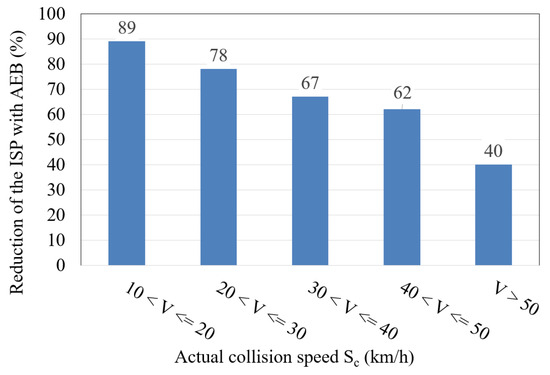
Figure 14.
Average ISP reduction by actual Sc ranges, after installation of the commercial AEB system.
3.4. OPREVU-AES
As OPREVU-AES incorporates the Autonomous Emergency Braking function of the AEB system, the effectiveness discussed in the preceding section also applies to the new avoidance system (53.8%).
When using only the commercial AEB system (Dstop > Dpv), 46.2% of the accidents in the sample could not have been avoided. Additionally, in 5% of the collisions, the infrastructure limitations of the single-lane roads prevented the drivers from performing an avoidance maneuver.
If the pedestrian accelerates or does not react, and considering the activation zone of the commercial AEB system, the automatic steering function of OPREVU-AES could additionally avoid 2.5% of the cases, plus an additional 3.5% if the pedestrian stops and steps backward (in those cases: Dpvmin < Dpv, Dstop > Dpv). Therefore, OPREVU-AES could prevent 53.8% of the cases plus 6% through the steering function, resulting in a total of 59.8%.
Taking into account the 5% of cases with infrastructural constraints, in the remaining cases (35.2%), the effectiveness of OPREVU-AES requires the extension of the lateral activation area to above 2 m.
If the activation zone is increased laterally up to 3 m, Dpv enlarges significantly and the possibility of conducting the evasive maneuver improves. This configuration could additionally avoid 8% of the pedestrian accidents when they accelerate or do not react and 16% when the pedestrian stops and moves backward (Dpvmin < Dpv, Dstop > Dpv) (Figure 15) through the steering function of OPREVU-AES. Consequently, OPREVU-AES could prevent up to 77.8% of all accidents.
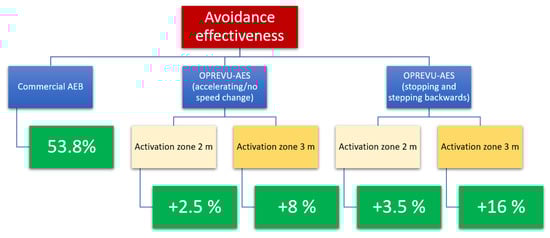
Figure 15.
Avoidance effectiveness of the commercial AEB and OPREVU-AES systems.
4. Discussion
The results show that the effectiveness of the OPREVU-AES system is higher than that of a conventional AEB system, with the difference being more noticeable if the original lateral activation distance is increased.
The limitations of this technology include limited space for maneuver execution, lack of integration with multimodal mapping systems (LIDAR and GNSS), and the limited longitudinal range of the camera. As future improvements, the potential implementation of V2P (vehicle-to-pedestrian) technology might integrate pedestrian trajectory prediction into collision probability models.
Traffic conditions (such as the presence of vehicles detected by the blind spot sensor or oncoming vehicles or other vulnerable users crossing the road) can impact OPREVU-AES’s effectiveness. Insufficient space and infrastructure complexity also compromise the overtaking performance, as autonomous steering is unfeasible on curved or single-lane roads, and the system would only be able to apply autonomous braking.
Nevertheless, in [34], the authors show that the small benefits of steering avoidance are not sufficient for its choice over braking avoidance due to the reduction in survivability at high speeds. The additional avoidance effectiveness due to the steering function (6%), in addition to the limitations cited above, would not justify its implementation unless the lateral activation area was increased to 3 m. Therefore, the automatic evasive function of OPREVU-AES could additionally avoid 24% of the cases.
Extending the activation zone is possible, despite the higher technological cost involved. It may also cause an increase in false alarms (interventions of the braking system or the AES when it is not necessary), disrupting normal driving or even causing unsafe situations. This is why it was decided to only extend to 3 m (0.5 m on each side), in order to reduce the likelihood of unwanted system interventions.
5. Conclusions
OPREVU-AES enables efficient braking and avoidance maneuvers with automatic steering control, ensuring vehicle stability during the entire overtaking maneuver through a low-computational-load algorithm (0.5 ms refresh rate). Furthermore, the predictive collision model, based on real user behaviors in potential collision situations in VR environments, allows for the regulation of the automatic braking response, making less wear on the braking system plausible.
The characteristics of the impact cell are also of great relevance. The effectiveness of the automatic braking function, which is present in both commercial AEB and OPREVU-AES, is verified by its ability to avoid 54% of the crashes analyzed and by the average ISP reduction of 65%.
The steering avoidance function of OPREVU-AES presents great potential for primary safety improvement, despite requiring a minimum relative distance for a safe execution. When the lateral activation area is 2 m, the autonomous steering function further reduces accident rates by 6%, bringing the OPREVU-AES effectiveness to 59.8%. When the lateral activation area is increased by up to 3 m, this number rises significantly, yielding a total effectiveness of 77.8%.
Although the avoidance results are promising, major infrastructural and technological limitations make the implementation of this system in the current commercial vehicle fleet complex and costly.
Future work by the authors will focus on three avenues of research: reconstruction and validation of OPREVU-AES in a more extensive database; further development at the software level (with special emphasis on vehicle-to-vehicle and vehicle-to-VRU communication); and optimization of the predictive collision algorithm (also including the assessment of cyclist behavior through testing with a VR bicycle simulator).
Author Contributions
Conceptualization, Á.L., F.J.P., F.L. and L.P.; methodology, Á.L., F.J.P. and L.P.; software, Á.L., F.J.P., F.L. and L.P.; validation, Á.L., F.J.P. and L.P.; formal analysis, Á.L.; investigation, Á.L., F.J.P., F.L. and L.P.; resources, F.J.P., F.L. and L.P.; data curation, Á.L.; writing—original draft, Á.L. and F.J.P.; writing—review and editing, Á.L., F.J.P., F.L. and L.P.; visualization, Á.L., F.J.P., F.L. and L.P.; supervision, Á.L. and F.J.P.; project administration, F.J.P.; funding acquisition, F.J.P. All authors have read and agreed to the published version of the manuscript.
Funding
This research was funded by the Project OPREVU Grant RTI2018-096617-B-100 funded by MCI/AEI/10.13039/501100011033/ “ERDF A way of making Europe”, EU; by the Project VULNEUREA Grant PID2021-122290OB-C21 funded by MCIN/AEI/10.13039/501100011033/ “ERDF A way of making Europe”, EU; and partially funded by the Community of Madrid (S2018/EMT-4362) SEGVAUTO-4.0-CM.
Informed Consent Statement
Informed consent was obtained from all subjects involved in the study.
Data Availability Statement
Not applicable.
Acknowledgments
This study benefited from the research activities developed by INSIA-UPM and CEDINT-UPM within the OPREVU project, the VULNEUREA project, and the SEGVAUTO-4.0-CM scientific programme. The authors would like to thank Hyundai Motor España S.L.U., the Spanish Traffic Police and Dirección General de Tráfico (DGT) for their contribution.
Conflicts of Interest
All authors report financial support from Projects OPREVU, VULNEUREA, and partially by SEGVAUTO-4.0-CM.
References
- Zhou, Z.; Peng, Y.; Cai, Y. Vision-based Approach for Predicting the Probability of Vehicle–Pedestrian Collisions at Intersections. IET Intell. Transp. Syst. 2020, 14, 1447–1455. [Google Scholar] [CrossRef]
- Losada, Á.; Páez, F.J.; Francisco, L.; Luque, P.; Herrero Villamor, J.J. Santamaría, Asunción Improvement of the AEB Activation Algorithm Based on the Pedestrian Reaction. In Proceedings of the FISITA World Congress 2021-Technical Programme, Virtual Congress, 30 September 2021. [Google Scholar]
- Keller, C.G.; Gavrila, D.M. Will the Pedestrian Cross? A Study on Pedestrian Path Prediction. IEEE Trans. Intell. Transp. Syst. 2014, 15, 494–506. [Google Scholar] [CrossRef]
- Chae, H.; Kang, C.M.; Kim, B.; Kim, J.; Chung, C.C.; Choi, J.W. Autonomous Braking System via Deep Reinforcement Learning. arXiv 2017, arXiv:1702.02302. [Google Scholar] [CrossRef]
- Kilicarslan, M.; Zheng, J.Y. Detecting Walking Pedestrians from Leg Motion in Driving Video. In Proceedings of the 17th International IEEE Conference on Intelligent Transportation Systems (ITSC), Qingdao, China, 8–11 October 2014; pp. 2924–2929. [Google Scholar]
- Euro NCAP TEST PROTOCOL–AEB/LSS VRU Systems. Version 4.3. Available online: https://cdn.euroncap.com/media/75436/euro-ncap-aeb-lss-vru-test-protocol-v43.pdf (accessed on 21 December 2022).
- Isermann, R.; Schorn, M.; Stählin, U. Anticollision System PRORETA with Automatic Braking and Steering. Veh. Syst. Dyn. 2008, 46, 683–694. [Google Scholar] [CrossRef]
- Ackermann, C.; Isermann, R.; Min, S.; Kim, C. Collision Avoidance with Automatic Braking and Swerving. IFAC Proc. Vol. 2014, 47, 10694–10699. [Google Scholar] [CrossRef]
- Ferdinand, J.; Yi, B. Trajectory Planning for Collision Avoidance in Urban Area. In Proceedings of the 2016 IEEE Intelligent Vehicles Symposium (IV), Gotenburg, Sweden, 19–22 June 2016; pp. 202–207. [Google Scholar]
- Fernandez Llorca, D.; Milanes, V.; Parra Alonso, I.; Gavilan, M.; Garcia Daza, I.; Perez, J.; Sotelo, M.Á. Autonomous Pedestrian Collision Avoidance Using a Fuzzy Steering Controller. IEEE Trans. Intell. Transp. Syst. 2011, 12, 390–401. [Google Scholar] [CrossRef]
- Keller, C.G.; Dang, T.; Fritz, H.; Joos, A.; Rabe, C.; Gavrila, D.M. Active Pedestrian Safety by Automatic Braking and Evasive Steering. IEEE Trans. Intell. Transp. Syst. 2011, 12, 1292–1304. [Google Scholar] [CrossRef]
- Kwon, J.-H.; Kim, J.; Kim, S.; Cho, G.-H. Pedestrians Safety Perception and Crossing Behaviors in Narrow Urban Streets: An Experimental Study Using Immersive Virtual Reality Technology. Accid. Anal. Prev. 2022, 174, 106757. [Google Scholar] [CrossRef]
- Deb, S.; Carruth, D.W.; Sween, R.; Strawderman, L.; Garrison, T.M. Efficacy of Virtual Reality in Pedestrian Safety Research. Appl. Ergon. 2017, 65, 449–460. [Google Scholar] [CrossRef]
- Nie, B.; Li, Q.; Gan, S.; Xing, B.; Huang, Y.; Li, S.E. Safety Envelope of Pedestrians upon Motor Vehicle Conflicts Identified via Active Avoidance Behaviour. Sci. Rep. 2021, 11, 3996. [Google Scholar] [CrossRef]
- Yao, J.; Yang, J.; Otte, D. Investigation of Head Injuries by Reconstructions of Real-World Vehicle-versus-Adult-Pedestrian Accidents. Saf. Sci. 2008, 46, 1103–1114. [Google Scholar] [CrossRef]
- CENTRO ZARAGOZA; INSIA; Applus IDIADA; SERNAUTO. Investigación En La Protección de Peatones a Partir Del Estudio En Profundidad de Accidentes de Tráfico. 2008. Available online: http://www.centro-zaragoza.com:8080/web/sala_prensa/revista_tecnica/hemeroteca/articulos/R37_A10.pdf (accessed on 18 December 2022).
- ISO 13232-5:2005; Motorcycles—Test and Analysis Procedures for Research Evaluation of Rider Crash Protective Devices Fitted to Motorcycles—Part 5: Injury Indices and Risk/Benefit Analysis. International Organization for Standardization: Geneva, Switzerland, 2005.
- Losada, Á.; Páez, F.J.; Luque, F.; Piovano, L. Application of Machine Learning Techniques for Predicting Potential Vehicle-to-Pedestrian Collisions in Virtual Reality Scenarios. Appl. Sci. 2022, 12, 11364. [Google Scholar] [CrossRef]
- Badea-Romero, A.; Javier Páez, F.; Furones, A.; Barrios, J.M.; de-Miguel, J.L. Assessing the Benefit of the Brake Assist System for Pedestrian Injury Mitigation through Real-World Accident Investigations. Saf. Sci. 2013, 53, 193–201. [Google Scholar] [CrossRef]
- Moser, A.; Hoschopf, H.; Steffan, H.; Kasanicky, G. Validation of the PC-Crash Pedestrian Model. SAE Trans. 2000, 109, 1316–1339. [Google Scholar]
- Wdowicz, D.; Ptak, M. Numerical Approaches to Pedestrian Impact Simulation with Human Body Models: A Review. Arch. Computat. Methods Eng. 2023, 30, 4687–4709. [Google Scholar] [CrossRef]
- Benjumea, A.C. Datos Antropométricos de La Población Laboral Española. Prevención Trab. Y Salud Rev. Inst. Nac. Segur. E Hig. Trab. 2001, 14, 22–30. [Google Scholar]
- Ministry of Health and Consumer Affairs, Spanish Government. Estudio Antropométrico de La Población Femenina En España; Ministry of Health and Consumer Affairs, Spanish Government: Madrid, Spain, 2008.
- Untaroiu, C.D.; Crandall, J.R.; Takahashi, Y.; Okamoto, M.; Ito, O.; Fredriksson, R. Analysis of Running Child Pedestrians Impacted by a Vehicle Using Rigid-Body Models and Optimization Techniques. Saf. Sci. 2010, 48, 259–267. [Google Scholar] [CrossRef]
- Elvik, R.; Høye, A.; Vaa, T.; Sørensen, M. (Eds.) The Handbook of Road Safety Measures; Emerald Group Publishing Limited: Bingley, UK, 2009; ISBN 978-1-84855-250-0. [Google Scholar]
- Eriksson, A.; Stanton, N.A. Takeover Time in Highly Automated Vehicles: Noncritical Transitions to and From Manual Control. Hum. Factors 2017, 59, 689–705. [Google Scholar] [CrossRef]
- Steffan Datentechnik PC-CRASH: A Simulation Program for Vehicle Accidents 2013. Available online: https://dsd.at/images/download/PCCManual100E.pdf (accessed on 15 January 2023).
- Rosén, E.; Sander, U. Pedestrian Fatality Risk as a Function of Car Impact Speed. Accid. Anal. Prev. 2009, 41, 536–542. [Google Scholar] [CrossRef]
- Euro NCAP Pedestrian Testing Protocol. Version 8.4. Available online: https://cdn.euroncap.com/media/32288/euro-ncap-pedestrian-testing-protocol-v84.pdf (accessed on 24 March 2022).
- Cheng, R.; Pan, Y.; Xie, L. Analysis of Vehicle-Pedestrian Accident Risk Based on Simulation Experiments. Math. Probl. Eng. 2022, 2022, 7891232. [Google Scholar] [CrossRef]
- Min, Y.; Fengxiang, X.; Junhao, W.; Xuefeng, Z. Injury Analysis of Vehicle-Pedestrian Collision Based on Orthogonal Experiments. Comput. Syst. Sci. Eng. 2020, 35, 173–181. [Google Scholar] [CrossRef]
- Kuehn, M.; Froeming, R.; Schindler, V. Assessment of Vehicle Related Pedestrian Safety; ESV Paper: Washington, DC, USA, 2005. [Google Scholar]
- Official Journal of the European Union Acts Adopted by Bodies Created by International Agreements. Regulation No 13-H of the Economic Commission for Europe of the United Nations (UN/ECE). Available online: https://eur-lex.europa.eu/legal-content/EN/TXT/PDF/?uri=CELEX:22020D0051&from=EL (accessed on 7 August 2022).
- Robinson, M.D.; Beal, C.E.; Brennan, S.N. At What Cost? How Planned Collisions with Pedestrians May Save Lives. Accid. Anal. Prev. 2020, 141, 105492. [Google Scholar] [CrossRef] [PubMed]


Disclaimer/Publisher’s Note: The statements, opinions and data contained in all publications are solely those of the individual author(s) and contributor(s) and not of MDPI and/or the editor(s). MDPI and/or the editor(s) disclaim responsibility for any injury to people or property resulting from any ideas, methods, instructions or products referred to in the content. |
© 2023 by the authors. Licensee MDPI, Basel, Switzerland. This article is an open access article distributed under the terms and conditions of the Creative Commons Attribution (CC BY) license (https://creativecommons.org/licenses/by/4.0/).