Abstract
The positional deviation of the in-vehicle Automatic Emergency Call System (AECS) under collision conditions brings difficulties for Intelligent Connected Vehicles (ICVs) post rescue operations. Currently, there is a lack of analysis on system operating conditions during collisions in the reliability assessment methods for the Global Navigation Satellite System (GNSS) deployed in the AECS. Therefore, this paper establishes an in-vehicle collision environment simulation model for emergency calls to explore the influence of parameters such as temperature and vibration on Signal-Based In-Vehicle Emergency Call Systems. We also propose environmental limits applicable to comprehensive tests, which can objectively evaluate reliability and provide data support for the AECS bench test through a satellite-signal-based semi-physical simulation, which is subjected to a bench test under different operating conditions. The findings of this study demonstrate that the occurrence of random vibration and impact stress, induced by vibration, exerts considerable disruptive effects on positional signal data during collisions. Consequently, it leads to substantial interference with the accurate detection of post-collision satellite positioning information. When the simulation operates under a 2.4 gRMS vibration condition, the maximum phase noise error in the positioning system is 8.95%, which does not meet the test accuracy requirements. On the other hand, the semi-simulation system is less affected by temperature changes, and at the maximum allowable temperature difference of the equipment, the maximum phase noise error in the simulated signal is 2.12%. Therefore, based on the influence of phase noise variation on the accuracy of the satellite signal simulation, necessary environmental conditions for the test are obtained, including a temperature that is consistent with the maximum operating temperature of the vector generator and a vibration power spectral density (PSD) lower than 1.2 gRMS.
1. Introduction
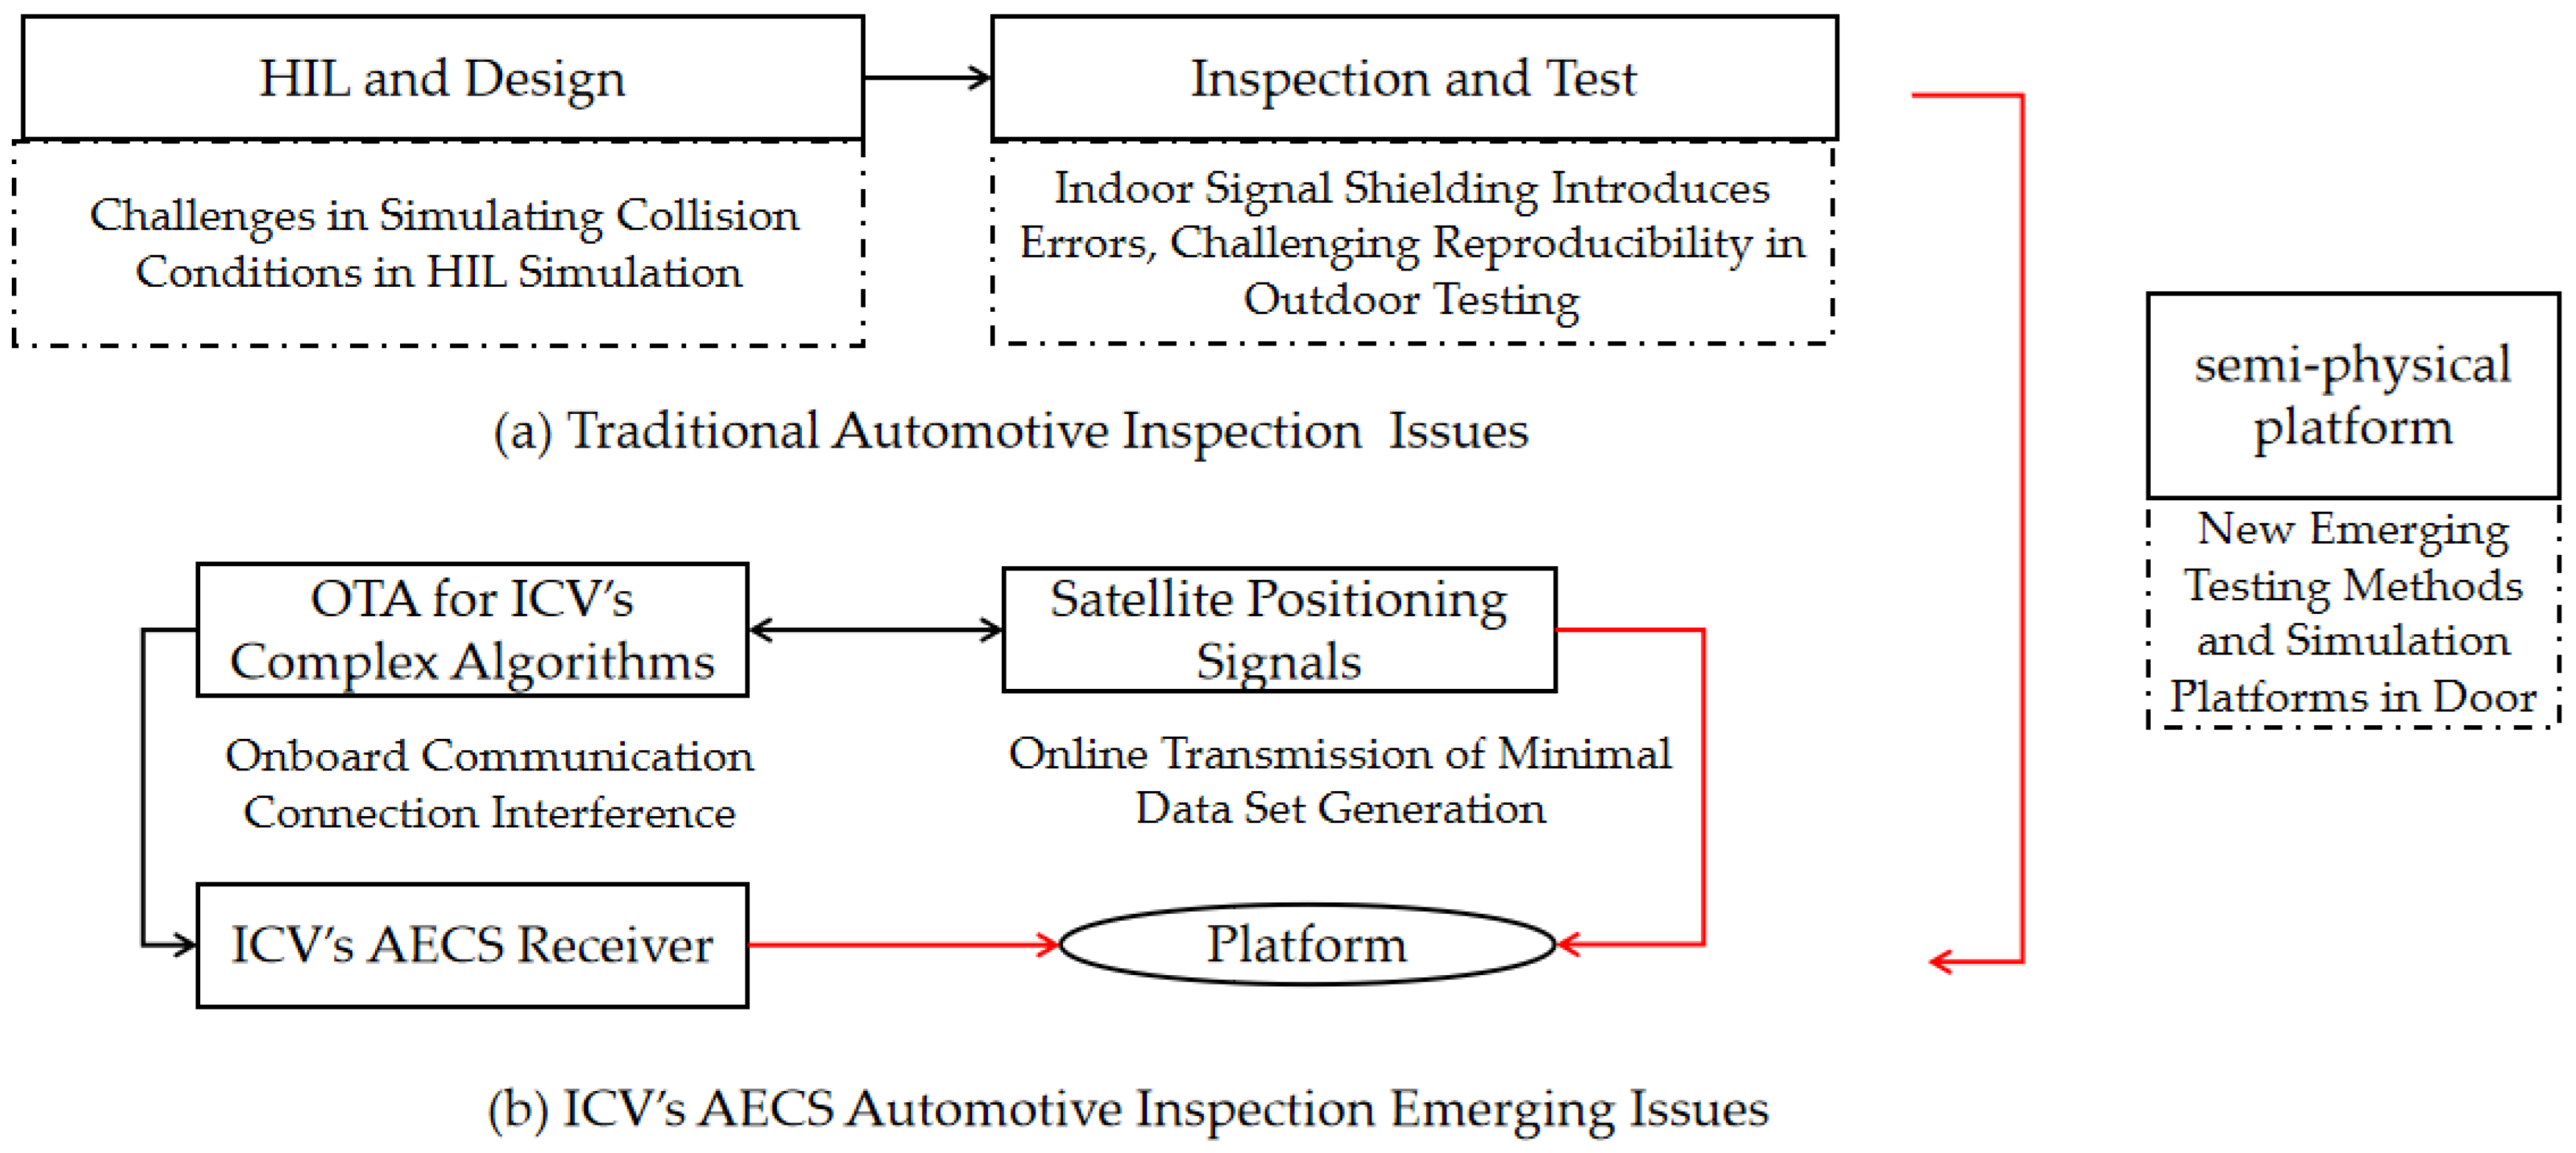
With the standardized promotion of in-vehicle Automatic Emergency Call Systems (AECSs), in-vehicle emergency mobile communication has become an essential component of vehicle safety assurance. The testing and experimentation of AECSs have also become important research directions in the field of Intelligent Connected Vehicles (ICVs) [1,2]. In recent years, with the development of mobile communication technologies (2G~5G) and the capabilities of Global Navigation Satellite Systems (GNSSs), the functionality of AECSs has become increasingly comprehensive. Therefore, in order to assess the performance of an AECS more comprehensively, it is necessary to conduct research on testing methods and establish a robust performance evaluation system. The function of an AECS is to acquire and transmit accurate vehicle location information after an accident, ensuring its trigger ability and compliance with international standards. The reliability of communication connections and the transmission of the Minimum Set of Data (MSD) are the focal points of system testing [3]. However, during the transmission of the MSD, the GNSS signals received by the positioning system are susceptible to interference and spoofing; in Figure 1b, the AECS-related testing for the ICV test is compared to the traditional Hardware-in-the-Loop (HIL) testing in (a), where the establishment of communication connections is constrained by the accident environment. As a result, there is a significant gap between the actual AECS verification and certification and the system’s performance under real accident conditions, further affecting the authenticity of the tests. Moreover, conducting complex real vehicle tests presents challenges in ensuring reproducibility. Therefore, there is a need to integrate accident scenarios and communication transmission reliability in the research of AECS tests and verification methods for ICVs.
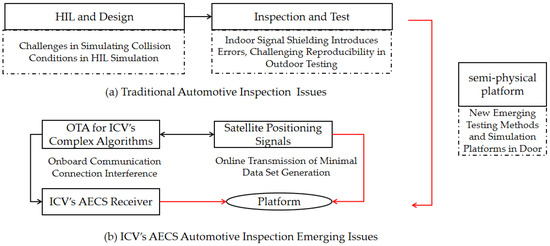
Figure 1.
Main change in ICV’s AECS testing.
Currently, Intelligent Connected Vehicles (ICVs) have made significant breakthroughs in system integration capabilities such as data exchange, positioning accuracy, and sensor utilization [4,5,6]. On the one hand, there have been improvements in the quantity and accuracy of data transmission, enabling the system to provide more comprehensive and accurate descriptions of emergency situations. On the other hand, the increased demand for system reliability arises from the sophisticated devices needed to understand accident scenarios and meet other requirements in both in-vehicle and cloud-based intelligent devices. With the upgrading of communication link establishment methods, countries are advancing the standardization of the next-generation ECALL system [7]. In this context, ICV leverages advanced positioning and navigation technologies, such as Global Navigation Satellite Systems (GNSSs), inertial navigation systems, and high-precision map data [8,9], to achieve more precise positioning and navigation capabilities. Studying the system’s performance under various environmental conditions can help in evaluating the adaptability and robustness of an AECS. In exploring performance indicators for system positioning, most researchers focus on the impact of receiver and antenna performance and the errors generated by GNSS calculations [10]. For example, Chen employed an extended Kalman filter and designed a GNSS positioning algorithm based on error states to improve vehicle positioning accuracy [11]. However, during ICV AECS tests, real positioning information is simulated by generating positioning signals. Distortions in these signals may lead to failures in emergency call tests after collisions, rendering the assessment of positioning performance unreasonable and affecting the normal evaluation of ECALL receiver performance.
Currently, the common approach used to study the reliability of an AECS involves comparing the data received and transmitted during simulated and real vehicle collision tests with the laboratory coordinate position [12]. The reliability of the tested vehicle’s correct positioning is examined by verifying the transmission of the Minimum Set of Data (MSD) to the Public Safety Answering Point (PSAP) and establishing a reliable communication link [13]. Although relying solely on data from real vehicle collision tests can provide certain experimental results, these data fail to comprehensively cover various emergency situations, and a single scenario cannot simulate other emergency events. Testing based solely on the PSAP and communication link establishment cannot comprehensively assess the overall performance of an in-vehicle AECS, making it difficult to obtain key indicators such as the response time, system reliability, and positioning accuracy. This poses challenges for conducting AECS inspections and evaluations.
An AECS is directly related to vehicle collision conditions, and the research on vehicle collisions includes real vehicle experiments, collision numerical simulations, collision strategies, and vehicle navigation rules. The establishment of collision models primarily focuses on numerical simulation and data analysis. Yin conducted simulation tests using a control strategy that considers distance and acceleration compensation to study the collision safety distance model and provide collision patterns for different parameters [14]. Sun used deep reinforcement learning to construct a vehicle collision risk assessment model and updated strategies in a partially observable training environment to predict collision conditions [15]. However, vehicle collision research involves complex traffic environments and driving decision making in various scenarios. Numerical simulation methods face challenges in acquiring annotated data, relying on incorrect domain knowledge, and being limited by data quality issues. Therefore, some scholars have started to establish simulation platforms for Intelligent Connected Vehicles [13,16,17]. These platforms utilize embedded systems, real-time decision-making platforms, control strategies [18], and vehicle dynamics and address data acquisition challenges for special conditions while also addressing emergency communication [19].
Furthermore, conducting collision tests on Intelligent Connected Vehicles is costly, and the control process is variable, which limits their application in large-scale testing and evaluation. It becomes challenging to comprehensively test and simulate the system, as well as simulate various emergency situations and evaluate the system’s responsiveness in different scenarios. In this regard, in-vehicle simulation provides a solution by rapidly establishing virtual collision scenarios, flexibly adjusting collision parameters, and facilitating the creation of complex models in conjunction with physical components. Wang proposed a general model considering the cooperative interaction between humans, vehicles, and the road environment, and used this model to study vehicle collision warning algorithms [20]. Some researchers have focused on studying the factors affecting the vehicle operating environment. Rana, Shohel established a monitoring system based on road surface vibration characterized by roughness parameters using vehicle dynamics and parameter estimation methods to build a data acquisition platform [21]. On the other hand, in terms of collision data research, Novat Norris employed machine learning methods based on Bayesian inference to statistically analyze the field data of collisions involving autonomous vehicles [22]. Chen, on the other hand, developed a collision prediction model using a GA-optimized neural network, with six parameters related to collisions selected as inputs to predict collision severity. The model also accounted for the impact of vehicle-to-vehicle communication [23]. However, there are few comprehensive studies that combine environmental factors with the transmission of positioning information in an AECS. Therefore, by leveraging the characteristics of in-vehicle simulation, a semi-physical simulation system can be established to simulate various environmental conditions realistically while ensuring stable triggering of the vehicle. This approach can harness the advantages of collision simulations and software simulations, generate random or specific positioning information through the simulation of the Global Navigation Satellite System (GNSS) [24,25,26], and address the challenges of real vehicle testing and multi-scenario testing [27].
This paper primarily focuses on the research of AECS test methods based on satellite signal simulation. It aims to establish a semi-physical simulation platform for vehicle emergency calls. The system’s phase noise is the main analysis object. The causes of phase noise are further analyzed, and experimental designs are employed for verification. The simulated experimental results are recorded and analyzed under different environmental conditions, such as temperature and vibration. The objective is to simulate the impact of various environmental parameters on signal propagation and reception. This research aims to assess the performance and reliability of an AECS under different environmental conditions.
2. Causes and Simulation Modeling of System Errors
The AECS test significantly differs from traditional communication tests due to its incorporation of multiple factors of interference within a real vehicle collision environment. These factors include the environmental temperature, impact loads, and random loads. In the simulation testing platform, we comprise both bench tests and signal simulation components. The satellite signal simulation enables the system to replicate position signals under simulated real vehicle collision conditions. These generated signals impact the performance of RF connectors and internal electronic components within the signal generation system, and they are susceptible to mechanical vibration and random vibration. The impact loads place stress on the local oscillator generator in the signal generation system, resulting in unstable short-term oscillator frequencies. Furthermore, the environmental temperature and accompanying thermal stress contribute to system instability. It is important to note that the influences arising from these testing conditions exhibit a linear correlation with time [28,29].
When constructing an error model for satellite signal simulation and emulation systems, it is important to emphasize that “simulation” typically refers to the use of computer models to replicate the behavior of satellite signals and simulate the environment of emergency call systems. On the other hand, “emulation” focuses more on replicating the operation of satellite signal systems, including the emulation of satellite signal transmission and reception, as well as the actual execution of hardware and software in a simulated environment. It is essential to consider various factors that contribute to simulating system errors. These factors include frequency errors, time-based synchronization errors, phase errors of different components, clock errors, and power errors. Consequently, it becomes necessary to analyze the influence of the experimental environment on frequency and phase parameters.
2.1. Frequency Errors Generated by the Environment
In the investigation of error factors in satellite signal simulation and emulation systems, frequency error emerges as a crucial parameter. During real vehicle collision tests, the impact load exhibits a nonlinear effect on the crystal structure of the oscillators within the satellite signal generation system, thereby causing frequency fluctuations [30]. The dominant frequency of the generated signal typically falls within a specific range. To characterize the influence of vehicle-collision-induced vibrations on the system’s frequency [31], the upper limit of the frequency distribution and the maximum stress are examined. Moreover, the impact of stress on the crystal’s frequency response in a single-degree-of-freedom system can be approximated as a linear or nearly linear relationship between stress and the frequency variation within the material. When an impact load is applied to the crystal material, the resulting stress induces load migration, resulting in frequency fluctuations. The stress induced by the impact load can be mathematically represented as follows:
where k describes the relationship between stress and frequency deviation, and is the stress force applied by the impact load.
Quartz oscillators exhibit varied force-frequency effects, meaning that different oscillators may respond differently to external forces. The relationship between frequency fluctuations and external forces for oscillators exposed to impacts can be expressed as follows:
where Δfc: frequency deviation; k: force-frequency coefficient; and f0: external force. The force-frequency coefficient, denoted as “k”, signifies the sensitivity of the oscillator to external forces. It quantifies the extent of frequency deviation caused by a specific external force.
The value of the force-frequency coefficient can differ based on the type and design of the oscillator. In the AECS test, collision tests are typically performed either on a test rig or a real vehicle using track traction, resulting in impacts and vibrations. Consequently, the testing system must account for the influence of random vibrations on the satellite signal simulation. Referring to Equations (1) and (2), the frequency error caused by vibrations on the generated signal can be expressed as follows:
where k1 and k2 represent the factors that quantify the impact of random vibration amplitude and random variation, respectively. When the amplitude and variance of random vibrations increase, the frequency deviation of the components also increases. In other words, higher levels of random vibration amplitude and variation result in larger frequency offsets in the components. The physical significance of “A” is the magnitude of the main frequency in relation to the energy under test. It is set as an input for experimental simulations to adjust the subsequent model. In the following sections of this paper, three different power spectral densities are employed to determine this value. “A” represents the ratio between the power spectral density for the current experiment at the specified power level and the mean power spectral density across all experiments.
2.2. Time-Based Synchronization Error and Clock Error
Time-based synchronization error refers to the deviation between the internal clock of the signal generation system and the actual clock. When this error is significant, it can impact the timing relationship between the generated signal and the actual satellite signal, thus reducing the accuracy of signal generation. In applications like AECSs, which require the precise simulation of satellite signals, multiple test instruments with different clocks are often utilized. In such cases, time-based synchronization errors can introduce system errors. However, these errors are relatively minor and can be mitigated using software systems that are less susceptible to environmental factors. The clock source within the satellite signal simulation and emulation system itself may also exhibit stability issues. During equipment operation, if the inspection process is prolonged, slight variations in clock frequency may occur over time. Additionally, clock errors in subsystems can influence the time-based synchronization error. When analyzing environmental factors, it is important to minimize clock drift and mitigate the impact of time-based synchronization. The expression for the error in time-based synchronization can be represented as
In the satellite simulation system, the actual synchronization error comprises clock offset and clock drift . and represent the time offsets of the receiver generator and vector signal generator, respectively. represents the frequency at the transmission end.
In AECS tests, various devices may be used in the simulation system, and each device can be considered as an independent subsystem within the simulation system. The clock error of the subsystem is composed of an ideal clock signal and a clock error signal, and it can be expressed as
The gain error coefficient represents the sensitivity of the subsystem i to clock errors and determines the magnitude of the impact on the clock error. The fixed clock offset represents the initial deviation of the clock from the ideal synchronization time. In Equation (4), the clock drift curses the gradual change in the clock frequency over time.
The precise values of the gain error coefficient, fixed clock offset, and clock drift are determined by the clock accuracy of the devices employed in generating satellite signals within the AECS simulation system. To ensure accurate modeling, various sources of noise are considered in the error models, and the clock error analysis incorporates the clock accuracy of the simulation system utilized in the AECS tests.
2.3. System Output Power Error
System power loss refers to the energy loss of the generated signals during the transmission process due to factors such as circuit components and connectors, resulting in a decrease in output power. The presence of nonlinear components in the equipment can cause distortion and introduce errors in the output power. Under harsh testing conditions, the thermal equilibrium of the generator can be disrupted, leading to temperature drift. Additionally, different test environment temperatures can result in linear offset errors in the output power depending on the temperature coefficient of the components. The variation in the system output power error due to the temperature can be expressed as Equation (6):
where Δp represents the change in the system output power error, denotes the power temperature coefficient, corresponds to the current temperature, and Tin represents the reference temperature. It is important to note that for linear components, the temperature coefficient remains constant regardless of any fluctuations in the temperature.
Based on the above analysis, the performance of the satellite signal simulation system within the emergency call simulation and test platform is influenced by environmental conditions in three key aspects. Firstly, during collision tests, vibrations and impact forces can be transmitted to the various components and RF connection lines of the signal simulation system, potentially causing positional shifts or damage, which, in turn, impact the accuracy and stability of the signals generated. Secondly, variations in the environmental temperature can result in changes in the component performance, such as frequency drift and power fluctuations. Lastly, the structure of the satellite simulation system utilized in the AECS tests needs to be determined during the experiments, enabling the selection of an appropriate clock source for the simulation system and the implementation of software-based clock corrections to account for time deviations. Therefore, in the design and optimization of a simulation system, it is crucial to comprehensively consider the errors arising from vibration, impact, and temperature in the environment and accurately assess the impact of these factors on system performance. This approach facilitates improved accuracy and stability, allowing for a more precise simulation of vehicle collision scenarios and the evaluation of the performance of emergency call systems.
3. Semi-Physical Simulation System for Post-Collision Emergency Call
Based on the analysis in the previous section, environmental factors have an impact on system errors, resulting in frequency fluctuations and unstable signal frequencies, which, in turn, lead to phase noise. Therefore, phase noise serves as an indicator of frequency stability, and by measuring the phase noise in a semi-physical simulation system, the quality of the signal generation can be analyzed and evaluated.
3.1. Phase Noise Error Model Based on Power Density
Given that phase noise is an important metric for assessing frequency [32,33], it is selected as the parameter to represent the frequency of the simulation model system in the emergency call simulation platform. Consequently, the phase noise error of the satellite signal generation system within the semi-physical simulation platform is modeled.
The system’s phase noise predominantly consists of three components: the noise near the carrier frequency, pedestal noise, and wideband phase noise [34]. Hence, in Equation (7), the error value of the source “i” at time “t” can be expressed as follows:
The Fourier transform of the above Equation (7) yields the power spectral density of the system’s phase noise, which is mathematically represented as
where represents the frequency offset of the reference source, represents the frequency offset of the analog signal source, 3 represents the frequency offset of the voltage-controlled oscillator (VCO), and represents the coefficients for frequency.
In the previous section, we obtained the expressions for the main error parameters’ frequencies and the minor error parameters. Considering the possibility of multiple independent error sources in the system, let us assume that there are m independent error sources in the satellite signal simulation system. We model various components of the electronic elements corresponding to each error source, including the clock oscillators, phase-locked loops (PLLs), amplifiers, and RF ports. By modeling these components, we can more comprehensively consider the impact of factors such as the hardware noise, nonlinear distortion, and frequency drift. This allows for a more comprehensive analysis and evaluation of the performance of the entire signal simulation system.
Among them, for the linear part, the obtained transfer matrix is denoted as H, which represents a time-invariant system error model. The ideal error function of the system can be represented as follows:
In Equation (9), represents the coefficient of the error source i, and the remaining terms denote the product of the error transfer matrix and Gaussian white noise. By summing these terms, we can obtain the error model based on the power spectral density of the phase noise.
Based on the above error model, we utilize the normalized root mean square error (NRMSE) as an evaluation metric to assess the phase noise deviation of the satellite signal generation system under different operating conditions. By calculating the NRMSE, we can objectively measure the difference between the system output and the ideal output and normalize it for a comparative analysis across various operating conditions. This evaluation method helps us gain a more accurate understanding of the system’s performance under different conditions, including the magnitude and impact of the phase noise. The formula for calculating the normalized root mean square error (Equation (10)) is represented as
where represents the sample representation variable of the phase noise at the same frequency point.
To achieve the objectives of this study, this paper establishes a semi-physical simulation platform based on GNSS signal generation using a vector signal generator, wireless communication tester, and collision environment simulation testing system. Considering that post-collision emergency call system simulations mainly focus on receiver performance and overlook errors caused by signal distortion, the research on post-collision emergency call system simulation primarily focuses on receiver performance while neglecting errors caused by signal distortion [34]. Therefore, a Hardware-in-the-Loop testing method is proposed that replicates the environmental factors as the primary concern. A phase noise model and a method for generating GNSS intermediate frequency signals are introduced with the aim of improving the traditional positioning information simulation methods based solely on numerical statistics. This approach allows for the combination of real-world scenario information and simulation accuracy in AECS tests. It focuses on evaluating the performance of the AECS under different environmental conditions and more accurately simulates vehicle collision scenarios, providing important tools and support for AECS development and verification methods.
3.2. Positioning Information Simulation System
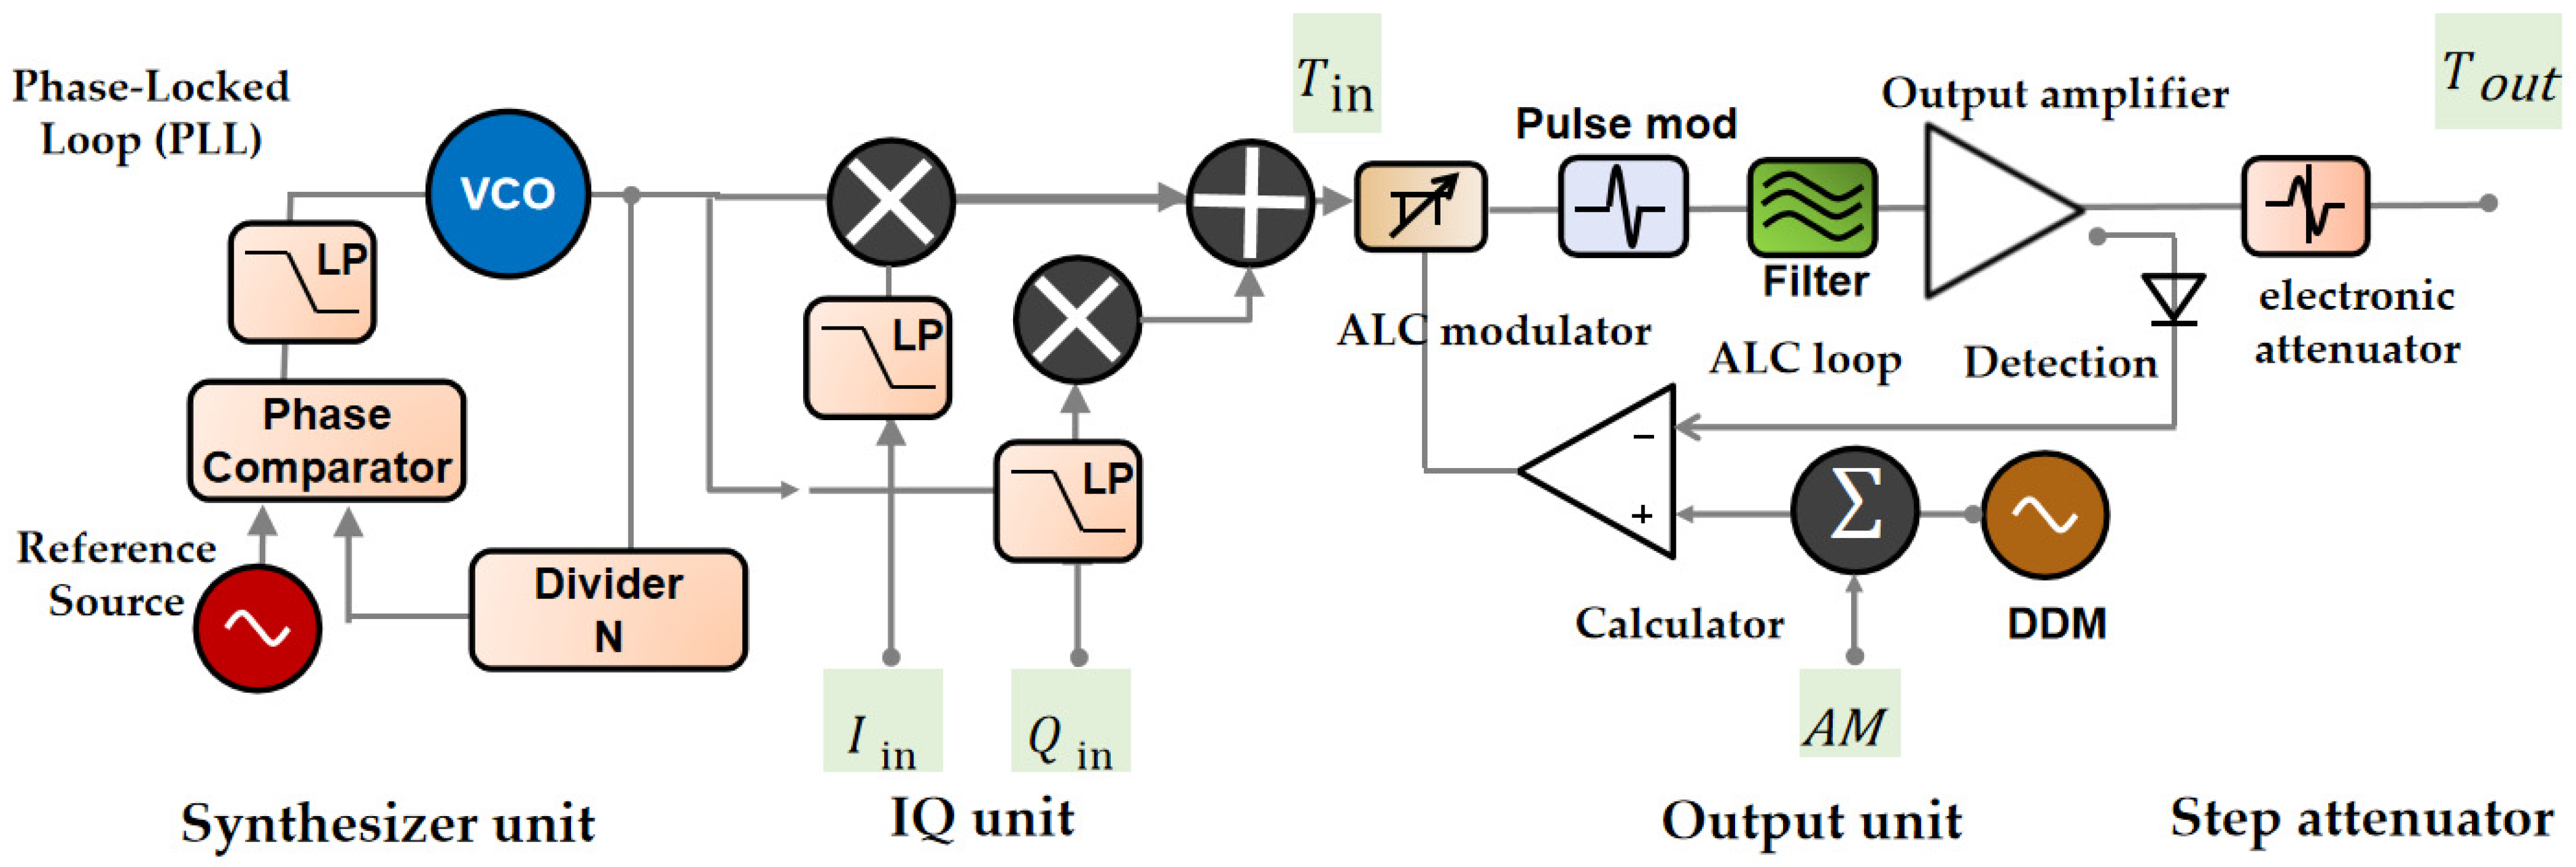
Based on the signal sources [29,35], the platform established a GNSS satellite signal generation system for generating GPS and Beidou satellite signals. We constructed a positioning information simulation system that includes key components such as a synthesizer unit, IQ unit, output unit, and step attenuator. The system’s flowchart is shown in Figure 2.

Figure 2.
Principle architecture of satellite signal generation system.
The system principle is illustrated in the diagram shown below. In this system, a vector signal generator is employed to generate satellite signals. Among its crucial components, an IQ simulation, which stands for “In-phase and Quadrature-phase modulation simulation”, is utilized to simulate and analyze the orthogonal amplitude modulation process of the signals, enabling the modulation and demodulation of satellite signals [8]. And for the synthesizer unit, we utilize a synthesizer to generate an intermediate frequency signal of a specific frequency. The local reference source, a quartz crystal oscillator, generates the local oscillator sinusoidal signal, which is represented as
In the equation, SLO represents the local reference source quartz crystal oscillator generating the local oscillator sinusoidal signal [28], and denotes the oscillator frequency. Through the IQ unit, phase modulation and frequency conversion are performed to simulate variations in the carrier frequency and carrier phase. This process can be represented as
The amplitude synthesis of the signal is represented by and , where represents the amplitude of the baseband signal, and ALG represents the amplitude gain. The data code set for the signal is denoted by D, while τ represents the signal delay. Based on the L1 frequency of the Beidou satellite, the Doppler frequency shift, and the frequency settings and of the reference source, the final modulated signal is obtained with and passed as an input to the output unit. It is worth noting that, as discussed in the previous section regarding timing errors and clock errors, since there are multiple signal sources involved in generating the positioning information in the environmental simulation system, this paper employs the clock with a higher precision in the vector signal generator as the reference source.
The generated intermediate frequency (IF) signal undergoes processing in the output unit, which includes filtering and power adjustment (Equation (12)), to meet the requirements of the simulation. To simulate signal strength variations in different scenarios, a step attenuator is employed to attenuate the signal. The system interacts dynamically with the collision environment generation system through the SCPI interface. Errors caused by external factors such as temperature, humidity, mechanical stress, etc., need to be validated and analyzed by controlling the input of the environmental variables. This allows for the validation of the sensor data generated by the standard receiver under different environmental conditions and verifies the impact of the error model in the system under various test conditions and inspection requirements.
3.3. Emergency Call Simulation Platform
In this paper, we propose a semi-physical Hardware-in-the-Loop (HIL) approach for emergency call simulation. This method combines the positioning information simulation system with the collision environment simulation system, generating the positioning signal as the output of the platform. This integration makes the simulation platform more suitable for validating error models and aids in identifying vulnerable components within the hardware.
The architecture of the emergency call simulation platform is depicted in Figure 3, where the satellite signal generation system plays a critical role. By employing the provided platform and combining it with the content from the previous section, AECS indoor detection test cases can be formulated. The satellite signal generation system consists of both a generator model and physical hardware components. The generator model’s parameters are set via the SCPI interface. Based on the principles and specifications of the GNSS system, the generator model can produce intermediate frequency signal waveforms that resemble real satellite signals. The physical hardware provides the actual signal generator, ensuring that the generated signals match those in the real environment to guarantee signal accuracy and reliability.
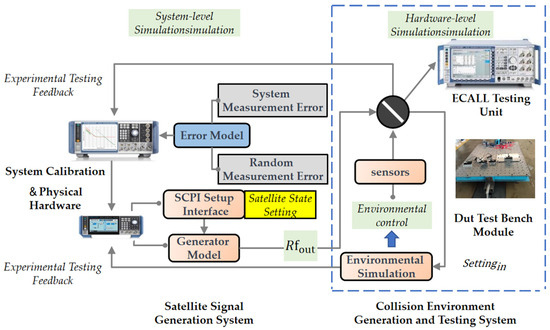
Figure 3.
Overall architecture of emergency call simulation platform use case. The overall architecture of the emergency call simulation platform consists of the Signal Simulation Module on the left side and the Environment and Physical Simulation Module within the blue box area on the right side, which, together, form a semi-physical simulation model.
The error analysis section is used to evaluate the measurement errors and stability of the system, conducting an analysis of both the linear and nonlinear effects on the system measurement errors [36]. Factors such as signal attenuation, noise, multipath effects, and others are considered in their impact on the positioning performance. Additionally, we pay attention to random measurement errors with repeatability, such as temperature drift. By analyzing these error sources in detail, we can understand the system’s performance and reliability under different conditions. As shown in Figure 4, a simplified phase noise model is obtained, depicting its relationship with the corresponding system modules. Various components in the simulation system exhibit nonlinear characteristics influenced by environmental factors, leading to nonlinear error effects. By analyzing the phase noise, we can determine the locations where environmental factors affect the system.
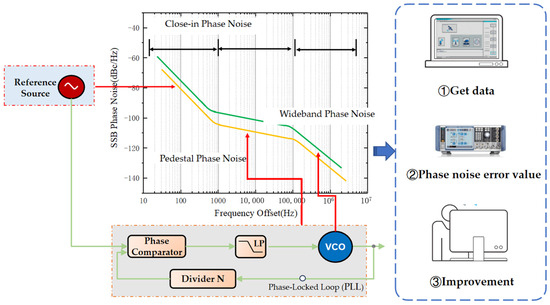
Figure 4.
The correspondence of nonlinear features in the phase noise curve.
The collision environment generation and testing system is used for environmental simulation and physical experimental validation in the simulation section. We simulate collision environments, including factors such as vehicle collisions, vibrations, and changes in environmental conditions before and after collisions in the testing area. By conducting semi-physical validation under various combinations of simulated collision conditions, such as temperature and vibration, we can evaluate the performance and reliability of AECSs (Assisted Emergency Call Systems) in real collision environments. This part also involves comparing and analyzing the simulation results with the experimental data to validate the effectiveness and accuracy of the simulation testing platform.
The entire architecture provides a comprehensive semi-physical simulation testing platform for emergency call simulations. The satellite signal generation system generates real intermediate frequency signals, while the error analysis section evaluates the system’s measurement errors and stability. The collision environment generation and testing system simulate real collision environments and conduct physical experimental validation. Together, these components create a platform that enables the thorough testing and validation of emergency call systems.
3.4. Semi-Physical Simulation Testing Process
The semi-physical simulation testing process is essential for evaluating the system performance, validating design and functionality, mitigating risks, and achieving cost and time efficiency. By combining physical elements with simulated components, it enables a realistic assessment of the system behavior, identifies potential issues, verifies design specifications, and reduces the likelihood of failures in real-world applications. This controlled testing environment allows for repeated testing and iteration, leading to reliable and optimized systems before costly deployments or extensive field testing. The process is as follows:
- Using the collision testing unit in the semi-physical simulation platform, real signal observations from the testing area and system phase noise observations under generated signals are collected separately. The collected data are then subjected to outlier removal processing to ensure the reliability and accuracy of the observations.
- By controlling the parameters of the satellite signal generation system, different positioning conditions are simulated by altering the environmental conditions in which the system operates. This allows for the simulation of various vehicle collision scenarios, levels of vibration, and temperature changes. For the simulation of vibration and temperature environments, vibration characteristic parameters are calculated based on historical data from real vehicle tests and simulated collision tests to ensure an accurate environmental simulation is created.
- The weights of each error source in the error model are initialized. By triggering the emergency call device, the simulation system transmits the simulated environmental parameters to the AECS and records the system’s response and performance under different environmental conditions.
- An analysis and calculation of errors for different scenarios are performed. The timing errors and clock errors are validated by selecting a reference source with high precision. For the validation of other environmental factors, such as temperature drift, it follows the testing requirements outlined in the emergency call regulations. The samples that meet the overall qualification tests specified in UN Regulation No. 144 are selected for error analysis.
4. Results and Analysis
Based on the analysis of existing methods (Table 1) and in conjunction with a test setup, a collision-based simulation scenario AECS test was established. To validate the stability and effectiveness of the semi-physical simulation model and analyze the key influencing factors in vehicle emergency call tests, experiments were conducted at the National Automotive Quality Supervision and Inspection Center in Beijing. A verification experiment of the emergency call in-collision environment simulation model was designed, and different environmental conditions and interferences encountered during the actual vehicle collision process were simulated. The test data corresponding to these conditions were generated using the satellite signal generation system in the semi-physical simulation setup.

Table 1.
Comparison and analysis of existing research on AECS and ICV testing.
4.1. Experimental Setup
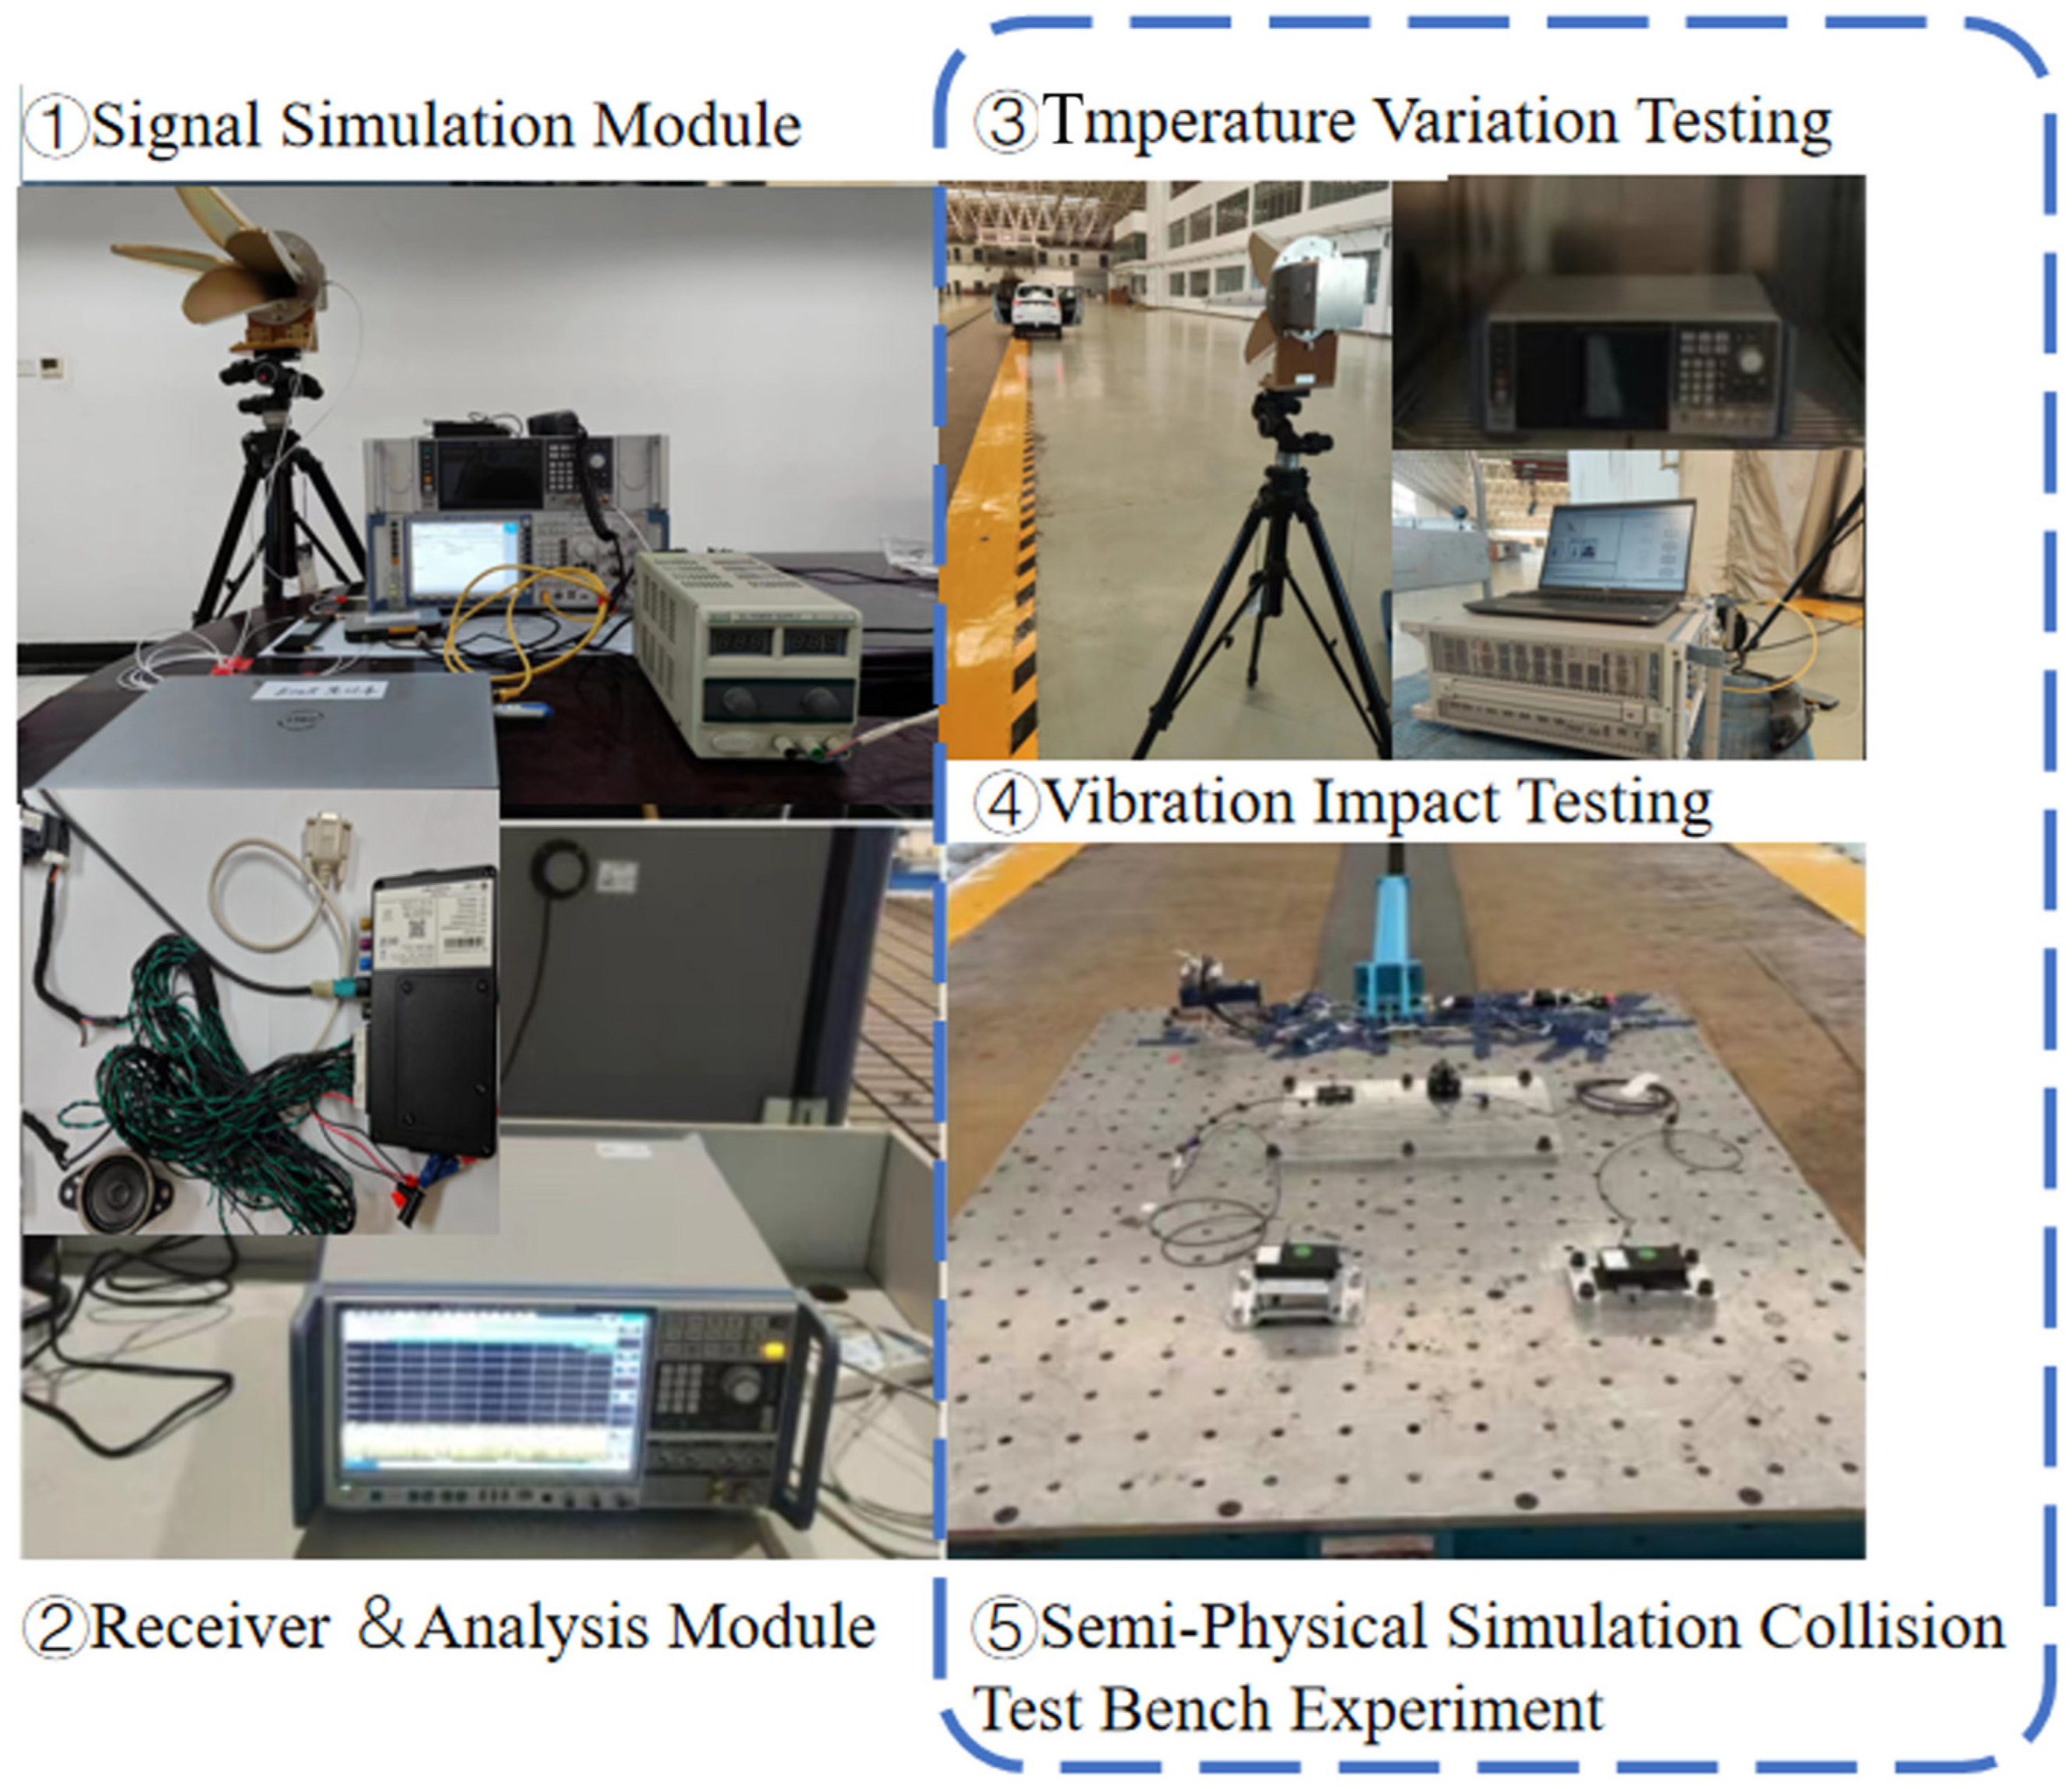
The experimental setup consists of two main components: the positioning information generation based on vehicle collision conditions and error analysis. To obtain the key influential parameters of the simulation model under realistic conditions, a remote data acquisition and control system was designed for data collection in the experimental scenario. Figure 5 illustrates the simulation scene and the corresponding AECS test after a collision, demonstrating the effectiveness of the simulation scenario.

Figure 5.
The AECS/ECALL experiment conducted in 2022 at the National Automotive Inspection and Testing Center (Beijing).
Prior to the experimental analysis, the signal generation component of the simulation model was integrated into different environmental chambers to control the environmental factors. The temperature outside the environmental chamber was kept stable, and the system data were observed using a signal analyzer [37]. Simultaneously, a remote data acquisition system recorded the GNSS signal data. Once the satellite signal generation system reached the specified environmental conditions and remained relatively stable in the environmental chamber, the AECS was triggered, and data collection began, including the environmental temperature, impact amplitude, and timestamps of various components.
After obtaining the MSD (Minimum Set of Data) information of the AECS using the CMW500(The wireless comprehensive tester and analyzer below are manufactured by R&S in Memmingen, Germany) wireless communication tester, it was confirmed that the positioning signal was generated by the satellite signal generation system, and the operating conditions were recorded. Subsequently, the parameters of the environmental chamber were controlled to change to the next set value and maintained for 10 minutes. The collected experimental data were then analyzed for phase noise using the FSWP-50 analyzer, with the parameters set as specified in the Table 2. Finally, the data were uploaded through the CAN bus or serial port, and the influence weights were analyzed using the error model established in the platform.
Table 2.
Parameter settings in satellite signal simulation.
4.2. Results Analysis
In this study, using the sensors and external environmental chambers integrated into the semi-physical simulation platform, three sets of experiments were designed to compare and analyze the effects of signal generation under different parameters. These experiments focused on high-temperature and low-temperature environments, impact vibration conditions, and normal operating conditions. The data collection and analysis equipment used in the experiments were described in Section 3.1. Each set of experiments involved data collection for four central frequency points corresponding to different satellite positioning systems: B2a: 1176.45 MHz; B1C: 1575.42 MHz; B3I: 1268.52 MHz; and B1I: 1561.098 MHz. The phase noise data were collected for each category, and different gradients of environmental variables were tested for each category in Table 3.
Table 3.
Summary of collected positioning information datasets.
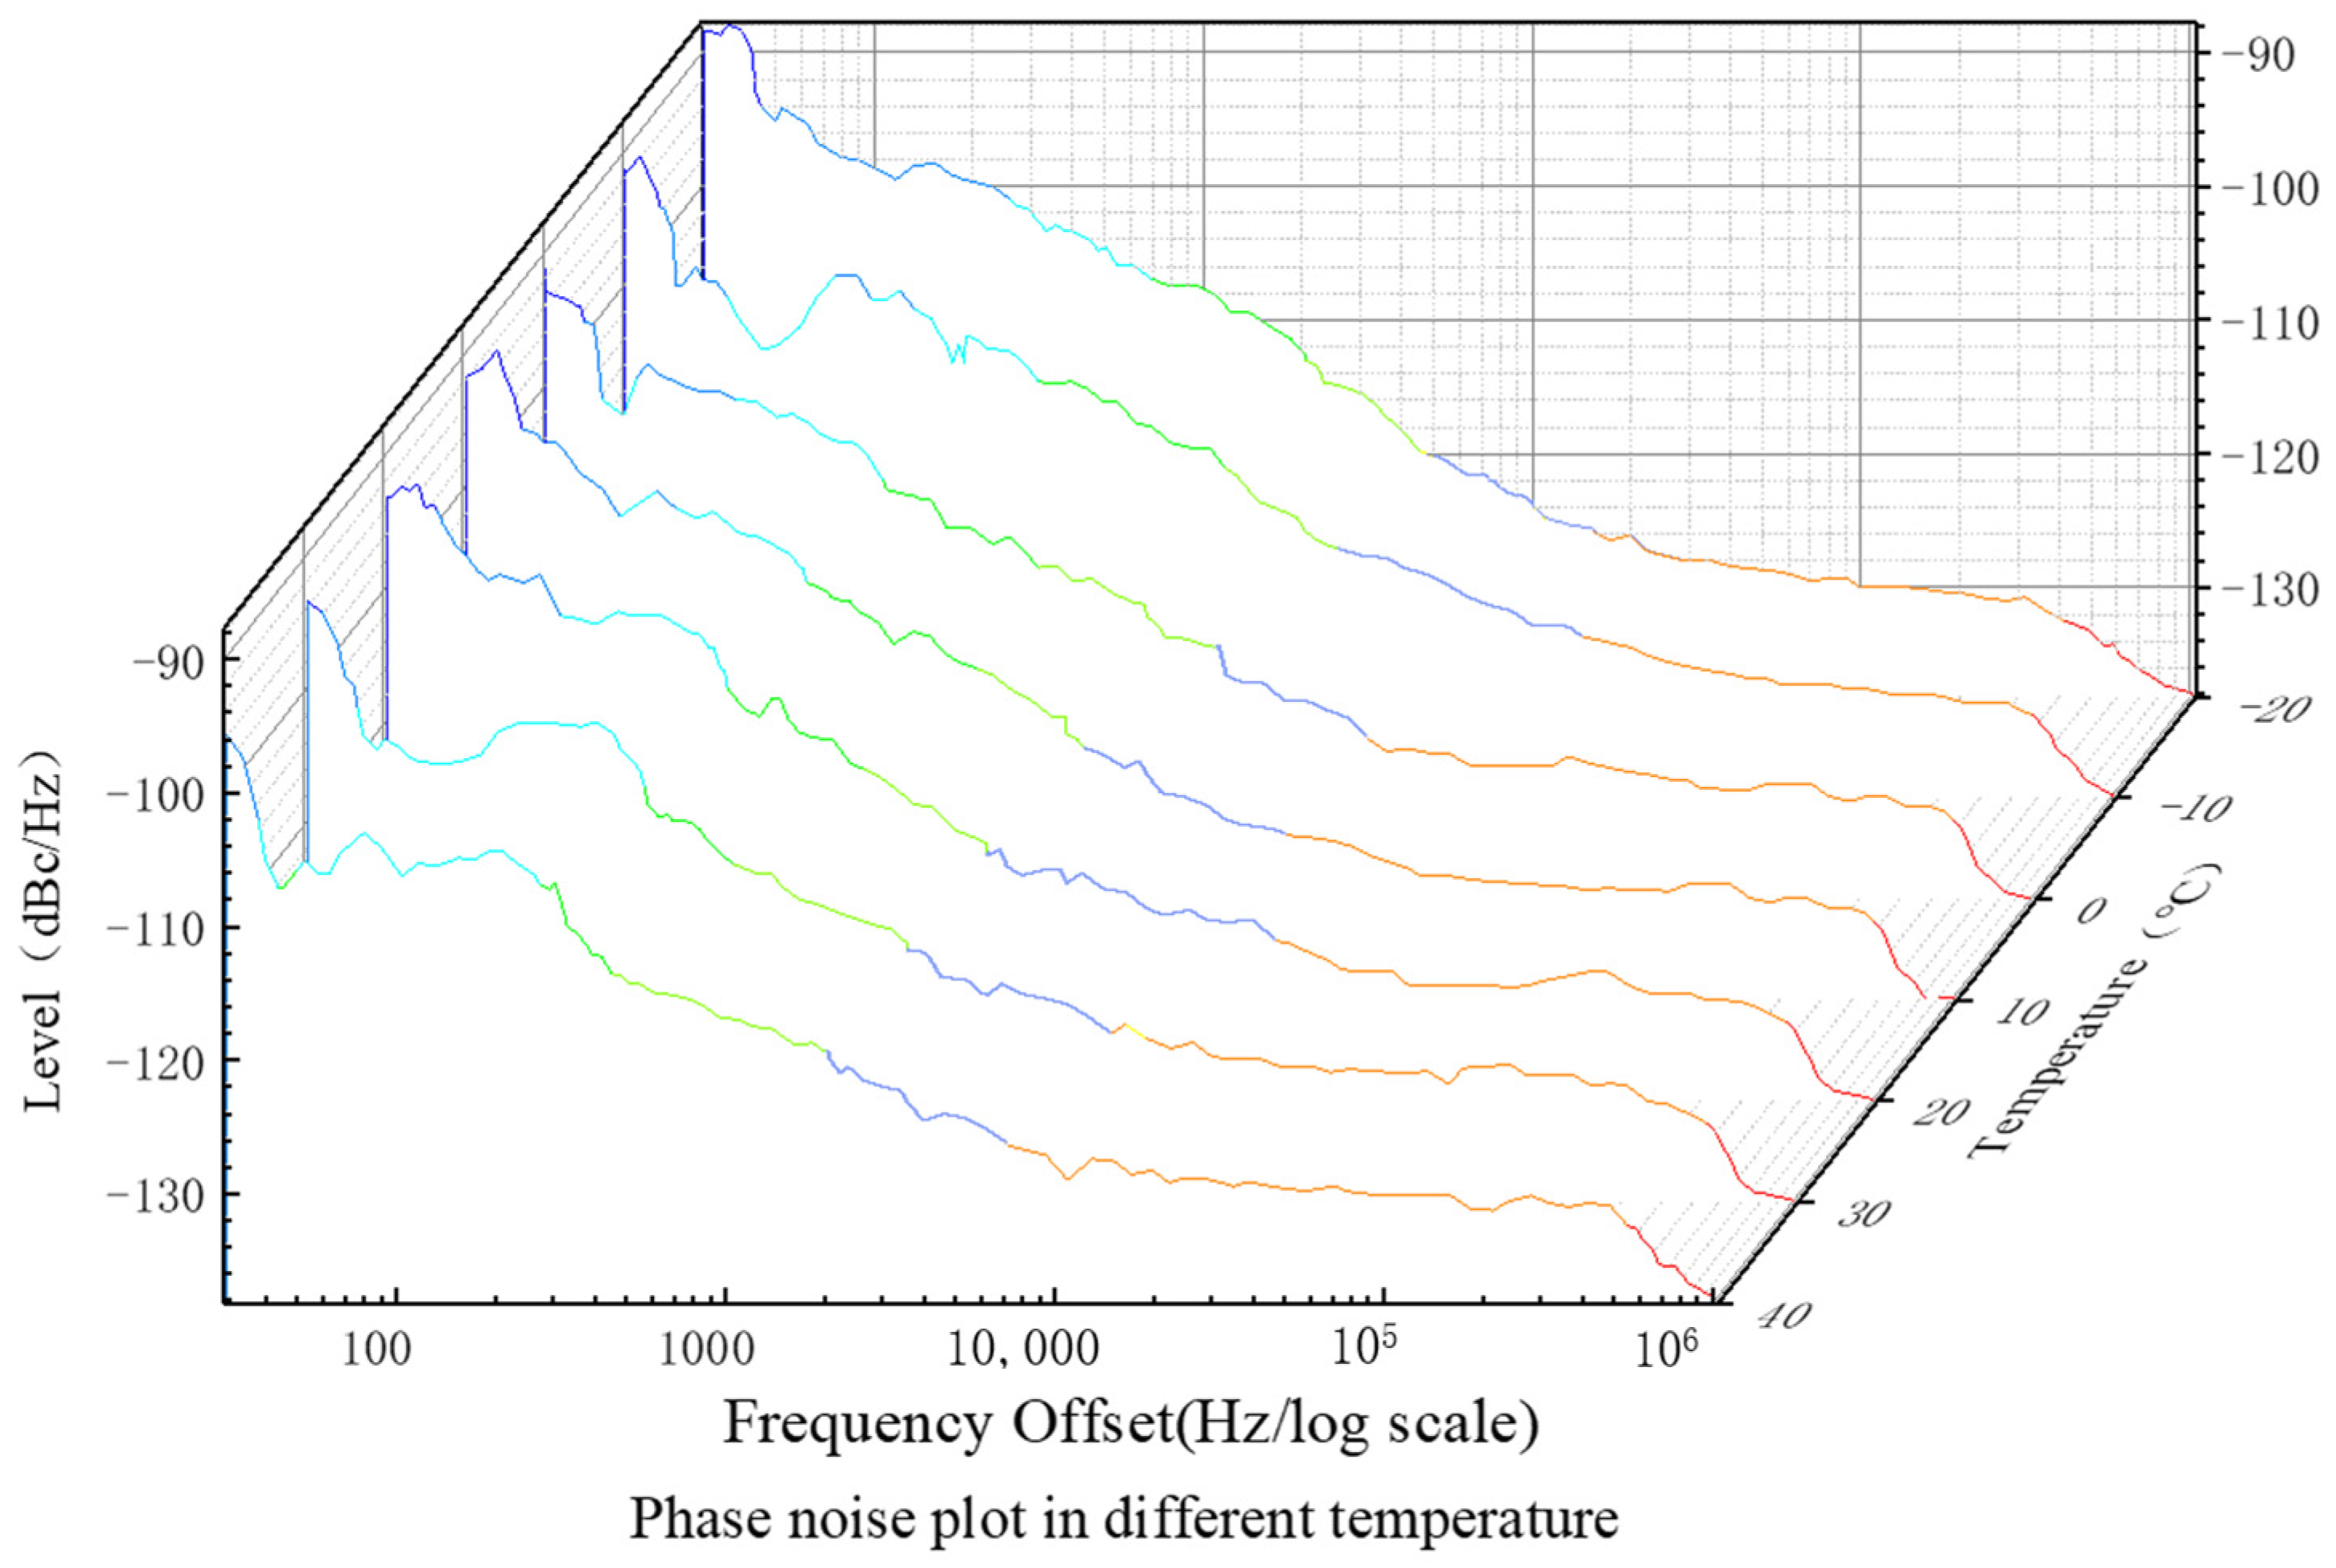
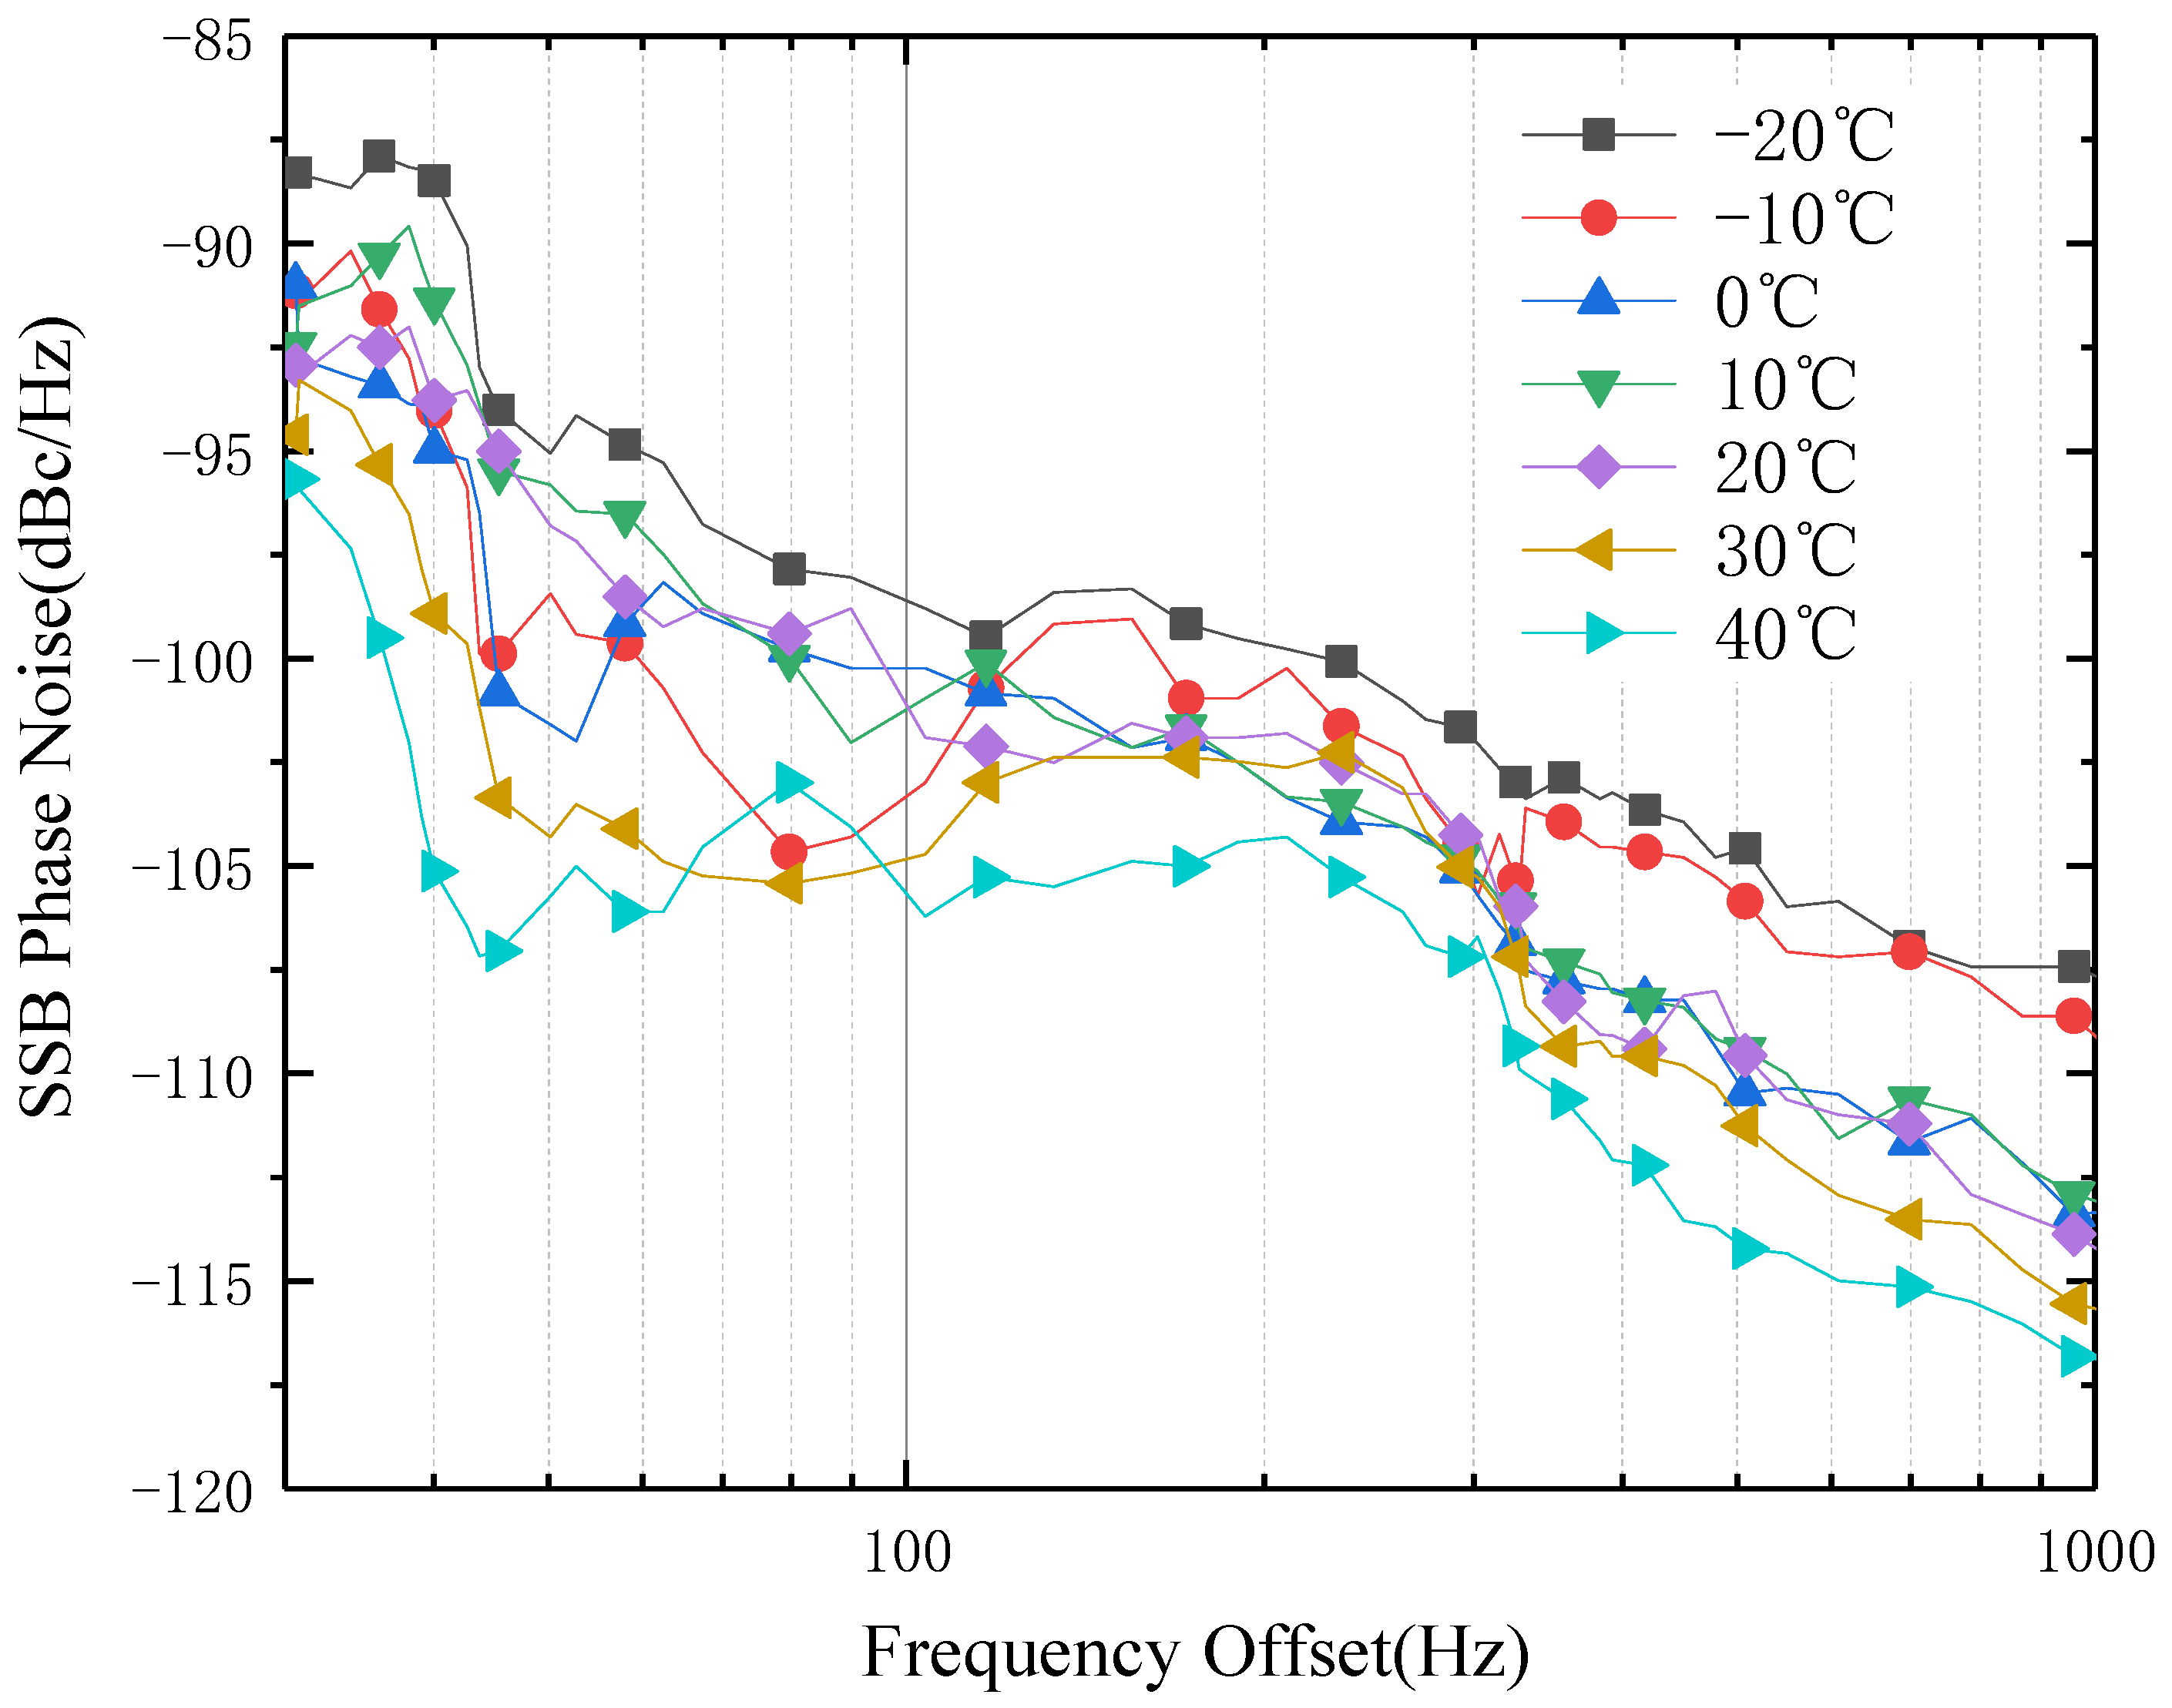
Taking the phase noise at 1575.42 MHz as an example, the simulated errors generated in high- and low-temperature environments were divided into seven gradients based on the experimental conditions. A comparative test was conducted with the temperature ranging from −20 °C to 40 °C. Through simulation and experimentation, Figure 5 presents the single-side phase noise within the integrated measurement range of 10 to 10,000 KHz under different temperature gradients. It reflects the frequency offset at this frequency center.
From Figure 6, it can be observed that the overall impact of temperature on the phase noise is relatively small. The phase noise is lower at 40 °C compared to the normal test temperature of 20 °C, while it is higher at the low temperature of −20 °C. Taking the phase noise at room temperature as the baseline, the absolute values of the normalized root mean square error (NRMSE) can be calculated using Equation 10 and presented as a percentage, and subsequent calculations can be performed in the same manner for the phase noise generated at 40 °C and −20 °C (1.13% and 2.12%, respectively). This indicates a negative correlation between the environmental temperature and generated phase noise. Furthermore, it can be seen from the graph that the influence of temperature on the system phase noise is mainly concentrated in the near-carrier phase noise within the frequency range of 10 to 1000 Hz. The phase noise variations in the ranges of 1000 to 100 KHz and 100 KHz to 1 MHz, which correspond to the pedestal noise φ2 and wideband phase noise φ3, respectively, show similar trends.
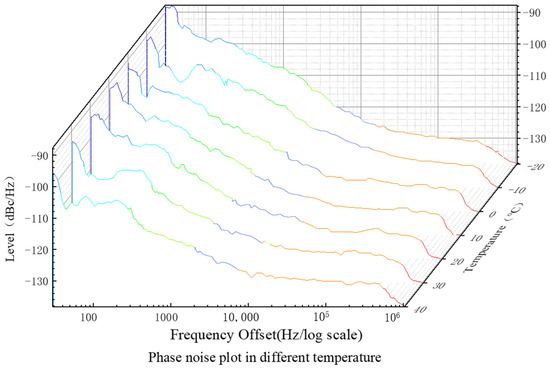
Figure 6.
Single-sided phase noise under different environmental temperature conditions.
The influence of temperature on the system is primarily present in the near-carrier range of 10 to 1000 Hz, as shown in Figure 7. From the graph, it can be observed that at −20 °C (low temperature) compared to 40 °C (high temperature), the maximum error value is 11 dBm.
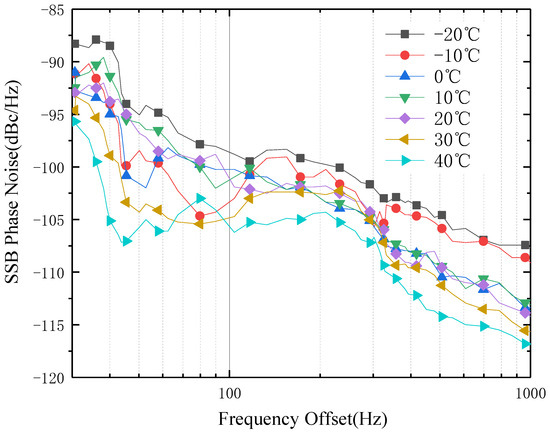
Figure 7.
Single-sided phase noise under different environmental temperature conditions.
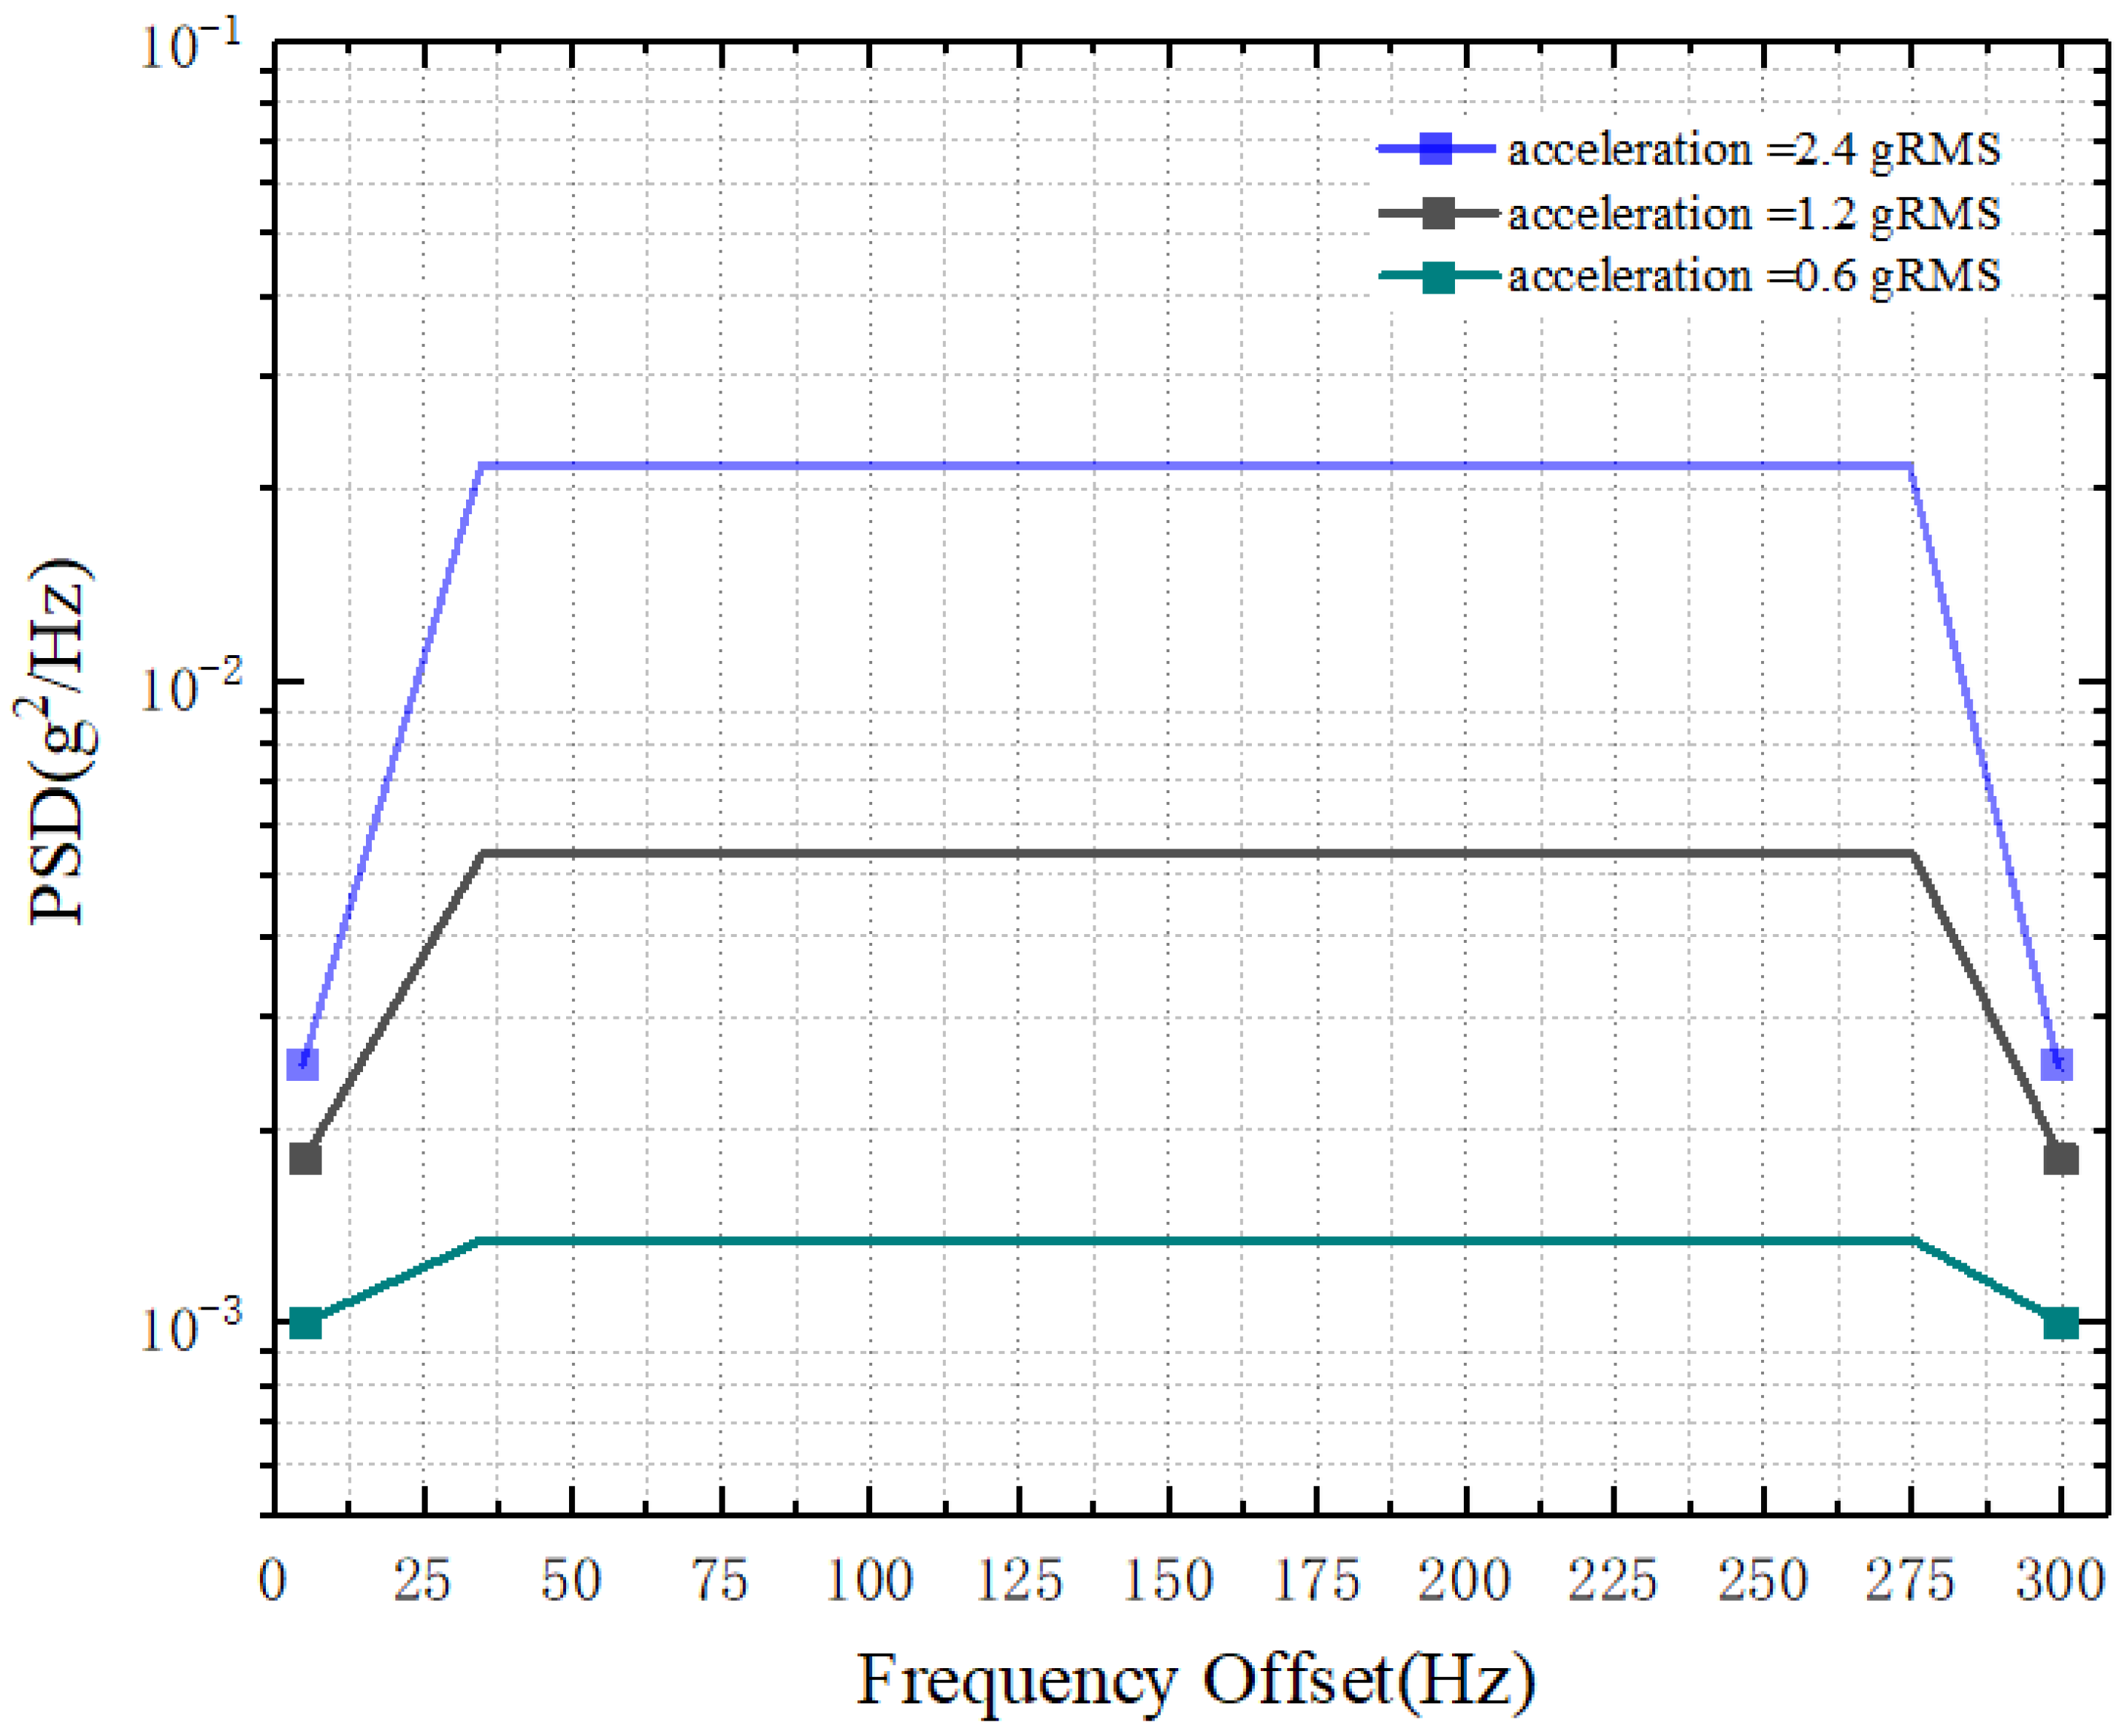
When considering the impact of vibration, the design differentiates it from random vibration based on amplitude and frequency. The number of impact vibrations and amplitude gradients are set in reference to the impact of a real vehicle collision on the ground. The simulation aims to replicate the impact of the test platform and the actual vehicle on the ground during the traction and collision processes. In this study, a vibration with a jump value of less than 2 mm within the range of 0–300 Hz is used to simulate random vibrations. The power spectral density (PSD) is used to represent the operating conditions under different random vibration scenarios. Figure 8 shows the PSD curves for three different operating conditions used in this study. Figure 8 represents the three vibration conditions used in the environmental simulation experiments, simulating different levels of random vibration and impact.
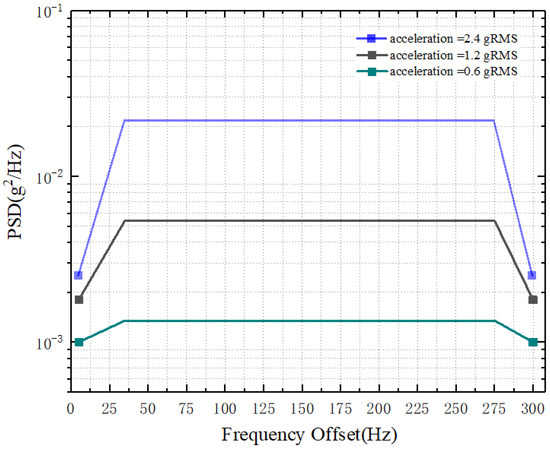
Figure 8.
Experimental conditions for simulating vibration and impact conditions through power spectral density.
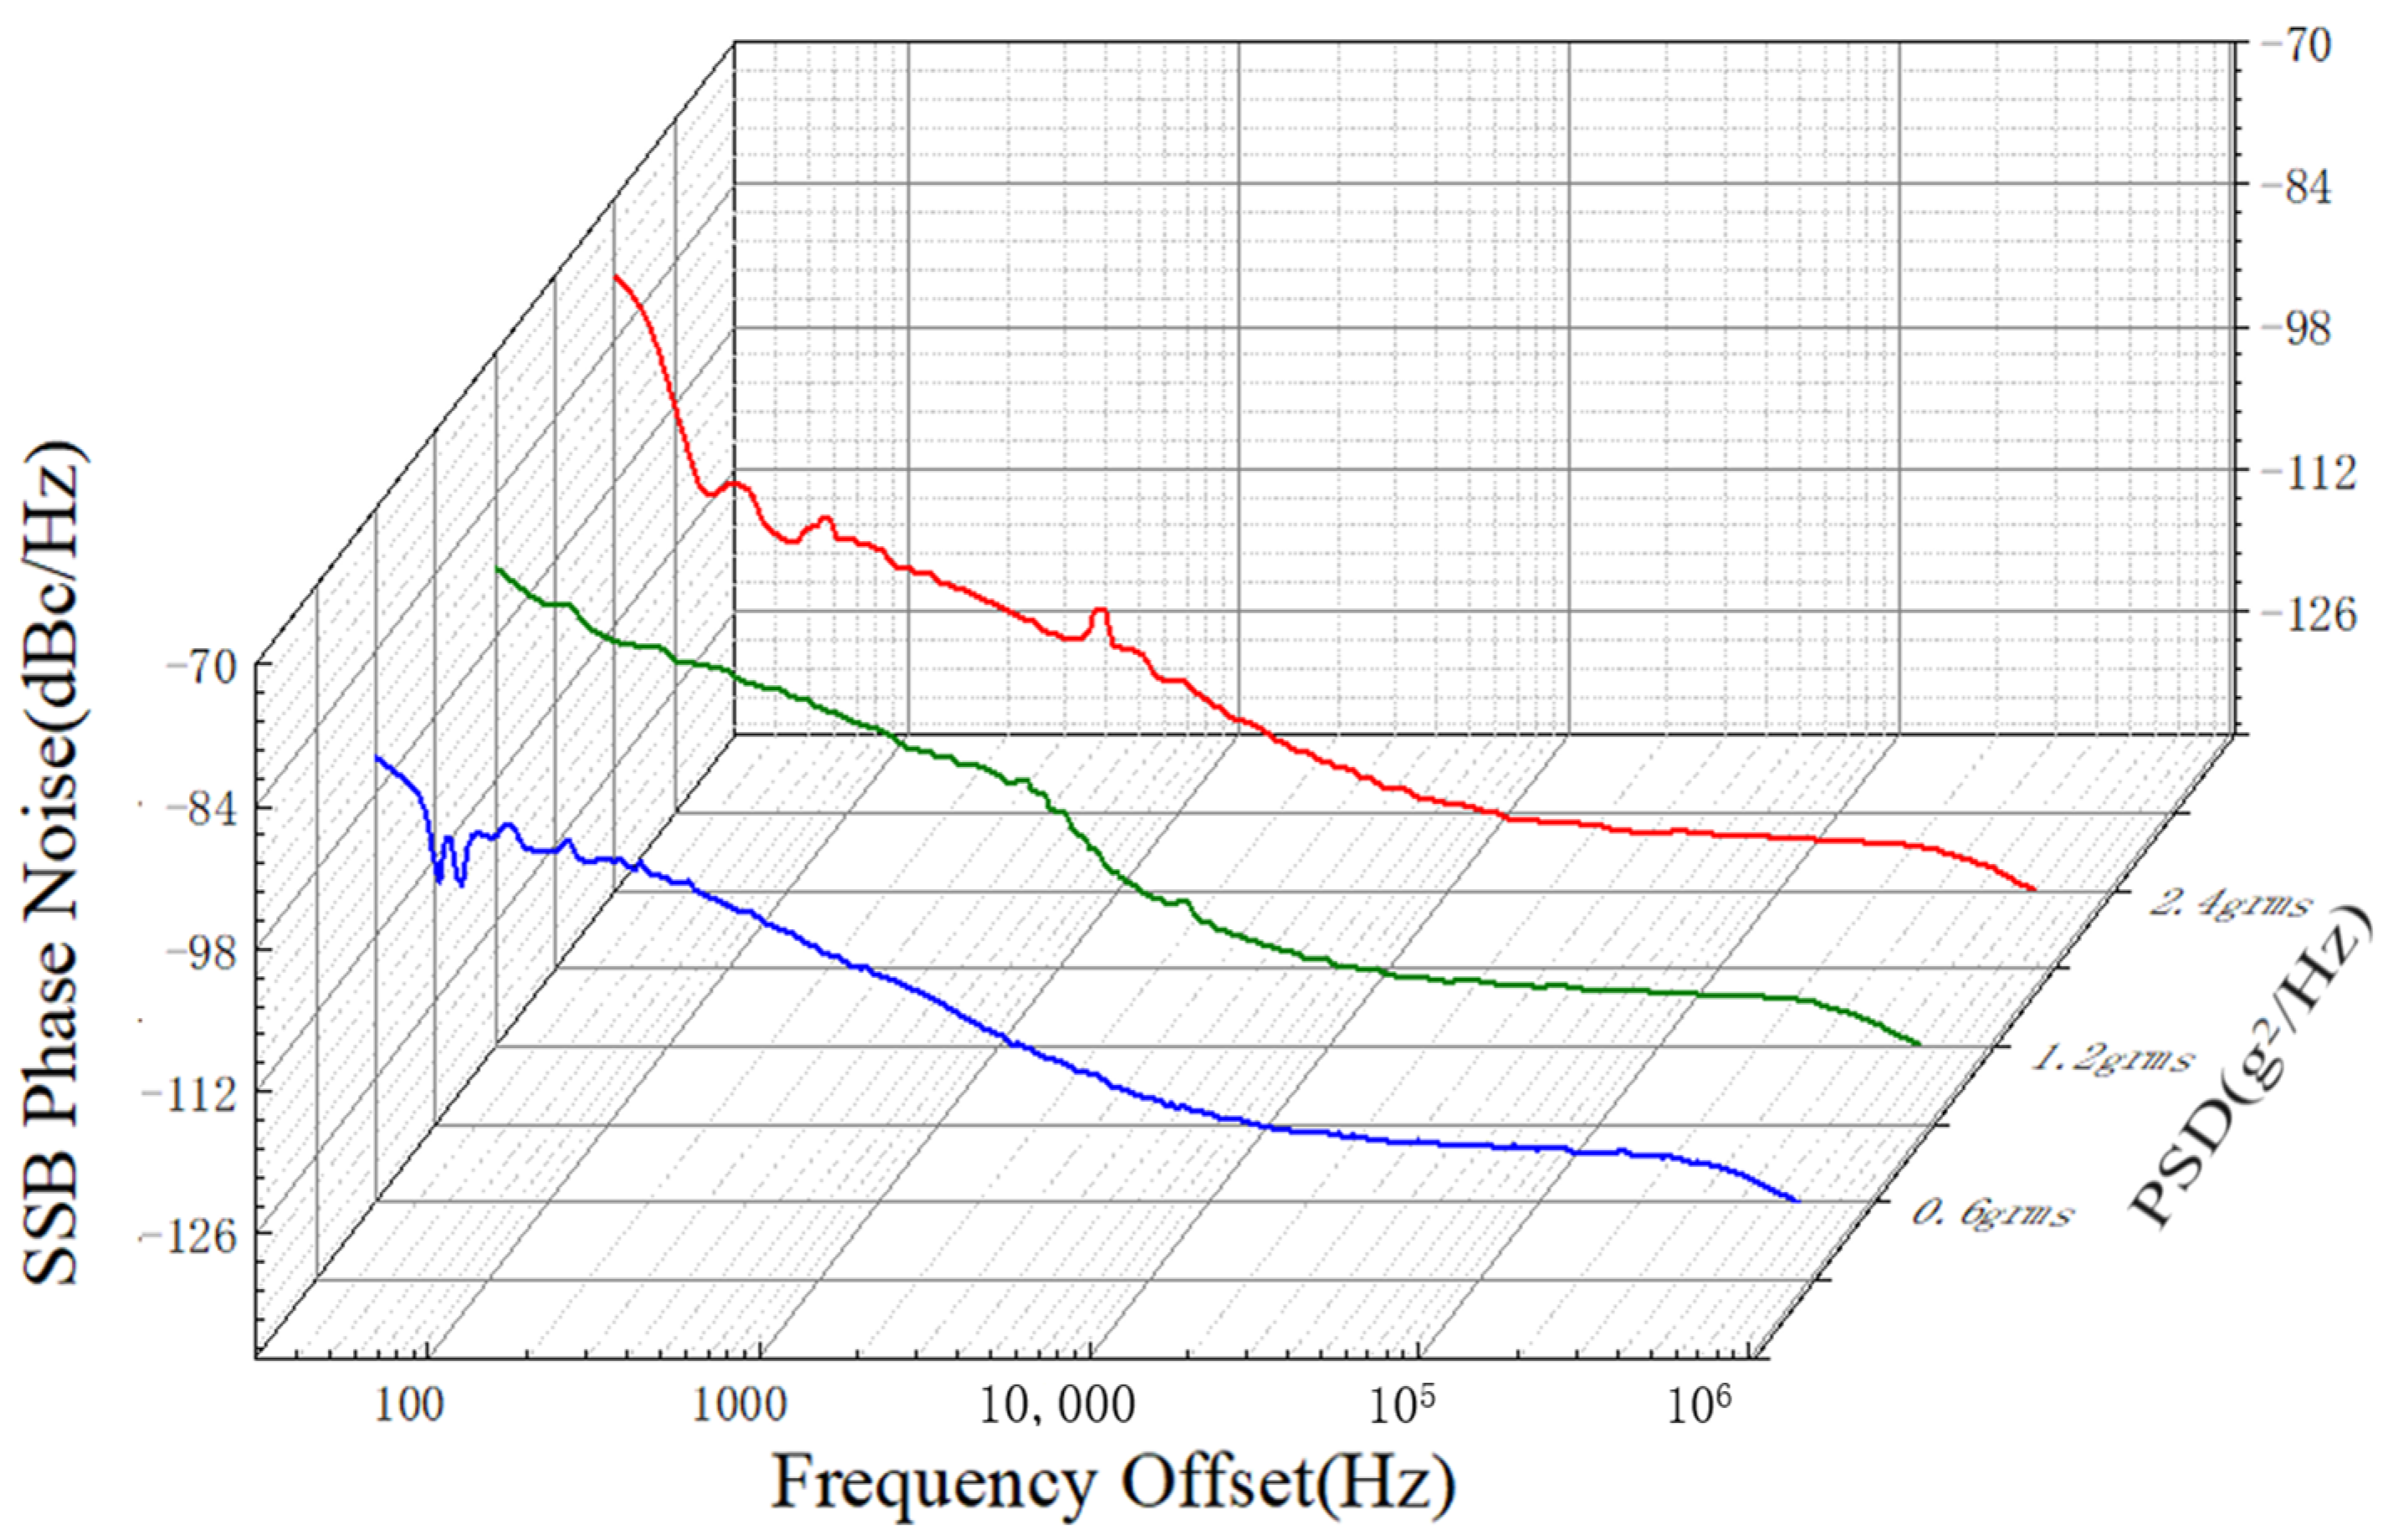
In the experiment, three different environmental conditions with different power spectral densities were used. Under a temperature of 20 °C, the signal generation system was placed inside the vibration environmental chamber, and different vibration gradients were set, as shown in Figure 8. Figure 8 presents the phase noise results of the system under three different power spectral density conditions. Through the simulation experiment, the influence of the set value of random vibration on the phase noise can be obtained. It can be observed from the figure that both the near-carrier phase noise in the range of 10–1000 Hz and the pedestal phase noise in the range of 1000 Hz–100 KHz are affected by vibration interference.
As seen in the full-band curve in Figure 9, the blue curve represents the phase noise under the 0.6 g RMS condition. It can be observed that as the power spectral density (PSD) of random vibration increases, the phase noise of the signal also increases. With the increase in the PSD, the absolute values of the normalized root mean square error (NRMSE) of the phase noise generated by the signal increase by 6.3% and 8.95%, respectively. In the pedestal phase noise range of 1000 Hz–100 KHz, both the 2.4 g RMS and 1.2 g RMS conditions exhibit an increase in the phase noise.
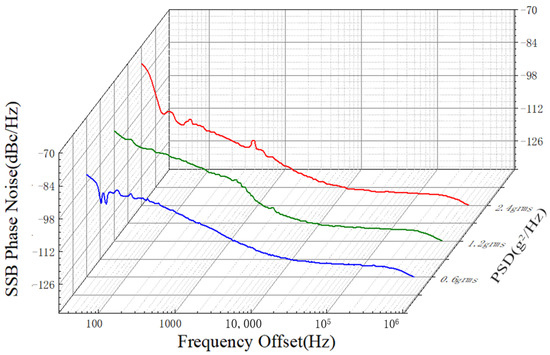
Figure 9.
Phase noise generated by the signal generation system under different power spectral density of vibration conditions.
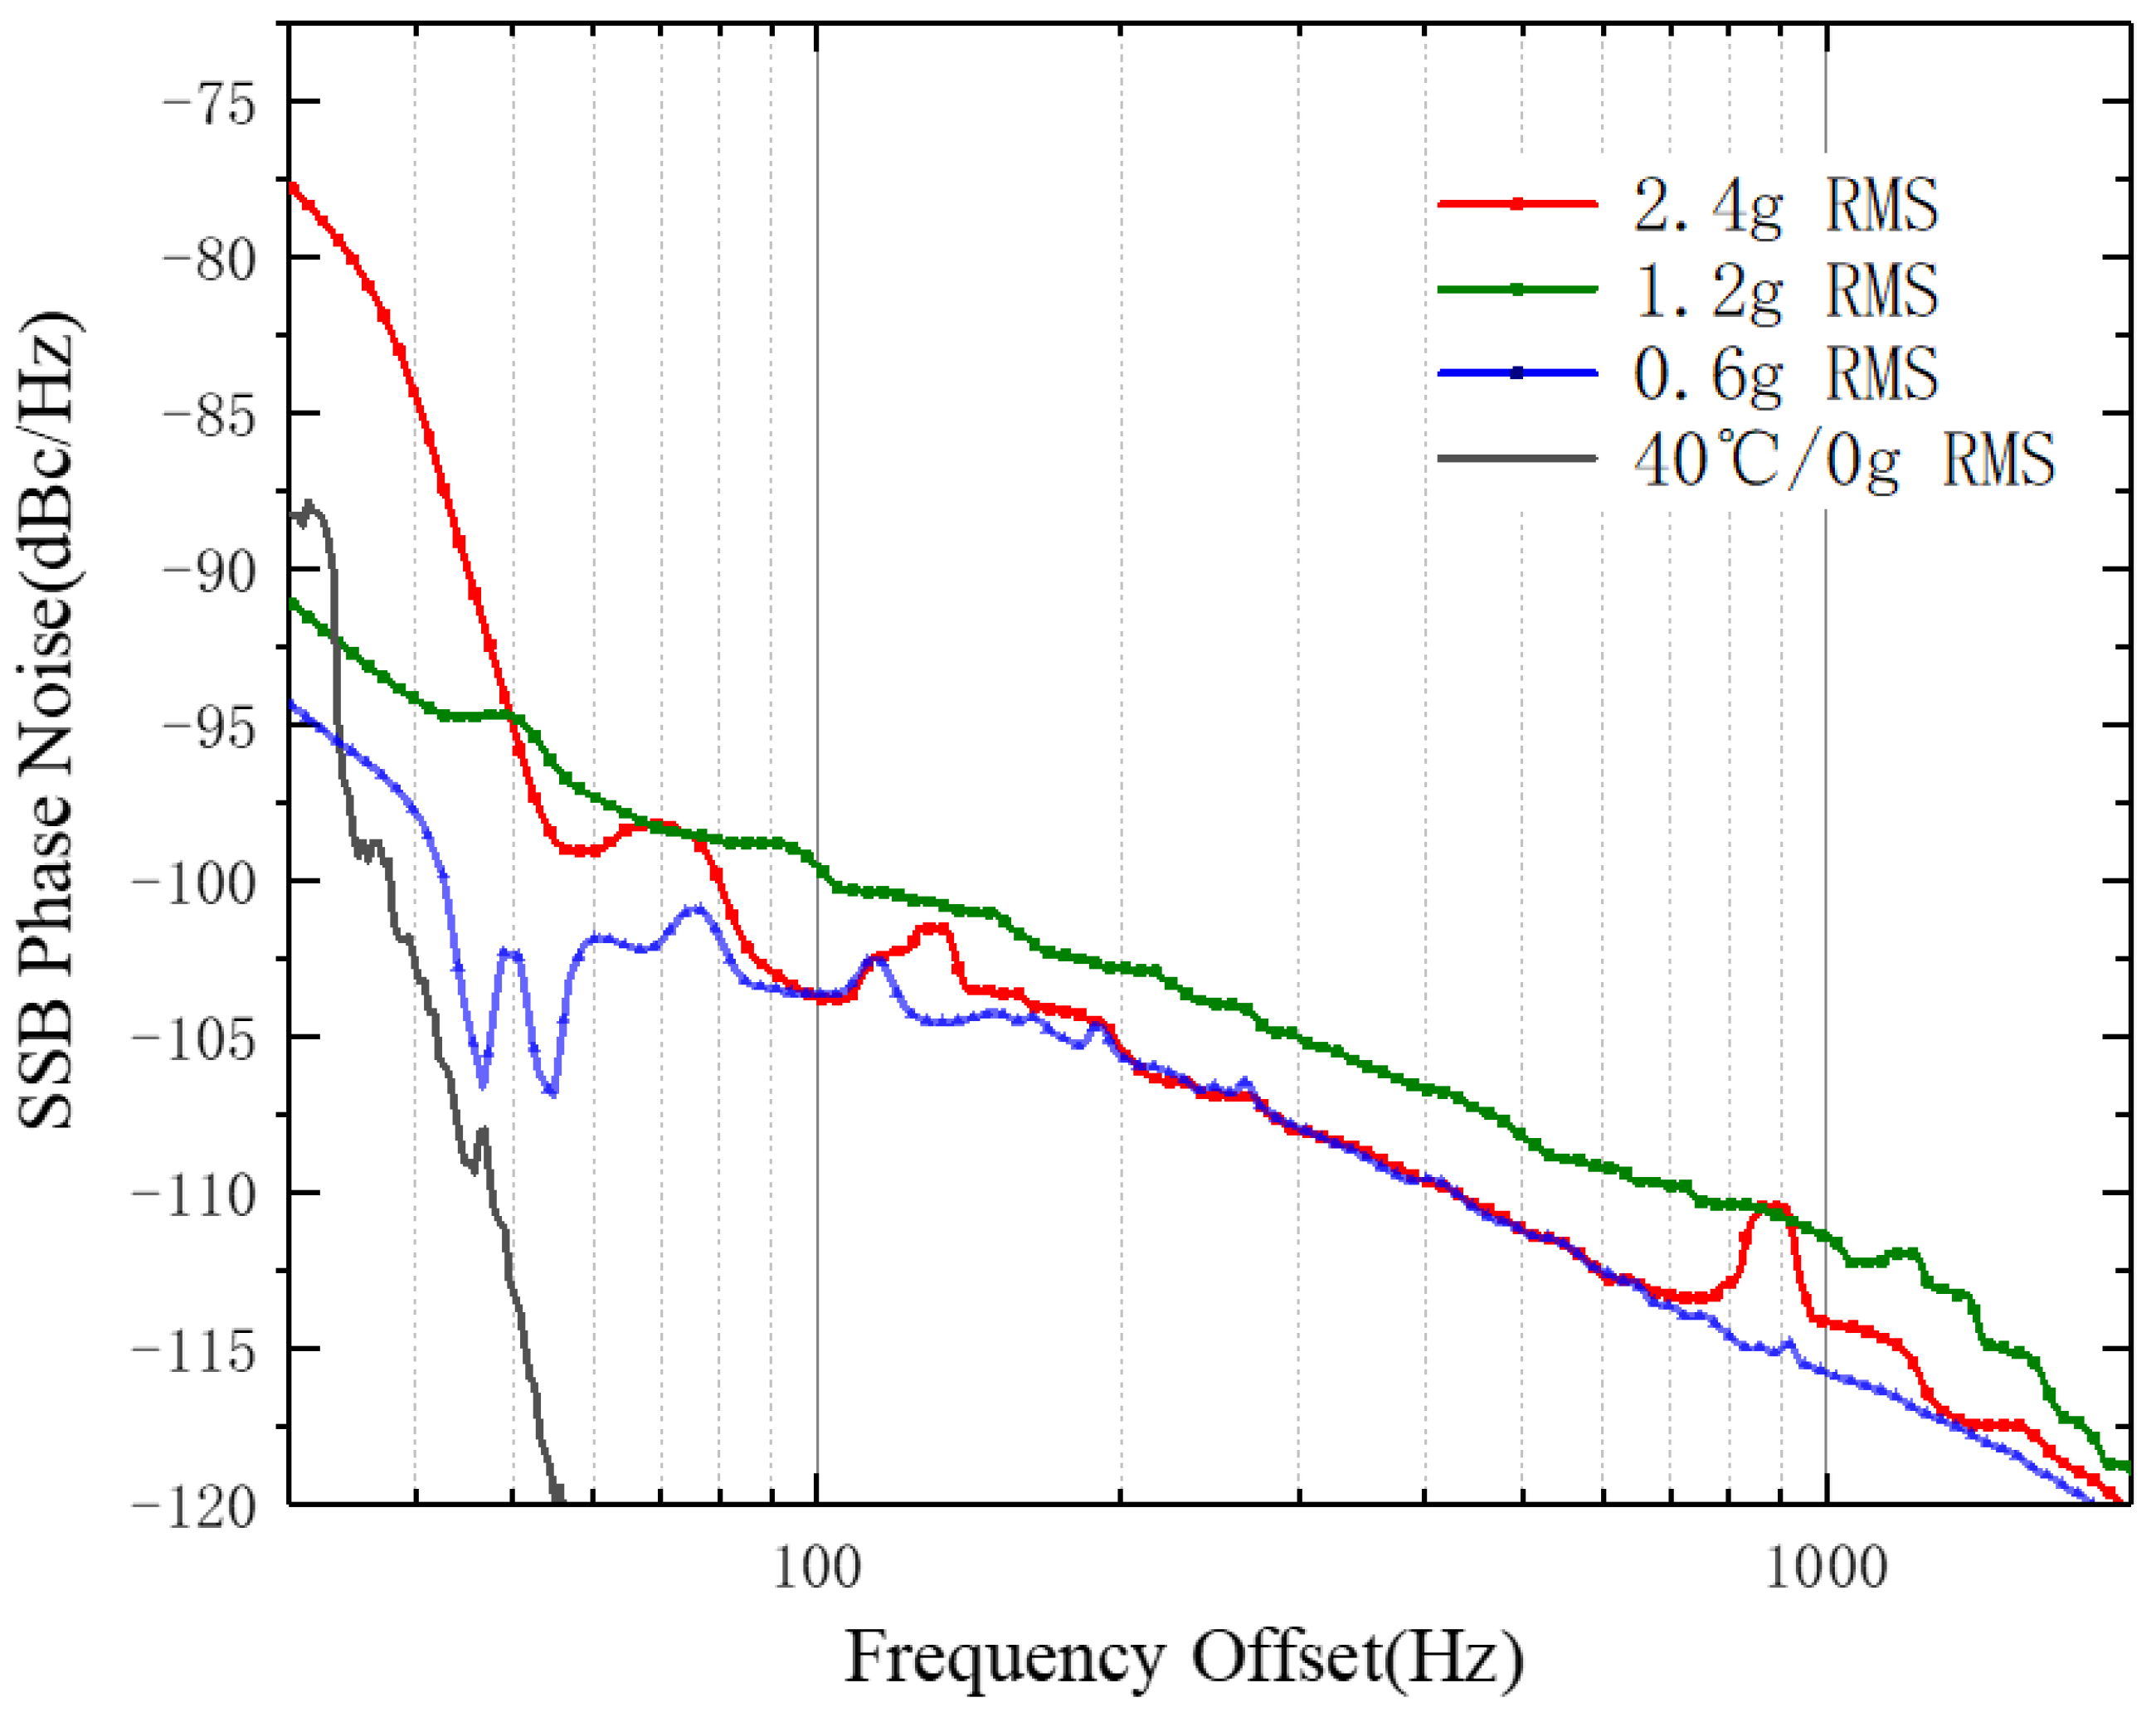
Additionally, Figure 10 shows a comparison of the phase noise curves in the near-carrier range for the 0–100 Hz interval. Under the conditions of 2.4 g RMS and 0.6 g RMS, the maximum phase noise error is 17 dBm, which is significantly higher than the phase noise under the gray curve representing no vibration (0 g RMS) and high-temperature conditions in the same frequency center. Compared to the error caused by temperature, vibration has a greater impact on the frequency in the near-carrier range. Under the 1.2 g RMS condition, the impact of vibration on this frequency range is relatively smooth.
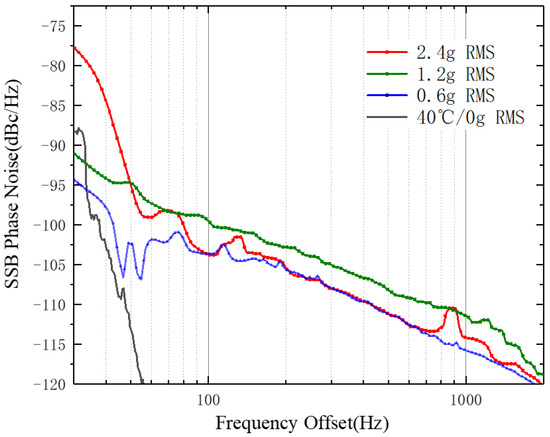
Figure 10.
Wideband noise and baseband phase noise curve of the system under different power spectral densities of vibration conditions.
Based on the proposed error model in this paper and considering the structure of the satellite signal generation system and the experimental results, it can be concluded that temperature and vibration have significant impacts on the phase noise in the near-carrier range, but their impacts on the pedestal phase noise and wideband phase noise are relatively small. The experiments show that when the power spectral density exceeds 1.2 g RMS, the phase noise increases significantly, and it becomes challenging for the simulation system to obtain accurate positioning information. Furthermore, it can be inferred that environmental factors primarily affect the signal source and the PLL (phase-locked loop) in the generation system, ultimately interfering with the accuracy of the semi-physical simulation system. On the other hand, the VCO (voltage-controlled oscillator) in the oscillation circuit is less affected by environmental factors.
4.3. Discussion
A comprehensive analysis of the experimental results from the simulation platform allows us to summarize the following:
- The experiment categorizes the factors affecting the signal generation system into two main types: random errors and systematic errors. This categorization emphasizes the need for experimenters to use at least two different types of observations to gain a broader understanding of the phenomena observed. As the simulation model becomes more complex, further research can be conducted to explore the relationship between the signal generation system and the communication reliability of various subsystems in the AECS.
- This paper only discusses the challenges posed by the structural configuration of the semi-physical simulation platform on the experiments. However, in certain cases, different physical structures of semi-physical simulation models can also improve the communication effectiveness of an AECS. To further enhance the platform, the authors can investigate and modify the physical architecture of the semi-physical simulation model, including the number and orientation of vehicle antennas and the ground station model. These modifications aim to further improve the platform’s performance under anticipated conditions.
In conclusion, the phase noise metric used in this study revealed statistically significant differences between conditions with and without environmental influences. This result is particularly evident under experimental conditions involving random vibration and impact stress (PSD > 1.2 g RMS), as the traction vibration caused by uneven laboratory terrain can greatly affect these variables.
5. Conclusions
The main objective of this study was to explore the feasibility and effectiveness of a semi-physical simulation model based on the generation system for simulating post-collision AECS tests. By constructing the simulation platform, we were able to obtain test data independent of transmission conditions and other boundary conditions such as real vehicle collision experiments and complex electromagnetic environments. Based on the obtained results, the following conclusions can be drawn:
- The satellite signal simulation system constructed in this study provides a method for evaluating the correlation of test conditions based on a phase noise analysis using the power spectral density phase noise model. This method can optimize the existing AECS test design and is suitable for high-precision tests that require the accurate determination of error sources related to environmental factors. By improving the error model without increasing real vehicle collision tests or simulated collision tests, effective calibration and improvement measures can be developed, leading to the improved accuracy and reliability of the satellite signal simulation system.
- Through repeated experiments with different test conditions on the simulation platform, this research focused on the post-collision emergency call test method based on the simulation platform. By analyzing the errors in the environmental generation module of the system, test conditions were identified that improved the accuracy and repeatability of the experiments. Specifically, maintaining the test equipment at higher temperatures and increasing its vibration resistance can effectively enhance the accuracy of the tests. Thus, it is recommended to conduct AECS inspection tests at higher temperatures while ensuring the equipment has sufficient vibration resistance to achieve improved test accuracy.
- The analysis of the experimental results reveals that environmental factors have varying degrees of influence on different components of the satellite signal simulation system. In terms of the hardware design for the simulation system, the signal source and phase-locked loop (PLL) of the generation system are more susceptible to environmental factors. On the other hand, the voltage-controlled oscillator (VCO) in the oscillation circuit is less affected. Future research that delves deeper into the impact of environmental factors on the system accuracy can lead to targeted improvements in the system design, the optimization of testing environments, and the reduction in errors caused by environmental factors. Additionally, for components that are significantly impacted, such as the signal source and PLL, appropriate calibration and adjustment measures can be implemented to significantly enhance the accuracy and reliability of the system.
Author Contributions
Conceptualization, Y.F. and X.N.; methodology, Y.F. and X.N.; software, Y.F.; validation, Y.F. and X.N.; formal analysis, J.Y.; investigation, commercial affairs.; resources; data curation; writing—original draft preparation; writing—review and editing, Y.F., Z.F. and X.N.; visualization, Z.F.; supervision, Z.F.; project administration, Z.F.; funding acquisition, B.W. All authors have read and agreed to the published version of the manuscript.
Funding
This research was funded by Significant Technological Research and Development Projects in Shunyi District, Beijing.
Data Availability Statement
All data are contained within the article.
Conflicts of Interest
The authors declare no conflict of interest. The authors YiNing Fu, JingXuan Yang, BingJian Wang, and Zhe Fang were employed by the Beijing Products Quality Supervision and Inspection Research Institute; XinDong Ni was pursuing studies at China Agricultural University. The remaining authors declare that the research was conducted in the absence of any commercial or financial relationships that could be construed as potential conflicts of interest.
References
- Wang, Z.G.; Zhan, J.; Duan, C.G.; Guan, X.; Lu, P.P.; Yang, K. A Review of Vehicle Detection Techniques for Intelligent Vehicles. IEEE Trans. Neural Netw. Learn. Syst. 2022, 34, 3811–3831. [Google Scholar] [CrossRef]
- Kuang, X.; Zhao, F.; Hao, H.; Liu, Z. Intelligent connected vehicles: The industrial practices and impacts on automotive value-chains in China. Asia Pac. Bus. Rev. 2018, 24, 1–21. [Google Scholar] [CrossRef]
- He, K.; Qin, K.; Wang, C.; Fang, X. Research on Cyber Security Test Method for GNSS of Intelligent Connected Vehicle. In Proceedings of the 2020 International Conference on Computer Information and Big Data Applications (CIBDA), Guiyang, China, 17–19 April 2020; pp. 200–203. [Google Scholar]
- Ma, F.W.; Shi, J.Z.; Wu, L.; Dai, K.; Zhong, S.R. Consistent Monocular Ackermann Visual–Inertial Odometry for Intelligent and Connected Vehicle Localization. Sensors 2020, 20, 5757. [Google Scholar] [CrossRef]
- Zhang, C.L.; Wei, J.M.; Dai, J.A.; Qu, S.B.; She, X.N.; Wang, Z.T. A Roadside Millimeter-Wave Radar Calibration Method Based on Connected Vehicle Technology. IEEE Intell. Transp. Syst. Mag. 2022, 15, 117–131. [Google Scholar] [CrossRef]
- Sun, C.; Zheng, S.F.; Ma, Y.L.; Chu, D.F.; Yang, J.R.; Zhou, Y.C.; Li, Y.C.; Xu, T.X. An active safety control method of collision avoidance for intelligent connected vehicle based on driving risk perception. J. Intell. Manuf. 2021, 32, 1249–1269. [Google Scholar] [CrossRef]
- Oorni, R.; Goulart, A. In-Vehicle Emergency Call Services: eCall and Beyond. IEEE Commun. Mag. 2017, 55, 159–165. [Google Scholar] [CrossRef]
- Niu, X.J.; Dai, Y.H.; Liu, T.Y.; Chen, Q.J.; Zhang, Q. Feature-based GNSS positioning error consistency optimization for GNSS/INS integrated system. GPS Solut. 2023, 27, 89. [Google Scholar] [CrossRef]
- Liu, W.; Huang, H.; Hu, Y.; Mou, M.; Hsieh, T.-H.; Hu, Q.; Wang, S. Improved GNSS vector tracking loop to enhance the navigation performance of USV. Ocean Eng. 2022, 258, 111865. [Google Scholar] [CrossRef]
- Chang, H.; Pang, C.; Zhang, L.; Guo, Z. Rotating Single-Antenna Spoofing Signal Detection Method Based on IPNN. Sensors 2022, 22, 7141. [Google Scholar] [CrossRef]
- Sulistya, B.; Taufik, N.; Renaldy, F.; Rufiyanto, A.; Trihatmo, S.; Sunandar, R.; Irawan, B.B.; Rahmatullah, R.; Mundhola, A.; Septiawan, R. GNSS Positioning Performance Monitoring of ADS-B stations for Autonomous Electric Vehicle (AEV) environment testing. In Proceedings of the 2022 International Seminar on Intelligent Technology and Its Applications (ISITIA), Surabaya, Indonesia, 20–21 July 2022; pp. 291–295. [Google Scholar]
- UN ECE Regulation No.144. Uniform provisions concerning the Accident Emergency Call Systems (AECS). 2021. 505/Rev.3/Add.143, (ECE/TRANS/WP.29).
- Abroe, G.E.; Zulkifli SA, B.M.; Kumar, K.; El Ouanjli, N.; Asirvadam, V.S.; Mossa, M.A. Comprehensive Review of Recent Advancements in Battery Technology, Propulsion, Power Interfaces, and Vehicle Network Systems for Intelligent Autonomous and Connected Electric Vehicles. Energies 2023, 16, 2925. [Google Scholar] [CrossRef]
- Yin, S.; Yang, C.; Kawsar, I.; Du, H.; Pan, Y. Longitudinal Predictive Control for Vehicle-Following Collision Avoidance in Autonomous Driving Considering Distance and Acceleration Compensation. Sensors 2022, 22, 7395. [Google Scholar] [CrossRef] [PubMed]
- Sun, Z.; Fan, Y.; Wang, G. An Intelligent Algorithm for USVs Collision Avoidance Based on Deep Reinforcement Learning Approach with Navigation Characteristics. J. Mar. Sci. Eng. 2023, 11, 812. [Google Scholar] [CrossRef]
- Fang, K.; Zhou, Y.; Ma, P.; Yang, M. Credibility evaluation of hardware-in-the-loop simulation systems. In Proceedings of the 2018 Chinese Control and Decision Conference (CCDC), Shenyang, China, 9–11 June 2018; pp. 3794–3799. [Google Scholar]
- Esfandyari, M.J.; Yazdi, M.R.H.; Esfahanian, V.; Nehzati, H. A Low-Cost Single PC Based HiL Simulation Platform for Verification of The Hybrid Electric Vehicle Control Unit. In Proceedings of the Electrical Engineering (ICEE), Iranian Conference on Iranian Conference on Electrical Engineering (ICEE), Mashhad, Iran, 8–10 May 2018. [Google Scholar]
- Chen, D.; Zhang, Y.; Pang, G.; Gao, F.; Duan, L. A Hybrid Scheme for Disaster-Monitoring Applications in Wireless Sensor Networks. Sensors 2023, 23, 5068. [Google Scholar] [CrossRef]
- Ferrari, P.; Sisinni, E.; Bellagente, P.; Depari, A.; Carvalho, D.F.; Flammini, A.; Pasetti, M.; Rinaldi, S. Simulating scalability of a transparent LoRaWan enhancement for emergency communication. In Proceedings of the 2022 IEEE International Workshop on Metrology for Industry 4.0 & IoT (MetroInd4.0&IoT), Trento, Italy, 7–9 June 2022; pp. 349–353. [Google Scholar]
- Wang, J.; Wu, J.; Zheng, X.; Ni, D.; Li, K. Driving safety field theory modeling and its application in pre-collision warning system. Transp. Res. Part C Emerg. Technol. 2016, 72, 306–324. [Google Scholar] [CrossRef]
- Rana, S.; Asaduzzaman. Vibration based pavement roughness monitoring system using vehicle dynamics and smartphone with estimated vehicle parameters. Results Eng. 2021, 12, 100294. [Google Scholar] [CrossRef]
- Novat, N.; Kidando, E.; Kutela, B.; Kitali, A.E. A comparative study of collision types between automated and conventional vehicles using Bayesian probabilistic inferences. J. Saf. Res. 2023, 84, 251–260. [Google Scholar] [CrossRef]
- Chen, C.; Xiang, H.; Qiu, T.; Wang, C.; Zhou, Y.; Chang, V. A rear-end collision prediction scheme based on deep learning in the Internet of Vehicles. J. Parallel Distrib. Comput. 2018, 117, 192–204. [Google Scholar] [CrossRef]
- Chen, G.-y.; Wang, J.-q.; Hu, H.-y. An Integrated GNSS/INS/DR Positioning Strategy Considering Nonholonomic Constraints for Intelligent Vehicle. In Proceedings of the 2022 6th CAA International Conference on Vehicular Control and Intelligence (CVCI), Nanjing, China, 28–30 October 2022; pp. 1–6. [Google Scholar]
- Elsayed, H.; El-Mowafy, A.; Wang, K. Bounding of correlated double-differenced GNSS observation errors using NRTK for precise positioning of autonomous vehicles. Measurement 2023, 206, 112303. [Google Scholar] [CrossRef]
- Rafatnia, S.; Mirzaei, M. Estimation of reliable vehicle dynamic model using IMU/GNSS data fusion for stability controller design. Mech. Syst. Signal Process. 2022, 168, 108593. [Google Scholar] [CrossRef]
- Zhu, C.; Shi, L.; Li, X.; Liu, Y.; Ai, W. Lock threshold deterioration induced by antenna vibration and signal coupling effects in hypersonic vehicle carrier tracking system of Ka band. Chin. J. Aeronaut. 2018, 31, 776–781. [Google Scholar] [CrossRef]
- Bai, L.; Zhou, W.; Li, W.; Zhang, Y. Stress processing based TCXOS. Chin. J. Sci. Instrum. 2014, 35, 1594–1599. [Google Scholar]
- Da Silva, E. (Ed.) Oscillators and frequency synthesizers. In High Frequency and Microwave Engineering; Butterworth-Heinemann: Oxford, UK, 2001; pp. 357–399. [Google Scholar]
- LUO Kaiwen, L.Q.M. Damage Boundary of Crystal Oscillator under Shock Environment. Chin. J. High Press. Phys. 2021, 35, 1. [Google Scholar]
- Liu, Q.A.; Xiang, Z.Y.; Mo, J.L.; Zhang, Q.X.; Zhu, Y.G. The effects of the structural stiffness of vibration transfer path on friction-induced vibration and noise. Tribol. Int. 2022, 173, 107687. [Google Scholar] [CrossRef]
- Dishan, H. Phase error in fast Fourier transform analysis. Mech. Syst. Signal Process. 1995, 9, 113–118. [Google Scholar] [CrossRef]
- Prezelj, J.; Čurović, L.; Novaković, T.; Murovec, J. A novel approach to localization of environmental noise sources: Sub-windowing for time domain beamforming. Appl. Acoust. 2022, 195, 108836. [Google Scholar] [CrossRef]
- Ding, M.; Chen, W.; Ding, W. Performance analysis of a normal GNSS receiver model under different types of jamming signals. Measurement 2023, 214, 112786. [Google Scholar] [CrossRef]
- Dobkin, D.M. (Ed.) Chapter 4—Radio Transmitters and Receivers. In RF Engineering for Wireless Networks; Newnes: Burlington, VT, USA, 2005; pp. 107–192. [Google Scholar]
- Jin, Z.; Liu, D.; Hu, A.; Shan, X.; Zhang, C.; Su, Y.; Zou, X.; Zhao, X. An accurate ISF-based analysis and simulation method for phase noise in LC/Ring oscillators. Microelectron. J. 2021, 117, 105240. [Google Scholar] [CrossRef]
- Salzenstein, P.; Wu, T.Y. Uncertainty analysis for a phase-detector based phase noise measurement system. Measurement 2016, 85, 118–123. [Google Scholar] [CrossRef]


Disclaimer/Publisher’s Note: The statements, opinions and data contained in all publications are solely those of the individual author(s) and contributor(s) and not of MDPI and/or the editor(s). MDPI and/or the editor(s) disclaim responsibility for any injury to people or property resulting from any ideas, methods, instructions or products referred to in the content. |
© 2023 by the authors. Licensee MDPI, Basel, Switzerland. This article is an open access article distributed under the terms and conditions of the Creative Commons Attribution (CC BY) license (https://creativecommons.org/licenses/by/4.0/).