Article

Strategic Approach for Electric Vehicle Charging Infrastructure for Efficient Mobility along Highways: A Real Case Study in Spain

by
Alessandro Saldarini
,
Seyed Mahdi Miraftabzadeh
*,
Morris Brenna
and
Michela Longo
Department of Energy, Politecnico di Milano, Via la Masa 34, 20156 Milan, Italy
*
Author to whom correspondence should be addressed.
Vehicles 2023, 5(3), 761-779; https://doi.org/10.3390/vehicles5030042
Submission received: 23 May 2023 / Revised: 24 June 2023 / Accepted: 27 June 2023 / Published: 1 July 2023

Abstract

:
The Electric Vehicle (EV) market has been growing exponentially in recent years, which is why the distribution network of public charging stations will be subject to expansion and upgrading. In order to improve the public charging infrastructure, this paper aims to develop a model capable of analyzing the current situation of a stretch of highway, identifying the congestion points, created by the formation of queues at the charging points. A specific section of a highway in Spain was selected as a case study to evaluate the performance of the model, allowing for rigorous testing and thorough analysis of its performance in a real-world scenario. The first step is to define and evaluate the effects of factors affecting EV consumption, such as the slope of the road, weather conditions, and driving style. Subsequently, a simulation model is developed using the agent-based simulation software AnyLogic, which simulates the journey of a fleet of electric vehicles, taking into account the battery charging and discharging process. Based on the obtained results, the charging infrastructure is improved to minimize the total travel time of an electric vehicle on a long-distance trip.

1. Introduction

The transportation sector is the major contributor to pollution, with 21% of the total carbon dioxide emissions [1]. Private cars are a significant polluter, accounting for 60.7% of total road transport emissions in Europe [2]. Furthermore, emissions from road vehicles also contribute to high concentrations of air pollutants in many European cities, which often do not meet the air quality standards set by the European Union (EU) and the World Health Organization (WHO) [3]. Therefore, nowadays, a major challenge for all metropolises around the world is the implementation of low-emission vehicles. Electric vehicles (EVs) play an important role in achieving the ambitious global climate and air quality targets. The global climate agenda, created under the Paris Agreement to reduce emissions and prevent global warming, is driving towards the diffusion of EVs [4]. For this reason, the timely implementation of an adequate EV charging infrastructure is critical to the success of the EVs revolution. At the moment, the main restriction for massive deployment of EVs is—besides its price, range anxiety, and energy management [5,6]—the small number of charging points along roads. Despite its advantages, EV charging could have an important influence on the electric grid, mainly due to a rise in requests and power quality disturbances originated by the involved power electronic converters [7,8]. EVs do not only assist in mitigating C O 2 emissions, but also are able to integrate with Renewable Energy Systems (RESs), especially with Photovoltaic (PV) [9,10]. The efficiency of EV-RES integration can be further increased by efficient smart charging and demand-side management (DSM) methods [11,12]. EVs have a great potential to help to reduce the “Duck Curve” event caused by high PV penetration during noonday [13], and with the realization of smart charging strategies they can even cut back grid operating prices by smoothing the demand profile [14]. EVs are expected to evolve into a critical part of future grid networks under the concept of smart grids [15,16]. This work aims to develop a model capable of simulating the journey of a fleet of EVs along a highway route, evaluating travel times, recharging times, and energy consumption. The model is developed using AnyLogic 8.8.0, an agent-based simulation software, through which a multi-method modeling tool is introduced, which allows the development of an algorithm that describes the behavior that the EVs adopt during the simulation. Through the results obtained from the simulation, it is possible to identify the critical congestion points due to the formation of queues at the charging stations (CSs) along the route. After solving them, through an efficient infrastructure upgrade, it is possible to achieve a significant reduction in travel times. Thus, the developed model has demonstrated flexibility across various contexts and scenarios, serving as a valuable starting point for future advancements and enhancements due to its adaptability to different conditions. Furthermore, the primary features of the model are its scalability and adaptability to different case studies, in fact it is able to replicate in any type of route, from city to highway; the only change to be made concerns the input data of the charging infrastructures present on the designated route. As a result, this model serves as a robust framework that can be built upon to accommodate evolving needs and explore new possibilities, driving innovation and progress in the future. To validate and verify the proposed model, it has been applied to the case study, shown in the paper. The case study focuses on the Spanish highway that links the cities of Madrid and Malaga, serving as a representative scenario for analysis and evaluation within the research. By applying the model to this particular case, its effectiveness and applicability in real-world settings are confirmed.
The manuscript is structured according to the following topics: Section 2 provides the related work with the study of EV route planning and CS planning models; Section 3 presents the actual situation on CSs in Europe. In Section 4, the proposed model is described in detail. Section 5 presents the case study and Section 6 describes the methodology applied to calculate the energy consumption. Subsequently, in Section 7, the results obtained by the model and the improvements made to the charging infrastructure are discussed. Finally, Section 8 concludes the manuscript, summarizing the key findings and insights.

2. Related Work

This section delves into recent studies that highlight the importance of developing a new approach for EV route planning and CSs planning. These works emphasize the significance of minimizing travel time and propose alternative methods, such as the one presented in this article. Ref. [17] indicates that CSs should be regarded to comprise multi-types of charging facilities during the planning stage, and a new optimization model is proposed for the target of minimizing the annualized social cost of the whole EV charging system. The implementation of a charging infrastructure network is an essential prerequisite for the spread of EVs. Ref. [18] proposes how to calculate the required number of EV charging stations and determine their location on the road network. The aim is to plan the distribution of service areas to match the charging infrastructure. The authors in [19] show how the classical path planning problem is generally solved by two kinds of algorithms. The most commonly used algorithms are the Dijkstra shortest path algorithm [20] and the A* algorithm (a searching algorithm that is used to find the shortest path between an initial and a final point) [21]. They are based on the shortest time and shortest road principle but without other influencing factors. Later, the traditional shortest path method is improved. Machine learning is widely used in route planning combined with real-time traffic conditions to obtain meaningful route planning schemes that help predict road congestion and meaningful allocation of transportation facilities [22]. Furthermore, Ref. [23] proposes optimal route finding considering multiple CSs in a dynamic urban environment, but it is also applicable when the initially available battery capacity does not cover a given range. The Transit Route Design Problem (TRDP) and Transit Node Design Problem (TNDP) are used to search for the most feasible routes based on time and driving range via the improved Route-Assisted Rapid Random Tree (RA-RRT*) algorithm (a probabilistic complete global path planning algorithm that randomly samples the search space to obtain path points and finds a feasible path from start point to destination point). The optimal arrangement of charging infrastructure along roadways holds significant importance. Consequently, the authors in [24] present a method adopted for optimal planning in their study. The optimal sites of CSs are first identified by a two-step screening method with environmental factors and the service radius of CSs considered. Then, a mathematical model for the optimal sizing of charging stations is developed with the minimization of total cost and solved by a Modified Primal-Dual Interior Point Algorithm (MPDIPA). By addressing the strategic placement of CSs, this approach aims to maximize the effectiveness and accessibility of the charging network, ultimately facilitating seamless EV charging experiences. The low spread of EVs often hinders the investment in charging infrastructure and vice versa, making them drop into a chicken-egg dilemma. To solve this problem, Ref. [25] proposes a comprehensive planning scheme for EV charging networks. In order to alleviate the problems caused by too long charging queues, Ref. [26] proposes charging route planning. In this paper, based on state models of EVs, CSs, transportation networks, and power grids, it is important to ensure sufficient charging resources around the highway network when planning charging routes for users. The authors in [27] developed a multi-objective CS arranging strategy that can guarantee charging benefits and reduce travel times. A battery capacity-constrained EV flow capturing location model is offered to maximize the EV traffic flow that can be charged given a construction plan of CSs.
Several studies in the literature have explored and developed models for route planning and charging planning for EVs. However, most of these studies have primarily focused on minimizing costs and reducing range anxiety rather than optimizing travel time. While these factors are undoubtedly significant, the emphasis on travel time as a key criterion has been relatively limited in the existing literature. Accordingly, there is a need to investigate further and develop approaches that explicitly address travel time concerns, ensuring efficient and time-effective EV route planning and charging strategies. Therefore, this study provides a novel strategy for EV charging planning. The main differences between the previous studies and this work are as follows:
  • Through a series of improvements to the charging infrastructure, an attempt is made to reduce travel time, preferring fast DC recharges to slow AC recharges;
  • An innovative charging strategy approach is developed, which tells the EV user how much energy to charge at each CS, thus reducing charging times.

3. Overview of Charging Stations in Europe

The European Commission has set an ambitious objective for the next decade: to see a minimum of 30 million EVs cruising on the roads. By embracing sustainable transportation, the Commission aims to reduce carbon emissions, enhance air quality, and promote a cleaner and greener future for all. With this transformative vision, Europe is poised to pave the way toward a more electrified and sustainable transportation landscape, creating a brighter tomorrow for future generations [28]. The EU is actively advancing the adoption of electric mobility through various means. It not only encourages car manufacturers to produce low-emission vehicles but also supports the development of CSs. The development of the charging infrastructure plays a vital role in achieving the ambitious goal of zero emissions by 2050, aligning with the growing adoption of electric vehicles [29,30,31]. As EVs become increasingly predominant, it is crucial to ensure the availability and accessibility of charging stations ubiquitously. The ultimate policy objective is to make charging EVs as easy and as effortless as refueling a conventional vehicle, eliminating any barriers for EVs to travel seamlessly while alleviating concerns like range anxiety [32,33,34,35]. The European Commission with its 2020 Sustainable and Smart Mobility Strategy identified a need for three million public charging points by 2030 [36,37], so as to guarantee a dense, widely spread network to all customers. In 2010, electric CSs started to be installed in Europe with a total number equal to 400 units.
After that, the growth reached almost 500% in 2011, and then the growth rate decreased, reaching 224.237 CSs in 2020 [38]. The power rate of charging batteries is the main factor that classifies the charging equipment for battery EVs and plug-in hybrid EVs. On the other hand, the battery capacity of a vehicle (normally from 20 kWh to 85 kWh), the initial state of charge (SoC), and the type of the electric vehicle supply equipment (EVSE) determine the charging time, which can be in the range of 15 min to 10 h or more [39,40]. Four various charging modes based on different power charging levels, protection systems, and connector types are selected by the European standard IEC 62,196 [41,42,43]. The number of CHAdeMO DC quick chargers installed to date in Europe is greater than 7000 [44]. Across European countries, a significant infrastructure development phase is currently underway, with a particular emphasis on cities and highways. A key focus of this initiative is to address long-distance travel, ensuring that green mobility options are widely accessible and embraced. By strategically expanding the infrastructure network, European nations are actively working towards promoting and facilitating the adoption of sustainable transportation methods. With the European Green Deal proclaimed in December 2019, the EU focuses on reducing its greenhouse gas emissions from transport by 90% by 2050, compared to the year 1990, to evolve into a climate-neutral economy. A fundamental step in reducing emissions from road transport is the gradual transition to EVs and other fuel options with a lower carbon intensity. Among these alternatives, EVs stand out as the most prevalent, particularly for passenger vehicles. The European Commission acknowledged certain achievements in its assessment, such as establishing a unified EU standard for connectors and enhanced accessibility to diverse charging networks. However, the Commission also identified persisting challenges that hinder electric vehicle travel within the EU. Despite notable progress, obstacles still exist, impeding the seamless experience of EV owners and impinging on the widespread adoption of electric mobility. The accessibility of CSs exhibits significant variation across countries, and there remains insufficient information available for customers, compounded by the diverse payment systems adopted by different companies. The EU is currently facing challenges in meeting the Green Deal’s objective of achieving one million charging points by 2025. Furthermore, the EU lacks a comprehensive strategic roadmap for electric mobility, highlighting the need for focused efforts to address this gap and pave the way for a sustainable and electrified transportation future. Acknowledging the significance of a unified approach, the EU is actively working on developing a comprehensive strategy to support and expedite the progress of electric mobility throughout the region.

4. Methodology

The model is developed through the multi-method simulation software AnyLogic 8.8.0. This software combines the three paradigms of simulation modeling (Discrete event, Agent-based, and System Dynamic) in order to build highly complex simulation models. The model realized for this research is made of four fundamental elements: road section, electric vehicle, charging station, and checkpoint. The road section is realized using the tool GISroute, while the remaining three are identified as a population of agents. An agent is a unit of model design that can have behavior, memory (history), timing, and contacts. They may represent very diverse things: vehicles, units of equipment, projects, products, etc. Furthermore, within an agent, you can define variables, events, state charts, system dynamics stock and flow diagrams, you can also embed other agents and add process flowcharts. A set of agents of the same type constitutes an agent population.

4.1. Input Data

EV Agent: The initial agent comprehensively represents electric vehicle behavior, encompassing several identified variables. These variables include departure time, geographic location, initial SoC, battery size, maximum driving range, current driving range ( k m i ), and average speed. It is assumed that the EVs do not commence their journeys simultaneously but rather with a randomized delay ranging from 0 to 24 h. This random delay is extracted from a uniform continuous distribution, which is deliberately chosen to distribute the EV departures evenly across the day, promoting a staggered pattern.
CS Agent: The second agent represents the behavior of the charging station, establishing interaction with the EV Agent during each recharge session. The CS Agent is initialized with specific input data, including geographic allocation (longitude and latitude), the number of available charging points, connector type, and the maximum output power. These assigned parameters enable the CS to effectively engage with EVs, facilitating seamless charging operations while ensuring compatibility and optimal power delivery.
CP Agent: In the vicinity of each CS, monitoring agents known as checkpoints (CP) are installed with the primary objective of controlling specific parameters of the EVs, particularly the actual range. These CP Agents interact with each other, facilitating the exchange of information regarding the compatibility of CSs in terms of connector types. Compatibility, in this context, refers to the practical feasibility of charging, meaning that the CS is equipped with suitable connector types for the specific EV.
Among the various functions implemented by the CP Agents, their primary responsibility is to dynamically decide whether to halt charging or continue the journey close to each CS. This decision is based on multiple variables, including the compatibility of the charging type with the nearby CS, the remaining range of the EV, and the distance to the next compatible CS. By considering these factors, the CP Agents make informed and dynamic decisions to optimize the charging process and ensure efficient travel for the EV.
All input data stored in Microsoft Excel spreadsheets are transferred to the model using Open DataBase Connectivity (ODBC) 4.0 connections. During model initialization, the input data database is connected and the data from the database are used to populate the active main’s variable collection.

4.2. EV Behavior

The model is built as a discrete-event simulation model, with each vehicle modeled as a specific active object. Simulate specific processes related to travel operations: The EV agent simulates vehicle processes described by the state chart in Figure 1. It defines possible vehicle states and transitions between them. The EV Agent has a variable collection on its job list, variables for accumulation of times, and variables to count the amount of recharges, and to memorize the current range. Initially, the weather condition is manually configured by selecting from two predefined scenarios: cold or mild weather. This parameter plays a crucial role in determining the energy consumption of the EV and subsequently impacts the maximum driving range. The chosen weather condition directly influences the overall efficiency of the EVs’ performance, considering factors such as temperature, wind speed, and precipitation. By incorporating weather conditions into the model, a more realistic and accurate estimation of energy consumption and driving range can be achieved, enhancing the reliability of the simulation results.
The first step taken by the EV Agent, as the flow chart in Figure 1 shows, is to proceed towards the nearest checkpoint agent, where the actual range and km traveled variables are updated, depending on the distance travelled.
The next three steps, at the exit of the checkpoint block, concern as many verification conditions aimed at verifying the possibility and need to recharge the EV Agent at the nearest CS. The three verification conditions are defined as follows:
  • 1 condition: if the compatible variable (EV and CS are compatible) is true, then proceed to the second condition; otherwise, it jumps to the third condition. In particular, the mode and the type of connector of EV are compared with those present in the nearby CS. If there is compatibility, the charging mode and the type of connector with which a possible charge is selected according to a hierarchical process, preferring the fastest charging way.
  • 2 condition: if the inequality, i.e., actual range ( k m a c t u a l ) minus the kilometers to reach the next compatible CS ( k m N e x t C o m p a t i b l e C S ) is greater than the minimum range, which corresponds to 20% of the SoC), is true (1), then the EV proceeds to the third condition; otherwise, to the nearest compatible CS to charge.
    ( k m a c t u a l k m N e x t C o m p a t i b l e C S ) > k m m i n
  • 3 Condition: If the EV reaches the last CS, it proceeds to the destination otherwise to the next checkpoint agent.
The EV Agent adopts this behavior in a loop until the destination is reached, at which time the simulation stops, and the data obtained from the model are stored.
The EV Agent can only be charged once it has entered the CS block. The charging process is influenced by various characteristics that impact performance, including charging methods, charging power, and the amount of energy required for recharge. These factors collectively determine the efficiency and effectiveness of the EV charging process within the CS block. The model carefully examines each of these factors individually, providing a detailed description of how they have been incorporated and addressed within the model.
  • Ways of charging: The primary objective is to outline the conditions under which a vehicle can charge using either alternative current (AC) or direct current (DC). A hierarchical selection process is employed to optimize the charging time, with a preference for the DC mode over the AC mode. This preference stems from the fact that DC charging provides a higher power output compared to AC charging. In the context of “slow charging,” it refers to public AC charging stations with power ratings ranging from 7.4 kW to 11 kW and up to 22 kW. On the other hand, when referring to “high-power” charging, it pertains to direct current charging, where an AC to DC rectifier is positioned upstream at the charging station, bypassing the need for the onboard charger. High-power stations directly supply DC, starting from 50 kW and peaking at 350 kW, enabling rapid charging of electric vehicles. This distinction between slow and high-power charging emphasizes the varying power capabilities and technologies employed to facilitate efficient and expedited charging.
  • Charging power: The charging power is determined by two primary factors: the power capacity of the charging point and the maximum power limit accepted by the battery. When selecting the appropriate charging power, if these two values differ, the lower value is always prioritized and considered for charging. This approach ensures that the charging process remains within the constraints of the lower power limit, guaranteeing safe and optimal charging for the battery.
  • Charging kilometers: The model also emphasizes determining the required charging distance for electric vehicles at each charging station to minimize the overall travel time and ensure a suitable trip duration per the targeted distance. To achieve this, two distinct methods have been devised and proposed for implementation, as illustrated in Table 1. These methods provide practical approaches to optimize the charging process and enhance the efficiency of EV travel.
For 1° method, the following logic is adopted: the kilometers to be charged will be equal to the distance to the next compatible station, minus the difference between the current range and the minimum range. Meanwhile for 2° method: the charge will take place until 80% of the battery is charged. EVs’ batteries should be recharged up to 80% of the SoC for two main reasons. Firstly, beyond 80%, the charging speed of electric batteries decreases significantly [45]. This means that reaching 100% takes much longer than reaching 80%. Secondly, it is beneficial for the long-term health of the battery to keep it below a full charge of 100% [46].
Despite the higher cost associated with DC fast charging compared to slow AC charging (in Spain, fast charging can cost around 55 cents per kWh while slow charging may be priced around 20 cents per kWh), certain users may opt for slow charging to minimize expenses during the travel. This decision can effectively reduce the overall cost of the journey. However, the primary objective of the developed model is to minimize travel time and ensure the shortest possible duration to reach the destination, while adhering to speed limits and alleviating range anxiety as much as possible.
The process begins by determining the desired distance to be charged, which is then used to calculate the corresponding energy in terms of kWh required. Subsequently, considering the power consumption, the charging time can be calculated. Upon completion of charging, the range is updated, enabling the EV to resume its journey.

4.3. Output Data

The model has been programmed in such a way as to be able to extrapolate with output values the fundamental information that characterizes a road trip, both for the EV Agent and for the CS. As the primary performance measure defining the efficiency of an EV’s journey, the total time taken to reach the destination is selected. Among the other performance measures to be provided for further analysis are the number of top-ups made; the time required for refills, and the time spent queuing in CSs. As regards the CS, the following data are known: total charging time, total queue time, and total number of EVs charged.

5. Case Study

The case study analyzed in this manuscript concerns a stretch of highway connecting Madrid (A) to Malaga (B). Among the possible routes, the fastest one, with a total distance of 530 km (Figure 2) was selected. The route mainly consists of highway sections; the only urban areas refer to the city of Madrid and Malaga. However, considering that the maximum speed allowed on the highway is 120 k m / h [47], a constant average speed of 100 k m / h is maintained in the simulation. Under this assumption, with no stops and no travel breaks, the time required to travel the distance is about 5½ h [48].

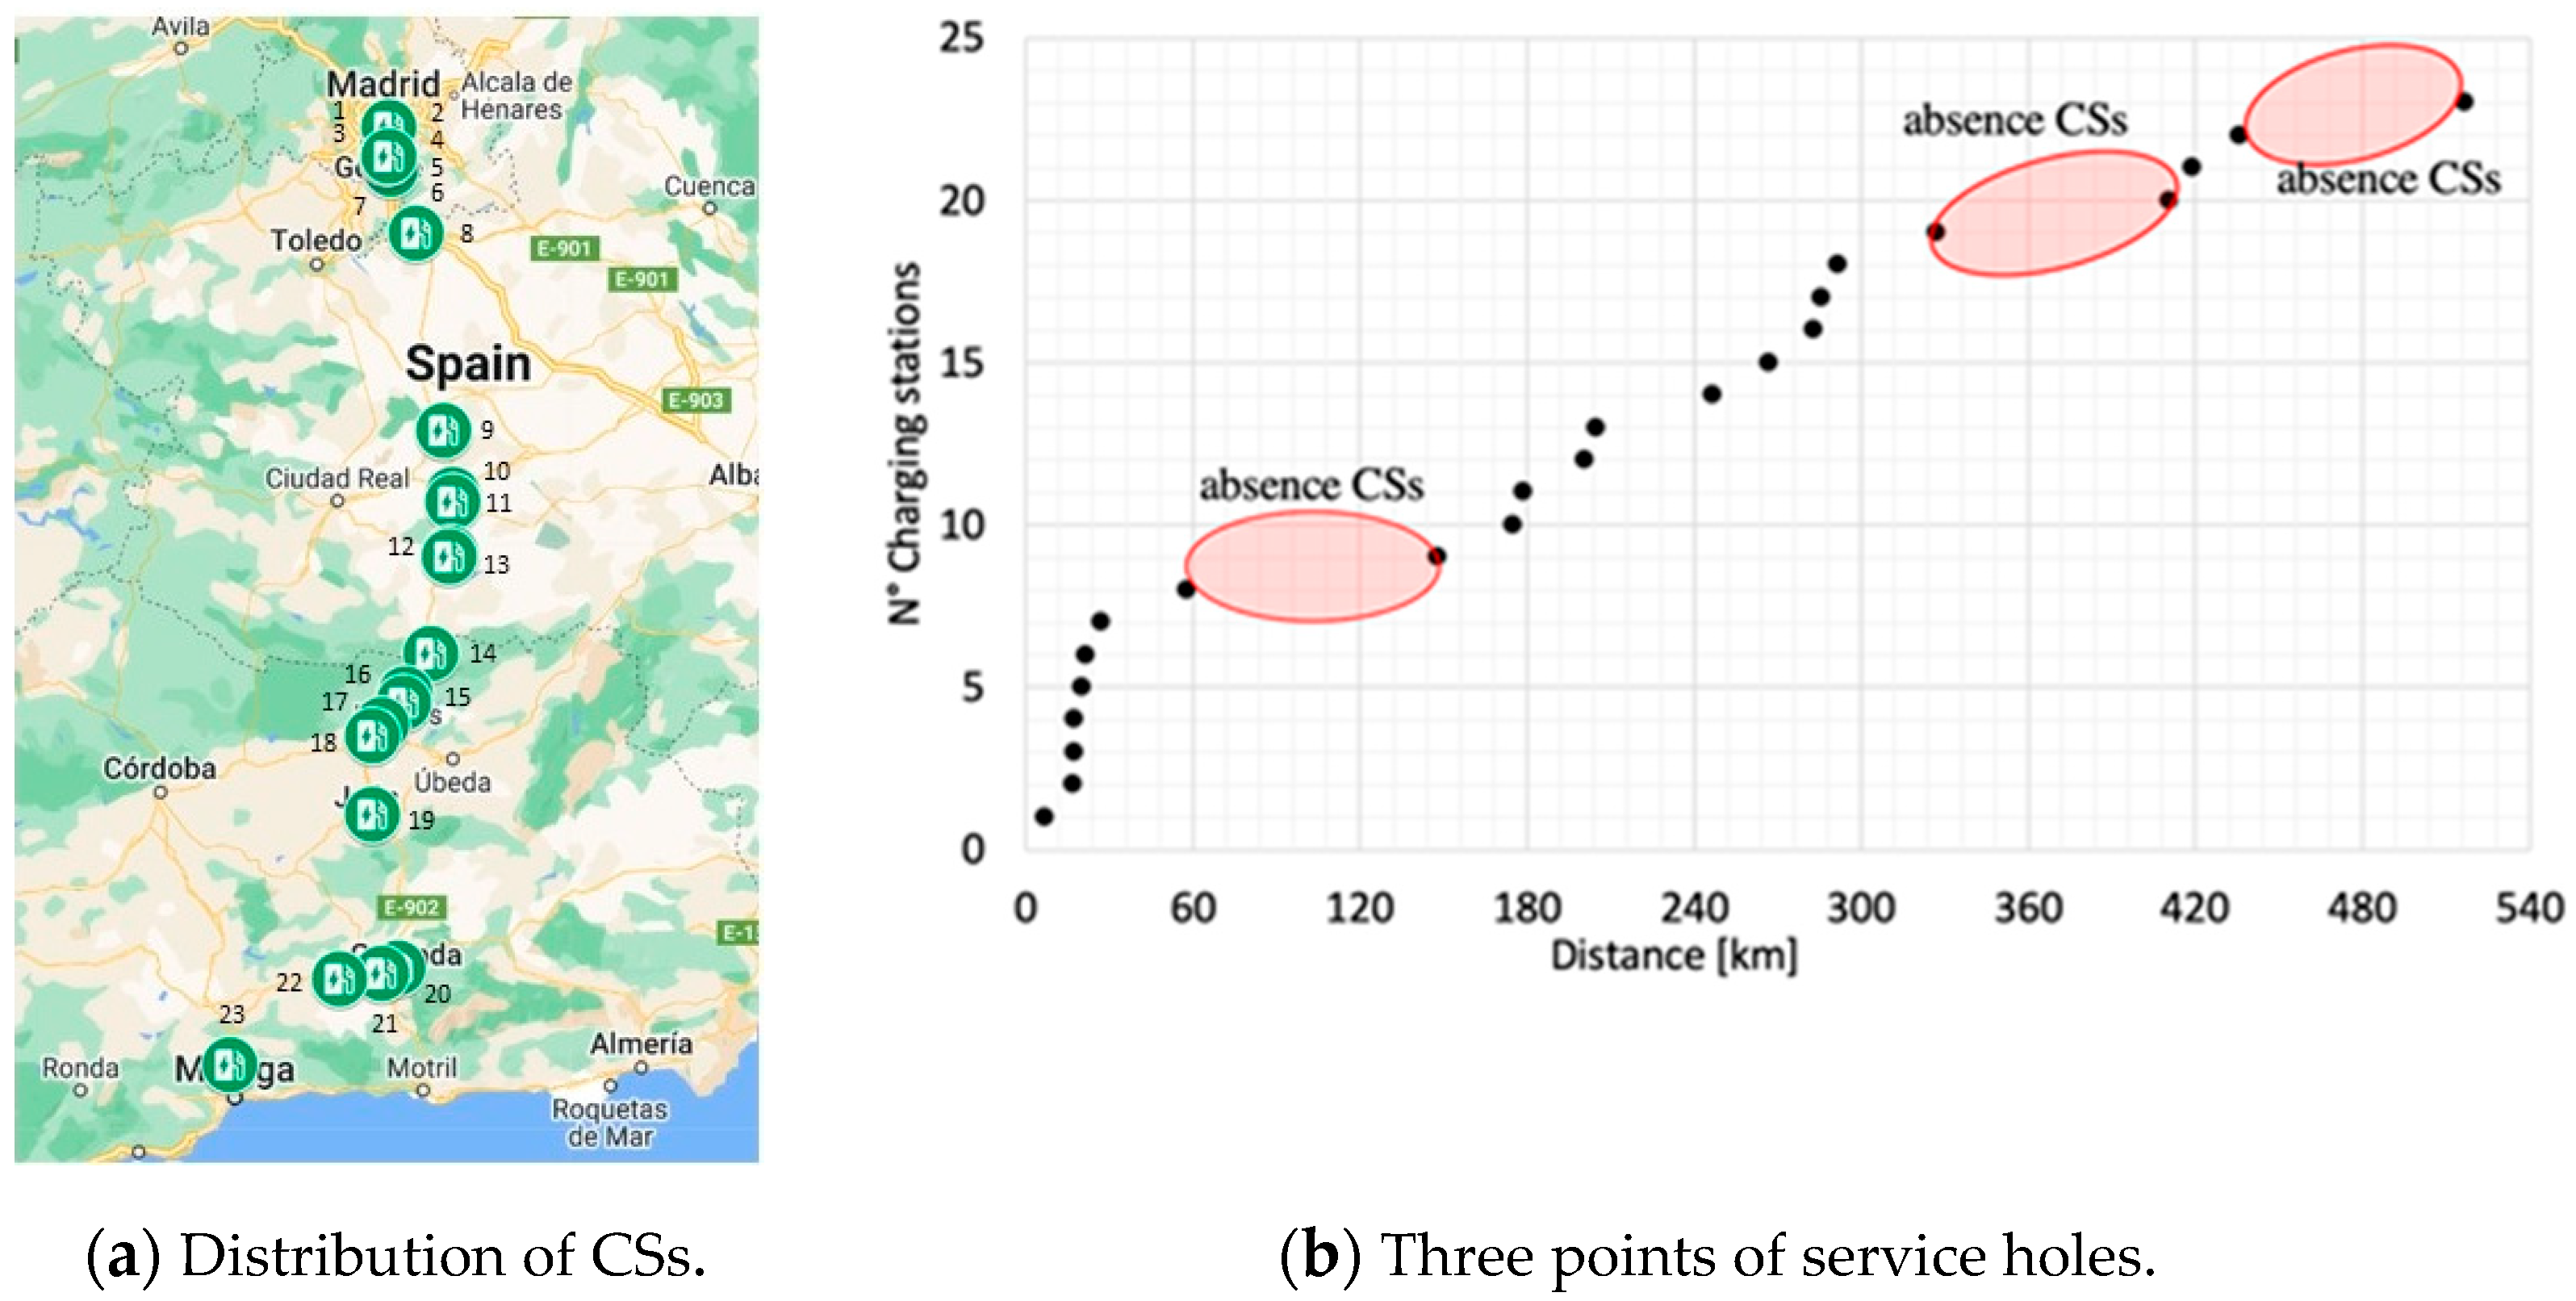
5.1. Charging Infrastructure along the Route

Once the route has been identified and configured for analysis within the model, the subsequent step involves adding CSs that fulfill the following criteria:
  • The CSs located only along the highway are considered, while it is intentionally chosen to ignore those easily accessible off the highway or present in urban areas;
  • CSs installed in cities (Madrid and Malaga) are not taken into account;
  • The selection of CSs was made considering the type of place: gas stations, public parking lots, hotels, and restaurants. The latter can be defined as public CSs, according to the regulatory framework, in which there is no distinction between private columns open to the public and public charging points;
  • The CSs were equipped with slow charging type 2 and fast charging: CCS Combo 2, CHAdeMO, and Supercharge.
Based on the aforementioned assumptions, the analysis, carried out through the Google Maps application, reveals the presence of 23 public CSs along the route from Madrid to Malaga [49]. Among these CSs, four stations are Tesla superchargers, boasting a power rating of 150 kW. Their precise locations along the highway are depicted in Figure 3. However, it is worth noting that the distribution of CSs is not uniform, with a concentration in specific urban areas. A closer examination of the distances between CSs reveals that only a span of 100 km is covered by the existing CSs. In contrast, the remaining sections of the highway, encompassing three prominent stretches (identified by red circles in Figure 3), comprise nearly 47.2% of the entire highway distance, amounting to approximately 250 km of service gap. These stretches represent significant areas lacking CS infrastructure, posing a challenge for EV drivers seeking to charge opportunities along these segments.

5.2. Road Slope

The impact of road slopes on electricity consumption is widely recognized as one of the critical factors affecting EVs [50,51]. Therefore, the proposed model thoroughly examines road slope as a topological parameter to assess its impact on selected path characteristics. The route is divided into 23 distinct sections to facilitate this analysis, with the extreme stations denoted as extreme stations CS2-CS1. For each of these sections, 23 elevation values are defined, as depicted in Figure 4. This comprehensive division enables a detailed evaluation of the varying road slopes along the route, aiding in the accurate estimation of electricity consumption and providing valuable insights into optimizing EV performance as well. The generated profile exhibits an average slope of −0.3%, with the most pronounced gradient recorded as −3.3% during the final segment before reaching the city of Malaga. Given the approximate −600 m difference in altitude between the Madrid and Malaga terminals, the battery consumption is relatively lower compared to a flat-ride scenario. By calculating the total energy consumption saved during the journey, amounting to −3.3 kWh, it can be inferred that approximately 22 km of the range is preserved to complete the trip [52]. This indicates the significant impact of varying slopes on energy efficiency, resulting in an extended driving range for the EV.
The contribution of energy consumption, as a function of the road gradient, is calculated as an aggregate of the sections of the route where the gradient does not fall within the range between −1% and 1%. In cases where the estimated slope parameter is within the specified range, the energy consumption calculation is neglected, since its contribution to the number calculations is irrelevant. Of the 23 sections identified, only 5 are taken into consideration, and they are: Madrid to 1, 3–4, 12–13, 15–16, and 22 to Malaga, shown in the following Table 2.

5.3. Traffic Volume

To assess areas where the charging infrastructure experiences higher stress levels, EV traffic flow is estimated. This analysis enables the identification of regions that may suffer from congestion and resulting delays, ultimately impacting the overall travel time. By understanding these patterns, appropriate measures can be taken to alleviate congestion, optimize the CSs infrastructure, and enhance the efficiency of EV travel. Two scenarios are considered for analyzing the stress of the charging infrastructure: one is simulated by considering the average traffic flow in the highway (regular traffic), while the other one considers an increase in the average traffic flow equal to 30% (intensive traffic). The traffic data related to 2019 are collected through an interactive map in which it is possible to visualize the daily traffic on the main highway in Spain [53]. Based on the available data, the daily average number of vehicles traveling in both directions on the understudy highway is recorded at 24.194. Meanwhile, in one direction alone, the average number of cars is 12.097. Considering that electric vehicles (PHEV and BEV) accounted for only 0.2% of the total passenger cars in Spain in 2019 [54], the estimated number of EVs circulating on the highway per day is 24. To account for the increased traffic intensity, it is assumed that the traffic flow experiences a 30% surge. Thus, the daily number of EVs traveling on the highway is projected to reach 31, reflecting the impact of heightened traffic conditions. An average of daily traffic flow is estimated as the number of EVs that travel the entire Madrid–Malaga route daily in the two scenarios of the simulation:
  • Regular traffic: is equivalent to 24 EVs per day;
  • Intense traffic: an increase of 30% and therefore equal to 31 EVs per day.

5.4. Electric Vehicles

A critical consideration in the simulation is the accurate modeling of EV characteristics. To ensure realistic representation, the ten most popular EV models in Spain in 2019 have been carefully chosen as reference vehicles. For each selected model, a comprehensive set of technical data were collected and reported as follows:
  • The battery capacity (kWh);
  • Range (km);
  • The charging powers AC/DC (kW).
These technical specifications encompass various essential parameters that influence the performance and behavior of the EVs during the simulation. Moreover, they are instrumental in accurately simulating the behavior and performance of the EVs, allowing for a comprehensive assessment of their charging and driving dynamics. By considering the specific characteristics of the popular EV models, the simulation can provide meaningful insights into the overall feasibility and efficiency of the charging infrastructure, aiding in the optimization and planning of EV charging networks. The values declared by the respective car manufacturers are shown in the following Table 3 [55].
By analyzing the registration data percentages in Spain, an estimation can be made regarding the number of vehicles to be simulated for each specific model of EV in two distinct scenarios: regular traffic and heavy traffic. This approach allows for a comprehensive assessment of the EV fleet composition and its impact under different traffic conditions, providing valuable insights for planning and simulation purposes.

6. Estimation of EV Energy Consumption

The range of an EV stands out as a crucial determinant in the context of electric mobility. Nevertheless, it is worth noting that the range declared by car manufacturers often varies significantly from the actual range experienced by the vehicles. When put to the test on the road, numerous variables come into play, exerting a substantial impact on an EV’s range. This section delves into examining the factors that exert the greatest influence on the SoC of EVs, thereby affecting its range. Additionally, a comprehensive analysis of these factors sheds light on the real-world range expectations and enhances our understanding of EV performance in varying conditions. The proposed model takes into account several significant factors that affect the energy consumption of an EV. These factors include the road slope, weather conditions, and driving style. However, the model intentionally excludes the consideration of speed variation along the route to maintain simplicity. Future works aim to incorporate and quantify additional factors for a more comprehensive analysis.

6.1. Factor: Weather Conditions

In harsh conditions, the temperature directly impacts the battery, resulting in decreased efficiency of the charging systems and a notable increase in charging time. Additionally, the shape of the charging battery SoC curves is affected. Low temperatures, in particular, can cause a substantial reduction in the range of electric vehicles, amounting to approximately 40% [56,57]. These temperature-related effects on EV performance highlight the significance of considering climate conditions and their implications on battery performance and range estimations. The main cause of this disparity is that EVs lack heat generation during their operation. As a result, all the energy required to maintain a comfortable temperature for passengers is directly sourced from the vehicle’s battery. This holds true not only for heating but also for situations when air conditioning is utilized. Consequently, the energy demand for temperature control in EVs directly impacts the available battery capacity and overall driving range. Therefore, the temperature significantly impacts energy consumption and must be considered during simulation. For the model, two possible climatic scenarios are identified, cold and mild, defined, respectively, in the following ways:
  • Cold weather: “worst case” based on a temperature of −10 °C and with the use of heating;
  • Mild weather: “best case” based on a temperature of 23 °C and no use of air conditioning.

6.2. Factor: Driving Style

Another parameter that influences the energy consumption of the battery EV is the driving style. For the simulation, it is necessary to quantify the differences in consumption based on the driving style. Traffic is assumed to be regular without congestion. However, it is supposed that the driver’s mood is constantly normal during the journey. Therefore, the average speed is constant, and there is no variability in acceleration and deceleration. From a practical point of view, the estimate of the energy consumption of the EV is carried out considering three different driving styles, which depend on the type of road, namely the driving style on the highway, in the city, and the mixed style. Since the route is predominantly highway, only the values referred to in the case of highway driving are considered. The percentage of the actual range in the case of highway driving, according to the weather conditions, will be multiplied by the range provided by the manufacturer, thus obtaining a more realistic estimate, in particular: mild weather is assumed at 75%, and in the case of cold weather is assumed at 58% [58].

7. Discussion of Results and Optimization

By combining the weather conditions and traffic volume, defined in Section 5.3 and Section 6.1, respectively, are obtained the four simulation scenarios:
  • Regular traffic—Mild/Cold weather;
  • Heavy traffic—Mild/Cold weather.
For each scenario, the following results (output data) are obtained:
  • Total travel time for each EV;
  • Time spent in queue versus actual charging time;
  • The number of charges for each CS.
Among these, it is decided to analyze and show the worst case that corresponds to heavy traffic and cold weather, as it turns out to be the most significant case in terms of results and the one with the most adverse conditions for the use of an EV.

7.1. Analysis and Discussion of Results on Worst Case

Figure 5 illustrates the trip characteristics for each EV, presenting the overall trip time (depicted in blue), time spent in queues (indicated in red), and charging time (represented in green). It is observed that variations in travel times primarily stem from queue wait times rather than charging durations, which remain relatively consistent across different EV models. Thus, this highlights the significance of queue management strategies in minimizing the overall trip duration and optimizing the EV charging experience. The Tesla models are an exception because they can use supercharger stations accessible only to them and, therefore, they are rarely subject to queues and are of higher power than other CSs.
Figure 6 presents the distribution of the number of recharges conducted at each charging station. The dashed line represents the maximum number of charges, which is 31, equivalent to the total number of simulated EVs. Notably, the presence of the “S” marker signifies supercharge stations that are exclusively compatible with Tesla vehicles. The analysis reveals that the CSs experiencing the highest stress level are positioned at the terminus of lengthy freeway sections devoid of charging infrastructure. As a consequence, a significant number of EVs are compelled to recharge at these locations, resulting in bottleneck scenarios. This observation highlights the critical need to address the inadequacies of charging infrastructure along these extended freeway segments, as it substantially impacts the overall efficiency and flow of EV travel.

7.2. Optimization Charging Infrastructure

Based on the data derived from the simulation of the “worst scenario”, it becomes evident that the existing conditions along the route are unsuitable for travelers with EVs [59]. Consequently, enhancing and optimizing the CSs along the route is necessary. The primary objective of optimizing the routing of CSs is to minimize the total travel time for EVs undertaking long-distance trips by reducing queue times. Queue time is identified as the principal factor influencing the overall duration of the trip. By prioritizing efficient CS routing, the aim is to provide EV travelers with a seamless and expedited charging experience, ultimately optimizing their travel time. Once the crucial points and underlying causes were identified, this paper developed a network optimization strategy with the primary objective of minimizing time. The strategy adopted consists both in the insertion of new charging columns and increasing the power and number of charging points in the stations along the route. Conceptually, the first factor has to make the distribution of stations uniform along the highway to eliminate possible “holes” in the charging infrastructure, while the second has the task of reducing queue times and consequently the overall travel time.
Figure 7 shows the distribution of the overall CS, highlighting the three new CSs (in red), the stations already present but improved (in green) and those not improved (in black). CSs in red are placed in fueling stations, i.e., in areas already built, so as not to have to implement new infrastructures along the highway.
Furthermore, the quantitative improvements implemented to the charging points for each charging station before and after the optimization process are presented in Table 4. The modified CSs, indicating the charging points that have been modified, are highlighted in green, while the newly added CSs are denoted in red and finally those remained unchanged are in white. This tabular representation provides a clear overview of the changes made to the CS infrastructure, demonstrating the efficacy of the proposed approach in enhancing the charging capabilities and capacity at each location.

7.3. Discussion Results after Optimization

The optimization process results are depicted in Figure 8, where a notable reduction in the overall trip time is evident. Specifically, in comparison to the previous scenario, travel time has experienced a substantial decrease of 66.68%. This reduction is primarily attributed to the decreased queue time, surpassing the charging time. These findings highlight the significant impact of optimizing the charging station routing on improving long-distance electric vehicle travel efficiency and time effectiveness.
The second notable improvement pertains to achieving a more equitable distribution of the number of charges across the various CSs. Prior to optimization, the distribution of charges is uneven, with some CSs experiencing a high influx of vehicles due to the considerable distance from the subsequent station. This discrepancy in charging demand is primarily attributable to the existence of service gaps that placed additional strain on CSs close to these gaps.
Following the optimization process, additional CSs are strategically added in areas lacking service, allowing EVs to choose from multiple stations based on their range capabilities rather than being restricted to a specific station. Consequently, the total charges in the simulation are now dispersed more evenly among more CSs, promoting a more balanced utilization of charging infrastructure. Notably, the last CS (CS No 23) exhibits the least utilization, with charges distributed between this CS and the preceding one, which is added during the optimization phase, as depicted in Figure 9. The newly implemented CSs are highlighted in red, the enhanced CSs in green, and the unchanged CSs in black, visually illustrating the modifications made to the CS network during the optimization process.
Lastly, the average travel times observed in all four scenarios, both before and after optimization, are documented. Notably, a significant time reduction of approximately two hours is achieved in the optimal scenario characterized by Normal Traffic–Mild Weather. Conversely, in the most unfavorable scenario, spanning the worst-case scenario with adverse conditions, the time saved amounts to an impressive nineteen hours. Figure 10 visually represents these findings, further highlighting the substantial improvements resulting from the optimization process.

8. Conclusions

The challenges of EVs as a key point in increasing the diffusion of EVs in the transport sector are the inspiration for this work. One of the factors contributing to the slow expansion of EVs is the reduced and inadequate public charging infrastructure network compared to user demand [60]. In order to improve the current public charging infrastructure, this paper aims to develop a model capable of simulating the journey of a fleet of electric vehicles, calculating travel times, and recreating the electric charging demand required of the charging infrastructure. Furthermore, it is possible to simulate the car journey in different scenarios, depending on the weather conditions and the traffic volume. Based on the obtained preliminary results, an improvement in the charging infrastructure, increasing the number of charging stations and charging points, is performed to minimize the total travel time of an EV on a long-distance trip. A significant decrease in the average travel time for electric vehicles becomes evident upon detailed analysis of the simulation results following infrastructure enhancements. Specifically, the average travel time has decreased from 28 to 10 h, highlighting the substantial improvement achieved due to the upgrades. The reduction in the average travel time is due to the fact that thanks to the presence of an infrastructural network, the queue time in the CS has been significantly reduced by almost 97% in a specific scenario.
The proposed study did not include an economic analysis resulting from the introduction of this new service. Therefore, the next steps of the research will focus on the calculation of an assessment of costs and emissions. To conclude, the model is able to obtain acceptable travel time results for an EV user facing a long journey. The model has been adapted to a specific case study but is scalable to any other type of path.

Author Contributions

Conceptualization, A.S. and M.L; methodology, A.S. and M.B; formal analysis, A.S. and S.M.M.; investigation, A.S. and S.M.M.; resources, S.M.M., M.B., and M.L.; writing—original draft preparation, A.S. and S.M.M.; writing—review and editing, A.S., S.M.M., M.B. and M.L.; visualization, A.S.; supervision, S.M.M. and M.L.; project administration, S.M.M. and M.L. All authors have read and agreed to the published version of the manuscript.

Funding

This research received funding from the European Union Next-GenerationEU (PIANO NAZIONALE DI RIPRESA E RESILIENZA (PNRR)–MISSIONE 4 COMPONENTE 2, INVESTIMENTO 1.4–D.D. 1033 17/06/2022, CN00000023).

Data Availability Statement

Supporting data are not available.

Acknowledgments

This study was carried out within the MOST–Sustainable Mobility Center. This manuscript reflects only the authors’ views and opinions, neither the European Union nor the European Commission can be considered responsible for them.

Conflicts of Interest

The authors declare no conflict of interest.

Abbreviations

ACAlternative Current
CSCharging Station
CPCheckpoint
DSMDemand-Side Management
DCDirect Current
EVElectric Vehicle
EVSEElectric Vehicle Supply Equipment
EUEuropean Union
MPDIPAModified Primal-Dual Interior Point Algorithm
ODBCOpen DataBase Connectivity
PVPhotovoltaic
RESRenewable Energy Systems
SoCState of Charge
TNDPTransit Node Design Problem
TRDPThe Transit Route Design Problem
WHOWorld Health Organization

References

  1. Emissions of Air Pollutants from Transport—European Environment Agency. Available online: https://www.eea.europa.eu/data-andmaps/indicators/transport-emissions-of-air-pollutants-8/transportemissions-of-air-pollutants-8 (accessed on 16 April 2022).
  2. CO2 Emissions from Cars: Facts and Figures. 2019. Available online: https://www.europarl.europa.eu/news/en/headlines/society/20190313STO31218/co2-emissions-from-cars-facts-and-figures-infographics (accessed on 16 April 2022).
  3. Gates, B. How to Avoid a Climate Disaster: The Solutions We Have and the Breakthroughs We Need; Knopf: New York, NY, USA, 2021. [Google Scholar]
  4. Air Quality Standards. Available online: https://www.who.int/health-topics/air-pollution#tab=tab_1 (accessed on 10 April 2022).
  5. Foiadelli, F.; Longo, M.; Miraftabzadeh, S. Energy consumption prediction of electric vehicles based on big data approach. In Proceedings of the 2018 IEEE International Conference on Environment and Electrical Engineering and 2018 IEEE Industrial and Commercial Power Systems Europe (EEEIC/I&CPS Europe), Palermo, Italy, 12–15 June 2018; pp. 1–6. [Google Scholar]
  6. Miraftabzadeh, S.M.; Longo, M.; Foiadelli, F. Estimation Model of Total Energy Consumptions of Electrical Vehicles under Different Driving Conditions. Energies 2021, 14, 854. [Google Scholar] [CrossRef]
  7. Dharmakeerthi, C.H.; Mithulananthan, N.; Saha, T.K. Overview of the impacts of plug-in electric vehicles on the power grid. In Proceedings of the 2011 IEEE PES Innovative Smart Grid Technologies, ISGT Asia 2011 Conference: Smarter Grid for Sustainable and Affordable Energy Future, Perth, WA, Australia, 13–16 November 2011. [Google Scholar]
  8. Fernández, G.; Torres, J.; Cervero, D.; García, E.; Alonso, M.Á.; Almajano, J.; Machín, S.; Bludszuweit, H.; Sanz, J.F. EV charging infrastructure in a petrol station, lessons learned. In Proceedings of the 2018 International Symposium on Industrial Electronics (INDEL), Banja Luka, Bosnia and Herzegovina, 1–3 November 2018. [Google Scholar]
  9. Sujitha, N.; Krithiga, S. RES based EV battery charging system: A review. Renew. Sustain. Energy Rev. 2017, 75, 978–988. [Google Scholar] [CrossRef]
  10. Mwasilu, F.; Justo, J.J.; Kim, E.-K.; Do, T.D.; Jung, J.-W. Electric vehicles and smart grid interaction: A review on vehicle to grid and renewable energy sources integration. Renew. Sustain. Energy Rev. 2014, 34, 501–516. [Google Scholar] [CrossRef]
  11. Mahmud, K.; Town, G.E.; Morsalin, S.; Hossain, M.J. Integration of electric vehicles and management in the internet of energy. Renew. Sustain. Energy Rev. 2018, 82, 4179–4203. [Google Scholar] [CrossRef]
  12. Lopez, K.L.; Gagne, C.; Gardner, M.A. Demand-side management using deep learning for smart charging of electric vehicles. IEEE Trans. Smart Grid 2019, 10, 2683–2691. [Google Scholar] [CrossRef]
  13. Salisbury, M.; Toor, W. How and why leading utilities are embracing electric vehicles. Electr. J. 2016, 29, 22–27. [Google Scholar] [CrossRef]
  14. Paterakis, N.G.; Erdinc, O.; Bakirtzis, A.G.; Catalão, J.P. Optimal household appliances scheduling under day-ahead pricing and load-shaping demand response strategies. IEEE Trans. Ind. Inform. 2015, 11, 1509–1519. [Google Scholar] [CrossRef]
  15. Tan, K.M.; Ramachandaramurthy, V.K.; Yong, J.Y. Integration of electric vehicles in smart grid: A review on vehicle to grid technologies and optimization techniques. Renew. Sustain. Energy Rev. 2016, 53, 720–732. [Google Scholar] [CrossRef]
  16. Gönül, Ö.; Duman, A.C.; Güler, Ö. Electric vehicles and charging infrastructure in Turkey: An overview. Renew. Sustain. Energy Rev. 2021, 143, 110913. [Google Scholar] [CrossRef]
  17. Luo, L.; Gu, W.; Zhou, S.; Huang, H.; Gao, S.; Han, J.; Wu, Z.; Dou, X. Optimal planning of electric vehicle charging stations comprising multi-types of charging facilities. Appl. Energy 2018, 226, 1087–1099, ISSN 0306-2619. [Google Scholar] [CrossRef]
  18. Micari, S.; Polimeni, A.; Napoli, G.; Andaloro, L.; Antonucci, V. Electric vehicle charging infrastructure planning in a road network. Renew. Sustain. Energy Rev. 2017, 80, 98–108, ISSN 1364-0321. [Google Scholar] [CrossRef]
  19. Zhou, Y.; Luo, Q. The Overview of Dynamic EV Path Planning. In Proceedings of the 2021 40th Chinese Control Conference (CCC), Shanghai, China, 26–28 July 2021; pp. 5874–5880. [Google Scholar] [CrossRef]
  20. Qing, G.; Zheng, Z.; Yue, X. Path-planning of automated guided vehicle based on improved Dijkstra algorithm. In Proceedings of the 29th Chinese Control and Decision Conference (CCDC), Chongqing, China, 28–30 May 2017; pp. 7138–7143. [Google Scholar]
  21. Cheng, L.; Liu, C.; Yan, B. Improved hierarchical A-star algorithm for optimal parking path planning of the large parking lot. In Proceedings of the IEEE International Conference on Information and Automation (ICIA), Hailar, China, 28–30 July 2014; pp. 695–698. [Google Scholar]
  22. Zhang, X.; Li, P.; Hu, J.; Liu, M.; Wang, G.; Qiu, J.; Chan, K.W. Yen’s Algorithm-Based Charging Facility Planning Considering Congestion in Coupled Transportation and Power Systems. IEEE Trans. Transp. Electrif. 2019, 5, 1134–1144. [Google Scholar] [CrossRef]
  23. Muhammad, S.; Zhou, Y. Path planning for EVs based on RA-RRT* model. Front. Energy Res. 2023, 10, 996726. [Google Scholar] [CrossRef]
  24. Liu, Z.; Wen, F.; Ledwich, G. Optimal Planning of Electric-Vehicle Charging Stations in Distribution Systems. IEEE Trans. Power Deliv. 2013, 28, 102–110. [Google Scholar] [CrossRef]
  25. Shi, L.; Hao, Y.; Lv, S.; Cipcigan, L.; Liang, J. A comprehensive charging network planning scheme for promoting EV charging infrastructure considering the Chicken-Eggs dilemma. Res. Transp. Econ. 2021, 88, 100837, ISSN 0739-8859. [Google Scholar] [CrossRef]
  26. He, Z.; Yang, X.; Wang, W.; Wu, D.; Ren, Y.; Cao, B.; Zhong, Y.; Su, S. Electric vehicle charging path planning considering the state of EV pile-road-grid. In Proceedings of the Seventh International Conference on Electromechanical Control Technology and Transportation (ICECTT 2022), Guangzhou, China, 26–28 May 2022; Volume 12302. [Google Scholar]
  27. Wang, G.; Xu, Z.; Wen, F.; Wong, K.P. Traffic-Constrained Multiobjective Planning of Electric-Vehicle Charging Stations. IEEE Trans. Power Deliv. 2013, 28, 2363–2372. [Google Scholar] [CrossRef]
  28. Hill, G.; Heidrich, O.; Creutzig, F.; Blythe, P. The role of electric vehicles in near-term mitigation pathways and achieving the UK’s carbon budget. Appl. Energy 2019, 251, 113111, ISSN 0306-2619. [Google Scholar] [CrossRef]
  29. Krause, J.; Thiel, C.; Tsokolis, D.; Samaras, Z.; Rota, C.; Ward, A.; Prenninger, P.; Coosemans, T.; Neugebauer, S.; Verhoeve, W. EU road vehicle energy consumption and CO2 emissions by 2050—Expert-based scenarios. Energy Policy 2020, 138, 111224, ISSN 0301-4215. [Google Scholar] [CrossRef]
  30. Rabiega, W.; Gorzałczyński, A.; Jeszke, R.; Mzyk, P.; Szczepański, K. How Long Will Combustion Vehicles Be Used? Polish Transport Sector on the Pathway to Climate Neutrality. Energies 2021, 14, 7871. [Google Scholar] [CrossRef]
  31. Pevec, D.; Babic, J.; Carvalho, A.; Ghiassi-Farrokhfal, Y.; Ketter, W.; Podobnik, V. Electric Vehicle Range Anxiety: An Obstacle for the Personal Transportation (R)evolution? In Proceedings of the 2019 4th International Conference on Smart and Sustainable Technologies (SpliTech), Split, Croatia, 18–21 June 2019; pp. 1–8. [Google Scholar] [CrossRef]
  32. Akakpo, A.; Gyasi, E.A.; Oduro, B.; Akpabot, S. Foresight organization policies and management strategies in electric vehicle technology advances at tesla. In Futures Thinking and Organizational Policy; Springer: Berlin/Heidelberg, Germany, 2019; pp. 57–69. [Google Scholar]
  33. Mashhoodi, B.; van der Blij, N. Drivers’ range anxiety and cost of new EV chargers in Amsterdam: A scenario-based optimization approach. Ann. GIS 2021, 27, 87–98. [Google Scholar] [CrossRef]
  34. Pevec, D.; Babic, J.; Kayser, M.A.; Carvalho, A.; Ghiassi-Farrokhfal, Y.; Podobnik, V. A data-driven statistical approach for extending electric vehicle charging infrastructure. Int. J. Energy Res. 2018, 42, 3102–3120. [Google Scholar] [CrossRef]
  35. Zhang, Z.; Chen, Z.; Xing, Q.; Ji, Z.; Zhang, T. Evaluation of the multi-dimensional growth potential of China’s public charging facilities for electric vehicles through 2030. Util. Policy 2022, 75, 101344, ISSN 0957-1787. [Google Scholar] [CrossRef]
  36. Gnann, T.; Plötz, P.; Wietschel, M. Can public slow charging accelerate plug-in electric vehicle sales? A simulation of charging infrastructure usage and its impact on plug-in electric vehicle sales for Germany. Int. J. Sustain. Transp. 2019, 13, 7. [Google Scholar] [CrossRef]
  37. Hall, D.; Wappelhorst, S.; Mock, P.; Lutsey, N. European Electric Vehicle Factbook 2019/2020. 17 July 2020. Available online: https://theicct.org/wp-content/uploads/2021/06/EV-EU-Factbook-2020.pdf (accessed on 24 May 2022).
  38. García-Martínez, E.; Muñoz-Cruzado-Alba, J.; Sanz-Osorio, J.F.; Perié, J.M. Design and Experimental Validation of Power Electric Vehicle Emulator for Testing Electric Vehicle Supply Equipment (EVSE) with Vehicle-to-Grid (V2G) Capability. Appl. Sci. 2021, 11, 11496. [Google Scholar] [CrossRef]
  39. Mineeshma, G.R.; Bhavya, Y.V.; Chandrasekar, V. Electric Vehicle Supply Equipment: An Overview on Design Requirements as per AIS-138. In Proceedings of the 2022 2nd International Conference on Power Electronics & IoT Applications in Renewable Energy and its Control (PARC), Mathura, India, 21–22 January 2022; pp. 1–6. [Google Scholar] [CrossRef]
  40. Shariff, S.M.; Alam, M.S.; Faraz, S.; Khan, M.A.; Abbas, A.; Amir, M. Economic Approach to Design of a Level 2 Residential Electric Vehicle Supply Equipment. In Advances in Power and Control Engineering; Singh, S., Pandey, R., Panigrahi, B., Kothari, D., Eds.; Lecture Notes in Electrical Engineering; Springer: Singapore, 2020; Volume 609. [Google Scholar] [CrossRef]
  41. Trivedi, N.; Gujar, N.S.; Sarkar, S.; Pundir, S.P.S. Different fast charging methods and topologies for EV charging. In Proceedings of the 2018 IEEMA Engineer Infinite Conference (eTechNxT), New Delhi, India, 13–14 March 2018; pp. 1–5. [Google Scholar] [CrossRef]
  42. The European Standard IEC 62196. Available online: https://www.dalroad.com (accessed on 8 February 2022).
  43. Raff, R.; Golub, V.; Pelin, D.; Topić, D. Overview of charging modes and connectors for the electric vehicles. In Proceedings of the 2019 7th International Youth Conference on Energy (IYCE), Bled, Slovenia, 3–6 July 2019; pp. 1–6. [Google Scholar] [CrossRef]
  44. CHAdeMO Europe Installation. Available online: https://www.chademo.com/chademo-surpasses-20k-mark-with-europe-leading-in-installation/ (accessed on 8 February 2022).
  45. Arabsalmanabadi, B.; Tashakor, N.; Javadi, A.; Al-Haddad, K. Charging Techniques in Lithium-Ion Battery Charger: Review and New Solution. In Proceedings of the IECON 2018—44th Annual Conference of the IEEE Industrial Electronics Society, Washington, DC, USA, 21–23 October 2018; pp. 5731–5738. [Google Scholar] [CrossRef]
  46. Hong, S.; Kang, M.; Jeong, H.; Baek, J. State of Health Estimation for Lithium-Ion Batteries Using Long-Term Recurrent Convolutional Network. In Proceedings of the IECON 2020 The 46th Annual Conference of the IEEE Industrial Electronics Society, Singapore, 18–21 October 2020; pp. 1929–1934. [Google Scholar] [CrossRef]
  47. Maximum Speed on the Highway in Spain. Available online: https://www.aci.it/il-club/soci-in-viaggio/per-chi-va-allestero/guidare-in-europa/spagna.html (accessed on 15 March 2022).
  48. Travel Time Taken to Reach Malaga from Madrid. Available online: https://www.google.it/maps/dir/Madrid (accessed on 2 April 2022).
  49. Google Map Charging Stations—Google Maps. Available online: https://www.google.com/maps/search/google+map+electric+charging+stations/ (accessed on 23 June 2023).
  50. Szumska, E.M.; Jurecki, R. The Effect of Aggressive Driving on Vehicle Parameters. Energies 2020, 13, 6675. [Google Scholar] [CrossRef]
  51. Varia, M.V.; Duarte, G.O.; Varella, R.A.; Farias, T.L.; Baptista, P.C. How do road grade, road type and driving aggressiveness impact vehicle fuel consumption? Assessing potential fuel savings in Lisbon, Portugal. Transp. Res. Part D Transp. Environ. 2019, 72, 148–161. [Google Scholar]
  52. Liu, K.; Yamamoto, T.; Morikawa, T. Impact of road gradient on energy consumption of electric vehicles. Transp. Res. Part D Transp. Environ. 2017, 54, 74–81. [Google Scholar] [CrossRef]
  53. Traffic Flow Data in Spain. 2019. Available online: https://mapas.fomento.gob.es/mapatrafico (accessed on 10 April 2022).
  54. Passenger Cars in Use, by Fuel Type in Spain. 2019. Available online: https://www.acea.auto/figure/passenger-car-fleet-by-fuel-type (accessed on 1 February 2022).
  55. The Technical Data of Electric Vehicles, Declared by the Respective Car Manufacturers. Available online: https://www.e-station.it/guida-alle-auto-elettriche.html (accessed on 17 April 2022).
  56. How Temperature Affects EV Range. Available online: https://www.recurrentauto.com/research/how-temperature-affects-ev-range (accessed on 27 April 2022).
  57. Di Martino, A.; Miraftabzadeh, S.M.; Longo, M. Strategies for the Modelisation of Electric Vehicle Energy Consumption: A Review. Energies 2022, 15, 8115. [Google Scholar] [CrossRef]
  58. Estimation of the Driving Range. Available online: https://ev-database.org/#sort:path~type~order=.rank~number~desc|range-slider-range:prev~next=0~1200|range-slider-acceleration:prev~next=2~23|range-slider-topspeed:prev~next=110~350|range-slider-battery:prev~next=10~200|range-slider-towweight:prev~next=0~2500|range-slider-fastcharge:prev~next=0~1500|paging:currentPage=0|paging:number=9 (accessed on 27 April 2022).
  59. Saldarini, A.; Barelli, L.; Pelosi, D.; Miraftabzadeh, S.; Longo, M.; Yaici, W. Different Demand for Charging Infrastructure along a Stretch of Highway: Italian Case Study. In Proceedings of the 2022 IEEE International Conference on Environment and Electrical Engineering and 2022 IEEE Industrial and Commercial Power Systems Europe (EEEIC/I&CPS Europe), Prague, Czech Republic, 28 June 2022–1 July 2022; pp. 1–6. [Google Scholar]
  60. Colombo, C.G.; Miraftabzadeh, S.M.; Saldarini, A.; Longo, M.; Brenna, M.; Yaici, W. Literature Review on Wireless Charging Technologies: Future Trend for Electric Vehicle? In Proceedings of the 2022 Second International Conference on Sustainable Mobility Applications, Renewables and Technology (SMART), Cassino, Italy, 23–25 November 2022; pp. 1–5. [Google Scholar]
Figure 1. Flowchart regarding the behavior of the EV.
Vehicles 05 00042 g001
Figure 2. Highway route from Madrid (A) to Malaga (B).
Vehicles 05 00042 g002
Figure 3. Overview of CSs along Madrid–Malaga.
Vehicles 05 00042 g003
Figure 4. The altitude of the highway Madrid—Malaga.
Vehicles 05 00042 g004
Figure 5. Total travel time for EVs.
Vehicles 05 00042 g005
Figure 6. N° of charges per each CS with high traffic and cold weather.
Vehicles 05 00042 g006
Figure 7. Distribution of CSs after optimization.
Vehicles 05 00042 g007
Figure 8. Total travel time for EVs after optimization.
Vehicles 05 00042 g008
Figure 9. N° of charges per each CS worst condition, after optimization (newly implemented—red, the enhanced—green, and the unchanged—black).
Vehicles 05 00042 g009
Figure 10. Overall EV trip time of four scenarios, before and after optimization.
Vehicles 05 00042 g010
Table 1. Charging methods.
ConditionCharging Mode
Selected
k m c h a r g e d
1° MethodCS = AC ˄ EV = AC ˄ DCAC k m C S n e x t ( k m E V k m m i n )
2° MethodCS = AC ˄ EV = ACAC k m 80 % S o C k m E V
CS = DC ˄ EV = DCDC
Table 2. Energy consumption of the slope in significant sections.
Section’s
Trip
Slope
[%]
Parameter [kWh/km]Distance
[km]
Consumption [kWh]
Madrid to 1−1.4−0.0736.4Vehicles 05 00042 i001−0.467
3 to 4−1.1−0.0731.5−0.109
12 to 13−1.1−0.0732.2−0.160
15 to 16−3.3−0.1215−0.605
22 to Malaga−1.7−0.07326.9−1.963
Tot:−3.3
Table 3. Most popular EVs in Spain.
ModelMatriculation
(%)
Capacity
(kWh)
Driving Range
(km)
Charging
DC (kW)
Charging
AC (kW)
Tesla:
Model 387556012011
Volkswagen:
E-Up836.8260407.4
e-Golf635.8300507.4
ID.375842010011
Renault:
Zoe1841370\44
Nissan:
Leaf1540270507.4
MINI:
Cooper SE932.62615011
KIA:
e-Niro16644557011
Hyundai:
Kona66448410011
Seat:
Mii735.8250407.4
Table 4. Number of charging points at each CS before and after the optimization.
Charging StationsNo Charging
Points—Before Optimization
No Charging
Points—After Optimization
Charging StationsNo Charging Points—Before OptimizationNo Charging Points—After Optimization
1111411
2221511
3221611
4881712
511181010
6221911
7112012
82221null2
9null32222
10122314
11442411
121125null2
13222623
Disclaimer/Publisher’s Note: The statements, opinions and data contained in all publications are solely those of the individual author(s) and contributor(s) and not of MDPI and/or the editor(s). MDPI and/or the editor(s) disclaim responsibility for any injury to people or property resulting from any ideas, methods, instructions or products referred to in the content.

