Abstract
Heavy vehicles exiting (or entering) a tunnel at high speed under a strong crosswind is a particularly critical condition since the aerodynamic load changes drastically, greatly affecting the lateral stability of the vehicle. Often, active control systems (active suspensions, active front steering, etc.) and infrastructure elements (e.g., wind fences) are proposed to reduce the induced risks. To help the design of these devices, the present paper investigates the response of the vehicle–driver system in the case of a high-sided lorry exiting a tunnel under crosswind, by using Driver-In-the-Loop simulations. The study was performed using the dynamic driving simulator of Politecnico di Milano and 28 test drivers. Vehicle and aerodynamic models have been developed to reproduce the phenomenon in a highly immersive environment. During the tests, several combinations of vehicle and wind speed were considered. The effect of vehicle loading condition (Empty and Laden) was also investigated. The performed tests allowed us to gain information about the sequence of the driver’s actions and associated delays, which may induce lane deviation or, in the worst case, rollover. It was found that lane invasion may happen for ratios of lateral aerodynamic force over vehicle weight force bigger than 0.1, while rollover could happen for ratios bigger than 0.3. Moreover, it was found that the driver’s response typically happens with a delay of ∼0.25 s with respect to the onset of the crosswind stimulus.
1. Introduction
Adverse weather conditions are one of the most common causes of road accidents. According to an ISTAT survey of 2018, it is estimated that in Italy about 10% of the total crashes can be attributed directly to this cause. Among these conditions, high-intensity crosswinds could be listed as one of the most common causes that lead to lane invasion (with the potential of incurring a multi-vehicle accident) and, in the worst cases, to vehicle rollover. This is the reason why a lot of research effort has been made in recent years to investigate this phenomenon by authors like Coleman and Baker [1], Baker et al. [2], Cai and Chen [3] and many others [4,5,6,7,8,9,10,11,12,13,14,15,16,17,18,19,20,21,22] considering also different vehicles typologies.
Studies have been performed in the case where the vehicle is partially exposed to crosswind, too. This situation arises in particular due to infrastructure elements that may shield the vehicle in some sections of the road. For example, in the case of tunnels [21], bridge towers [5,6,7,8,13,16] or for peculiar topographies of the landscape where the vehicle is moving. The aim of these studies is to investigate this phenomenon to gain a deeper understanding and to propose measures that can counteract the potentially dangerous effects of crosswinds in terms of road safety. This involves designing passive (i.e., wind barriers) or active systems (at both infrastructure and vehicle levels) to mitigate crosswind-related dangers. For example, Semeraro et al. [21] investigated the effect of different windbreak fences design on the vehicle response at a tunnel exit in presence of crosswind. They coupled CFD-computed aerodynamic loads to a vehicle and a preview-length driver model. CFD methods were also used by Salati et al. [16] to investigate the aerodynamic loads acting on a truck passing behind a bridge tower pylon. Authors like Rocchi et al. [7] and Sabbioni et al. [8] focused on the vehicle–driver response when the vehicle is passing behind a bridge tower pylon. The driver model is based on the concept of preview lengths. To evaluate the aerodynamic loads, the authors used a quasi-static approach based on wind tunnel-measured aerodynamic coefficients.
What all these studies had in common is the consciousness that the way in which the vehicle reacts to crosswinds is strongly influenced by the human element (the driver). Indeed, it is more correct of talking of vehicle–driver system interaction with a crosswind. This is why many studies tried to model the human driver (of course in different ways) to keep the driver in the simulation loop [8,21,22].
However, modeling the driver response to crosswind is a rather complicated task. It should be necessary to characterize the driver’s response (in the context of crosswind) by means of experimental tests. Nonetheless, it has to be pointed out that tests performed on a real road with a real vehicle are not possible for safety reasons (for the human driver). Moreover, it would be impossible for the researchers to control the crosswind level (and the external environmental conditions in general). Practically, guaranteeing the repeatability of the experiment would be impossible.
A solution to these problems is given by driving simulators. Using them, it is possible to conduct perfectly repeatable experiments, without exposing the driver to risky conditions. Moreover, the experiment variables (like turbulence, wind speed, etc…) could be controlled and changed in a fraction of a second.
Chen et al. [23], for example, successfully used a Driver-In-the-Loop approach using the driving dynamic simulator located at the Joint International Research Laboratory of Transportation Safety at Tongji University. They focused on the safety of trucks under crosswind at bridge-tunnel sections.
In this work, an attempt has been made to understand and characterize the heavy vehicle–driver system response to crosswind excitation while exiting a wind tunnel. The objective of this research is to assess what are: the sequence of actions performed by the driver in a tunnel exit condition with a crosswind, the characteristic delays and magnitudes of the vehicle–driver response and to understand what is the main risk, between a rollover and lane invasion, faced by the drivers in the tested conditions. Moreover, the methodology used to perform the study could be easily adapted to investigate other similar scenarios involving the interaction between crosswind, vehicle–driver system, and infrastructure elements. The DriSMi dynamic driving simulator of Politecnico di Milano has been used as a tool to perform this experimental study and to obtain data regarding the human-driver reaction, thus keeping the Driver-In-the-Loop. The outcome of this work is expected to lay a foundation for the assessment of infrastructure effects on the heavy vehicle–driver system response and to suggest possible solutions that may mitigate the effects of the crosswind–infrastructure interaction on the heavy vehicle–driver response. To this end, the methodology and the results presented in this work could help develop both passive (i.e., windbreak fences or variable speed limits based on the environmental crosswind conditions) and active systems capable of increasing road users’ safety in this challenging condition.
Researchers like Chen et al. [23] and Prakash et al. [24,25] already introduced the use of driving simulators to study the driver’s response to crosswind in presence of infrastructure elements. However, the present paper deepens the analyses presented in these studies. Specifically, with respect to Chen et al. [23], a broader set of conditions was investigated, including a larger number of wind velocities, vehicle velocities and vehicle configurations (Empty and Laden, keeping into account the shift of the center of gravity, too). Moreover, the results of the tests were analyzed with the objective of building a human-like driver model able to mimic the human driver’s response to crosswind at tunnel exit when driving a heavy vehicle. In this regard, the analyses already performed by the authors in Prakash et al. [24,25] were deepened to relate the sequence of driver’s actions at the tunnel exit and associated delays with the risk of an accident. For this purpose, a metric for evaluating rollover against lane invasion risk is introduced and delays associated with the driver’s response were quantified and compared with literature data to assess the consistency of the obtained results.
The article is organized as follows. The methodology of the study and the characteristics of the driving dynamic simulator used for the tests have been described, respectively, in Section 2 and Section 2.1, followed by Section 2.2 that is dedicated to the numerical modeling of the problem. The vehicle dynamics model, aerodynamic model and wind model are presented, respectively, in Section 2.2.1, Section 2.2.2 and Section 2.3, while the scenario prepared for the simulation is discussed in Section 2.3.1. Section 3 will present the results obtained from the data analysis. The general heavy vehicle–driver response will be presented and analyzed in this section. Finally, the major conclusions will be reported in Section 4.
2. Materials and Methods
For this work, a vehicle, aerodynamic and wind model have been coupled to reproduce the vehicle–driver system response when subject to crosswind at tunnel exit conditions. A high-sided lorry has been modeled for this purpose, together with an ad hoc numerical model of the wind. The test scenario runs in real-time on the VI-Grade GmbH (Darmstadt, DE) DiM400 dynamic driving simulator available at the DriSMi laboratory of Politecnico di Milano. The simulator used and its main characteristics will be reported in Section 2.1. The simulator has been used to perform an experimental campaign with 28 different drivers. The aim was to gather experimental data in order to gain a deeper understanding of the general vehicle–driver system response in case of crosswind at tunnel exit when driving a high-sided lorry.
2.1. Dynamic Driving Simulator
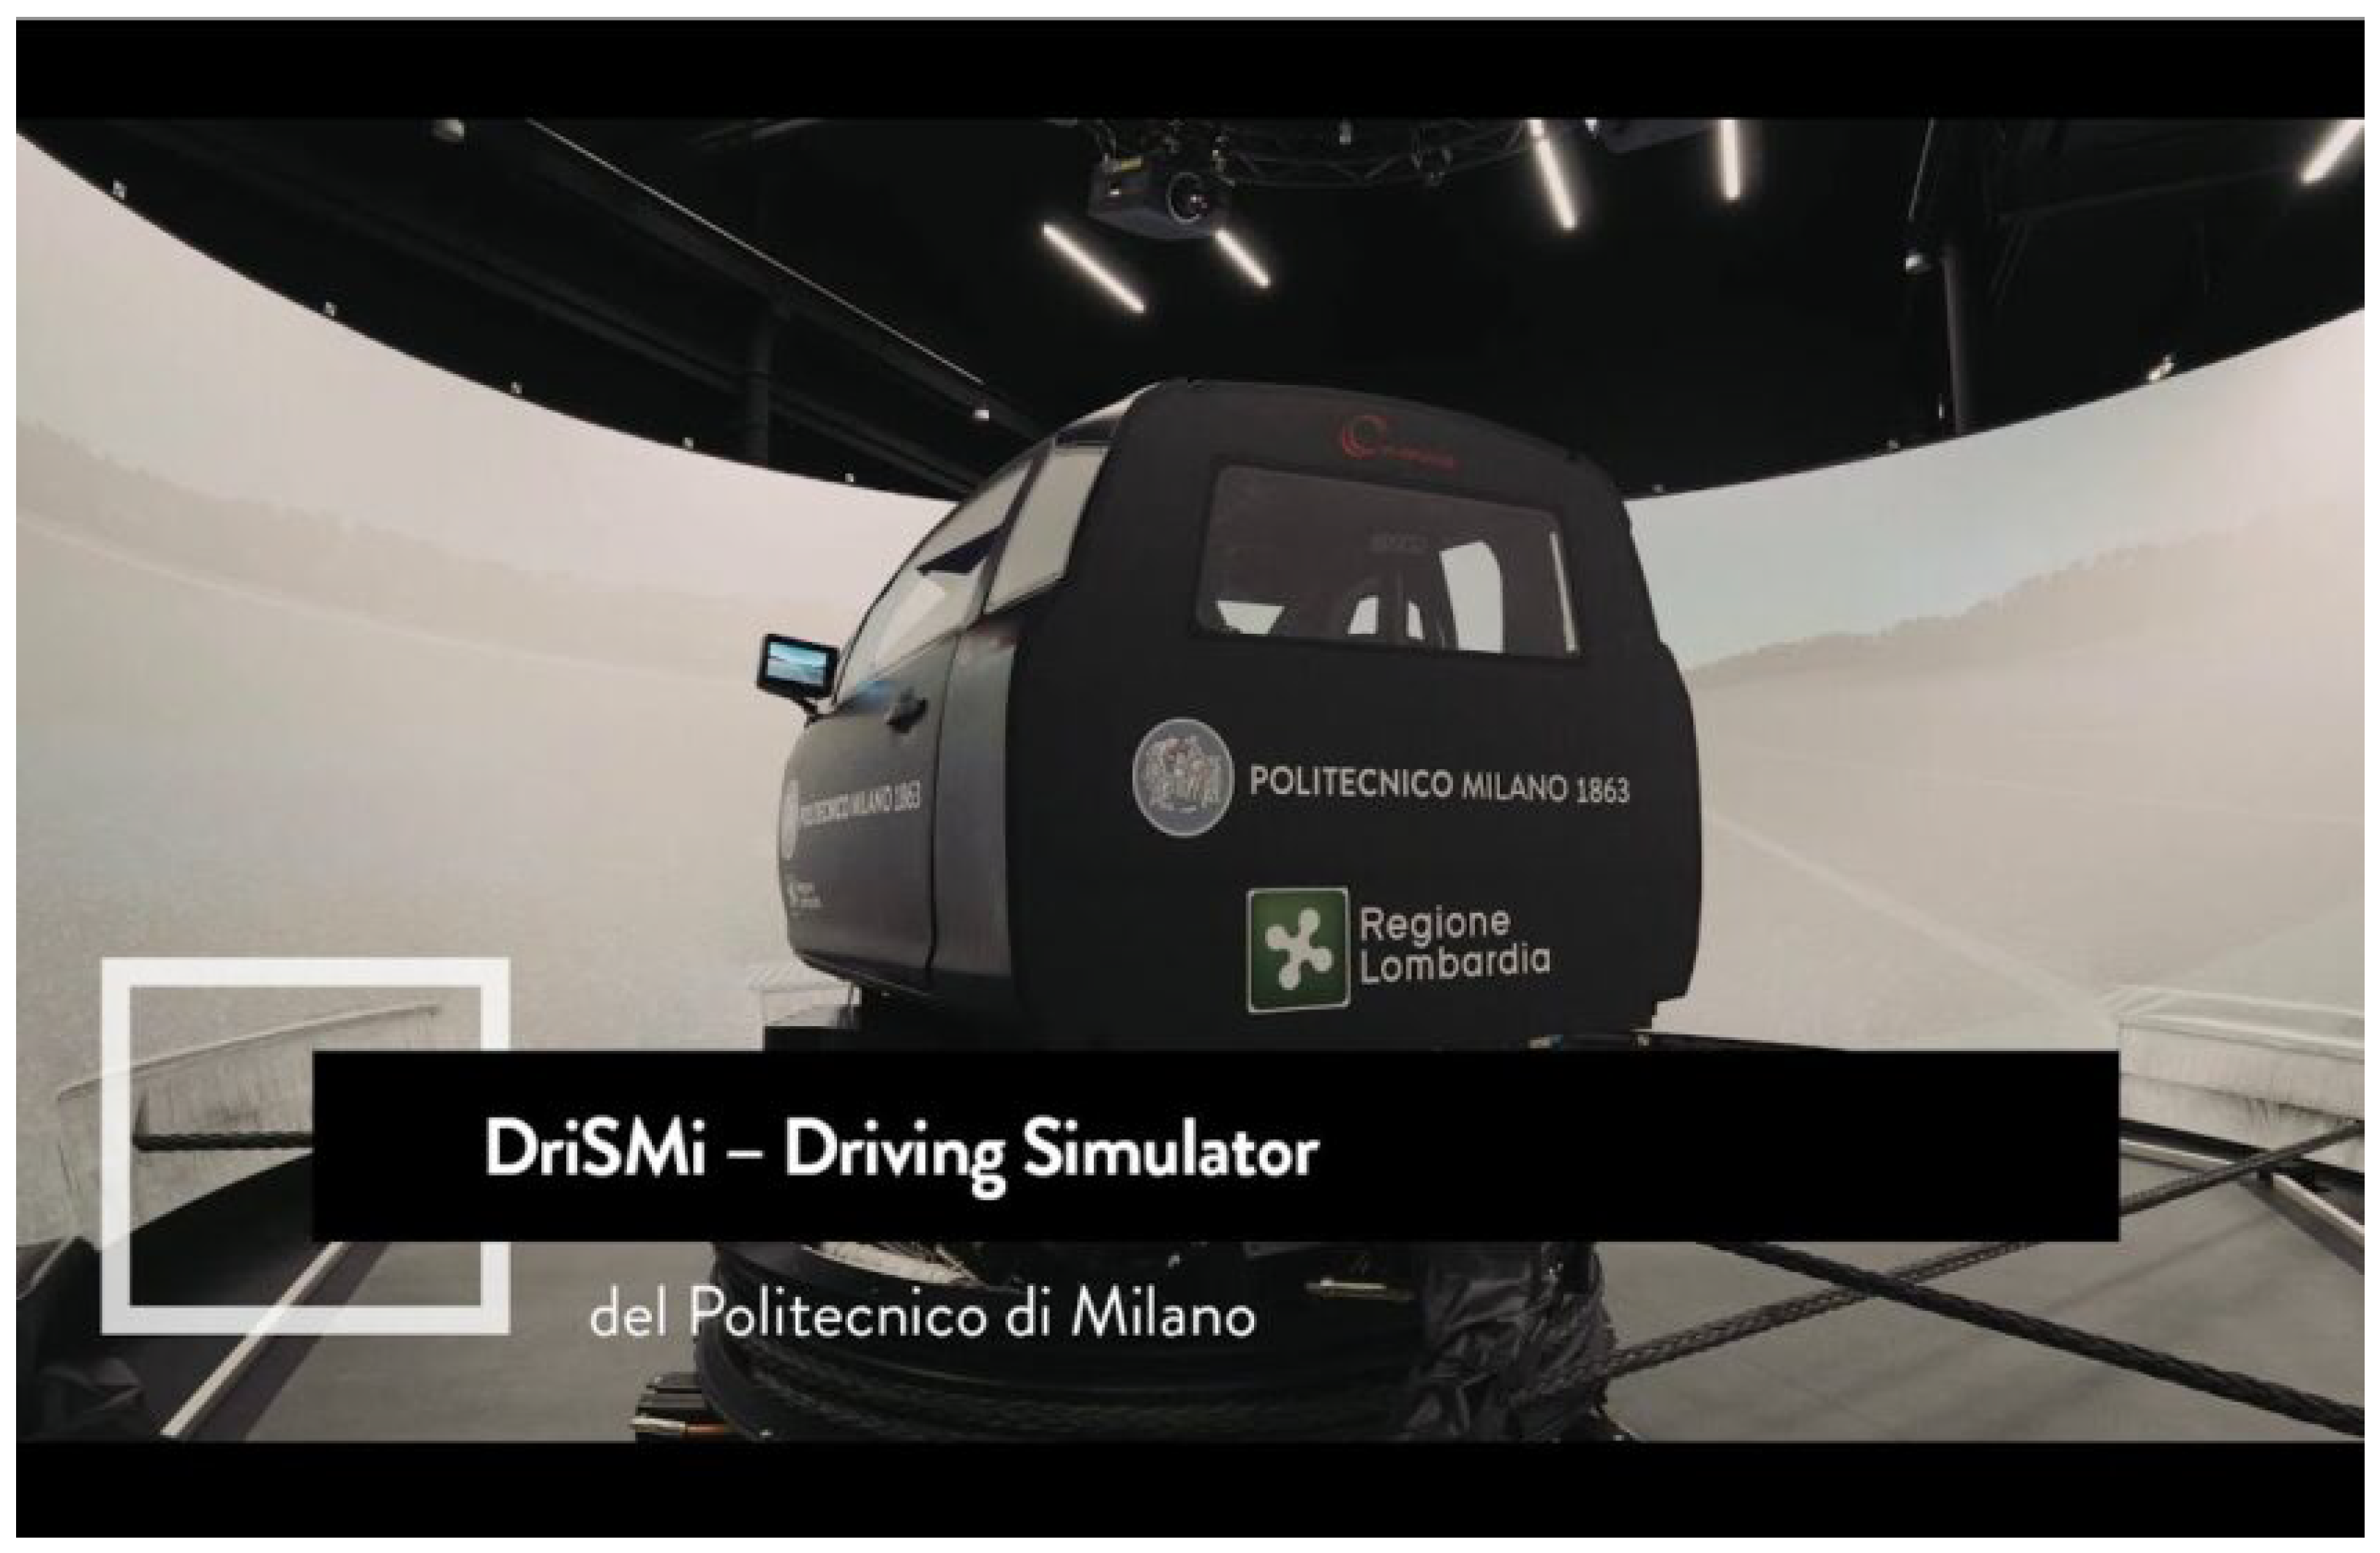
The experimental campaign has been carried out using the state-of-the-art VI-Grade GmbH (Darmstadt, DE) DiM400 dynamic driving simulator. The simulator is installed at the DriSMi laboratory of Politecnico di Milano. A picture of the simulator is reported in Figure 1.
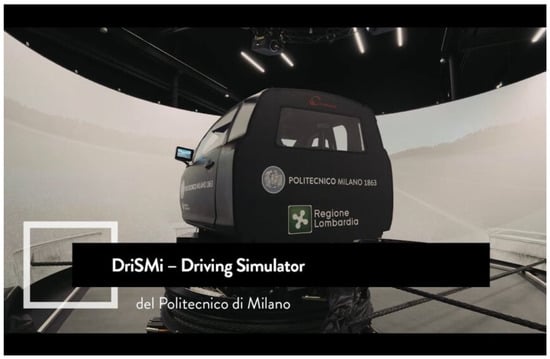
Figure 1.
Dynamic driving simulator installed at DriSMi Lab.—Politecnico di Milano.
The main characteristics of the simulator are that:
- It is a cable-driven simulator. The degrees of freedom of longitudinal displacement, lateral displacement and yaw rotation are controlled by the 4 cables. The cables are devoted to reproducing low-frequency accelerations and motion with a bandwidth of up to 3 Hz;
- The available workspace is 4 m × 4 m;
- On top of the disk frame (controlled by the 4 cables), there is a hexalift system controlling the rotations and translations around the longitudinal, lateral, and vertical directions of the cockpit (bandwidth up to 30 Hz);
- Eight shakers are mounted on the cockpit (bandwidth up to 200 Hz) to accurately reproduce vibrations.
- To improve vibrations control, the simulator features a patented inertial compensation system (ICS) with moving masses;
- The latency of the simulator is around 20 ms. Thanks to this low value, it is possible to provide the users with an enhanced level of immersion and realism.
Due to the dimension of its workspace, the DiM400 is one of the biggest driving simulators featuring a wrap-around 270 degrees conical fixed screen (a total of 5 Widescreen Ultra Extended Graphics Array projectors with 4K resolution are used).
The maximum accelerations reachable by the simulator are ±1.5 g for in-plane acceleration and ±2.5 g for vertical acceleration. Regarding the rotation angles, roll and pitch are limited to ±15, while the yaw is limited to ±62. This allows the simulator to perform 1:1 lane change simulations (no motion cueing algorithms need to be used).
An instrumented steering wheel and many biometric sensors (eye-tracker, EEG, ECG, Skin Potential Response, etc…) are available at the laboratory. They can be used to perform a wide variety of studies related to the human driver.
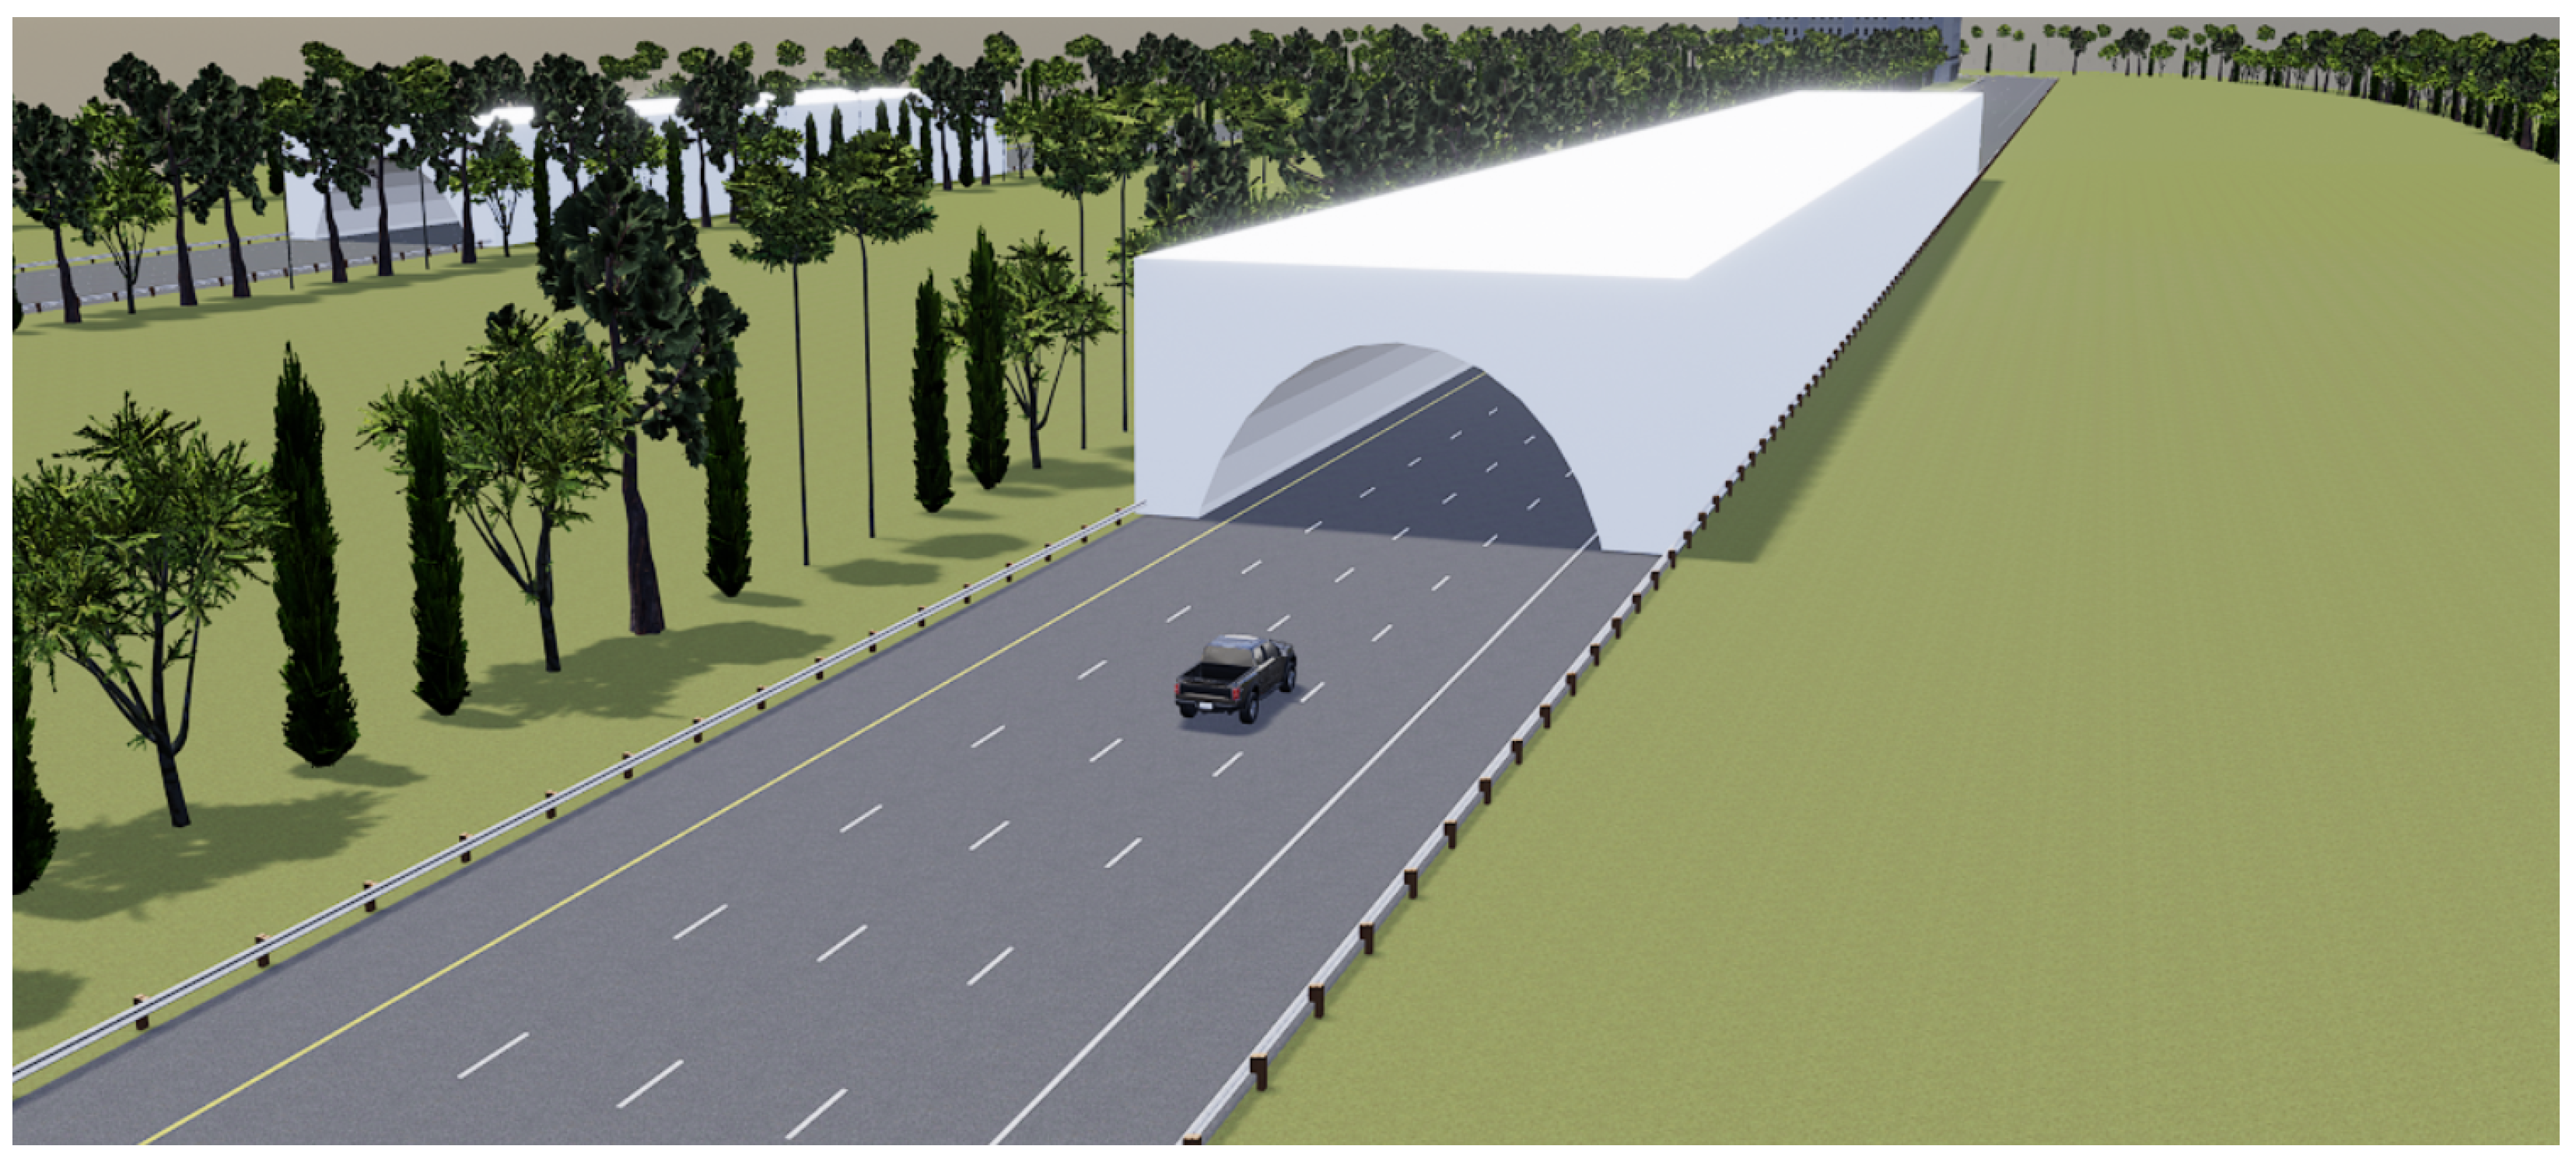
To reproduce the vehicle dynamics of the high-sided lorry on the simulator, the software VI-CarRealTime is used. To model the wind, an additional Simulink model has been created. For what regards the virtual graphics environment, VI-WorldSim has been used. The scenario designed for the tests is reported in Figure 2. It has been created using Blender and Roadrunner.
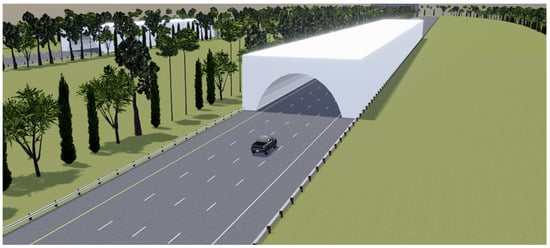
Figure 2.
Aerial view of the virtual scenario used for the simulator tests.
2.2. Numerical Model
In this section, the development of the vehicle model and aerodynamic model is considered. A brief description of the creation of the scenario is also reported.
2.2.1. Vehicle Dynamics Model
The vehicle model used for the study has been developed through the multibody code VI-CarRealTime from VI-Grade GmbH (Darmstadt, DE).
The multibody model has 14 degrees of freedom and is representative of a 2 axles high-sided lorry like the one used in Cheli et al. [11,12]. According to the UNECE standard, the lorry considered in the study is a category N3 truck (maximum mass exceeding 12 tonnes). The necessary aerodynamic coefficients have been obtained through wind tunnel tests (please refer to Section 2.2.2). The tire–road contact forces have been modeled using Pacejka’s MF-Tyre [26] model including combined slip effects. The main geometrical and inertial properties of the high-sided lorry are reported in Table 1.

Table 1.
High-sided lorry geometrical and inertial data.
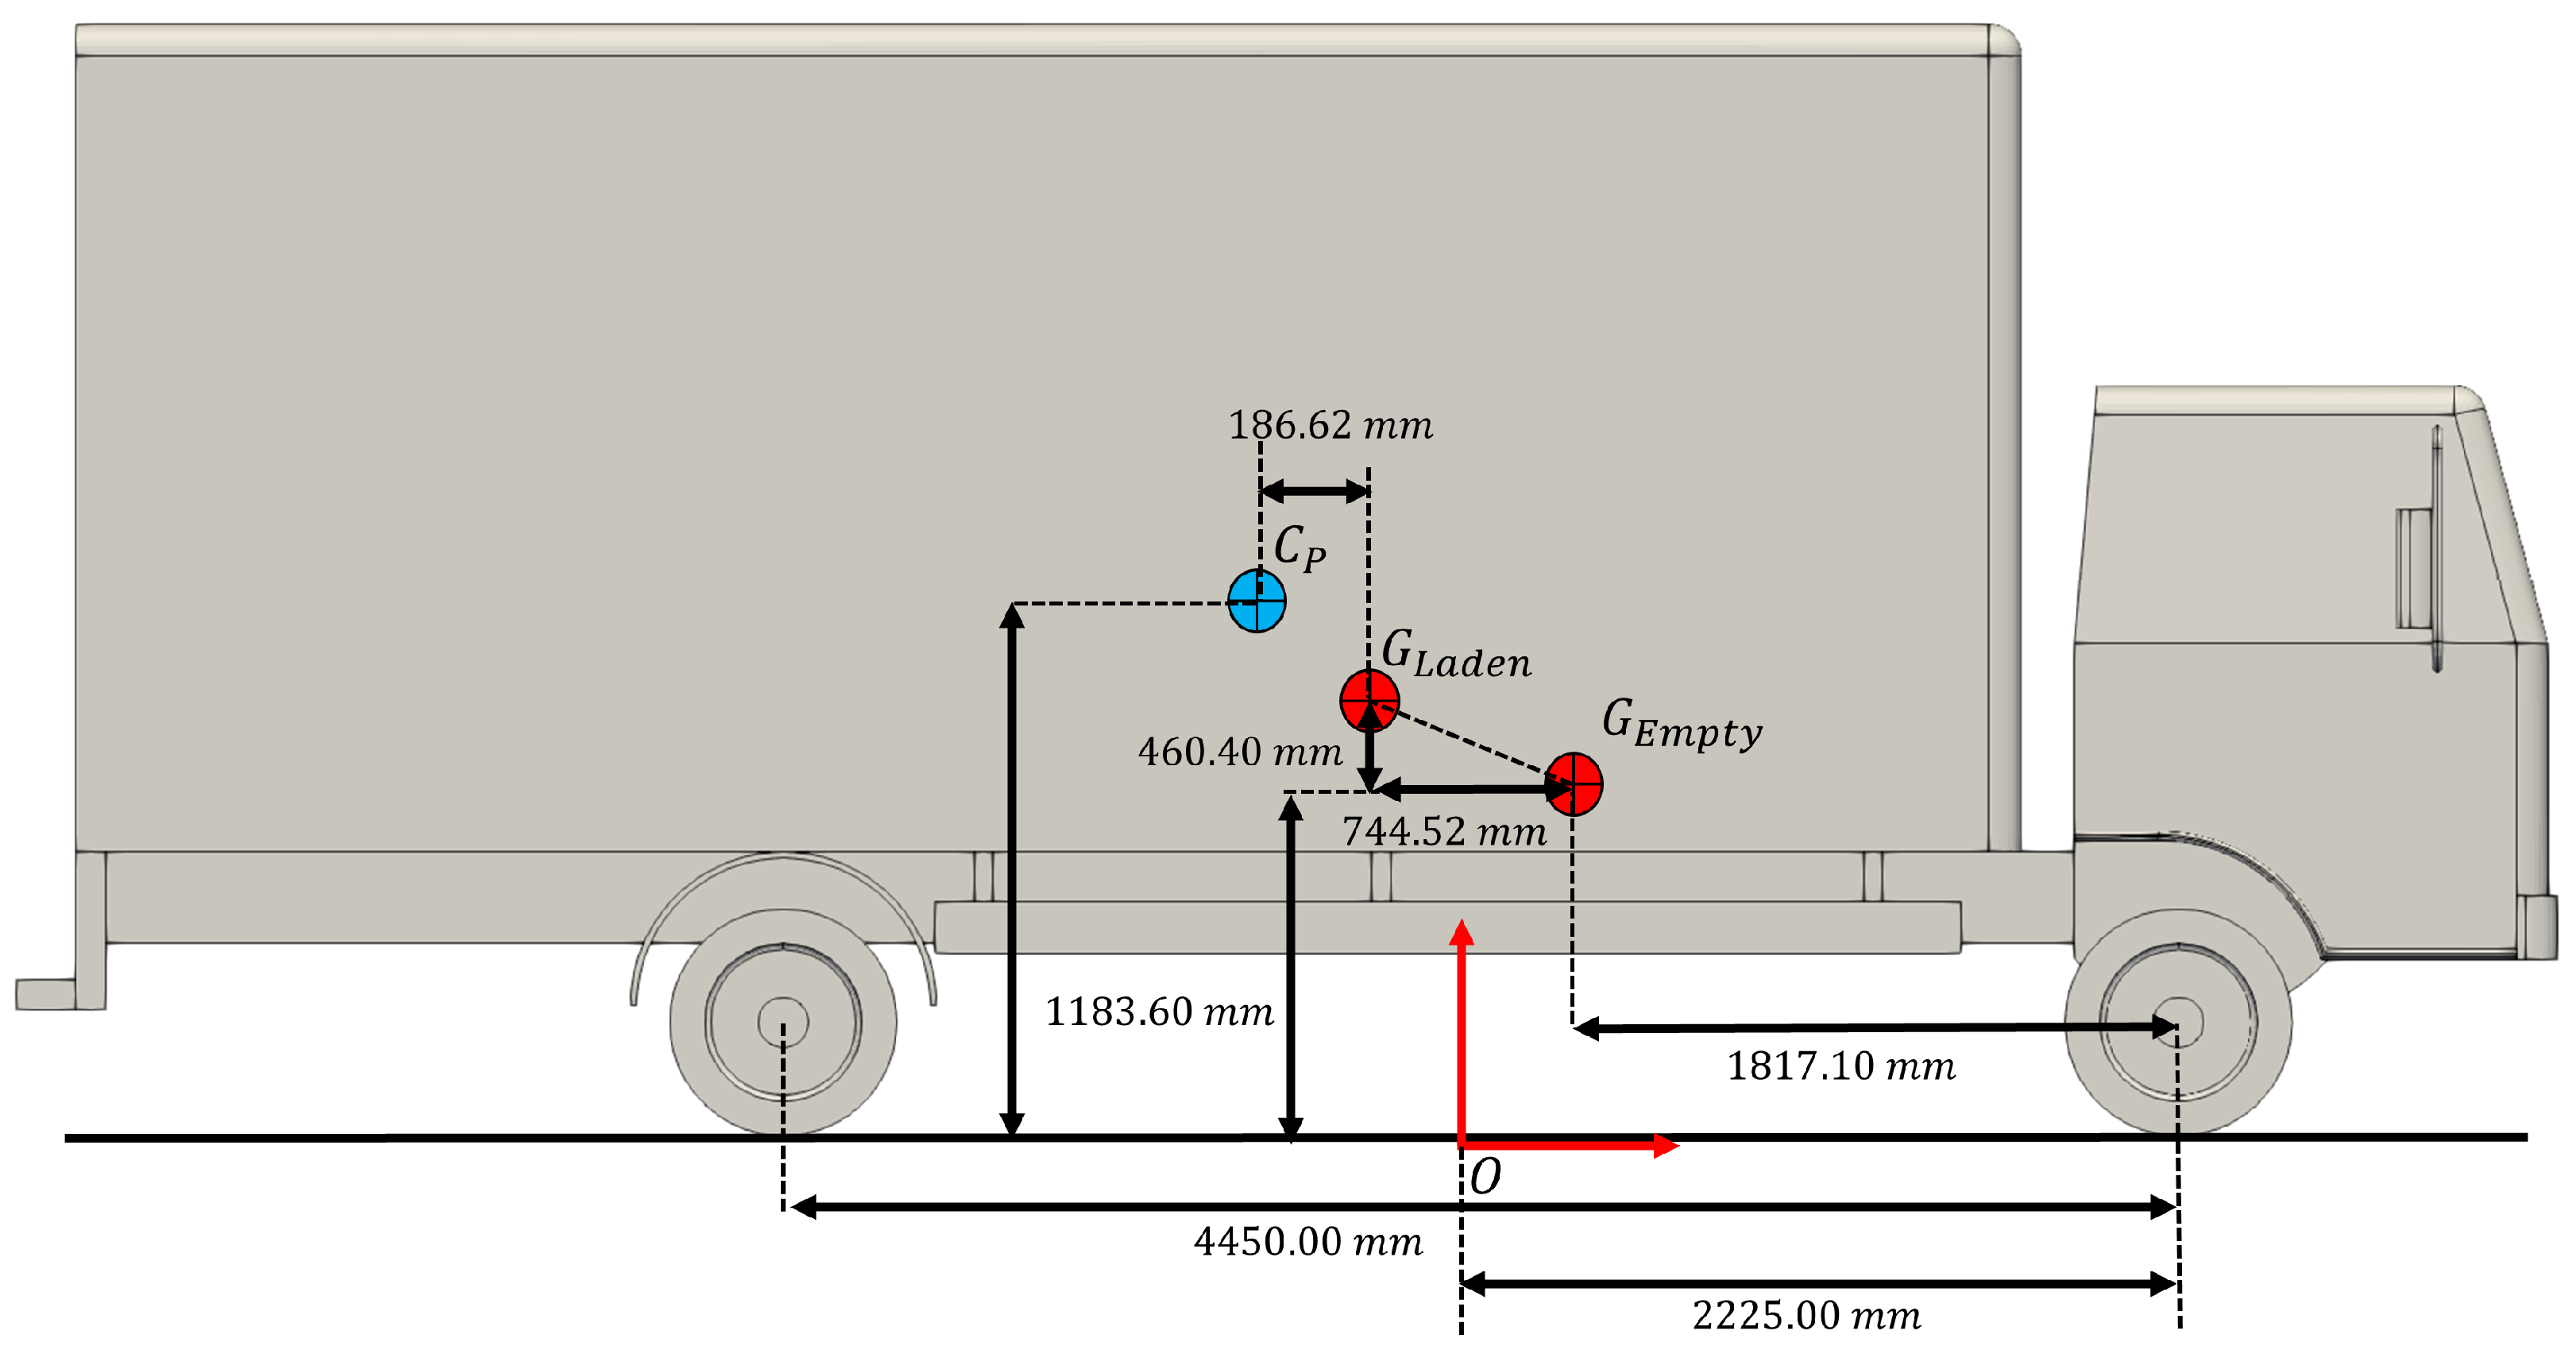
In Figure 3 is reported the positions of the vehicle center of gravity to highlight the differences between the Empty and Laden vehicle configurations. When loading the truck, the Laden center of gravity tends to move behind the Empty center of gravity and at a greater height from the ground. In Figure 3, it is also reported the position of the center of pressure for the case of a fully exposed vehicle moving at 65 km/h with 25 m/s of crosswind.
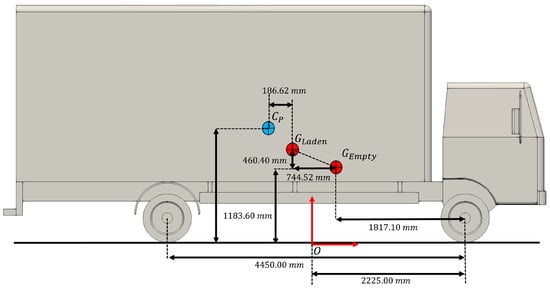
Figure 3.
Different positions of the center of gravity G and position of the center of pressure for the Empty and Laden configuration in fully exposed area condition.
Tests were performed to evaluate the vehicle performance (lateral dynamics only). It assessed the maximum lateral acceleration and rollover induced by cornering (ramp steer-gradient of 0.5 deg/s at the wheel with the vehicle traveling at 65 km/h and 80 km/h). The results obtained are reported in Table 2. For the Empty vehicle case, there are no values of critical lateral acceleration and roll angle because the lorry reaches a condition where the rear right wheel (inside-rear tire) completely loses contact from the ground, but without resulting in a complete rollover.

Table 2.
Summary of vehicle critical limits—high-sided lorry.
2.2.2. Aerodynamic Model
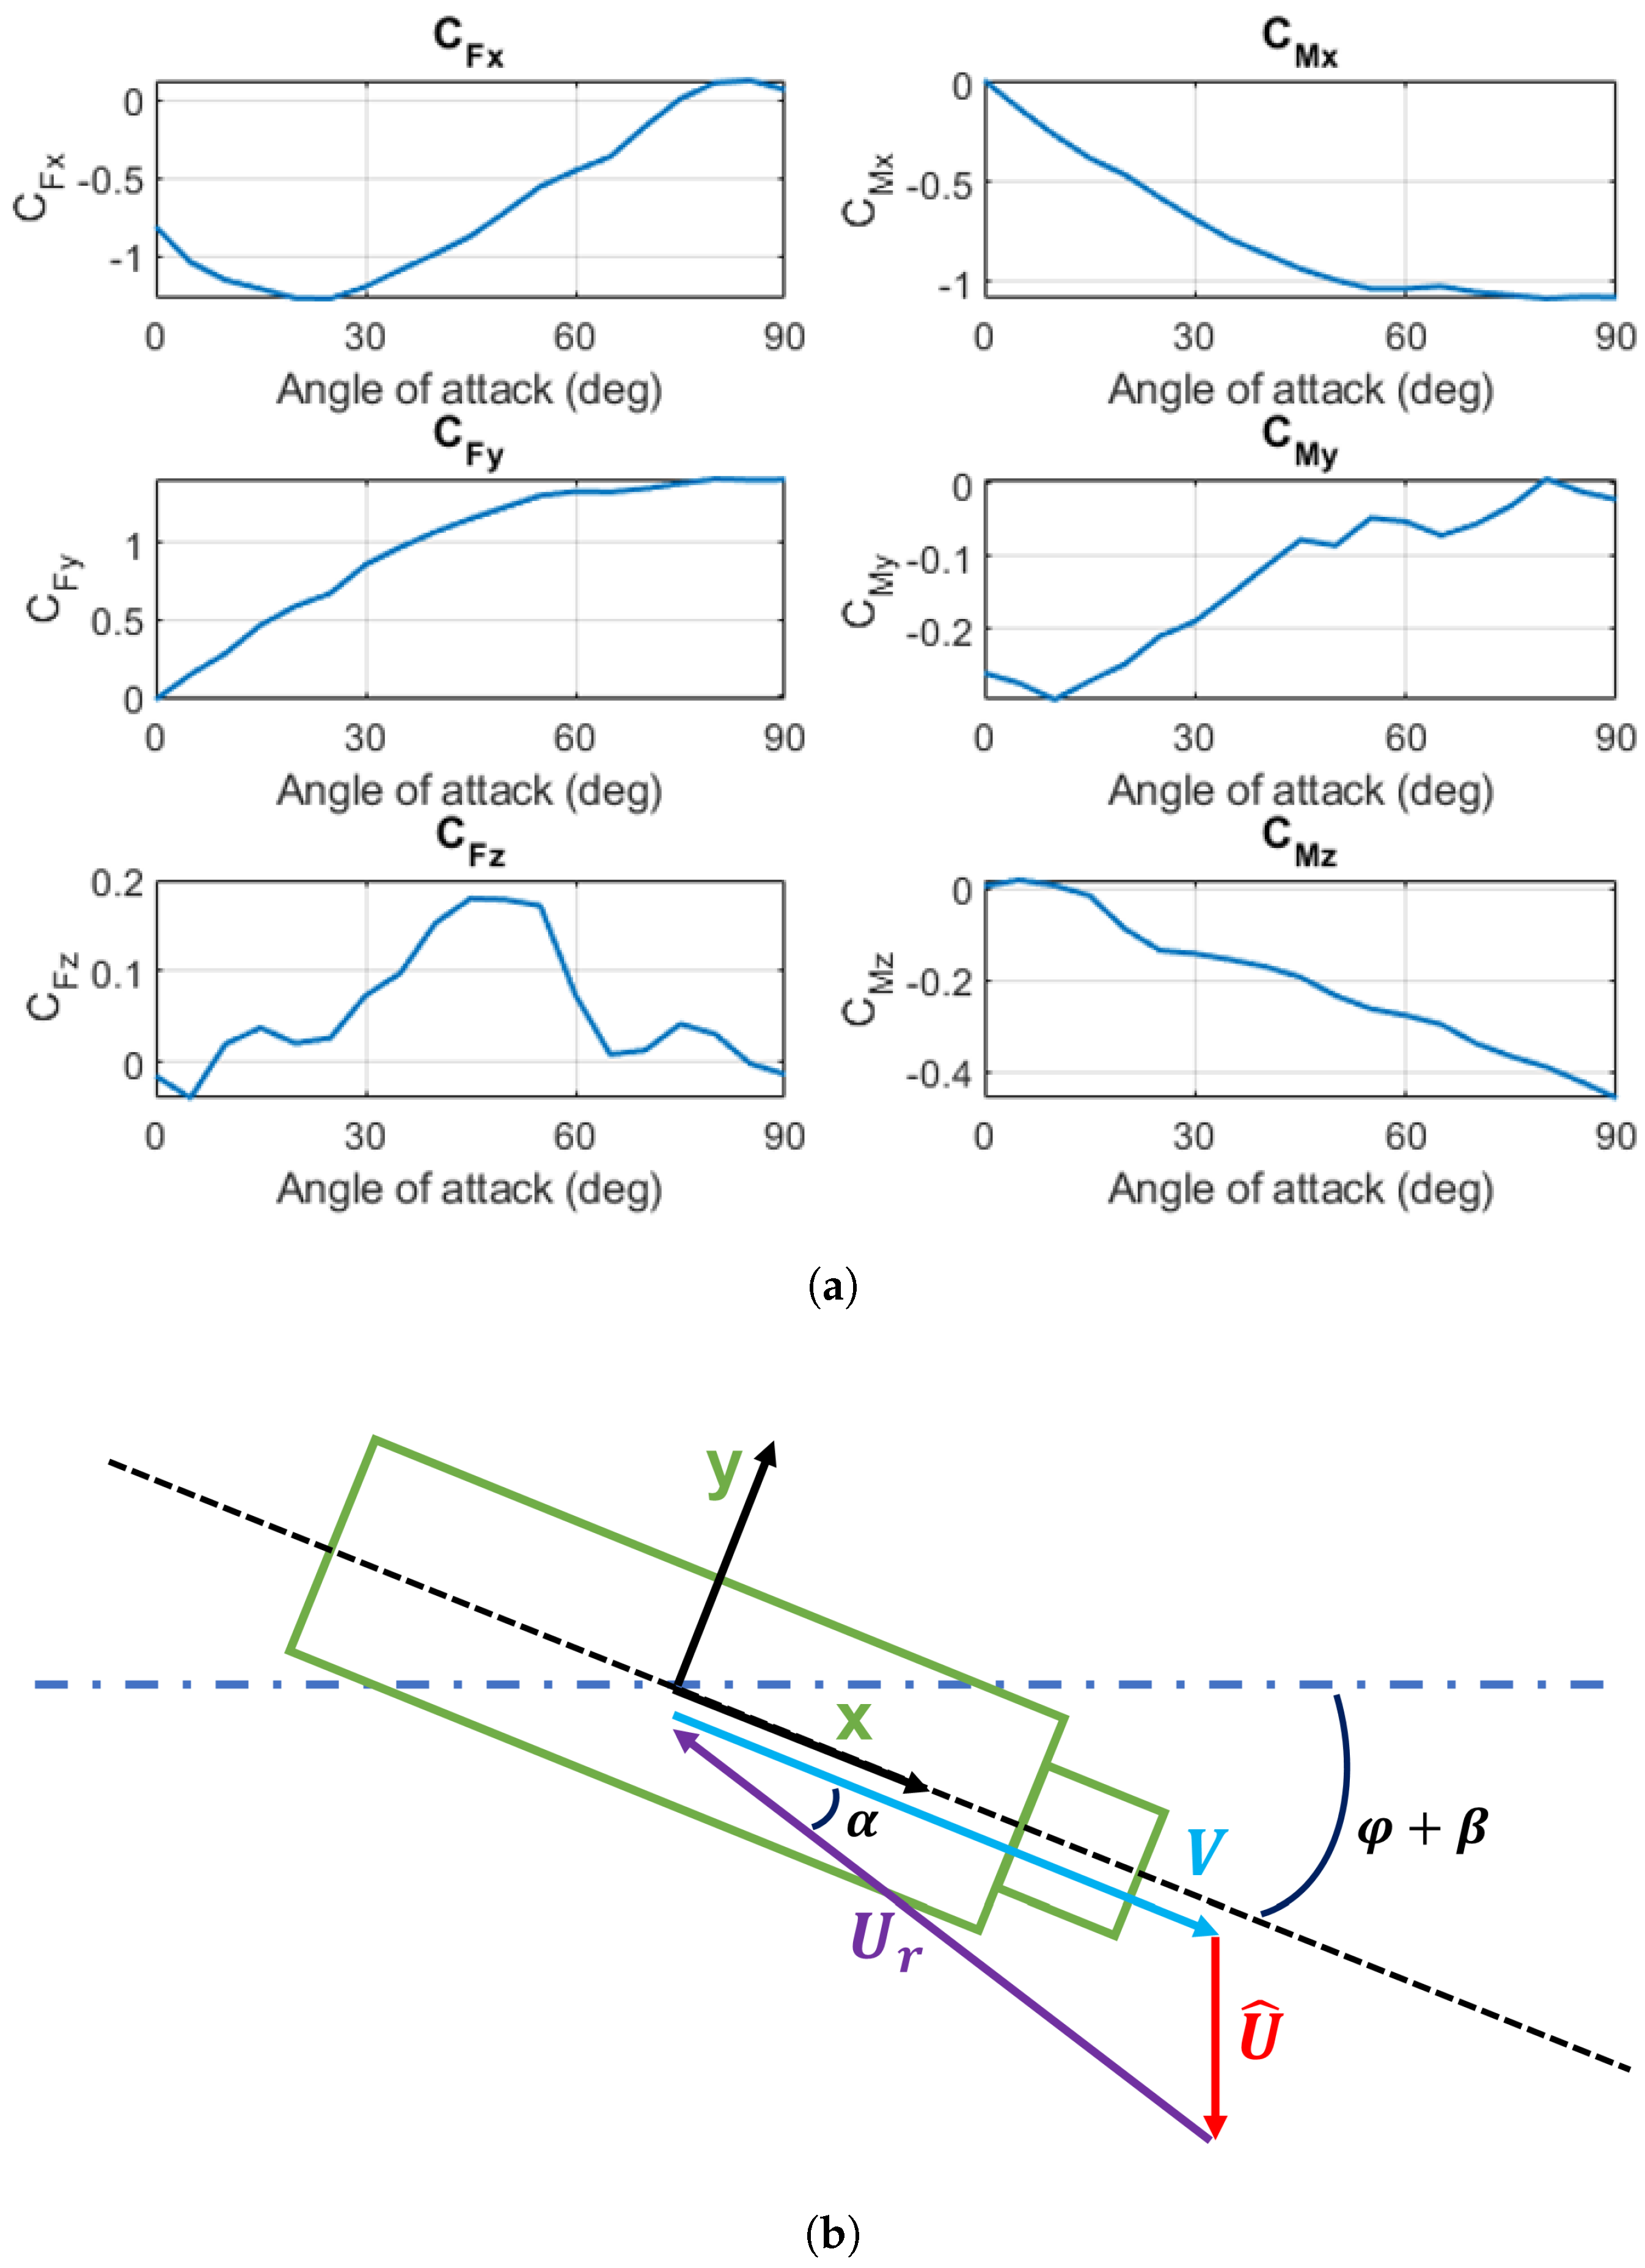
To reproduce the crosswind excitation on the vehicle, a Simulink® model was developed. The high-sided lorry aerodynamic coefficients and the geometry of the truck (used to evaluate the dimensionless aerodynamic coefficients) have been obtained through wind tunnel measurements on a scaled model [7,11,12]. The coefficients have been reported in Figure 4a together with the sign convention adopted in Figure 4b. The reference system indicated in Figure 4b follows the right-hand rule.
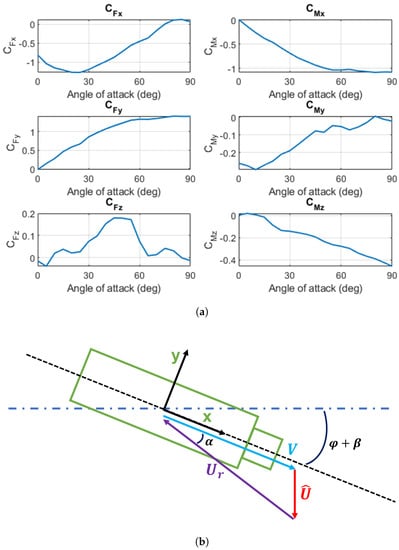
Figure 4.
Aerodynamic coefficients and sign convention—high-sided lorry. (a) Aerodynamic Coefficients. (b) Sign Convention.
The classic quasi-static approach has been used in the formulation of the aerodynamic forces and moments as can be seen from Equation (1).
In Equation (1), stands for the air density and for the relative wind speed. The necessary aerodynamic geometrical data (width W, length L, height H, frontal area , lateral area and reference height h) have been reported in Table 3. The reference height h useful for the evaluation of the moments refers to the height of the cargo bed of the truck.

Table 3.
High-sided lorry aerodynamic data.
For the moving vehicle, the relative wind speed and angle of attack are computed through Equations (2) and (3) (yaw and side-slip of the vehicle are of course taken in consideration). , V and represent the magnitude of the relative wind speed, vehicle speed and cross-wind speed, respectively. On the other hand, stands for the angle of attack of the vehicle. Once these values are computed, the aerodynamic forces and moments can be applied on the center of gravity of the vehicle using appropriate forces and moment transformations (the reference system used to evaluate the coefficients is placed on the ground, but the forces have to be applied in the vehicle’s center of gravity).
2.3. Wind Model
Both a uniform and a turbulent wind model with a turbulence intensity of have been chosen to perform the tests. This particular value of turbulence intensity was chosen to ensure a maximum variability of ±5 km/h with respect to the mean wind speed.
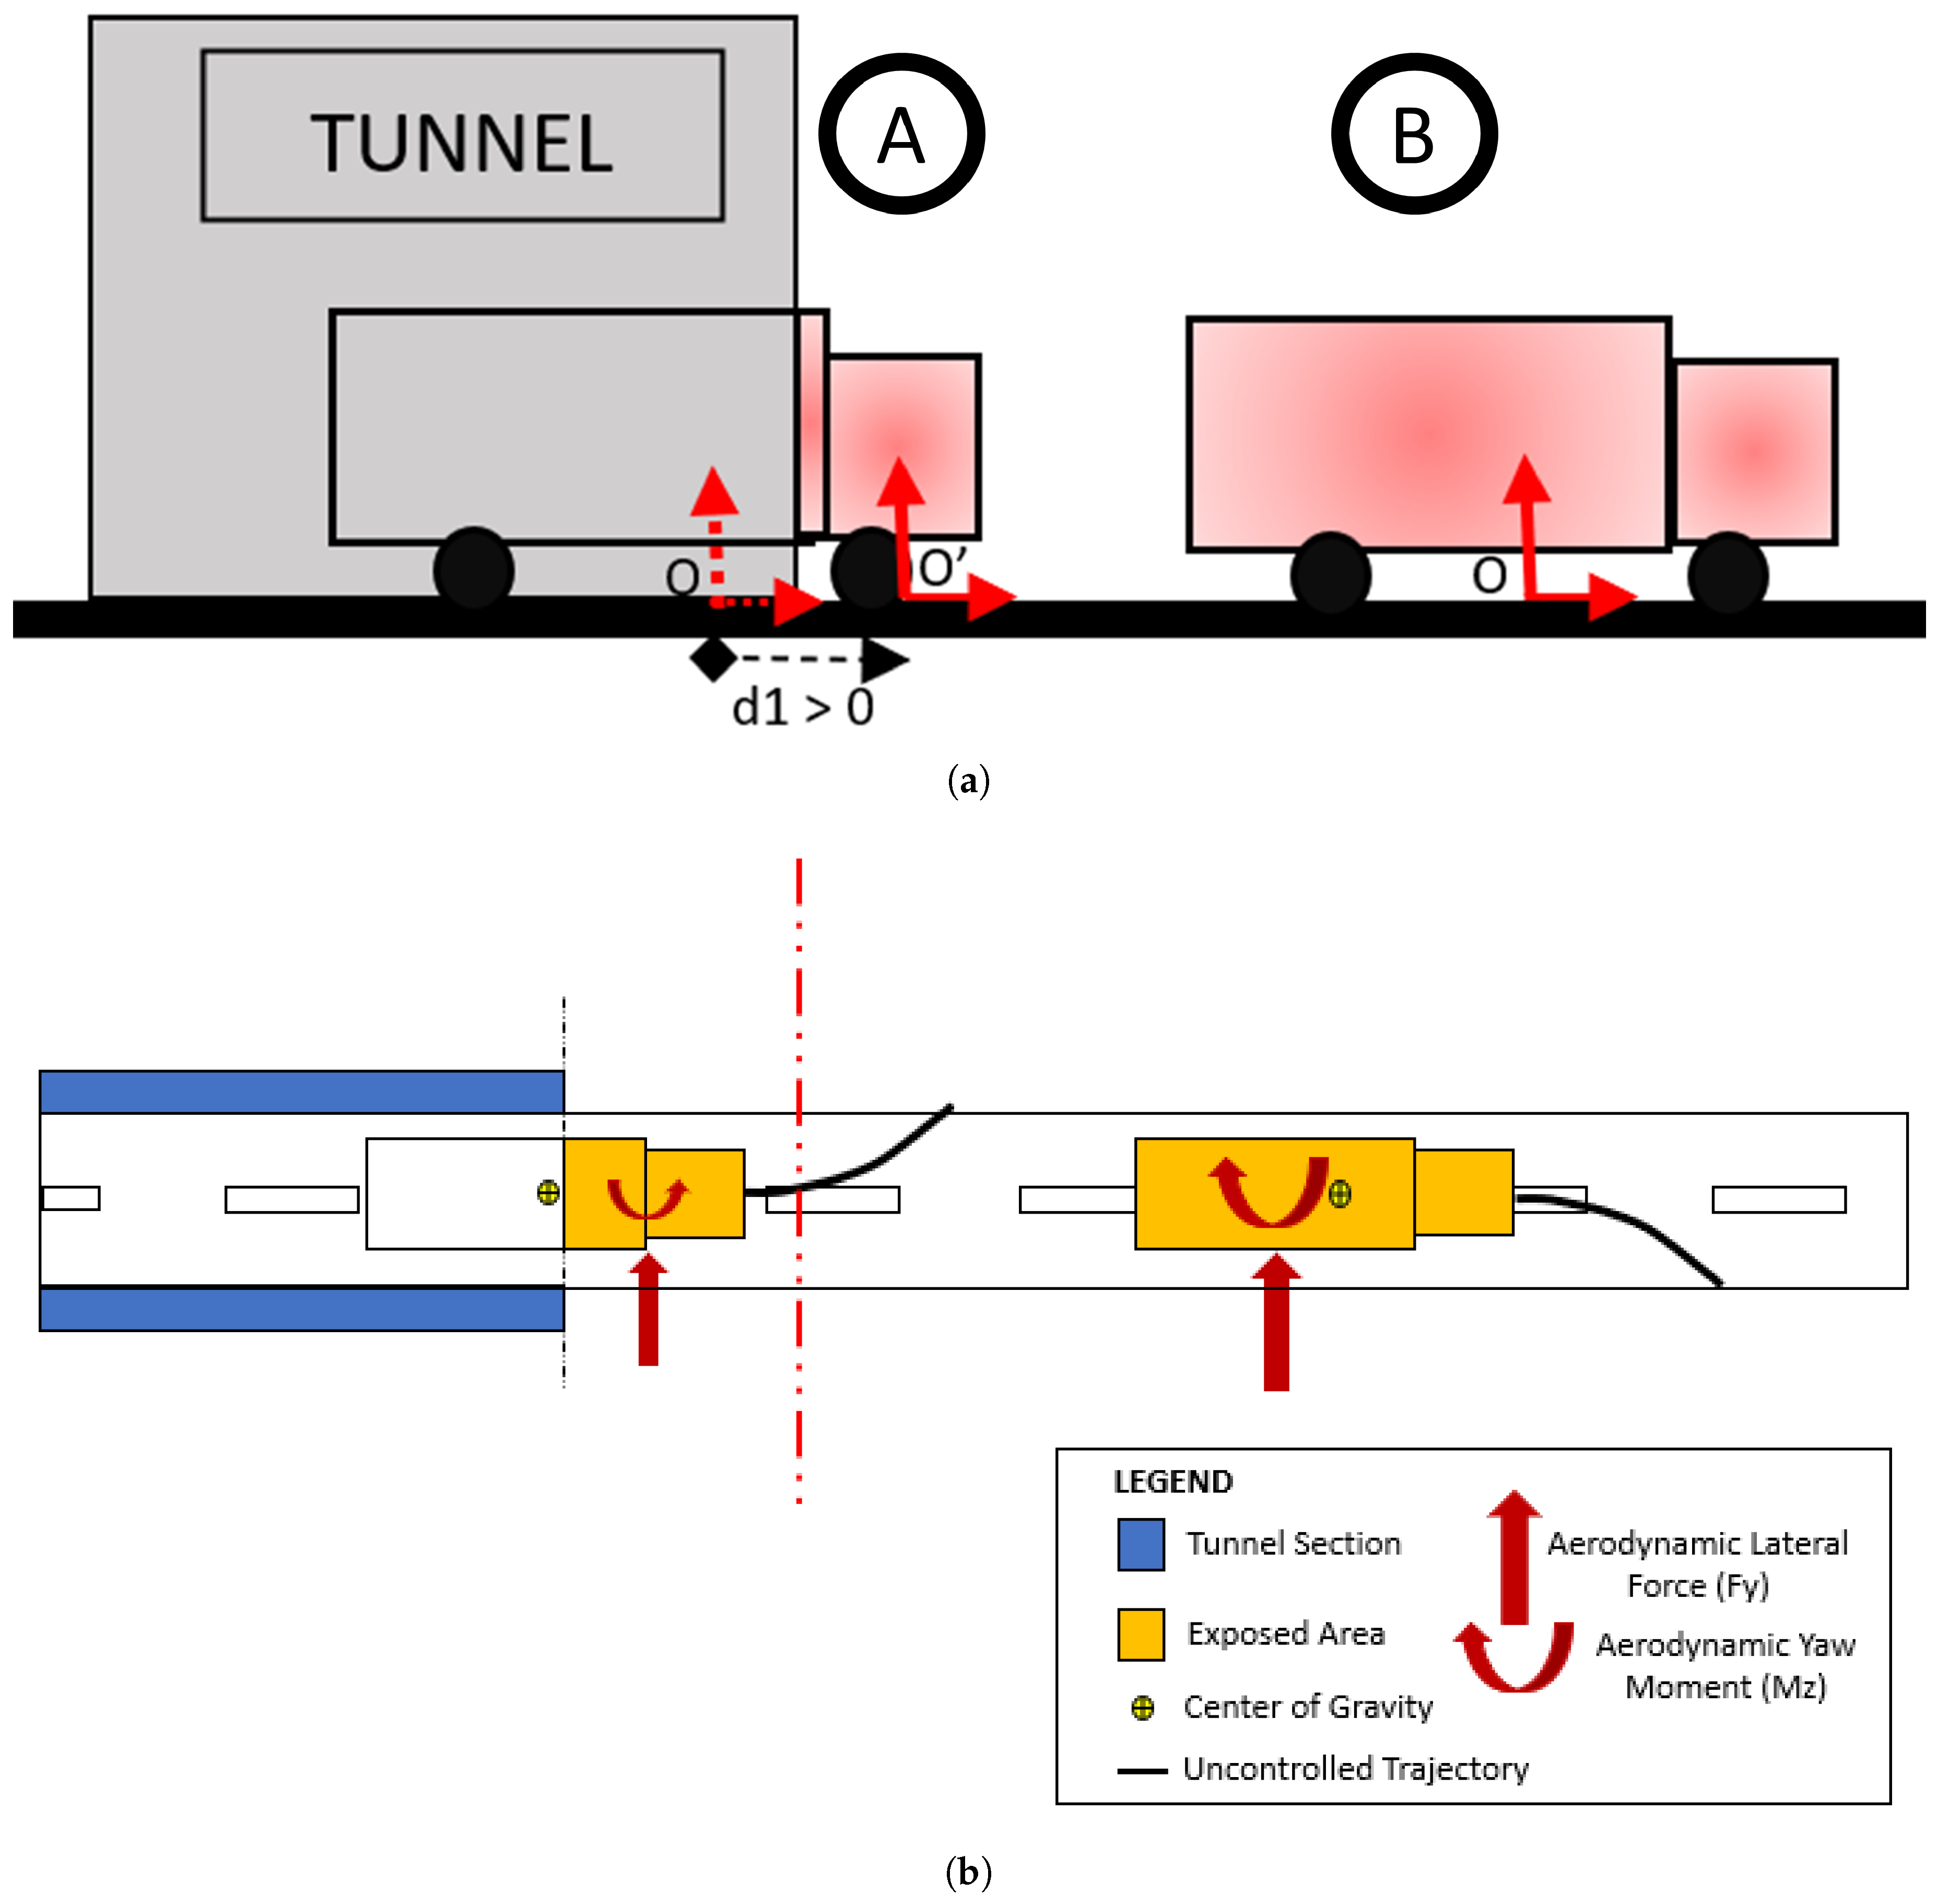
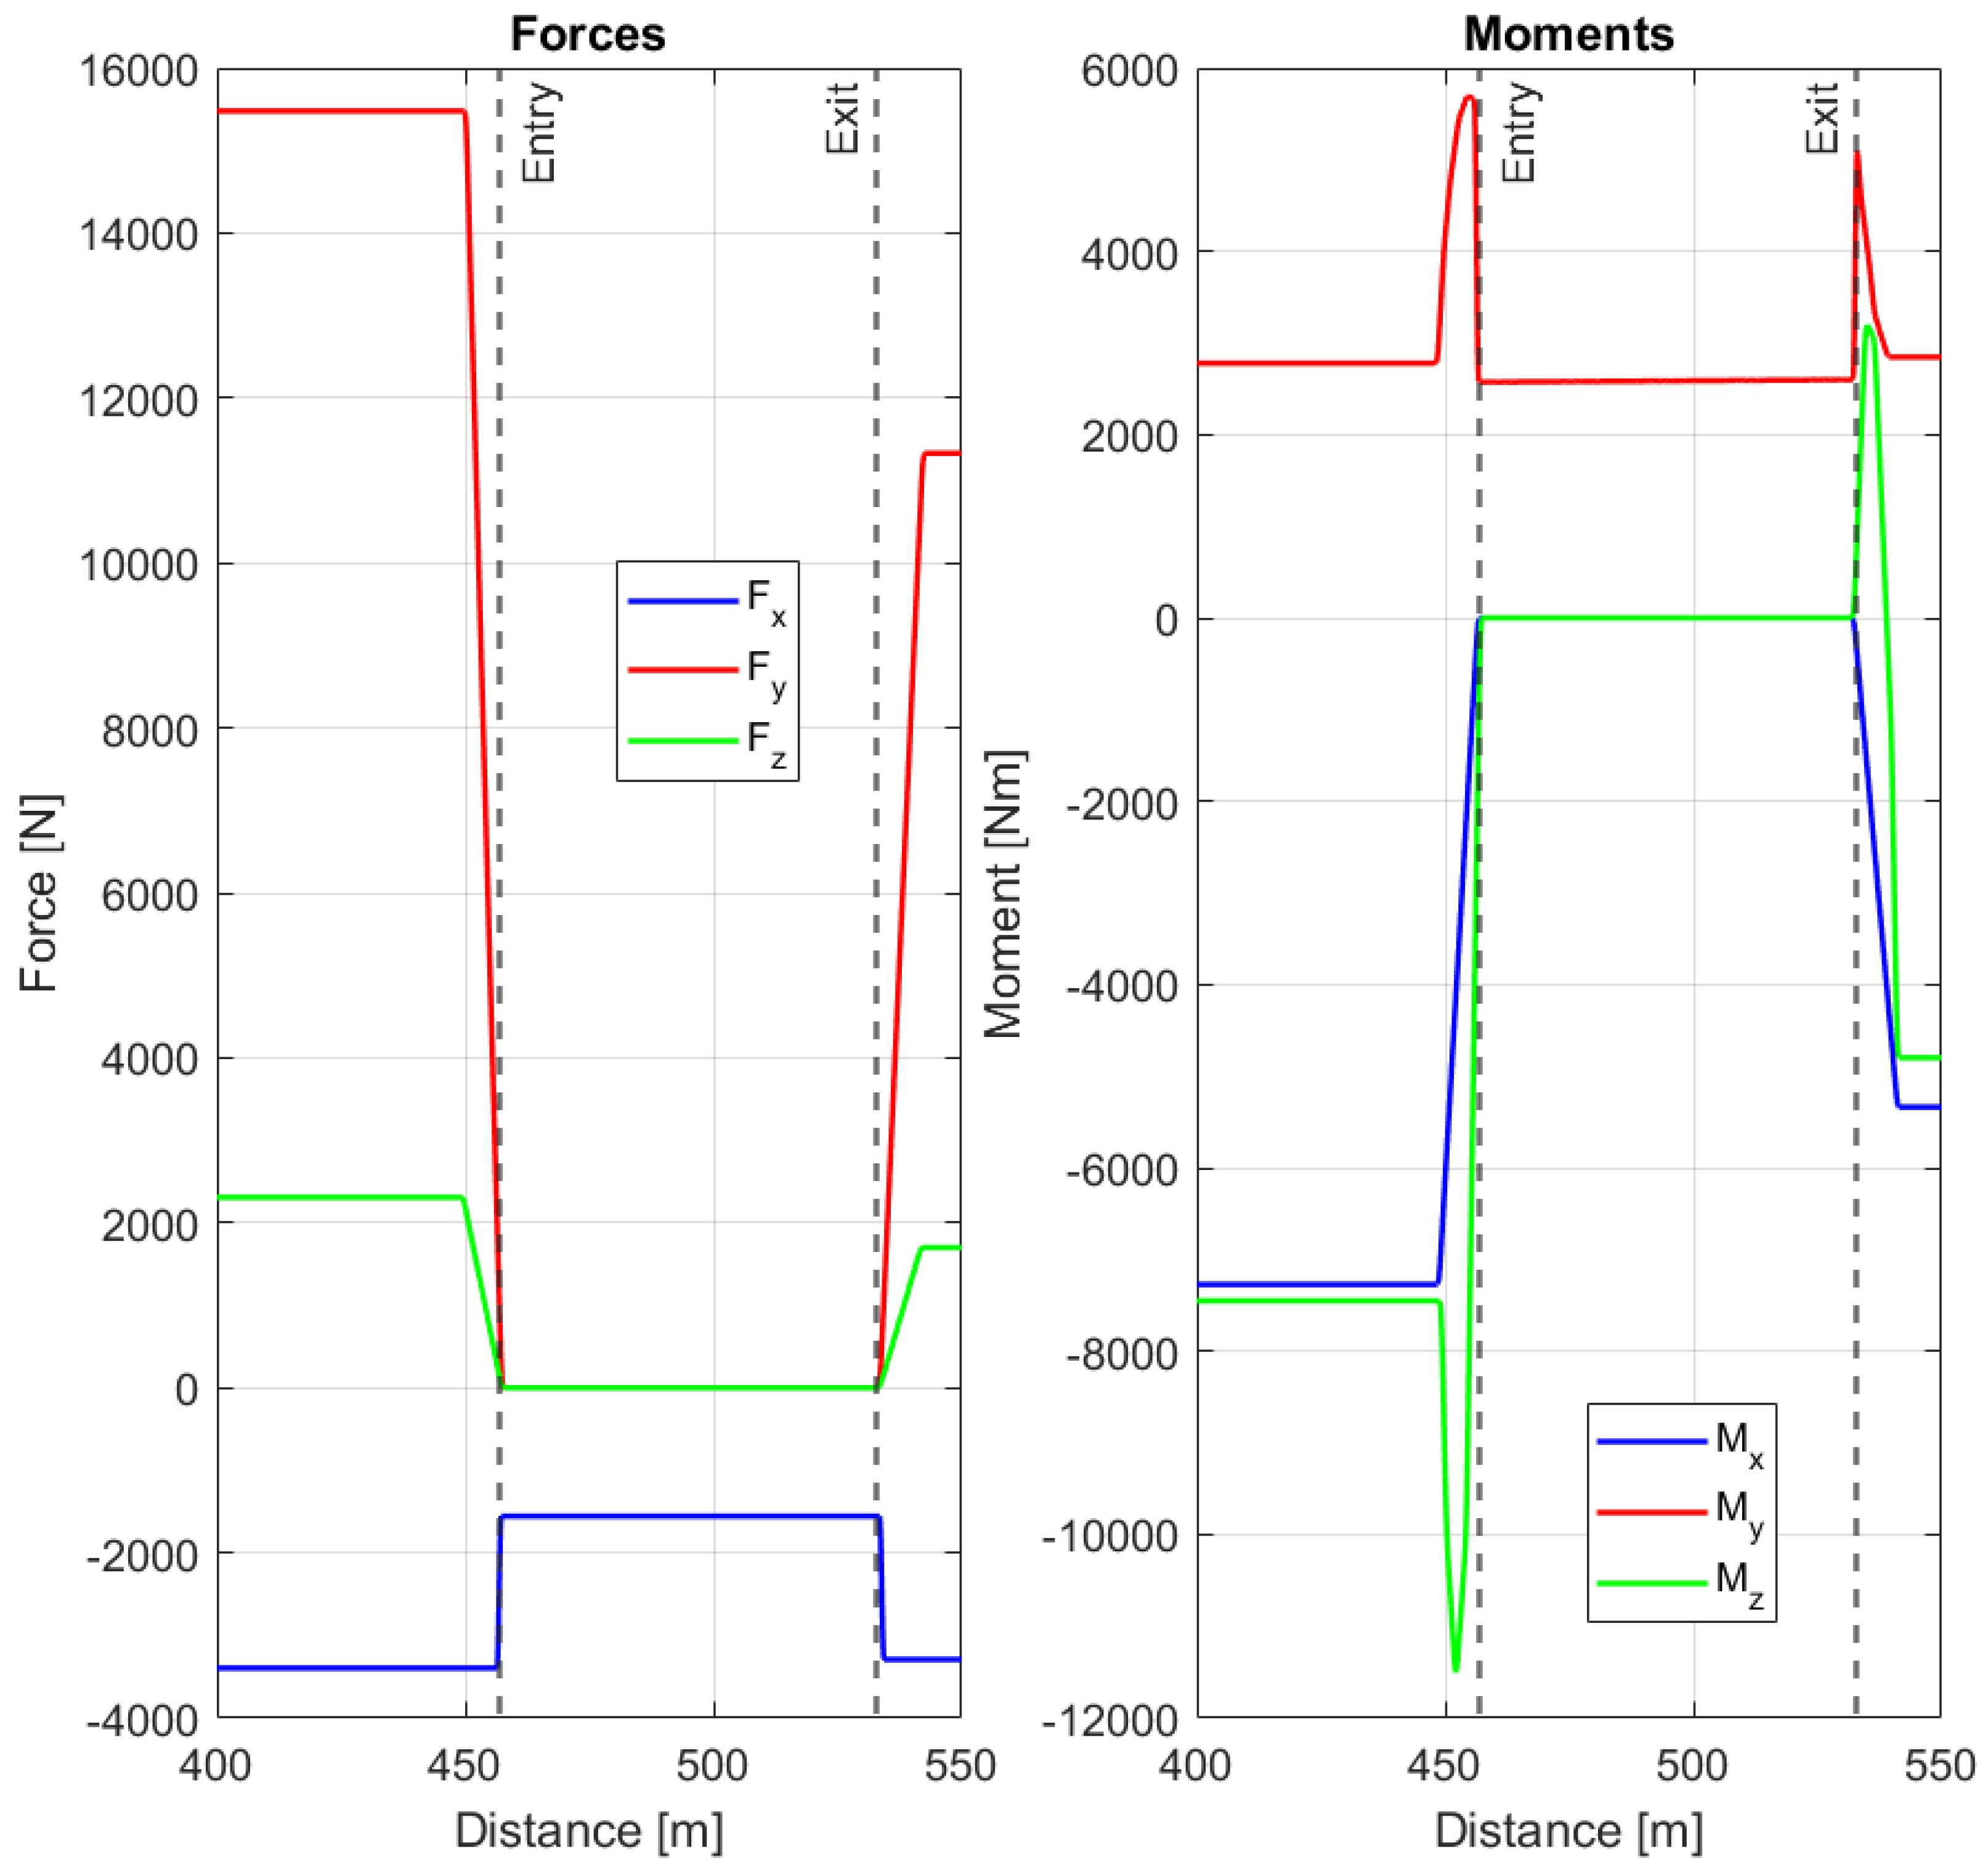
The aim of the study is to investigate the driver response at the tunnel exit. As the vehicle exits the tunnel, it is subject to aerodynamic forces varying with the relative position between the vehicle and the tunnel. Clearly, as the vehicle moves out of the tunnel, the exposed lateral surface of the vehicle to the wind increases. This phenomenon leads to a displacement of the point of application of aerodynamic forces and moments and to a magnitude of the aerodynamic forces and moments varying with the exposed lateral area of the high-sided lorry, as shown in Figure 5a,b. The global effect on the aerodynamic forces and moments of both the exposed area and the center of pressure transition can be appreciated in Figure 6.
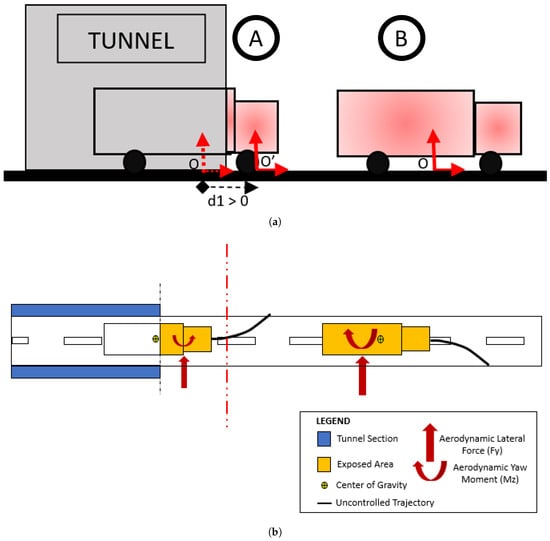
Figure 5.
Change in exposed area and consequent transition of center of pressure. (a) Change of exposed area in tunnel exit case. (b) Transition of the center of pressure.
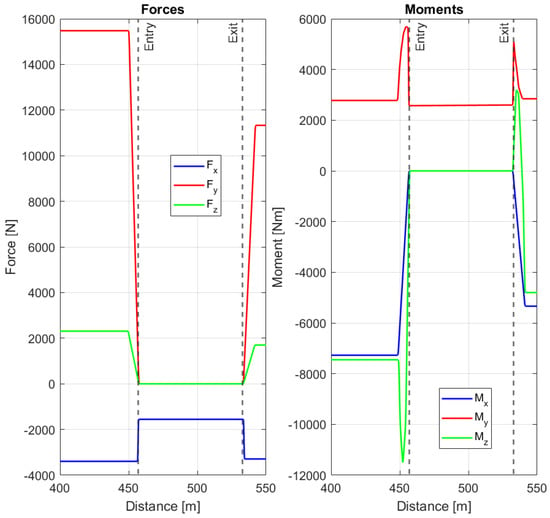
Figure 6.
Time history of aerodynamic forces and moments—tunnel entry and exit sections have been highlighted using dashed lines.
Aside from a linear change in the aerodynamic forces and moments due to the change of the exposed lateral surface to the wind, the authors hypothesized a change in the point where the forces are acting on the vehicle (center of pressure) proportional to the change in the exposed area. This displacement of the center of pressure has a great influence on the yawing moment (generated mostly by the lateral aerodynamic force ) that the driver will experience when exiting/entering the tunnel.
Generally, for high-sided lorries this effect is even amplified due to their particular geometry. Indeed, due to their shape, the center of pressure usually lies behind the center of gravity (negative sign for the aerodynamic yawing coefficient ). This condition is met also for the truck used in this work, as can be seen in Figure 3. The main term acting on the lorry is the aerodynamic yaw moment that is a function only of the geometry of the vehicle. The position of the center of gravity with respect to the center of pressure changes the handling properties of the vehicle (easier or more difficult to control) and could increase or decrease the rollover risk (height of the center of gravity). However, the behavior of the driver is practically unaffected by the change in position of the center of gravity in terms of a sequence of actions, as will be shown subsequently in Section 3.3.
When exiting the tunnel, the center of pressure will experience a transition passing from the front of the vehicle (ahead of the center of gravity) to its original position (behind the center of gravity). This leads to an overall yawing moment that reverses in sign. This condition is schematized in Figure 5a. Here it can be seen that while the lateral force remains in the same direction, the yawing moments experience a change in sign. The same is reported in a more quantitative way in Figure 6. As can be expected, this poses a big challenge to the novice/non-expert driver that can be deceived by this sudden change in yawing moment sign.
To model how the yawing moment reported to the center of gravity of the vehicle (the pitching moment has the same behavior) varies in the tunnel exit condition, Equation (4) has been used. For the roll aerodynamic moment it was simply necessary to scale its value according to the exposed area (the motion of the center of pressure had no effect in this case).
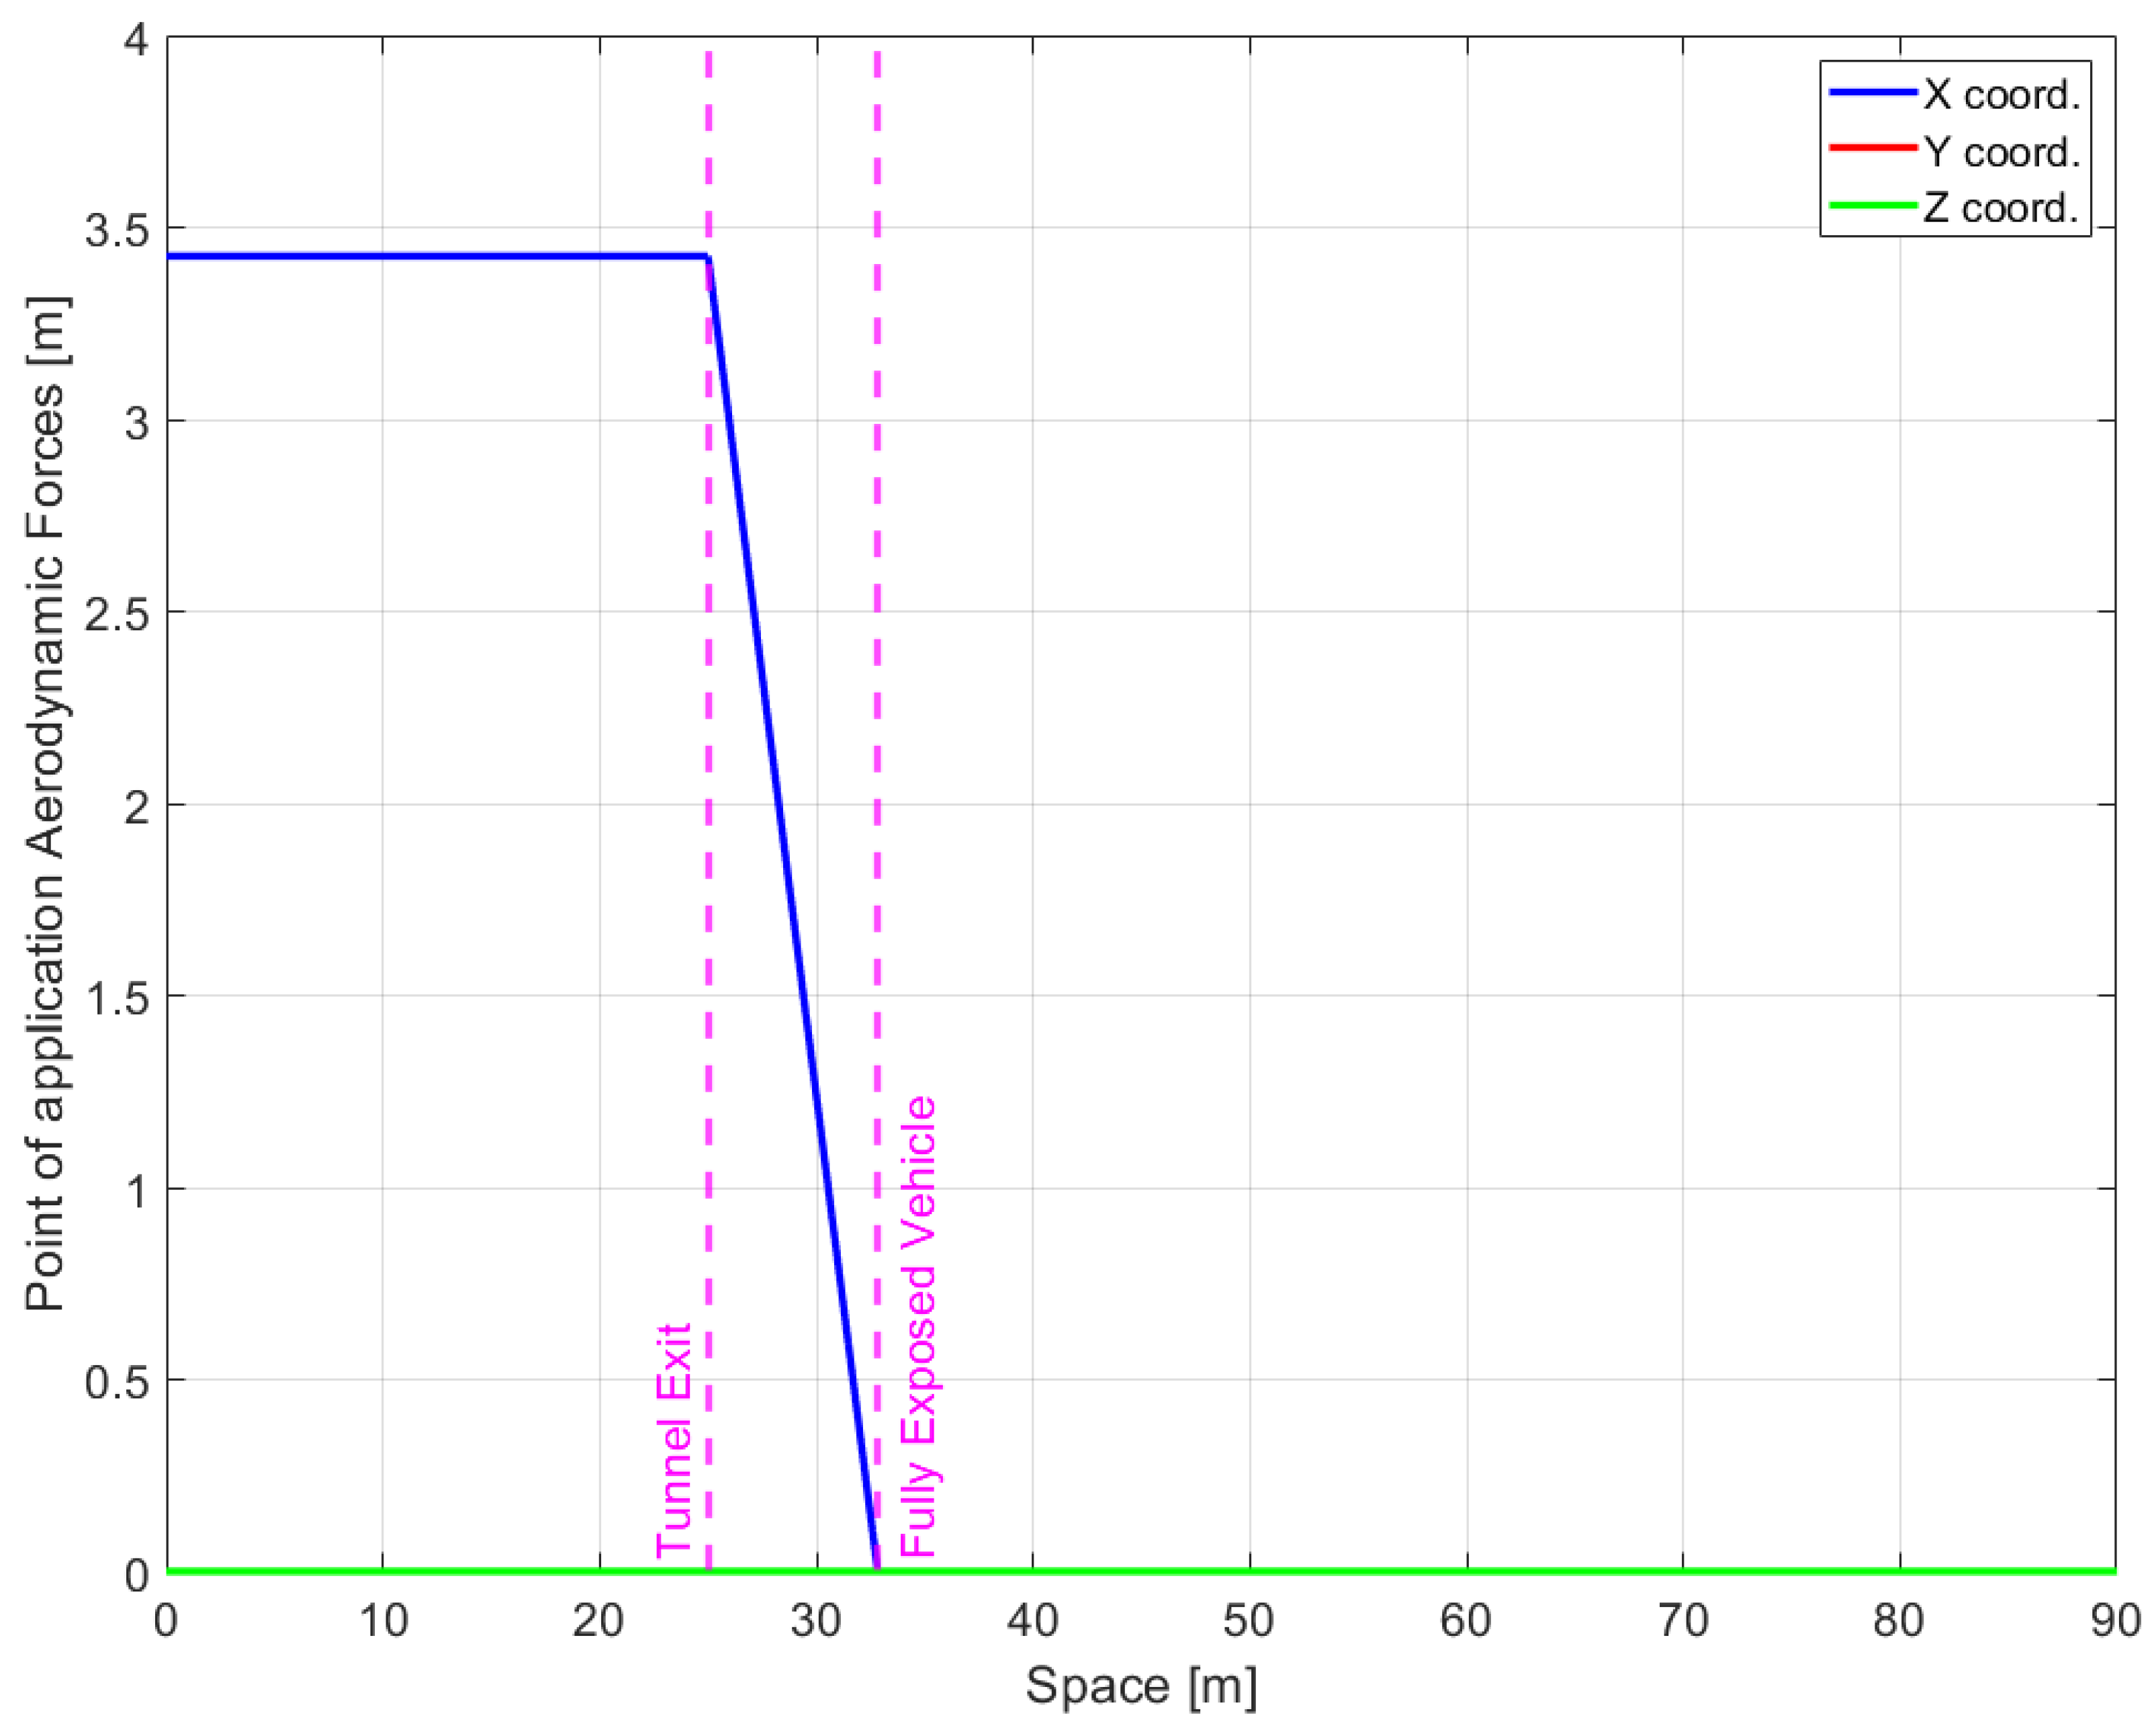
where is the length of the truck reported in Table 3, L is the effective truck exposed length (), is the center of gravity x position, and is the varying application point of the forces (due to the exposed length—or equivalent area—of variation). To give the reader an idea of the displacement of the application point of the aerodynamic loads, its motion with respect to the system of reference used by Cheli et al. [11,12] to measure the aerodynamic coefficients was reported in Figure 7. This system of reference was placed on the ground, at mid-wheelbase (and mid-track). To evaluate the aerodynamic moment at the center of gravity of the vehicle (Empty or Laden), it is necessary to add (or subtract) to the quantities reported in Figure 7 the distance between the origin of the system of reference and the position of the center of gravity for the vehicle configuration chosen.
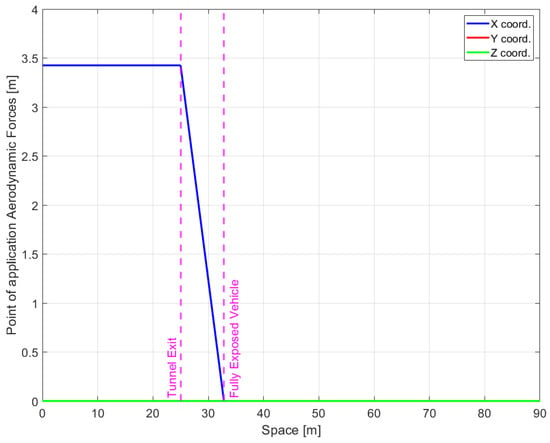
Figure 7.
Displacement of the coordinates of the application point of the aerodynamic forces with respect to the system of reference used by Cheli et al. [11,12] to measure the aerodynamic coefficients.
The modeling approach based on the effective exposed area (and linear shift of the center of pressure function on the exposed area) above described was used in many similar studies by authors like Charuvisit et al. [5,6], Rocchi et al. [7] and Walczak [27] to model the crosswind-vehicle interaction in presence of infrastructure elements. In particular, Charuvisit et al. [5,6] and Rocchi et al. [7] adopted a discretized approach (the truck was divided into slices, each contributing to the total aerodynamic load acting on the vehicle), while Walczak [27] adopted a continuous approach similar to the one proposed in this study. A validation of the proposed method was given by Quattromani et al. [28]. These authors compared with success the above-mentioned discretized approach with numerical CFD results obtained for the case of a truck moving in the wake produced by a crosswind on a bridge pylon tower.
In Equation (4), is the aerodynamic yaw moment applied to the center of gravity, taking into account the translation of the forces application point due to the exposed area variation. In the case where the vehicle is completely inside the tunnel, of course, no aerodynamic forces are applied to the system except for the aerodynamic drag due to the vehicle speed itself (the wind is always coming orthogonal to the tunnel, never from a parallel direction).
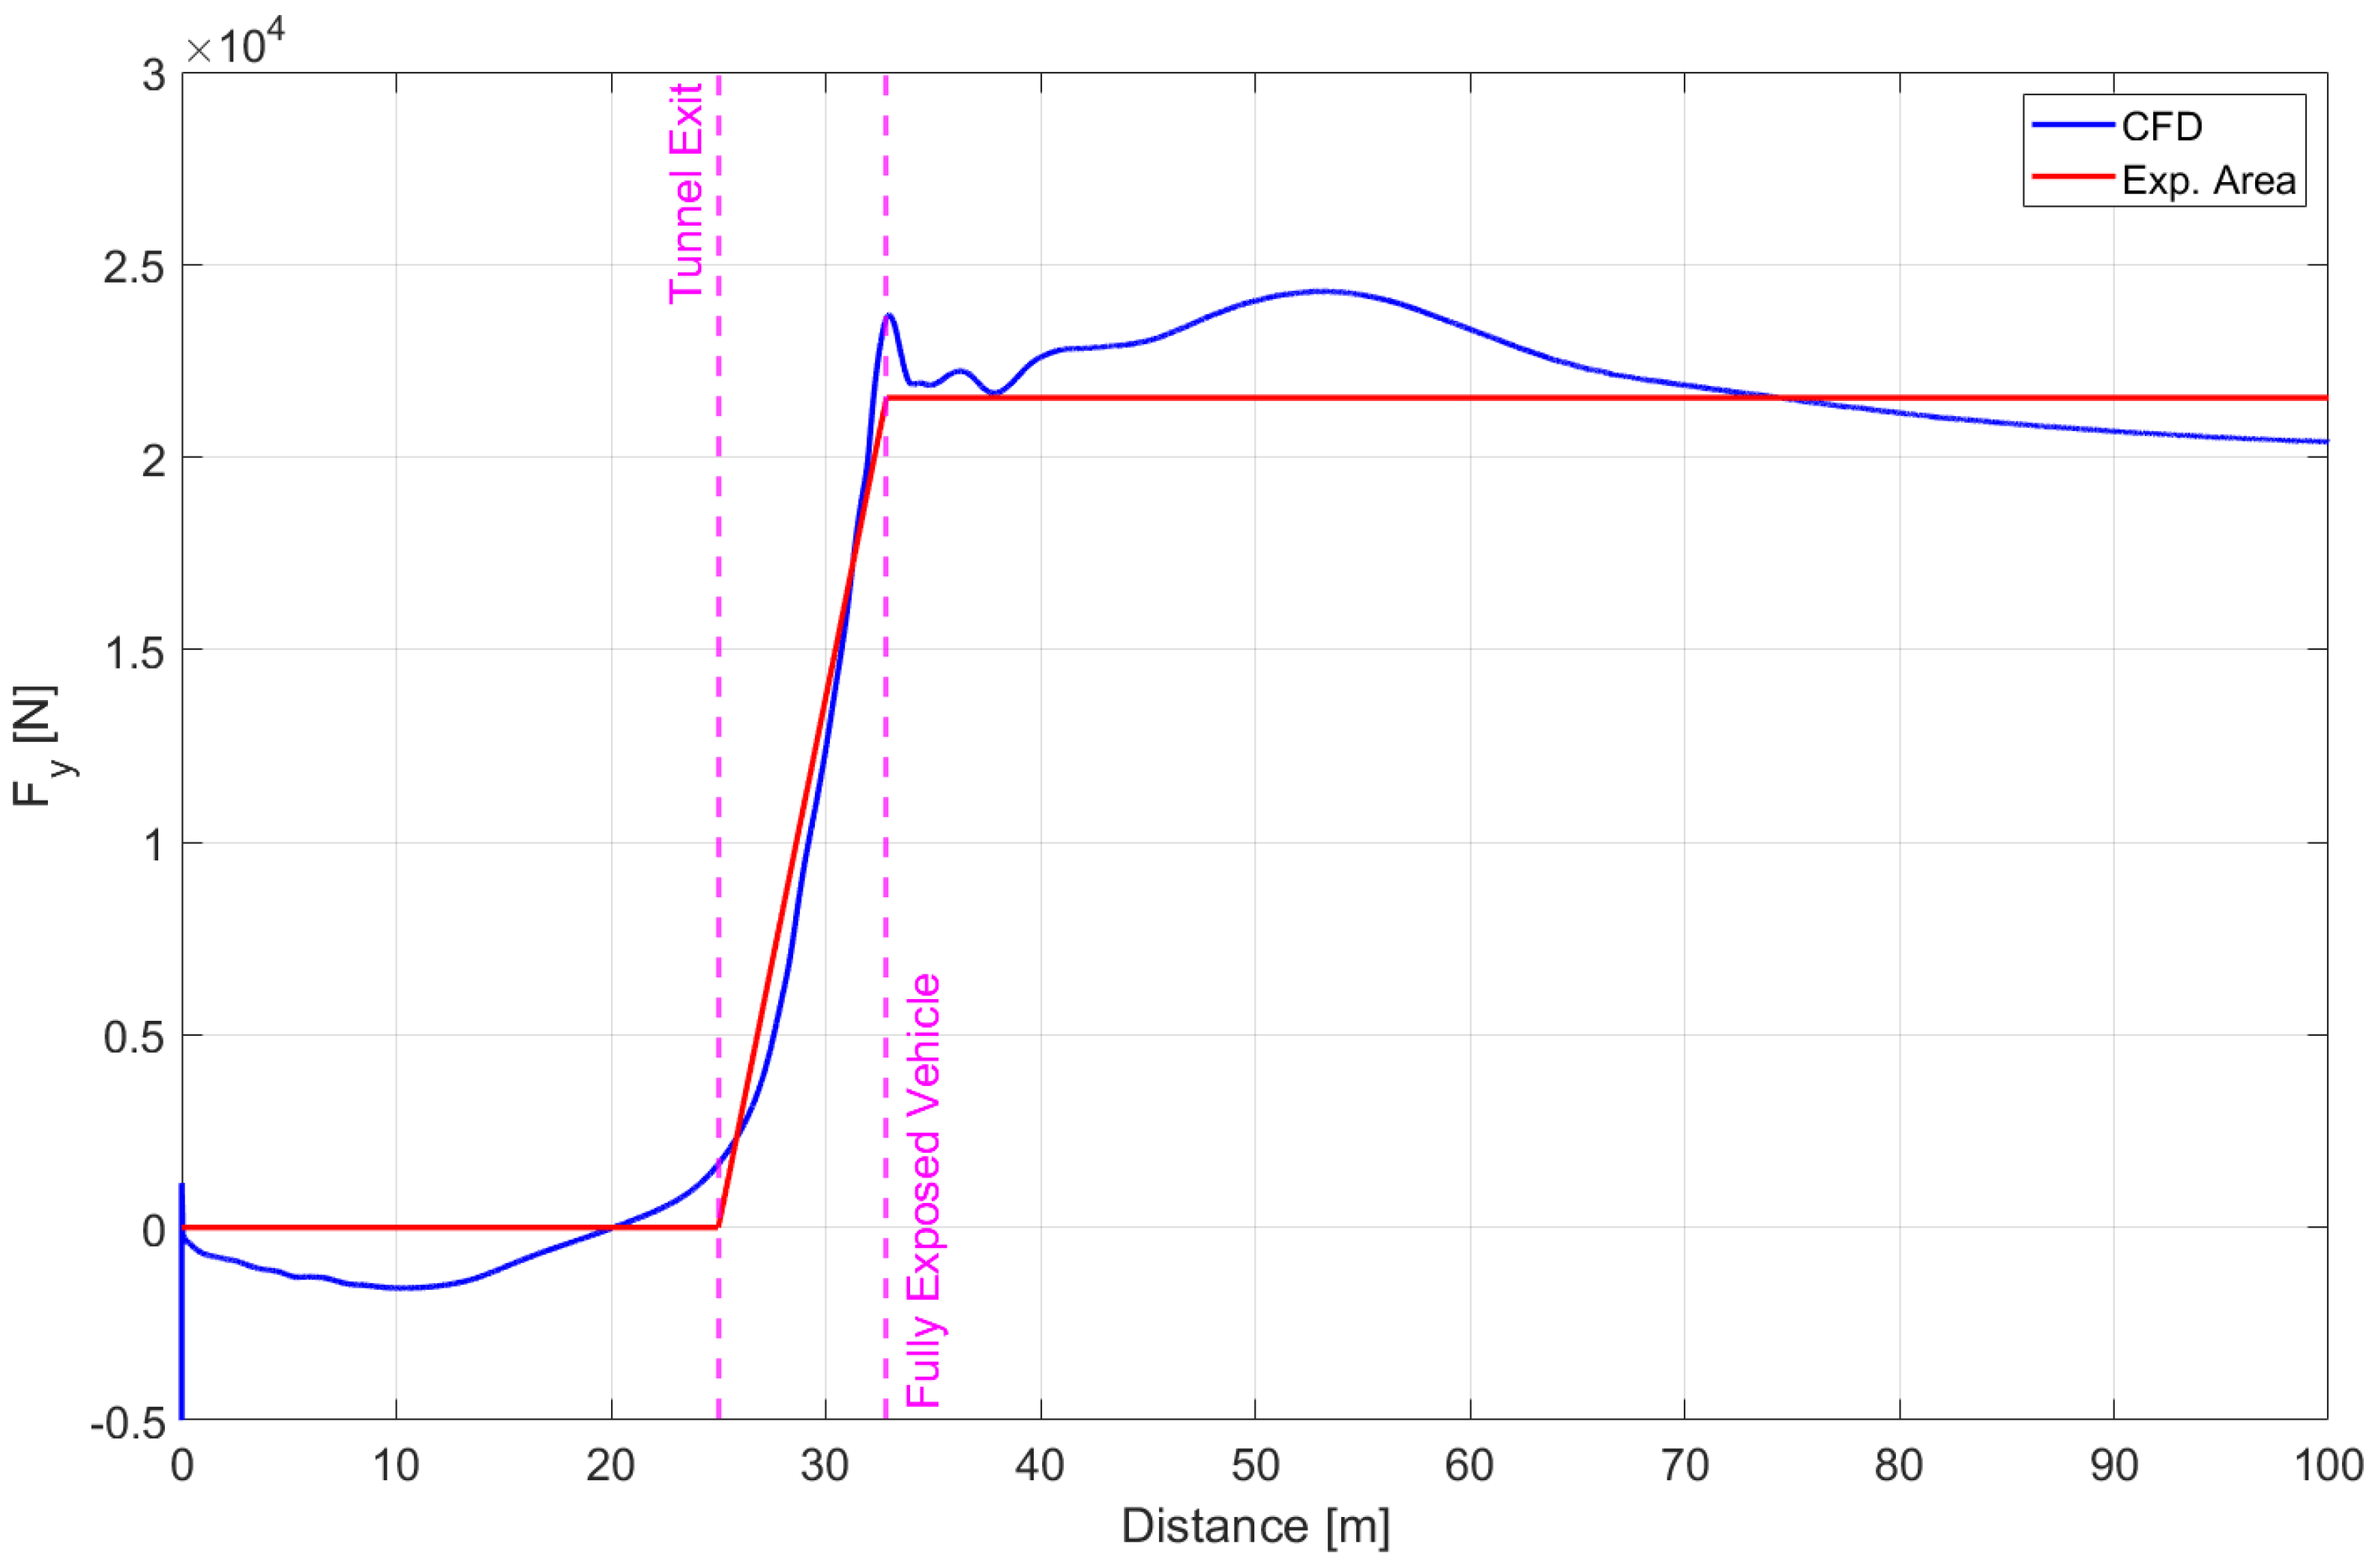
For sake of completeness, it is reported in Figure 8 a comparison between the lateral aerodynamic force evaluated using the exposed area approach above described and a CFD case involving the same lorry used in this work running at 90 km/h with a 25 m/s crosswind at the tunnel exit. The simulated CFD case was taken by the previous work of Semeraro et al. [21]. As can be seen, there is a good agreement between the two methods.
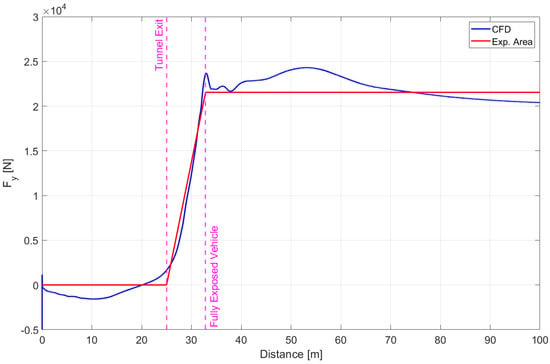
Figure 8.
Comparison of the lateral aerodynamic force, between a CFD case taken from the work of Semeraro et al. [21] and the exposed area approach.
2.3.1. Scenario and Drivers
The virtual scenario used for the simulator tests has been created using Roadrunner. The scenario features a 2 km straight road with a total of 5 tunnels 75 m long. The tunnel size is ∼10 times the vehicle length. This measure has been designed to ensure that the vehicle reached a steady state condition inside the tunnel. Two vehicle configurations, Empty (without payload) and Laden (with a payload of ∼9600 kg), have been tested by each driver. For each vehicle configuration, two different vehicle speeds have been tested (65 km/h and 80 km/h). In the 5 different sections between the tunnels, different wind conditions (both in speed and direction) have been tested. They have been reported in Table 4. The wind speed magnitudes have been selected keeping in mind the vehicle rollover thresholds of both the Empty and Laden vehicle configurations. As stated in Section 2.3, both a turbulent or uniform crosswind could be imposed. During the experiment, the direction and sequence of wind speeds in the tests were selected randomly.

Table 4.
Wind speed tested in the virtual scenario.
For what regards the 28 drivers, they were all volunteer university students (all males, with an average age of 23 years old). All the volunteers had a valid driving license (B license) for at least 4 years, but most of them had little to no experience in driving a truck. For this reason, before performing the experiment, each driver had a 10 min practice session on the dynamic driving simulator to get acquainted with the high-sided lorry (without crosswind).
3. Results and Discussion
The aim of this study was to characterize the general vehicle–driver response when crosswind is acting on the particular vehicle considered. After the data has been organized, time domain plots have been generated to understand the trends of the most important signals that characterize the vehicle–driver system response. In particular, the signal analyzed can be divided into driver-related (inputs) and vehicle-related signals (outputs).
Regarding the driver-related signals, we took into consideration the:
- Steer Angle signal;
- Steer Torque signal.
For the vehicle-related signals, the main data analyzed regarded the:
- Yaw rate signal;
- Lateral deviation from center lane signal——where is the minimum width of a highway lane in Italy, W is the width of the lorry and y is the lateral displacement of the vehicle after the tunnel exit. The critical limit for this index is thus ;
- Rear-wheel normalized load transfer signal——as a metric to understand wheel lift-off and initiation of rollover (Vehicle Output). Only the normalized load transfer signal related to the rear-axle was reported in the results because, for this two-axle vehicle, the rear-axle is the most subject to rollover risk. The index suggests that rollover starts as soon as one of the (rear-axle) wheels records a value of (incipient wheel lift-off). When this condition happens, the index assumes the limit value of .
Aside from these signals, the authors also attempted to reconstruct the sequence of events (by means of a time delay analysis) that takes place at the tunnel exit and evaluated the critical conditions (i.e., the combination of wind speed, vehicle speed and load), which may lead to vehicle rollover and/or lane invasion.
3.1. Driver and Vehicle Signals
The aerodynamic loads developing at the tunnel exit induce a reaction by the vehicle–driver system. These loads are heavily influenced by the relative speed between the vehicle (in this case a high-sided lorry) and crosswind and by the angle of attack of the vehicle with respect to the wind flow. For the scenario considered (crosswind at tunnel exit), the aerodynamic lateral force and yaw moment can be considered as the most important factors causing the vehicle–driver response. The values of relative wind speed, angle of attack, aerodynamic lateral force , and aerodynamic yaw moment for the case of a fully exposed vehicle running at 65 km/h and 80 km/h are reported, respectively, in Table 5 and Table 6.

Table 5.
Aerodynamic forces and moments for vehicle at 65 km/h.

Table 6.
Aerodynamic Forces and Moments for Vehicle at 80 km/h.
A plot of the time history of aerodynamic forces and moments in the proximity of one of the tunnels of the scenario is shown in Figure 6 (for sake of clarity, a non-turbulent wind is considered). Here, the reversal of yaw moment as the vehicle exits the tunnel is clearly visible. This reversal is connected to the movement of the point of application of aerodynamic forces and moments, shown in Figure 5b, while the magnitude of the forces and moments are controlled by the change in the exposed lateral surface area of the vehicle, shown in Figure 5a.
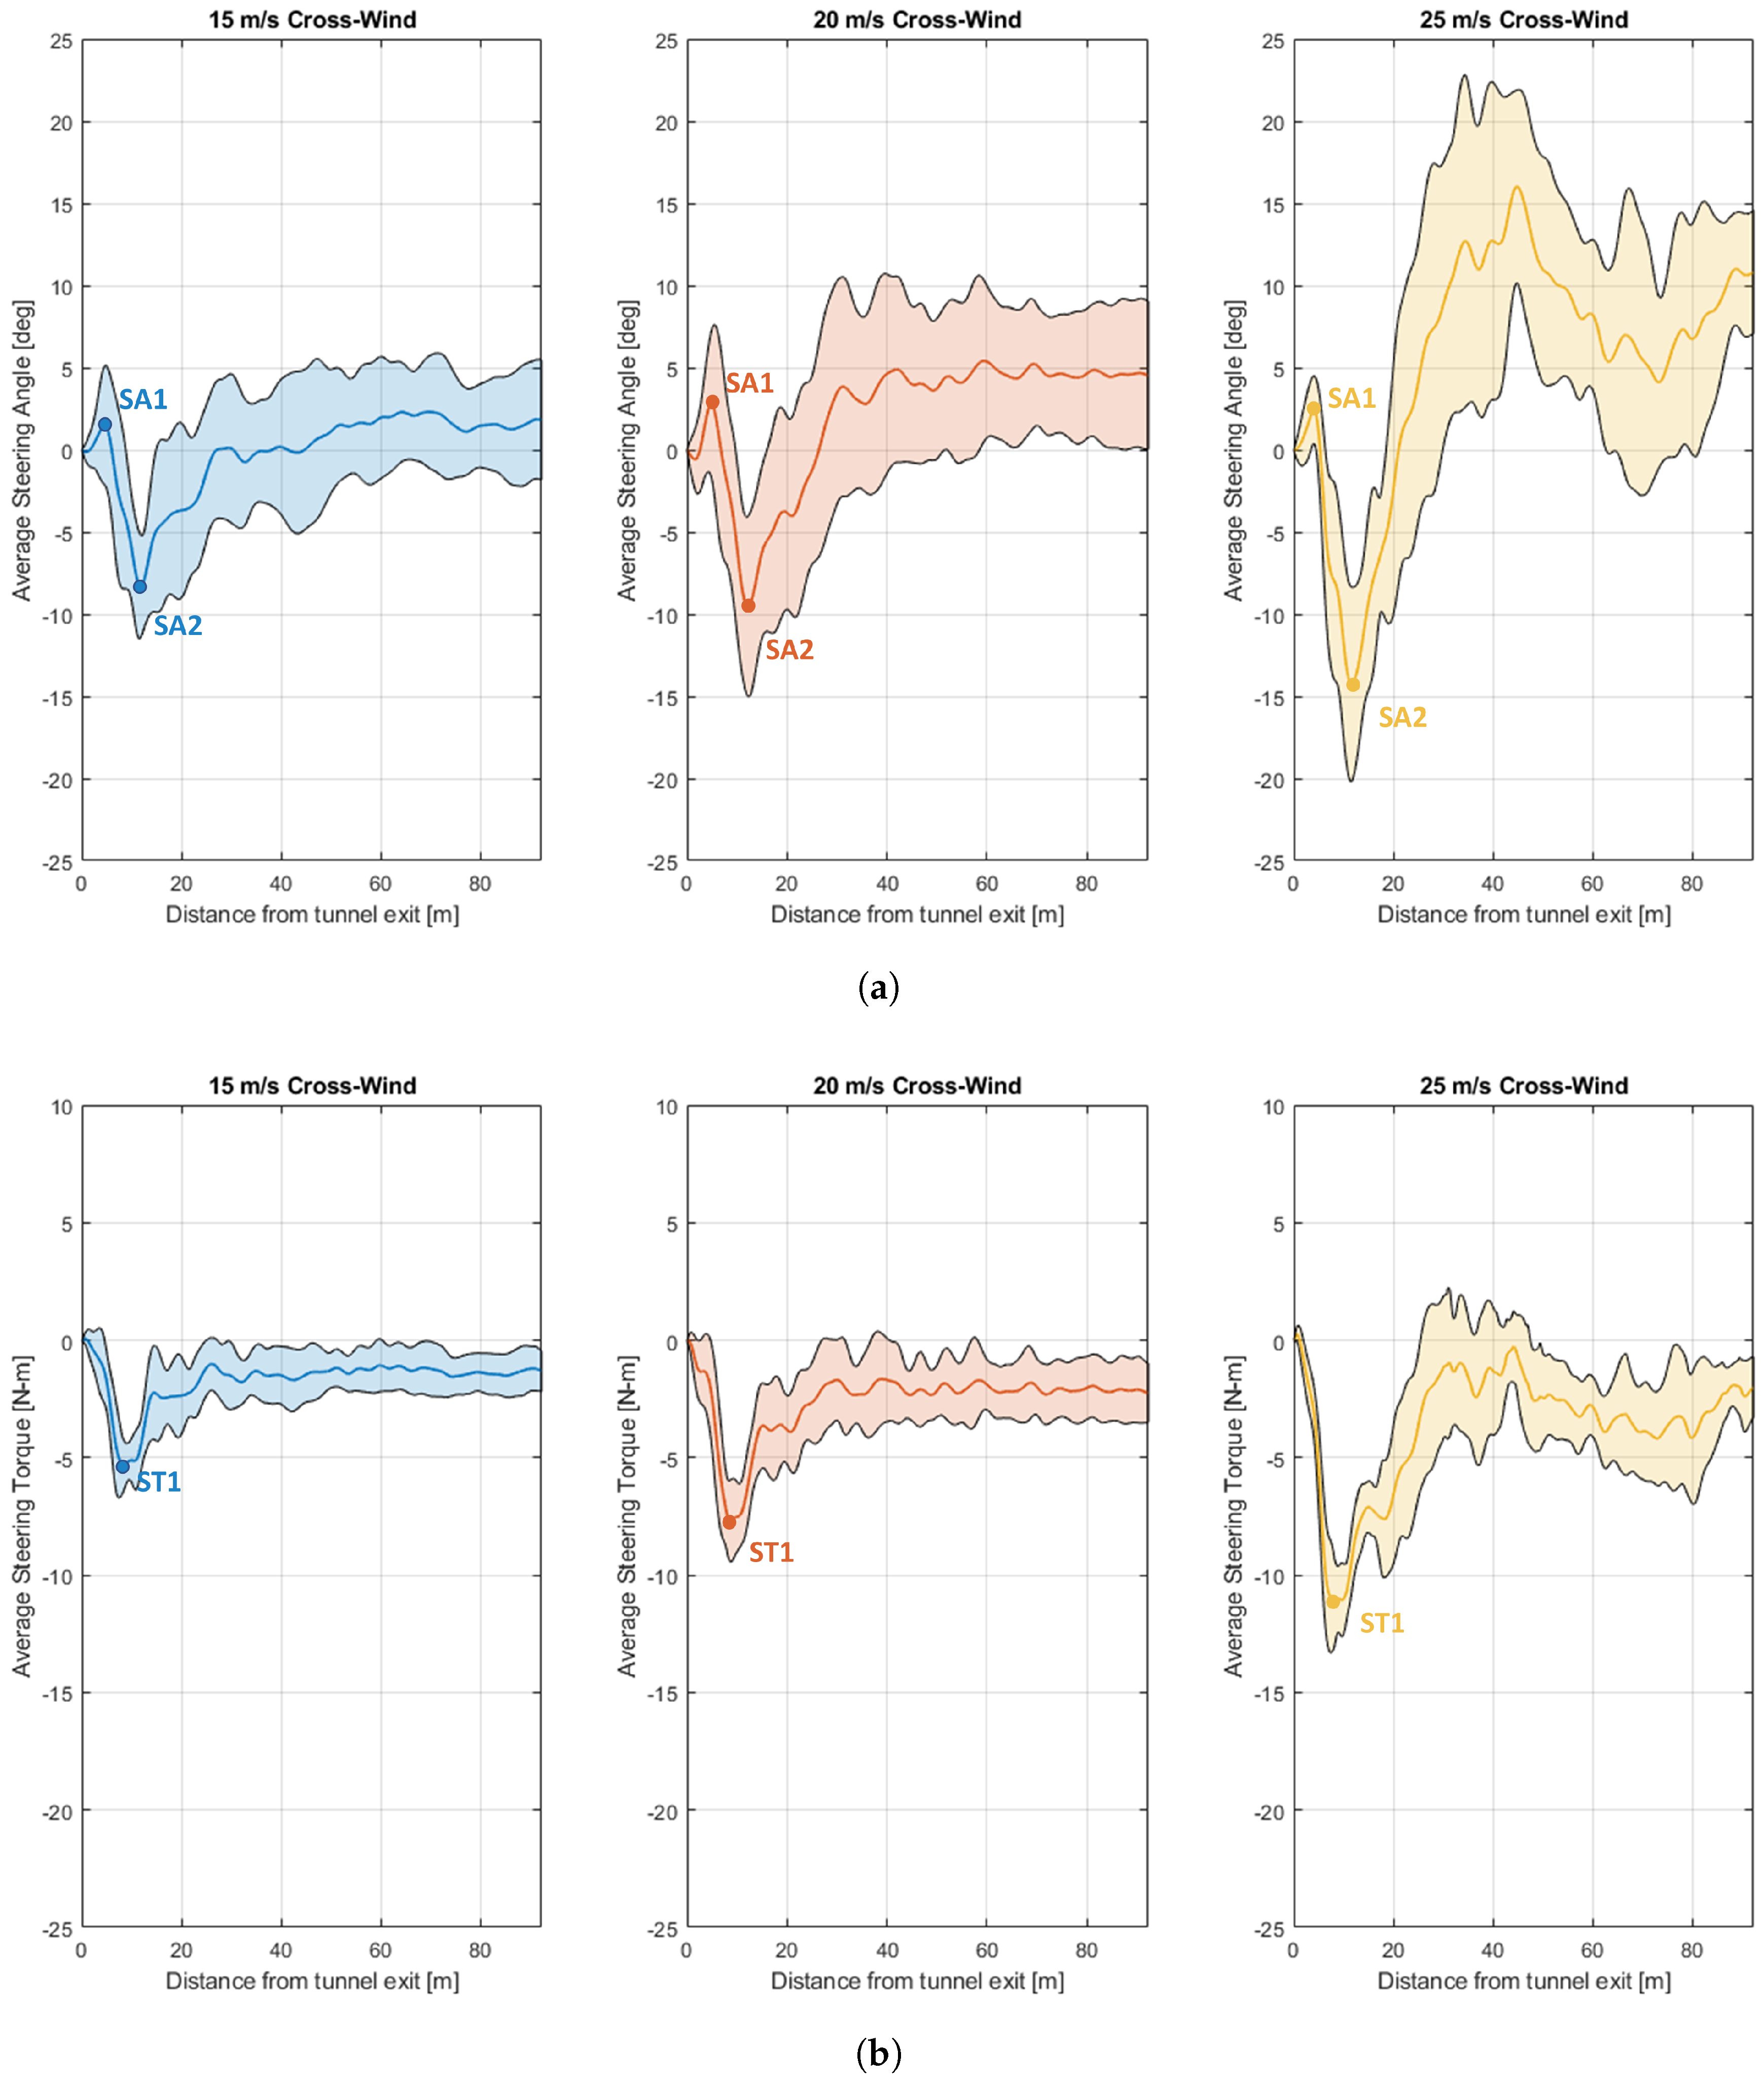
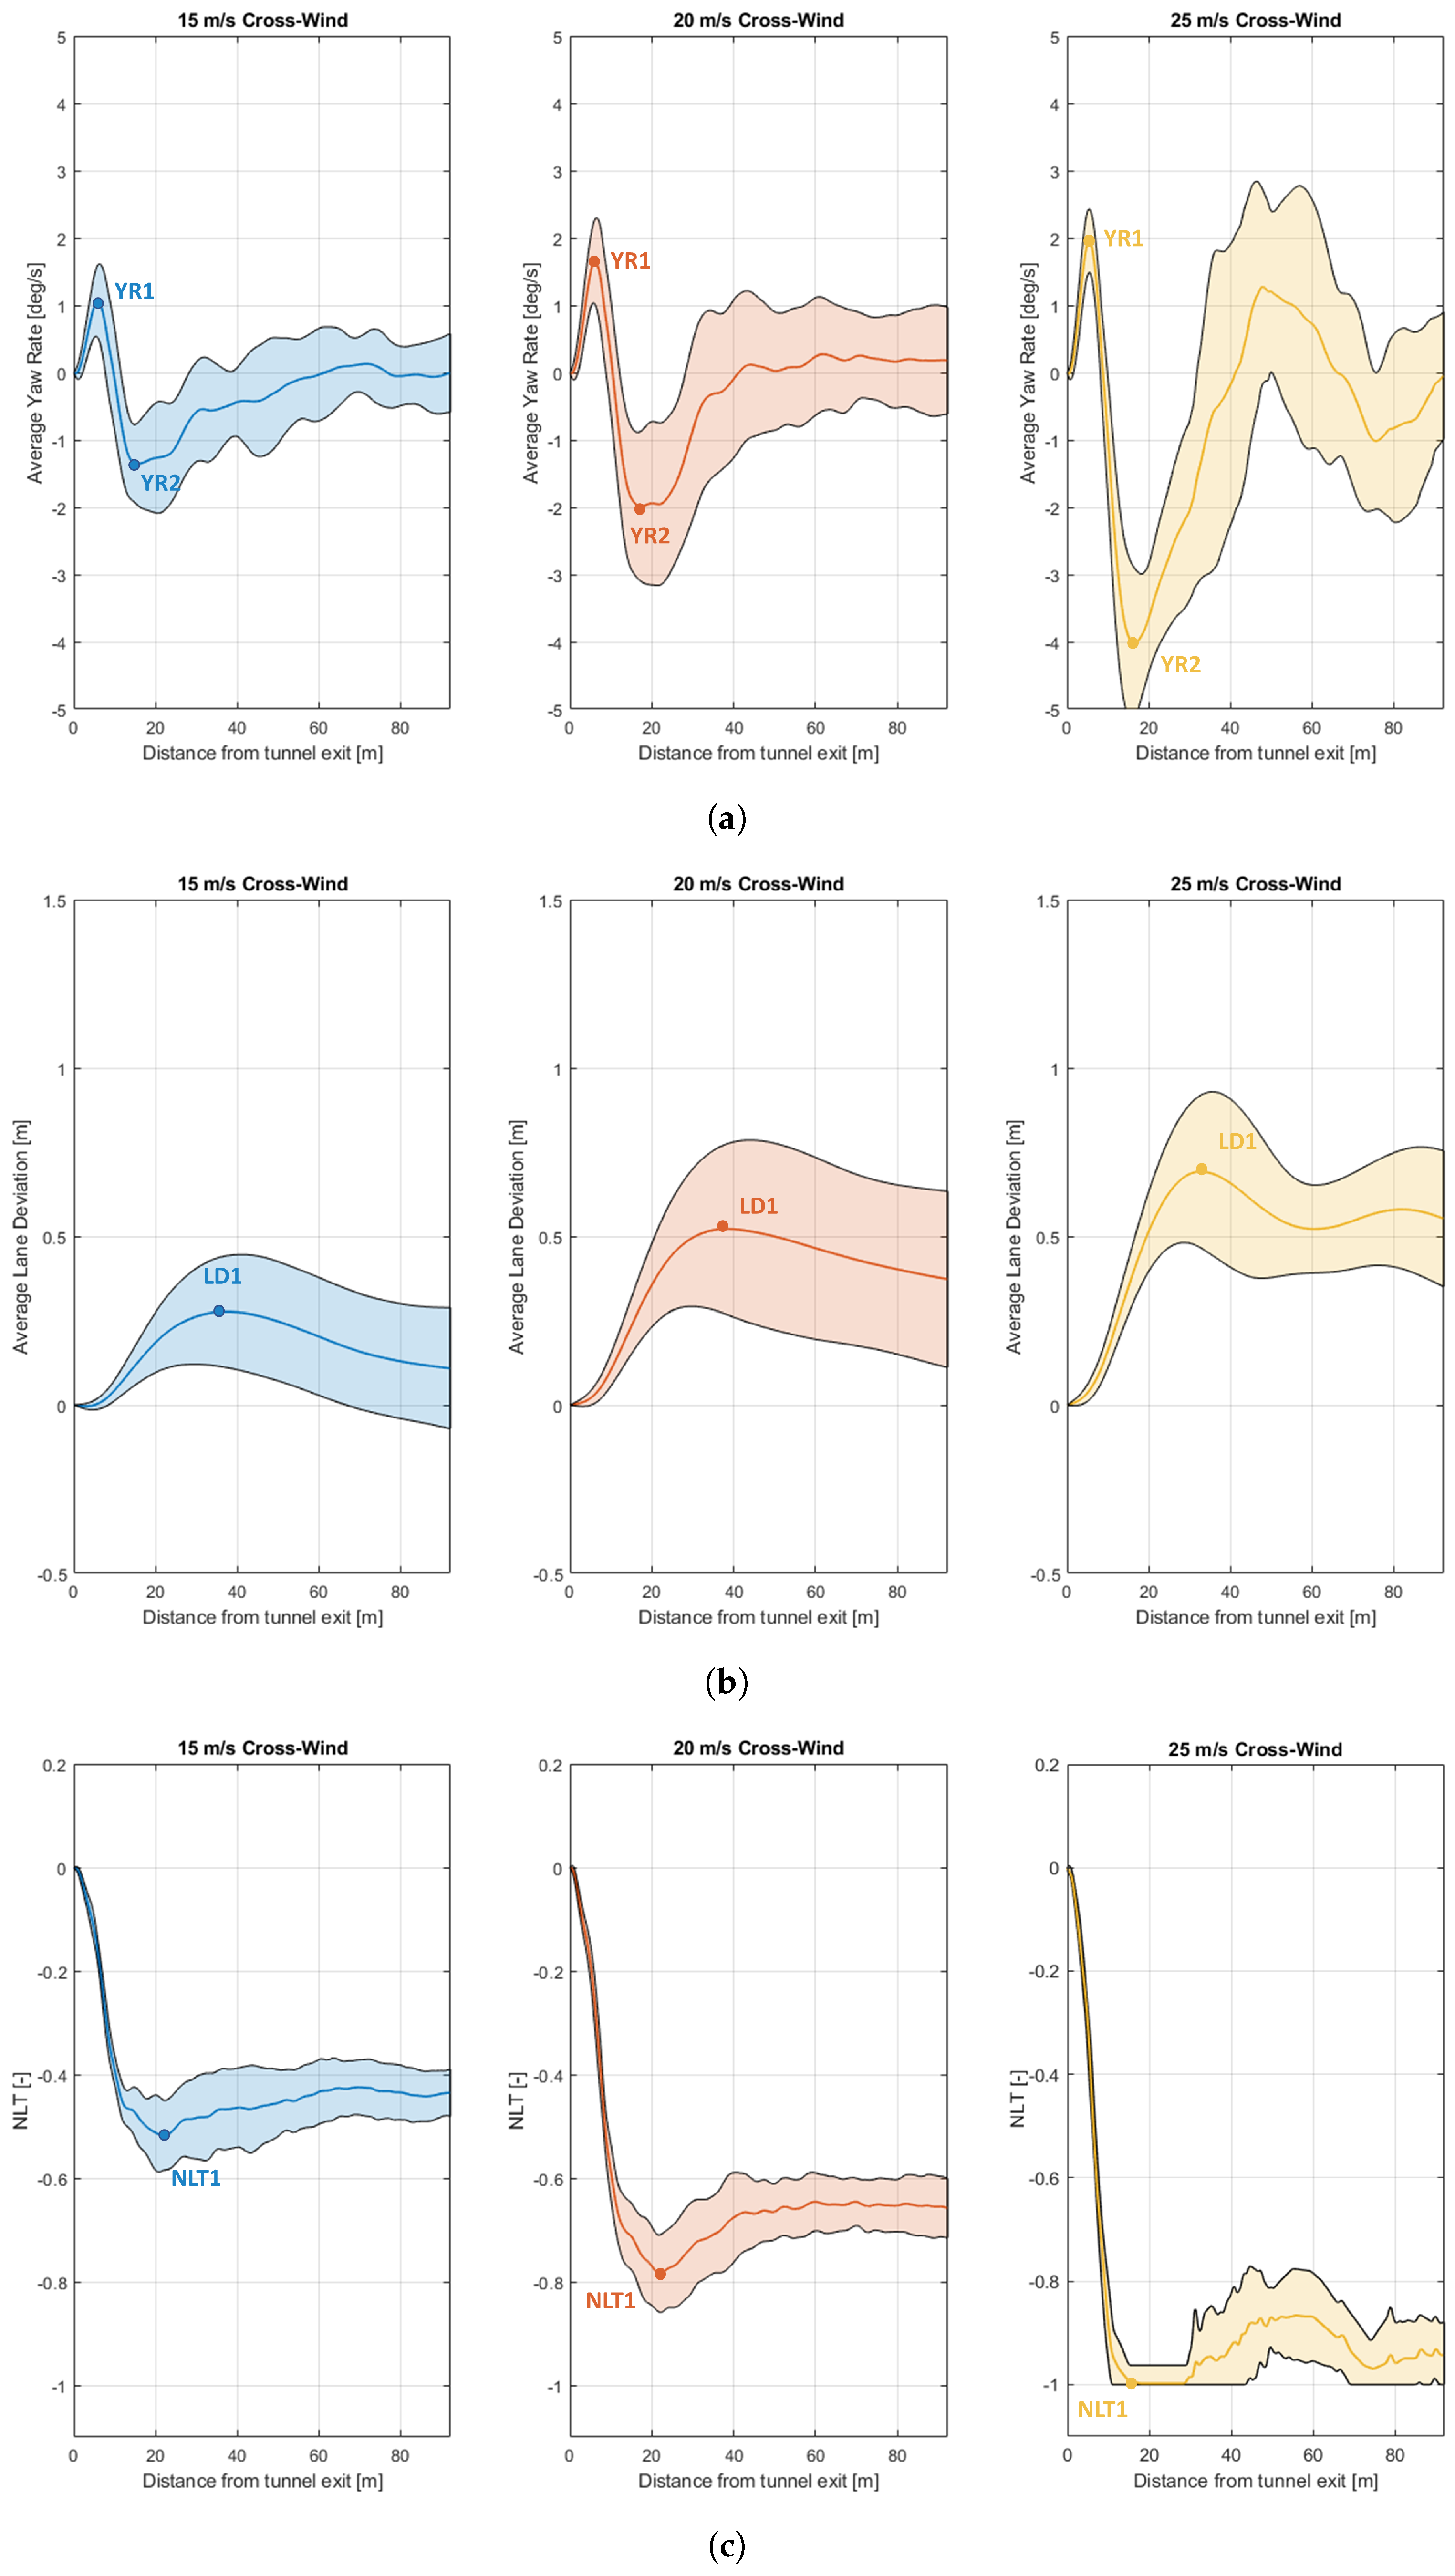
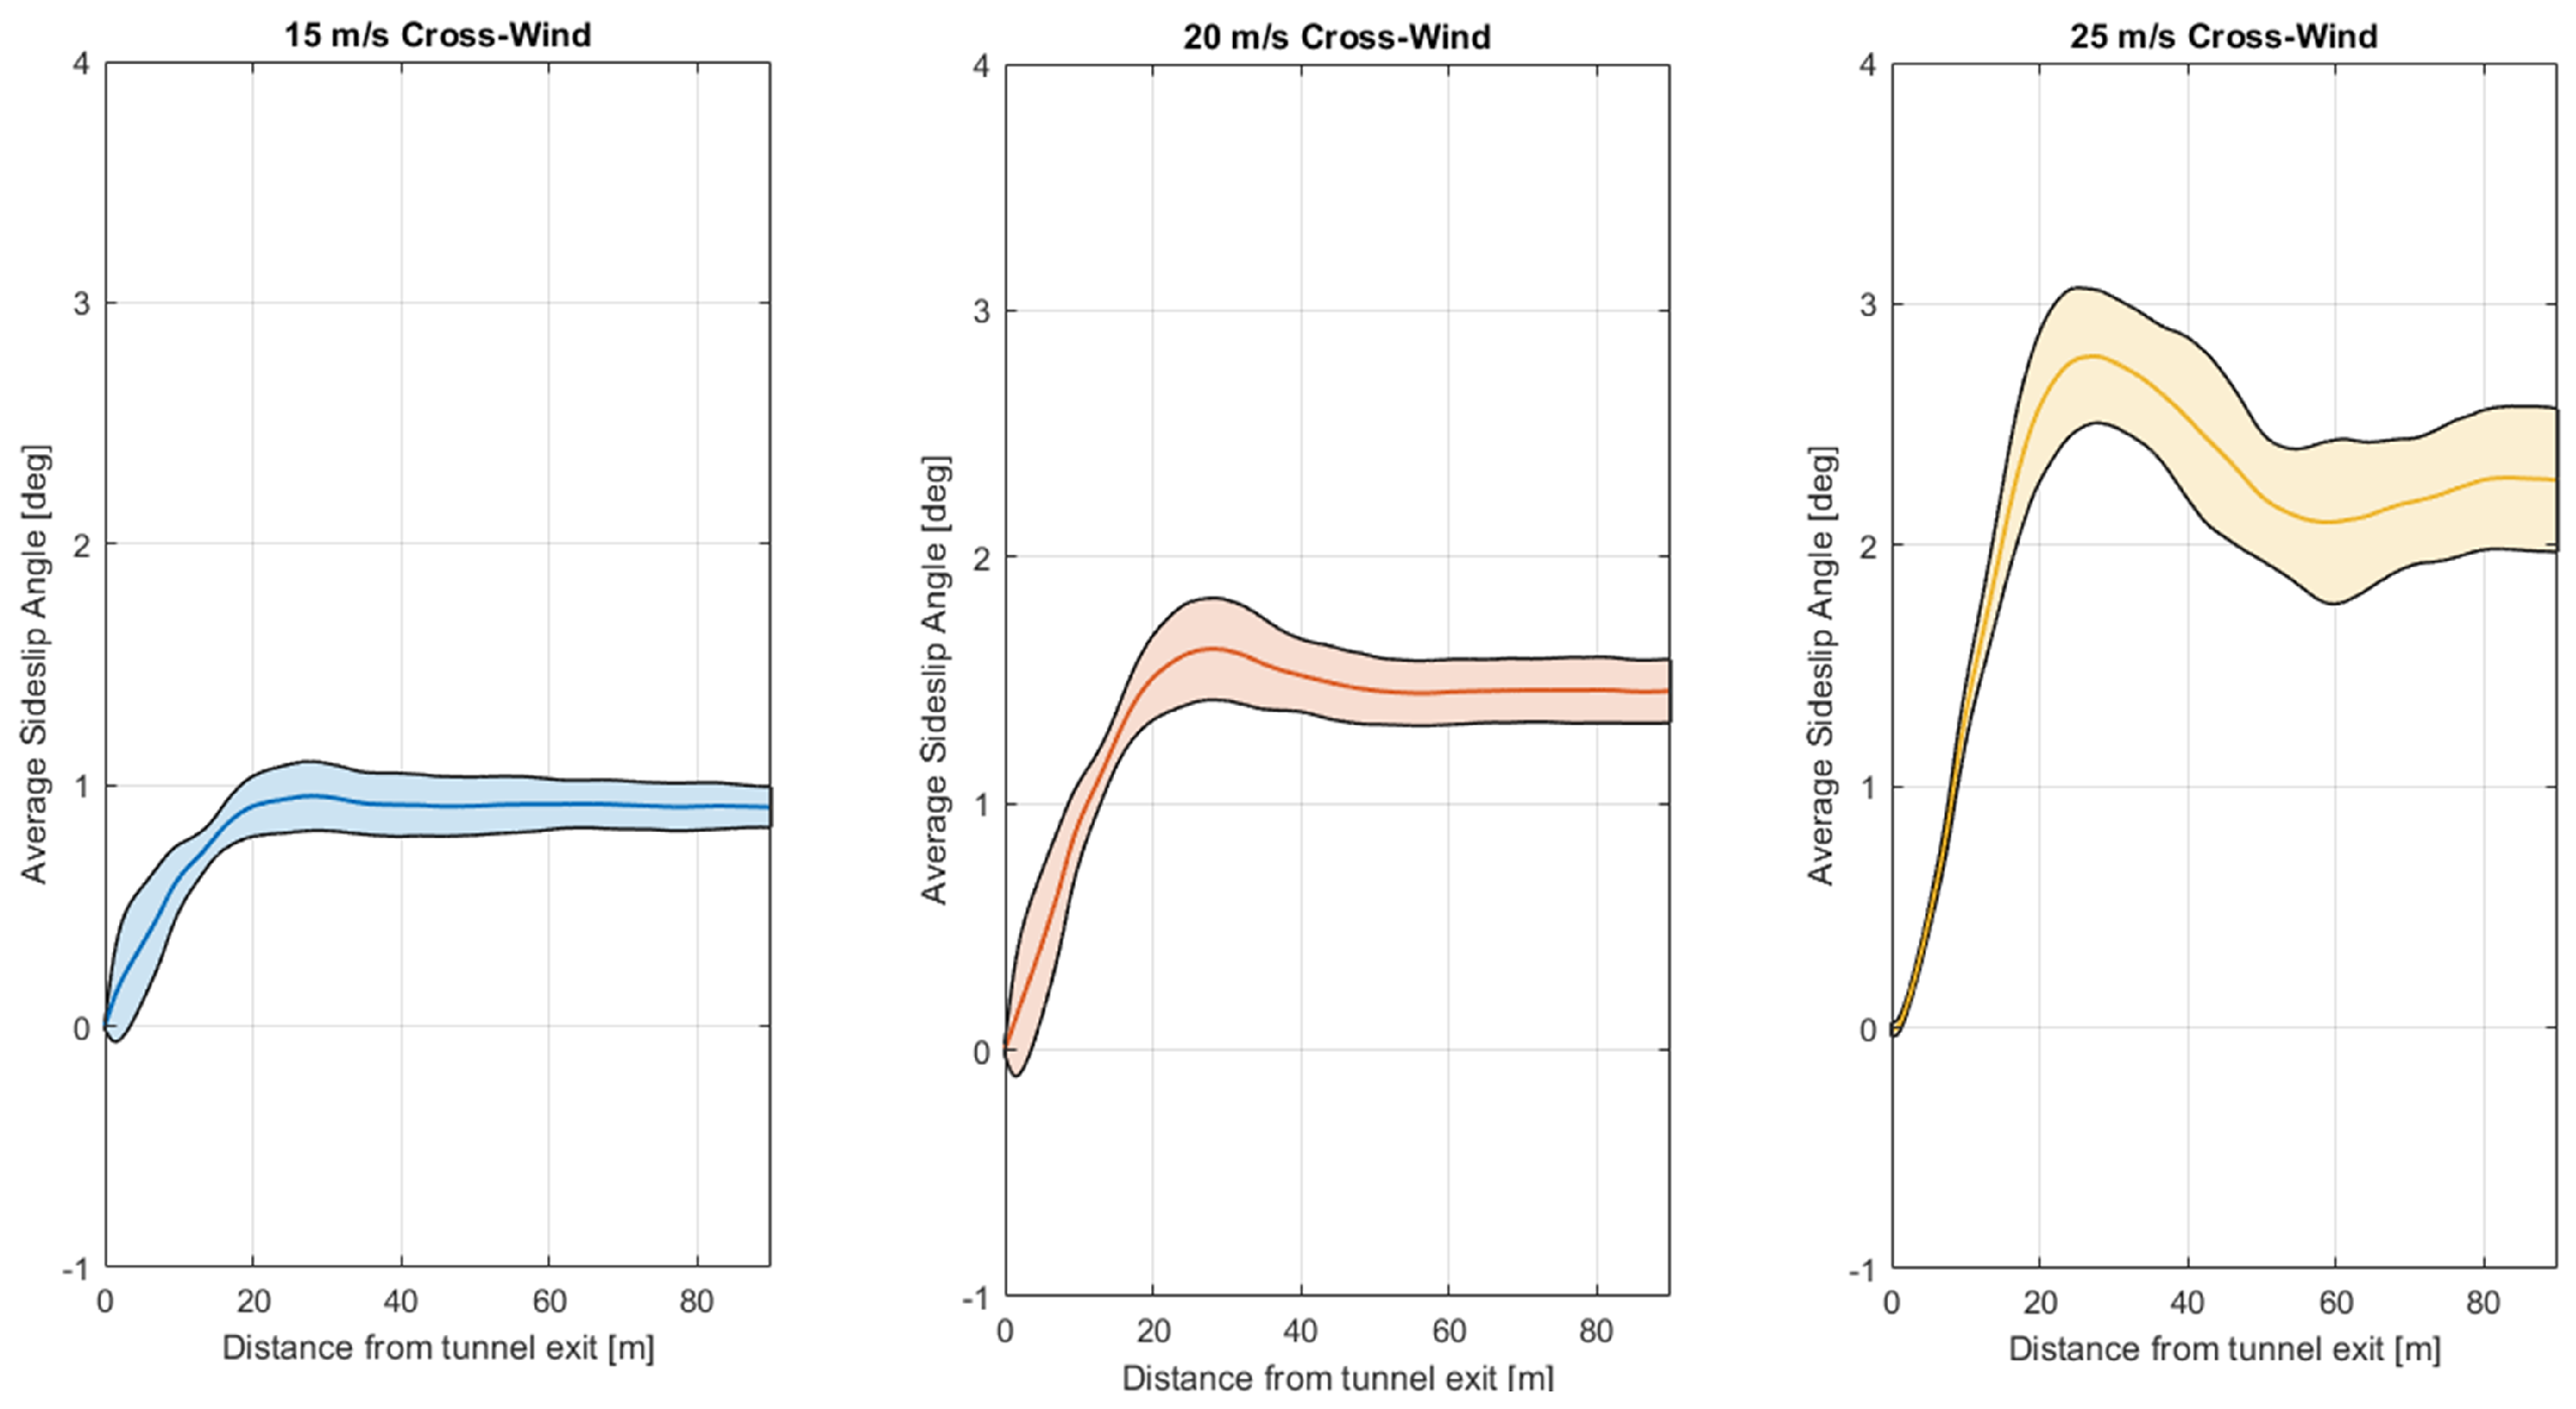
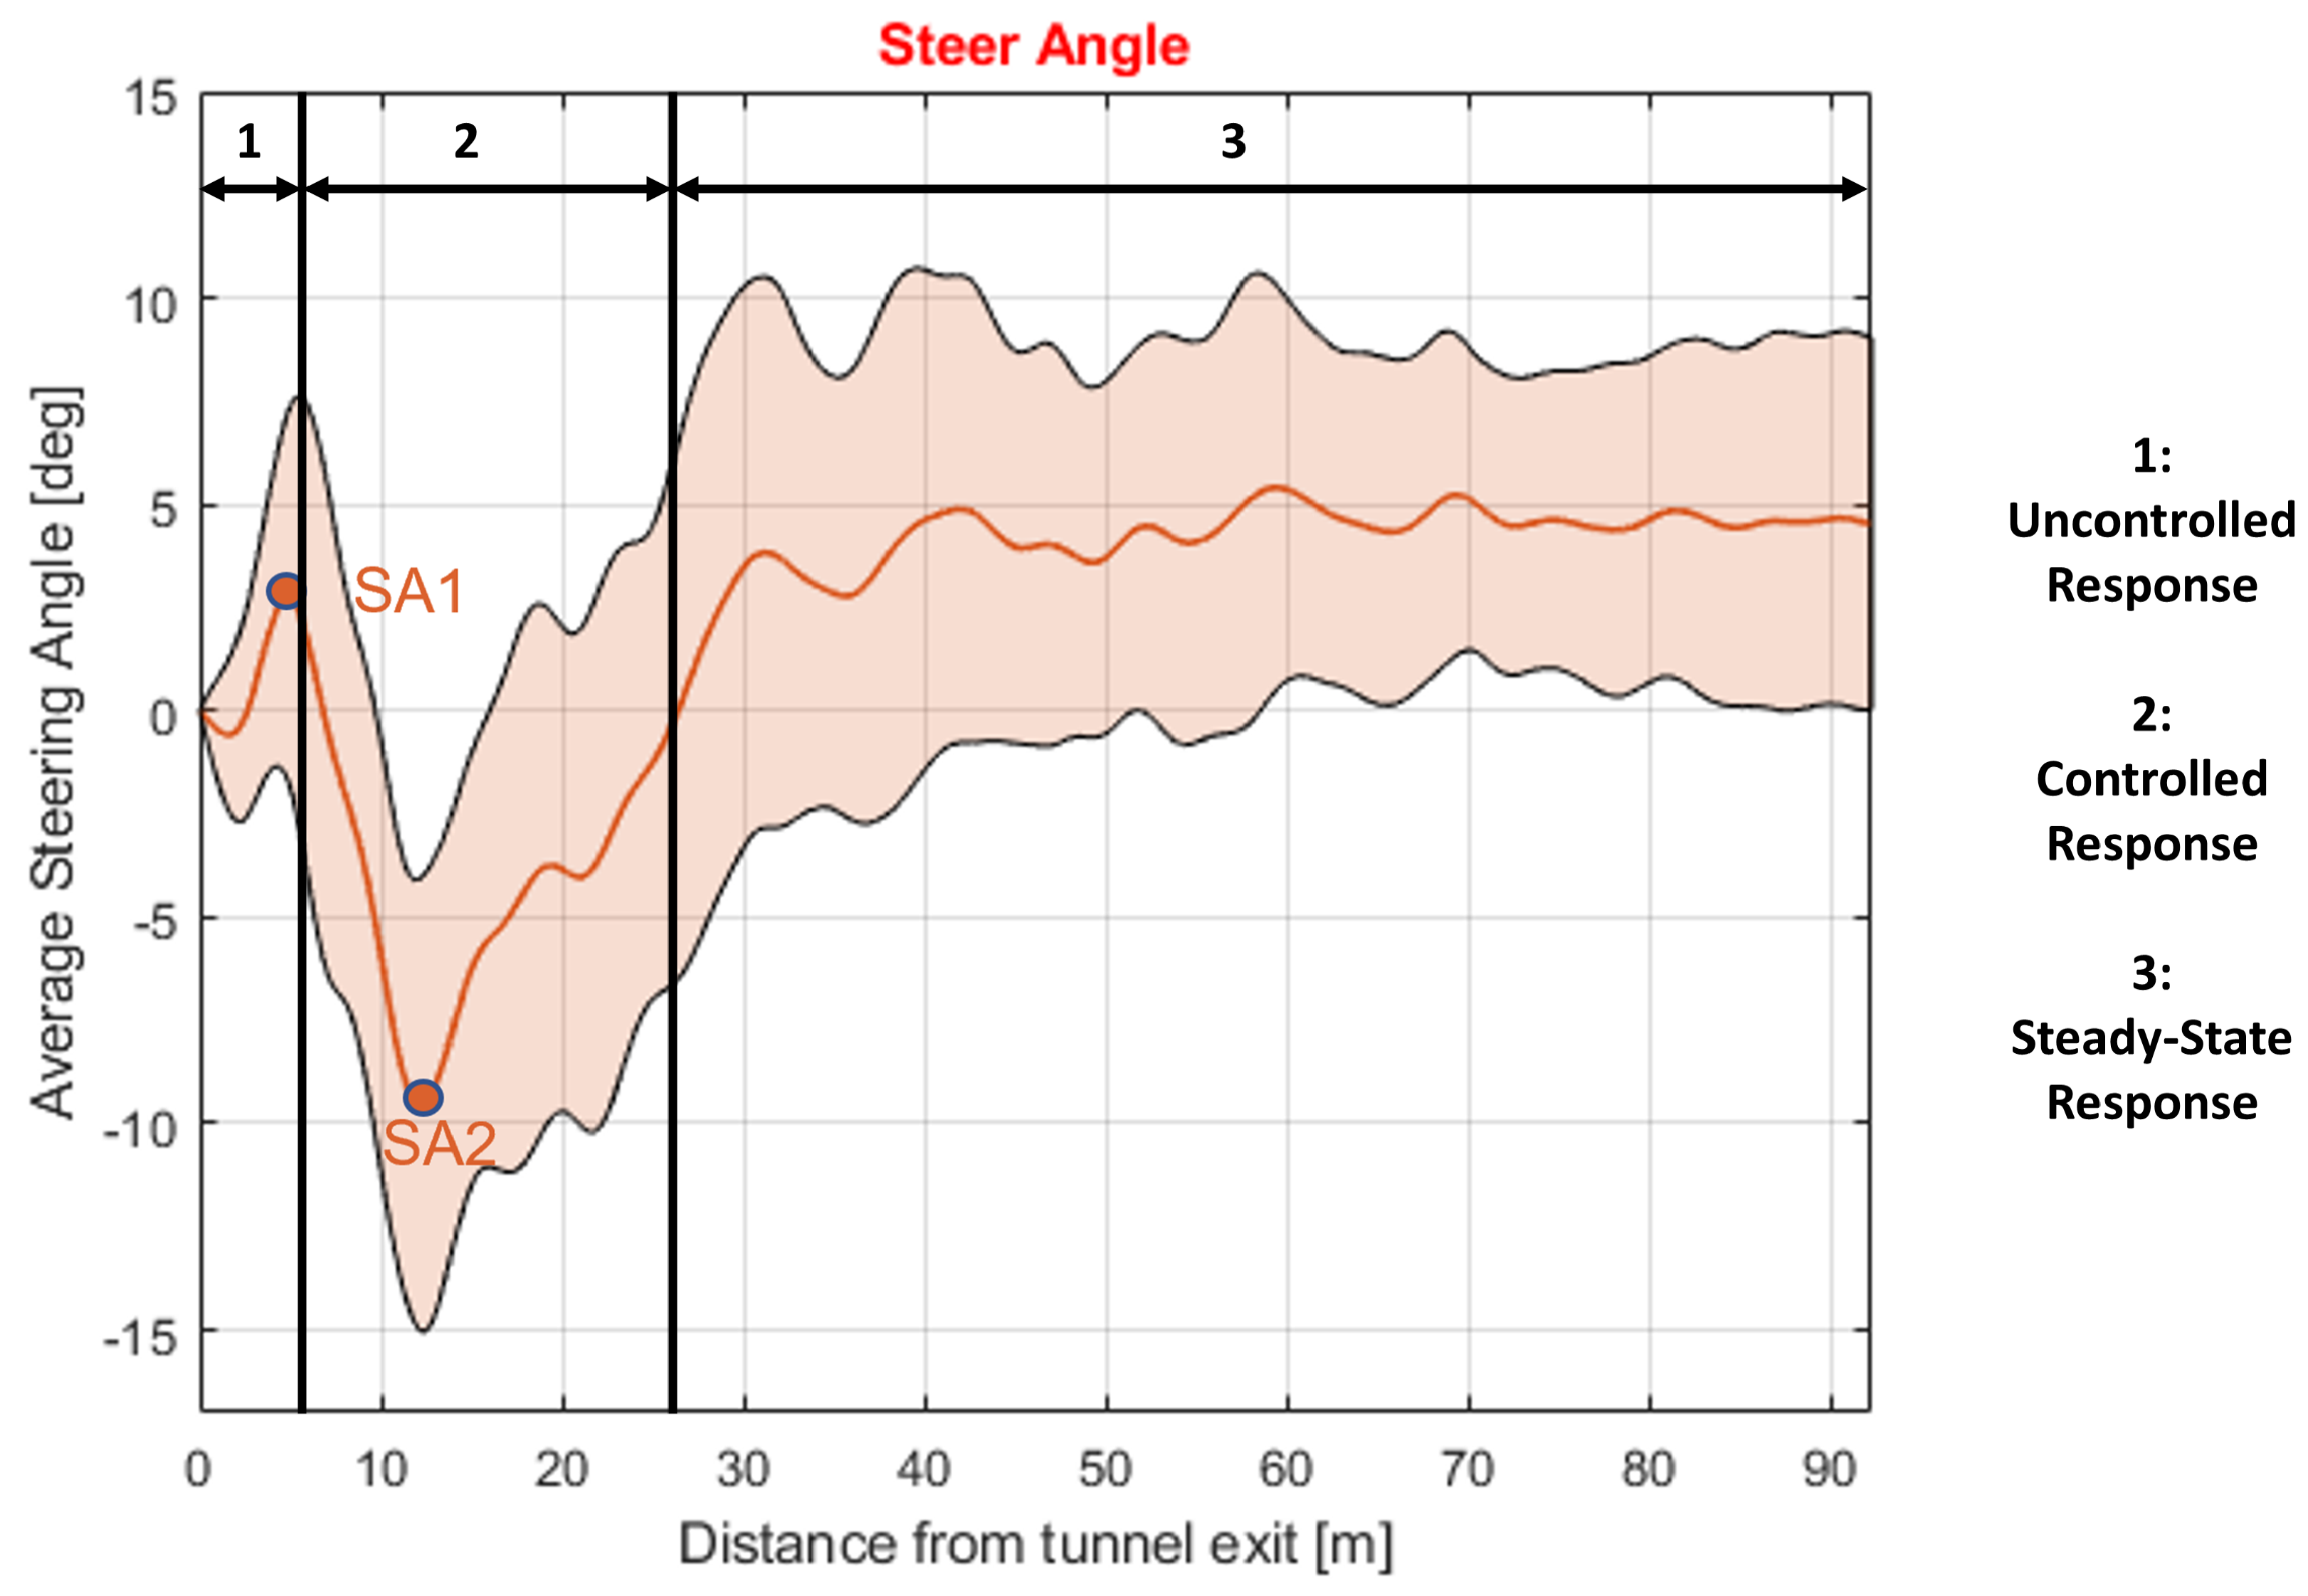
The general trends of the mean driver input and vehicle response signals under consideration have been presented in Figure 9, Figure 10 and Figure 11 for the Empty configuration vehicle running at 65 km/h with three different cross-wind speeds (namely 15 km/h, 20 km/h, 25 km/h). In particular, Figure 9 reports the steering angle and steering torque, while Figure 10 reports the yaw rate, lateral displacement and normalized load transfer. For sake of completeness, in Figure 11 the sideslip angle time histories of the vehicle were reported too since they can help the reader gain more insights on the lateral stability of the system. As can be seen, the higher the aerodynamic forces, the higher the sideslip angle. This makes the vehicle more difficult to handle, leading to an increase in lane deviation. Indeed, when the sideslip angle exceeds , ordinary drivers have small experience in handling the vehicle [29], thus leading to a higher risk of an accident. The mean (solid line) and the dispersion band (shaded area) obtained from the signals of the 28 drivers have been reported. The dispersion band has been obtained point by point, considering all the 28 time histories. This has been done to provide the reader information about the critical maxima and minima reached by the signals. Moreover, Figure 12 has been provided to offer a zoom of the steer angle signal for the Empty vehicle configuration traveling at 65 km/h with 20 m/s crosswind. In Figure 12, have been highlighted the main phases composing the driver response. These are analyzed in detail in the following.
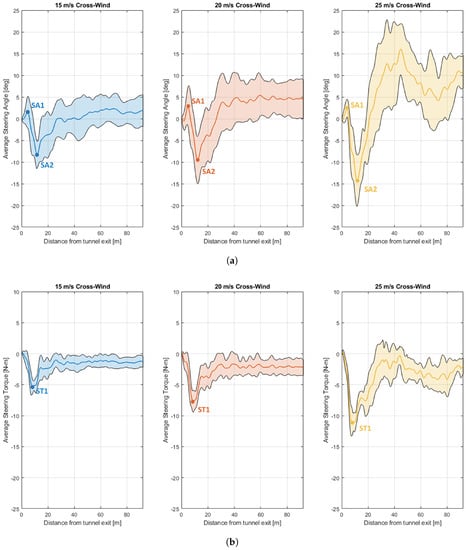
Figure 9.
Driver inputs—mean and standard deviation envelope—Empty vehicle at 65 km/h. (a) Steer Angle (Driver Input). (b) Steer Torque (Driver Input).
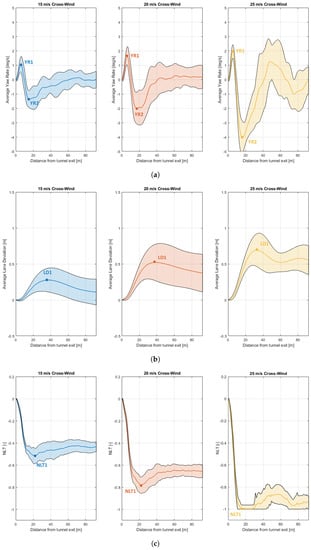
Figure 10.
Vehicle response—mean and standard deviation envelope—Empty vehicle at 65 km/h. (a) Yaw Rate (Vehicle Output). (b) Lateral Deviation from center lane (Vehicle Output). (c) Normalized Load Transfer (Vehicle Output).
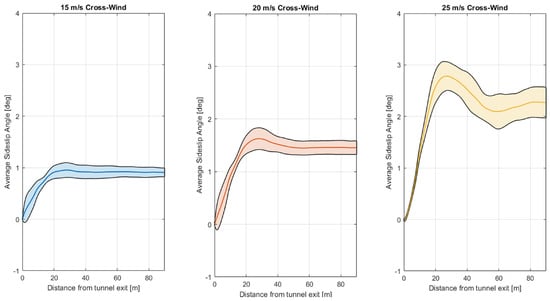
Figure 11.
Vehicle sideslip angle—mean and standard deviation envelope—Empty vehicle at 65 km/h.
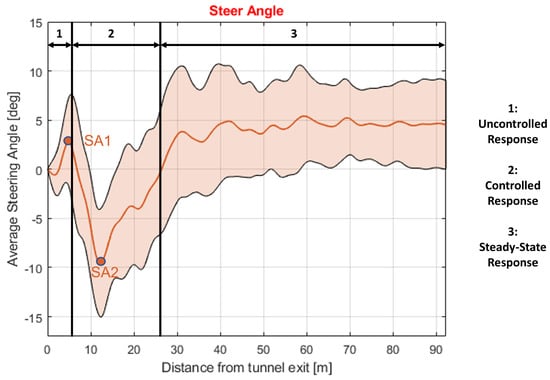
Figure 12.
Zoom of the steer angle response for the Empty vehicle at 65 km/h with 20 m/s crosswind.
From Figure 9a and Figure 10a, it is clear that the general response is dominated by two opposite peaks in the transient that fade away as soon as steady-state wind conditions are reached (i.e., as the vehicle moves further away from the tunnel). More in detail, we can say that, at first, we observe an uncontrolled response of the driver. This uncontrolled response is connected to the delay experienced by the driver in perceiving the phenomenon. This delay causes the driver to apply practically no steering torque at the wheel in the initial phase of the maneuver. The lack of control by the driver is clearly highlighted in the first small peak, where the steer angle and yaw rate begin to increase due to the wind action alone. Then, the driver applies a proper control action that can be associated with the second peak in the opposite direction (negative).
Once this transient is over, the driver reaches steady-state conditions, as the vehicle settles with values of yaw rate close to zero. Through the graphs, it is evident that with increasing the wind speed, the steering angle and steering torque responses increase in magnitude (higher aerodynamic loads to be compensated), as could be expected. The steering torque, on the other hand, does not show this reversal in sign. This is due to the fact that the driver, due to his initial delay of perception, is not applying any control action in the first uncontrolled phase (as can be seen in the graphs of Figure 9b where the steering torque in the initial part of the response is practically zero). So, the first peak in the steering angle is not due to the steering torque, but it is due to aerodynamic yaw moment only. Again, the increase in the magnitude of control action with increasing wind speed can be appreciated.
For what regards the other vehicle-related signals, it can be stated that the lateral deviation, sideslip angle and normalized load transfer show much slower dynamics (when compared to steering angle and yaw rate) and reach higher values with increasing wind speeds. For the Laden configuration, it is observed that the general trend of the response just described for the Empty vehicle is followed.
3.2. Rollover and Lane Invasion risk
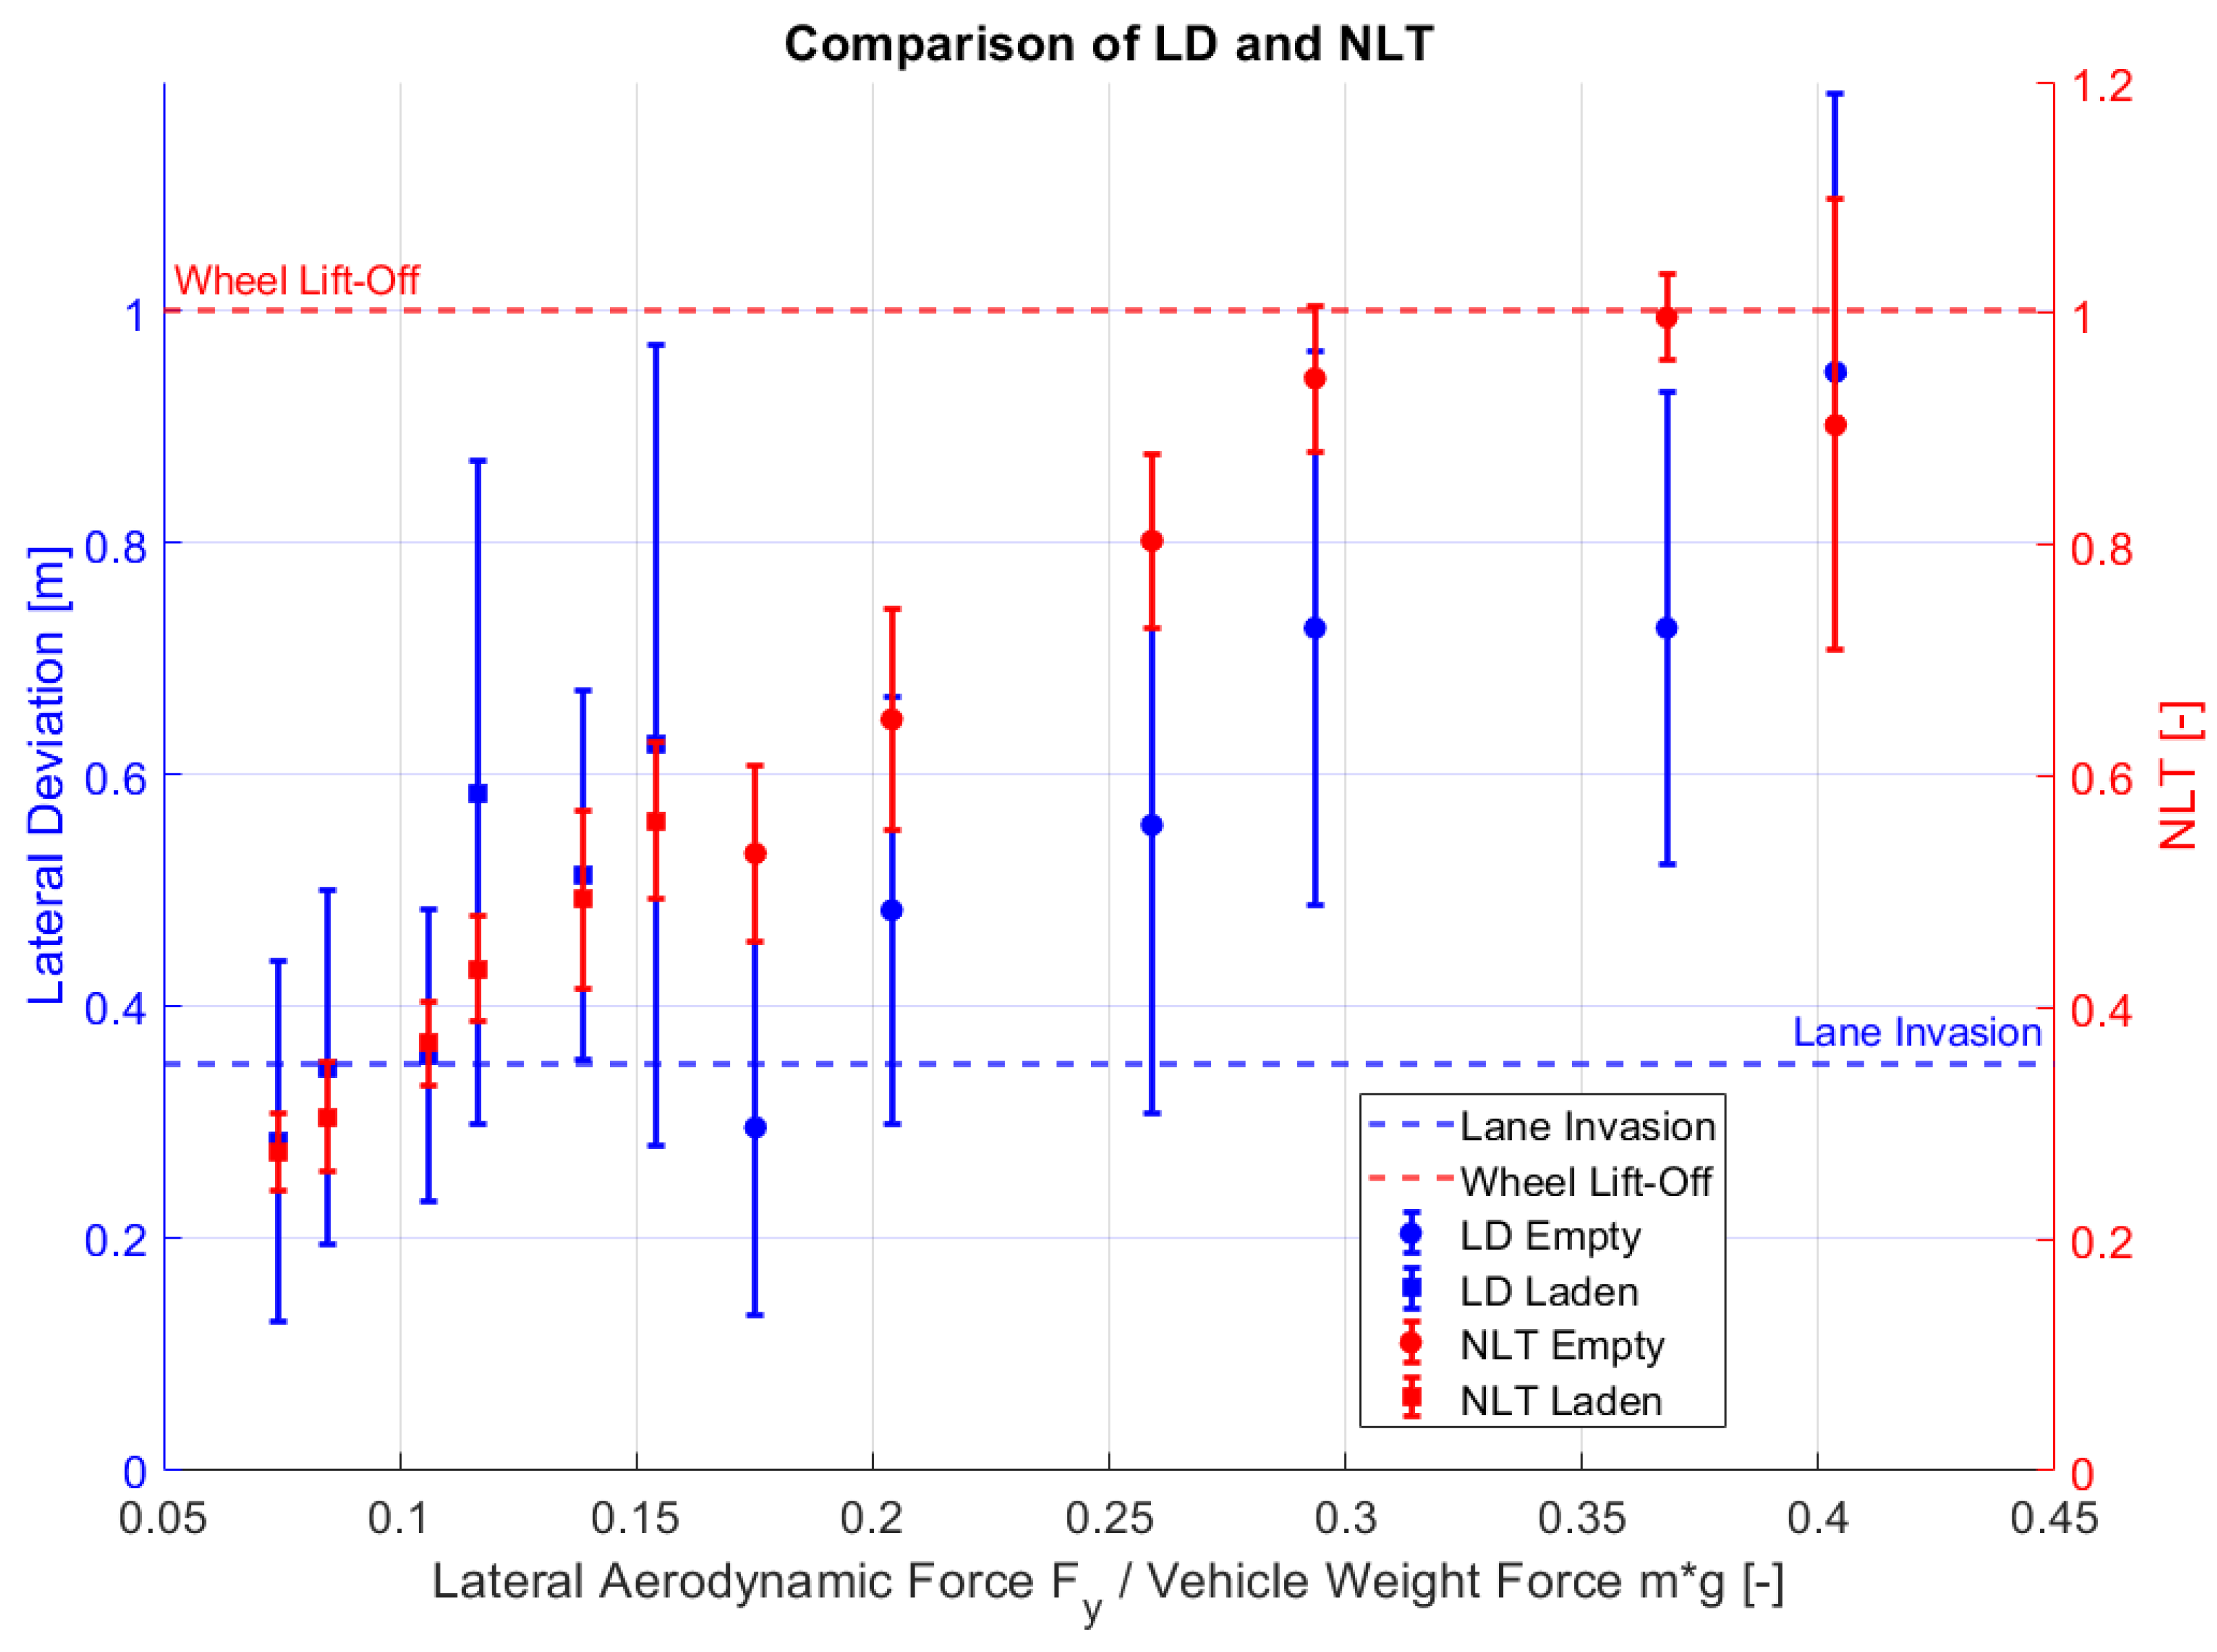
At first, an evaluation of rollover and lane invasion risk was carried out. Figure 13 shows the lane deviation and the normalized load transfer against the dimensionless aerodynamic lateral force for the Empty and Laden vehicle configuration. To obtain the dimensionless aerodynamic lateral force, the aerodynamic force has been divided by the vehicle weight force (appropriately considering the Empty or Laden mass). The mean value and one standard deviation are reported (this is the reason why in extreme cases the normalized load transfer exceeds the limit value of ). These indexes have been plotted as a function of the aerodynamic lateral force, to account for the different cases of vehicle and wind speed combinations. It must be noted that though the aerodynamic lateral force , yaw moment and roll moment are critical for the vehicle response, their values are highly correlated with each other (correlation coefficients above 0.98). Thus, the parameters’ variation has only been considered as a function of aerodynamic lateral force .
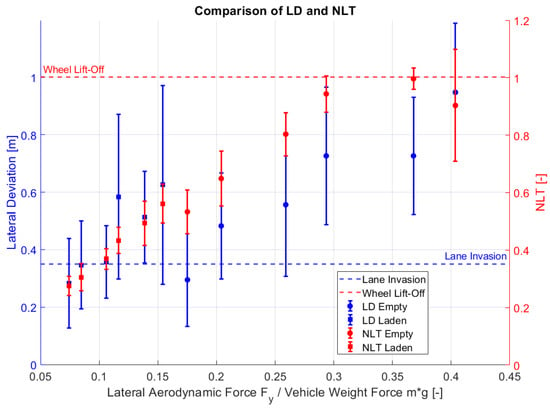
Figure 13.
Distribution of maximum lane deviation and NLT vs. dimensionless aerodynamic lateral force (divided by vehicle weight force).
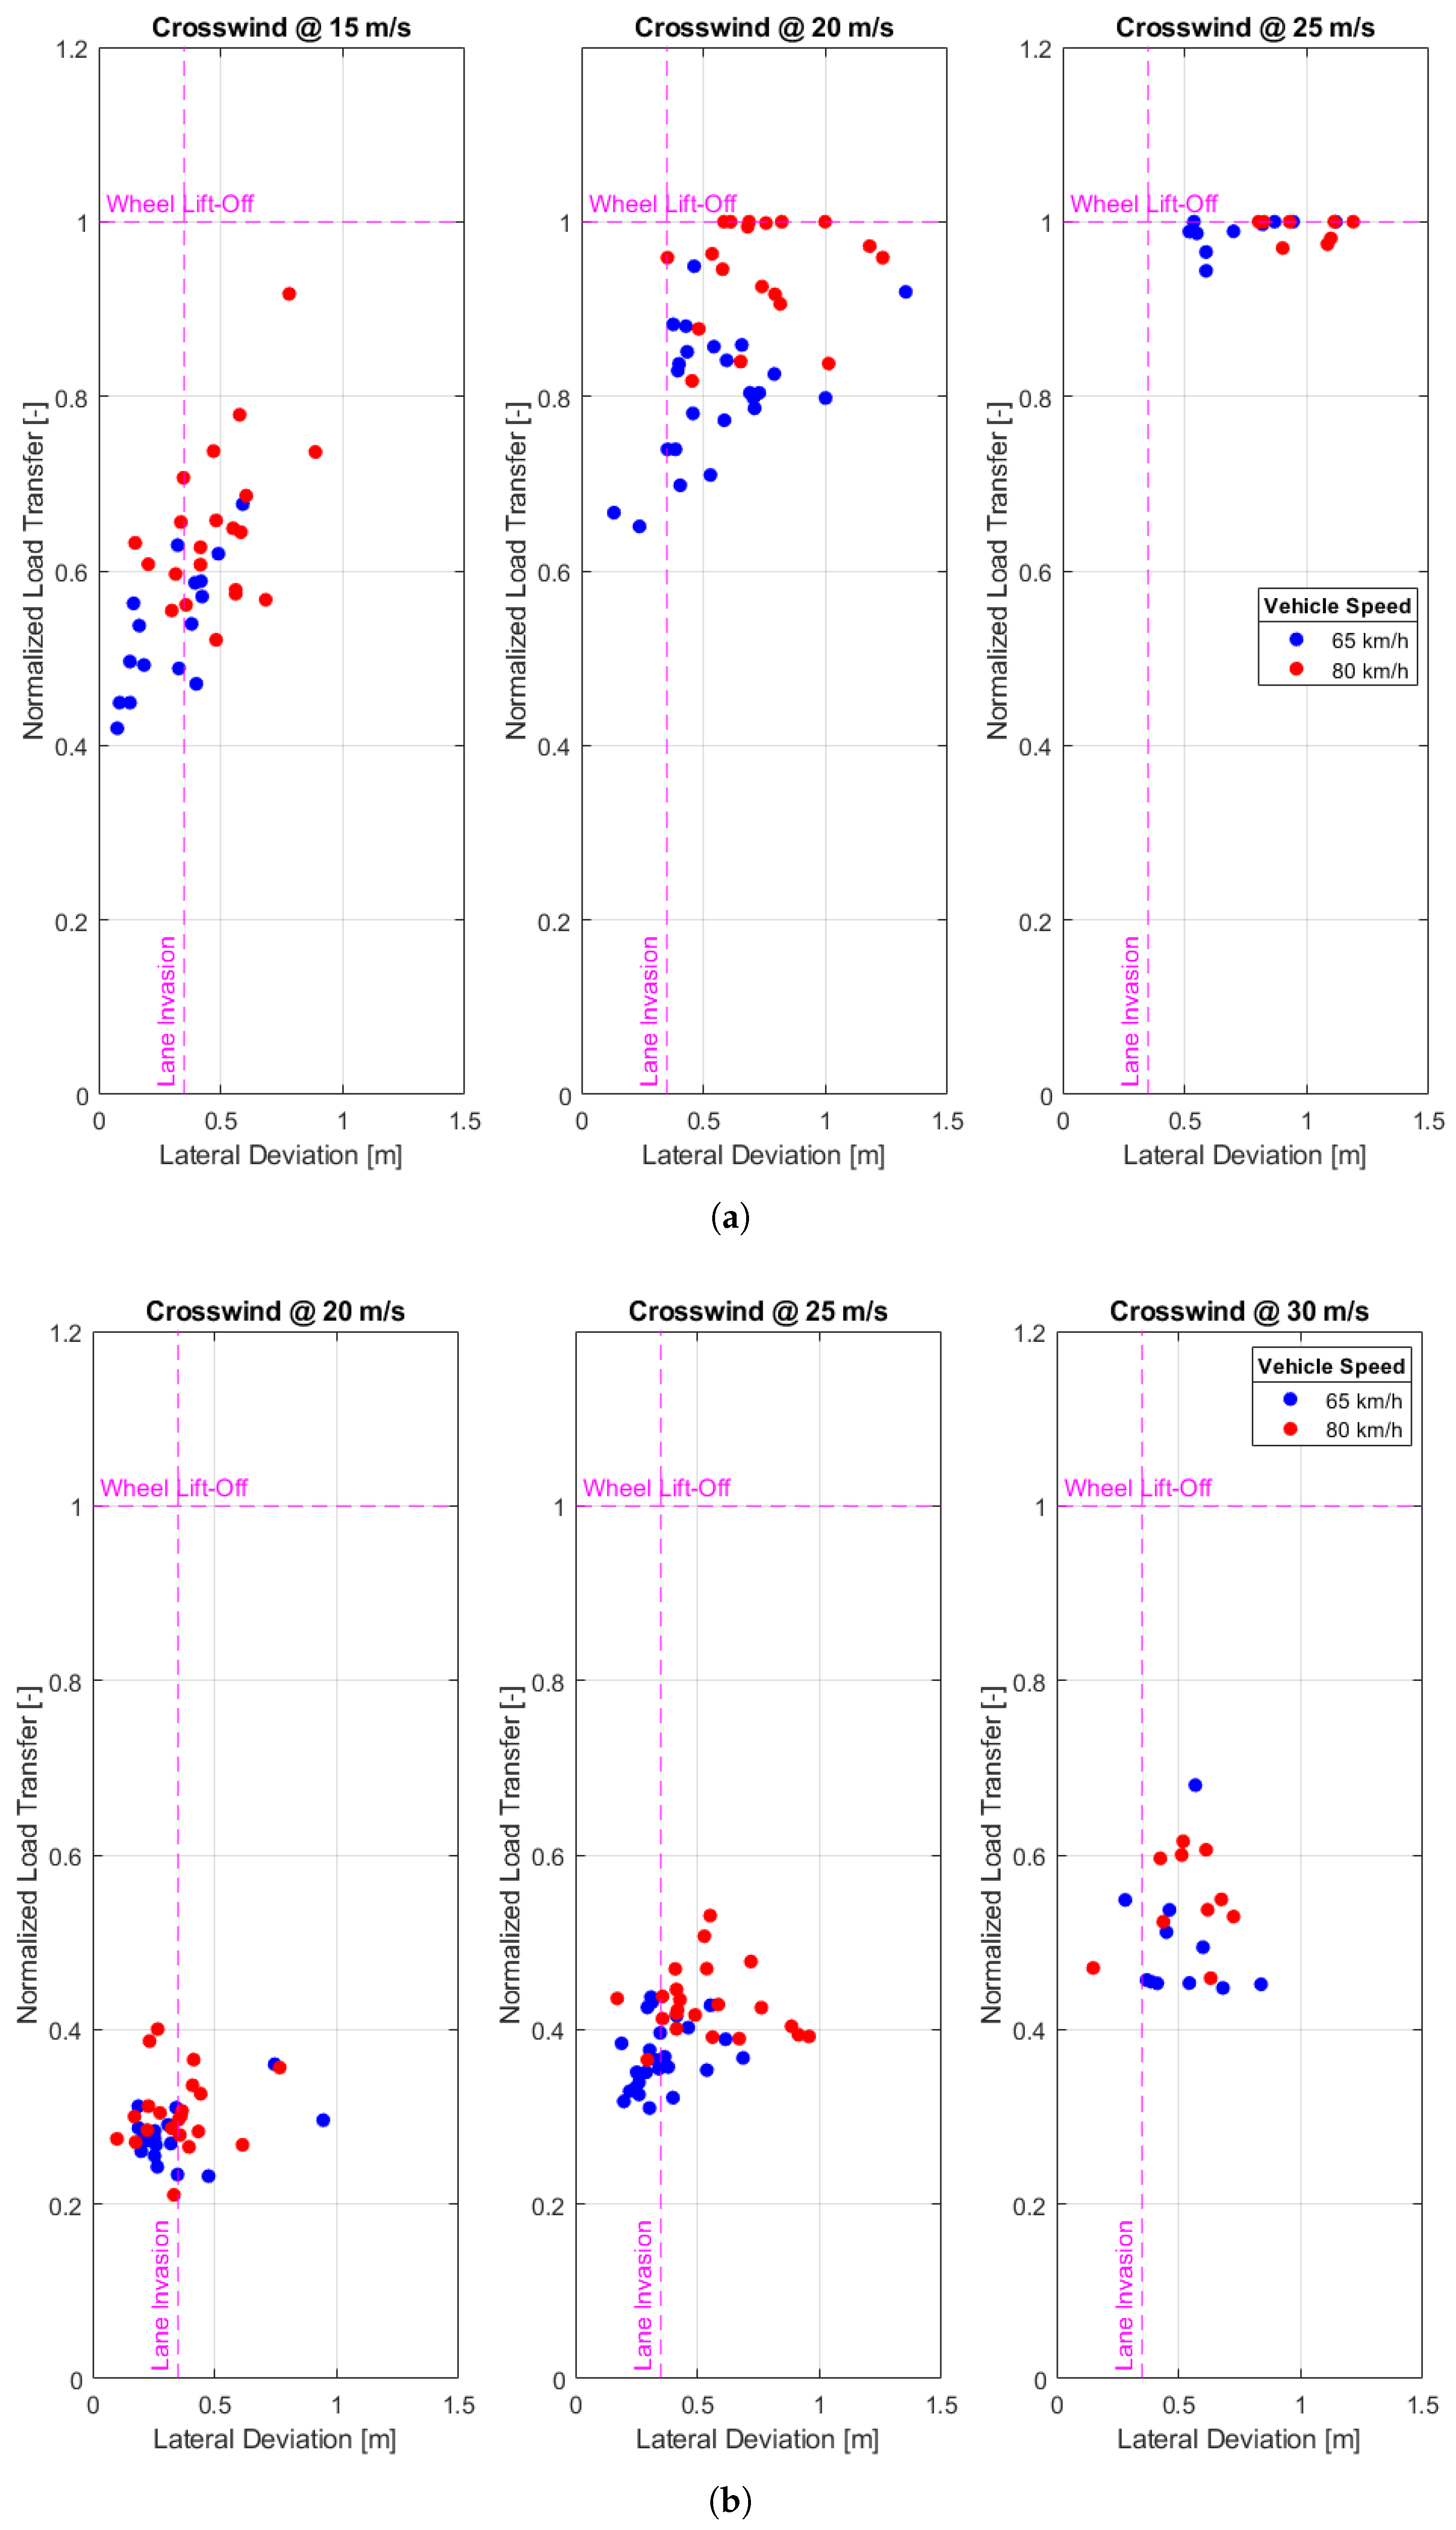
Generally speaking, with reference to both Figure 13 and Figure 14 that reports the plot of normalized load transfer against lane deviation for both the Empty and Laden vehicle configuration, it can be said that:
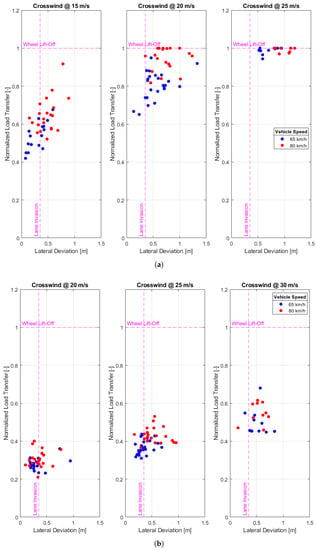
Figure 14.
Plot of normalized load transfer versus lane deviation for both Empty and Laden configuration. (a) Empty Case. (b) Laden Case.
- Lane invasion risk is most probable to happen if compared to the rollover risk;
- As expected, rollover risk is higher for the Empty vehicle configuration. In this case, the rollover and lane invasion risks have similar probabilities to happen;
- When , this means that the rear axle tires lift off the ground;
- As the aerodynamic load increases (so that the normalized load transfer approaches ), it becomes more difficult to control the vehicle. Therefore, a higher dispersion in the lane deviation error bar can be observed.
To gain a better insight into the driver’s behavior, further analyses were carried out to reconstruct the sequence of actions of the driver.
3.3. Timeline of Events
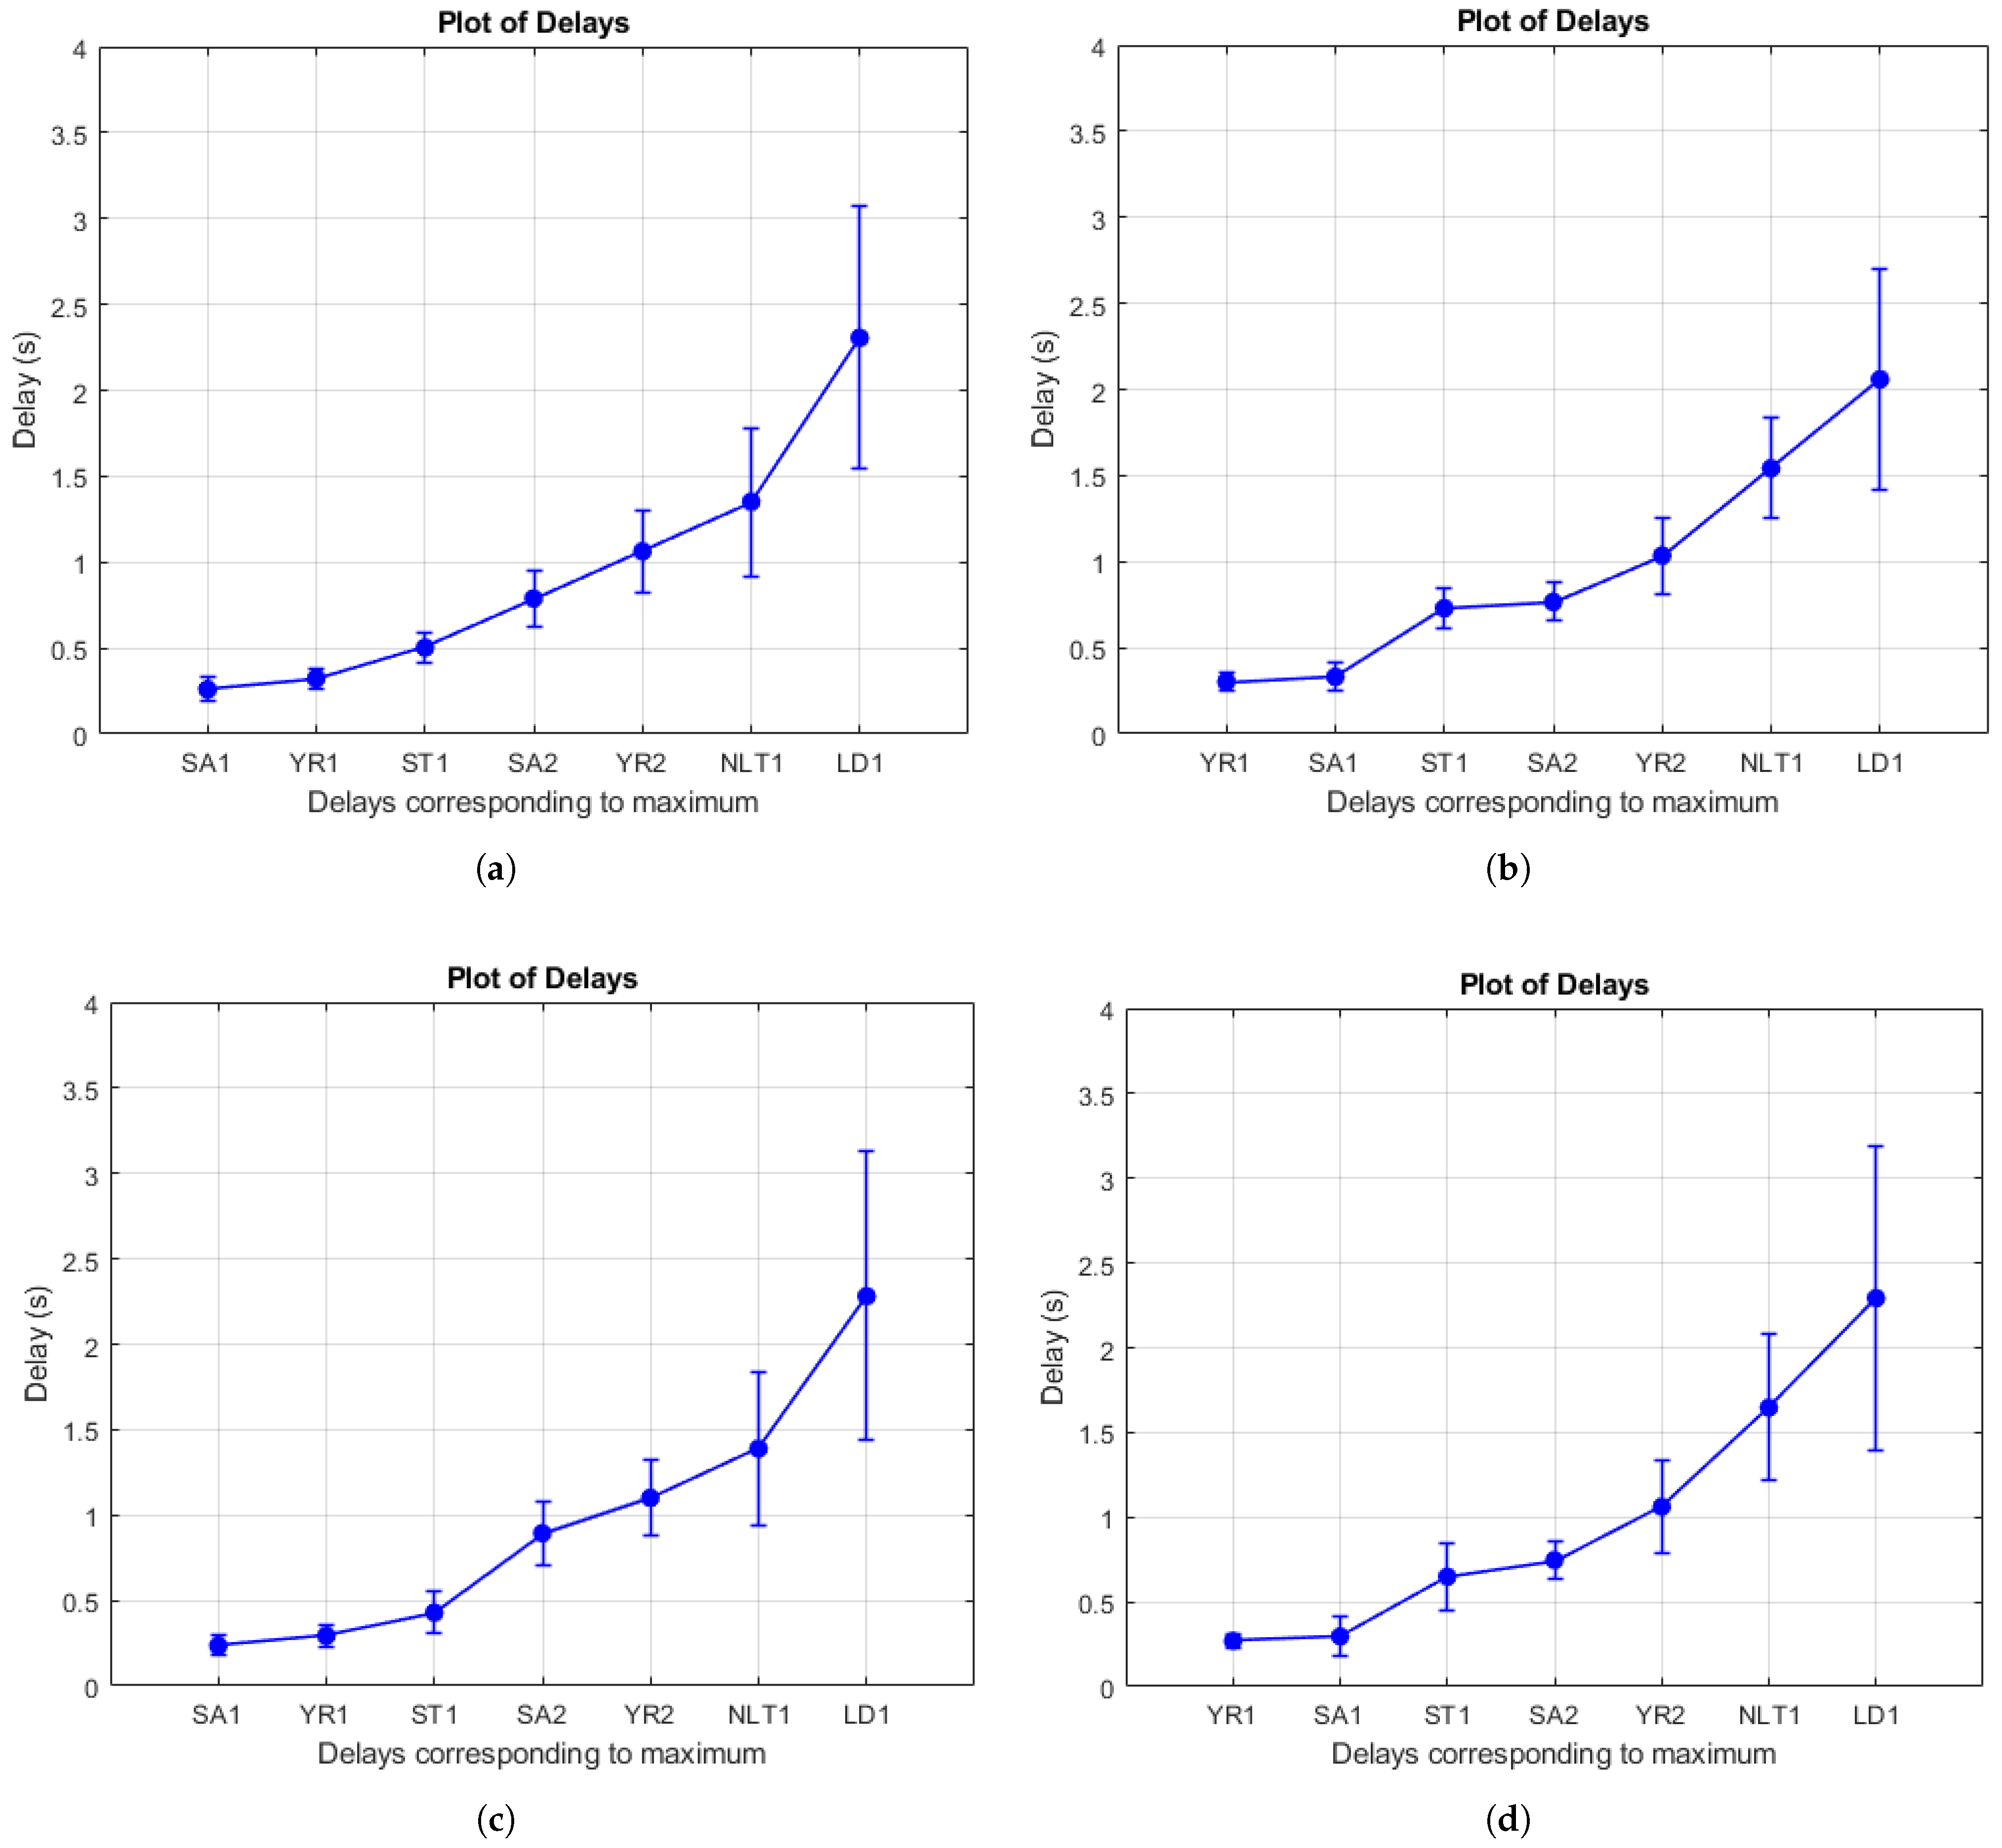
An attempt has also been made to understand the timeline of events at the tunnel exit, starting from the moment the driver experiences the cross-wind. The signals of steer angle, steer torque, yaw rate, lateral deviation and normalized load transfer have been considered. However, for this analysis, the relative time delays between the peaks of these signals have been analyzed. The timeline of events is reported in Figure 15.
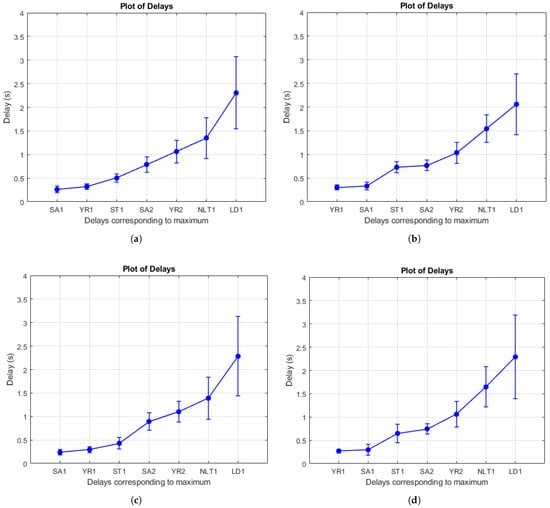
Figure 15.
Timeline at tunnel exit. (a) Empty case—vehicle speed 65 km/h. (b) Laden case—vehicle speed 65 km/h. (c) Empty case—vehicle speed 80 km/h. (d) Laden case—vehicle speed 80 km/h.
An explanation of the timeline of events obtained could be the following. The nomenclature used for the peaks makes reference to Figure 9 and Figure 10. After the wind gust at the exit of the tunnel, the truck begins to deviate from its path. This leads to an increase in yaw rate and steering angle (peaks “YR1” and “SA1” are thus obtained). In this period the driver does not apply any perceptible control action, so “SA1” and “YR1” refer to the uncontrolled response of the vehicle at the tunnel exit and to the lag of the driver’s action (i.e., when the driver starts applying a steering torque). Once the driver is conscious of the vehicle deviation, he/she applies the steering torque, which reaches the peak value “ST1” after ∼0.6–0.7 s after the wind gust. Following this, the steering angle peaks (“SA2”) in the opposite direction to the previous one (the response is now controlled by the driver), followed by the overall vehicle yaw rate (“YR2”). More precise values for the delays related to the “SA1”, “ST1”, and “SA2” peaks can be found in Table 7, together with the maximum steer torque (normalized by the aerodynamic yaw moment ) applied in the four different conditions tested. These peaks occur with a delay from the wind gust of ∼1–1.3 s.

Table 7.
Delays related to the “SA1”, “ST1” and “SA2” peaks and adimensional peak steer torque.
These delays (in particular “ST1” and “SA2”) are due to the action of the driver, as it is possible to see from Figure 9a,b. The driver’s action has to be summed up to the contribution of the vehicle dynamics that finally leads to the peaks “NLT1” and “LD1”. These two peaks are heavily influenced by the inertia (and payload level) of the lorry and by the intensity of the wind gust. In the cases analyzed, the roll motion happens first. The mean value of the normalized load transfer is related to the mean wind speed, while the oscillations are due to the driver’s action. At last, the maximum lateral deviation “LD1” (once again influenced by vehicle configuration and wind intensity) is reached.
The vehicle, due to the applied steering angle, rolls contributing to the normalized load transfer peak (“NLT1”) after ∼1.5 s, depending on the vehicle’s inertia. Finally, the lane deviation reaches its peak value “LD1”. The slower dynamics of the “NLT1” and “LD1” peaks are due to the delay in the driver’s response and to the substantially higher inertia associated with the roll and lateral displacement degrees of freedom. The vehicle finally settles in a steady state condition after ∼2.5 s from the tunnel exit. No evident differences are registered when changing vehicle configuration or vehicle speed, aside from the switch between the steering angle first “SA1” and yaw angle first peak “YR1”. This could be attributed to the higher yaw inertia in the Laden configuration combined with different steering characteristics connected to the higher payload present in this case.
Looking at the dispersion of the error bars it can be said that:
- There is a very low dispersion when considering the uncontrolled response (vehicle motion is influenced by the aerodynamic yaw moment only);
- There is a higher dispersion when considering the controlled response;
- The dispersion on the “SA2” peak is higher in the Empty vehicle case. This leads to increased dispersion for all the subsequent peaks in the Empty vehicle case;
- In general, the signals presenting the higher dispersion are the ones related to the vehicle response (in particular normalized load transfer and lateral deviation).
This higher dispersion in the normalized load transfer and lateral deviation signals stems from the fact that all the drivers are reacting more or less at the same time, but in a very different manner (with respect to one another) depending on their ability. Of course, this leads to very different vehicle responses (the driver’s action propagates in time). In particular, differences as little as 0.2 s in the “SA2” peak (considering each driver separately) may lead to big variations in the vehicle behavior and thus too dangerous conditions for the driver.
4. Conclusions
A methodology has been defined to study the driver response in case of crosswind at the tunnel exit. For this purpose, experimental tests at the Dynamic Driving Simulator of Politecnico di Milano were performed with the aid of 28 drivers. The data were processed to evaluate safety-related risks (rollover and lane deviation).
Thanks to the methodology proposed, it has been possible to assess the safety of the vehicle–driver system with regard to the lane invasion and rollover risks using real drivers. Moreover, the sequence of actions performed by the driver at the tunnel exit was analyzed and a distinction between uncontrolled, controlled and steady-state response was made. With the proposed methodology, similar studies regarding the interaction of crosswind, vehicle–driver system, and infrastructure elements could be easily performed with the advantage of eliminating issues related to the complexity and reliability of a human driver model.
The main findings are that generally, lane invasion is more prone to happen with respect to rollover. However, when considering the Empty vehicle case, both risks are comparable. Moreover, when the aerodynamic load increases, the load transfer causes one of the rear wheels to lift off the ground, leading to increased difficulty in governing the vehicle.
The driver’s actions following the wind gust at the tunnel exit were analyzed. It was found that:
- As found by Chen et al. [23], in all the examined scenarios no action is applied for s (uncontrolled phase happening for almost all the drivers related to the driver’s physiological reaction time). The peak associated with the driver’s input (steering torque) is reached after s for the Empty vehicle case and after s in the Laden vehicle case;
- As lane deviation is recognized by the driver, steering torque is applied. The ratio of the peak steering torque over aerodynamic yaw moment applied by the drivers varies between ;
- The control action of the drivers may be significantly different; this leads to a high dispersion in the vehicle response. Therefore the rollover or lane invasion risks are clearly affected by the driver’s skills;
- In general, lane invasion risk may occur for values of aerodynamic lateral force over vehicle weight Force as little as , while the rollover risks are more likely to occur for .
The results obtained for the Empty vehicle configuration running at 80 km/h with a crosswind speed of 15 m/s could be compared to the results found by Chen et al. [23], that used a similar vehicle typology and testing variables (slightly different vehicle mass, equal vehicle speed, and a crosswind speed of 16.66 m/s). In particular:
- as found by Chen et al. [23], the average delay of the “YR1” peak remains constant, even when changing crosswind intensity and vehicle velocity;
- Chen et al. [23] showed, with the aid of professional truck drivers, that with increasing crosswind there is an increasing trend in the magnitude of the “YR1” peak. The same result was obtained in this study, with the addition that even when changing the vehicle velocity, the magnitude of the “YR1” peak tends to increase (due to an increase in the relative wind velocity);
- Similar average peak delays (and qualitatively similar signal shapes) were obtained also for what regards the steering angle at wheel signal ( s for Chen et al. [23], against s in the present study).
- so, the average delays recorded for the “YR1” and “SA1” peaks seem to be related more to the specific promptness of the driver and to the scenario tested, than to the driver’s experience.
Overall, the performed analysis allowed us to identify the timeline of the driver’s actions and associated delays at a tunnel exit in presence of crosswind. Therefore, these results could be used for implementing a driver model able to react to crosswind in a tunnel exit condition. Such a model could be used as a tool for helping engineers to design both active and passive (like windbreak barriers) systems to enhance road and driver safety. This model could be refined by performing further analyses using the proposed methodology and extending the number of participants by including professional truck drivers and exploring a larger number of testing conditions (e.g., different loading conditions). Nonetheless, the methodology proposed seems perfectly capable of providing valuable information and insights into the driver-vehicle system response to crosswind in tunnel exit condition.
Author Contributions
Conceptualization, E.S., A.C., A.R.P. and M.V.; Methodology, E Sabbioni, A.C., A.R.P. and M.V.; Software, E.S. and F.C.; Validation, M.V., E.S., A.C. and A.R.P.; Formal Analysis, A.R.P.; Investigation, A.C. and A.R.P.; Resources, E.S. and F.C.; Data Curation, A.C. and A.R.P.; Writing—Original Draft Preparation, A.C., A.R.P. and M.V.; Writing—Review & Editing, E.S., A.C. and M.V.; Visualization, A.C. and A.R.P.; Supervision, E.S.; Project Administration, E.S. All authors have read and agreed to the published version of the manuscript.
Funding
This research received no external funding.
Informed Consent Statement
Informed consent was obtained from all subjects involved in the study.
Data Availability Statement
Data available on request. The data presented in this study are available on request from the corresponding author.
Acknowledgments
The authors want to thank Francesco Comolli and Alessandro Casella for the cooperation and support provided during the simulator tests.
Conflicts of Interest
The authors declare no conflict of interest.
References
- Coleman, S.; Baker, C. The reduction of accident risk for high-sided road vehicles in cross winds. J. Wind Eng. Ind. Aerodyn. 1992, 44, 2685–2695. [Google Scholar] [CrossRef]
- Baker, C.; Cheli, F.; Orellano, A.; Paradot, N.; Proppe, C.; Rocchi, D. Cross-wind effects on road and rail vehicles. Veh. Syst. Dyn. 2009, 47, 983–1022. [Google Scholar] [CrossRef]
- Cai, C.; Chen, S. Framework of vehicle–bridge–wind dynamic analysis. J. Wind Eng. Ind. Aerodyn. 2004, 92, 579–607. [Google Scholar] [CrossRef]
- Baker, C.; Reynolds, S. Wind-induced accidents of road vehicles. Accid. Anal. Prev. 1992, 24, 559–575. [Google Scholar] [CrossRef] [PubMed]
- Charuvisit, S.; Kimura, K.; Fujino, Y. Experimental and semi-analytical studies on the aerodynamic forces acting on a vehicle passing through the wake of a bridge tower in cross wind. J. Wind. Eng. Ind. Aerodyn. 2004, 92, 749–780. [Google Scholar] [CrossRef]
- Charuvisit, S.; Kimura, K.; Fujino, Y. Effects of wind barrier on a vehicle passing in the wake of a bridge tower in cross wind and its response. J. Wind. Eng. Ind. Aerodyn. 2004, 92, 609–639. [Google Scholar] [CrossRef]
- Rocchi, D.; Rosa, L.; Sabbioni, E.; Sbrosi, M.; Belloli, M. A numerical–experimental methodology for simulating the aerodynamic forces acting on a moving vehicle passing through the wake of a bridge tower under cross wind. J. Wind. Eng. Ind. Aerodyn. 2012, 104–106, 256–265. [Google Scholar] [CrossRef]
- Sabbioni, E.; Sbrosi, M.; Rocchi, D.; Galeotti, R. Dynamic Response of Vehicle-Driver Couple to the Aerodynamic Loads due to the Crossing of a Bridge Tower Wake. SAE Int. J. Commer. Veh. 2012, 5, 83–93. [Google Scholar] [CrossRef]
- Baker, C. A simplified analysis of various types of wind-induced road vehicle accidents. J. Wind Eng. Ind. Aerodyn. 1986, 22, 69–85. [Google Scholar] [CrossRef]
- Baker, C. Measures to control vehicle movement at exposed sites during windy periods. J. Wind Eng. Ind. Aerodyn. 1987, 25, 151–161. [Google Scholar] [CrossRef]
- Cheli, F.; Corradi, R.; Sabbioni, E.; Tomasini, G. Wind tunnel tests on heavy road vehicles: Cross wind induced loads — Part 1. J. Wind. Eng. Ind. Aerodyn. 2011, 99, 1000–1010. [Google Scholar] [CrossRef]
- Cheli, F.; Ripamonti, F.; Sabbioni, E.; Tomasini, G. Wind tunnel tests on heavy road vehicles: Cross wind induced loads — Part 2. J. Wind. Eng. Ind. Aerodyn. 2011, 99, 1011–1024. [Google Scholar] [CrossRef]
- Argentini, T.; Ozkan, E.; Rocchi, D.; Rosa, L.; Zasso, A. Cross-wind effects on a vehicle crossing the wake of a bridge pylon. J. Wind. Eng. Ind. Aerodyn. 2011, 99, 734–740. [Google Scholar] [CrossRef]
- Wang, B.; Xu, Y.L. Safety analysis of a road vehicle passing by a bridge tower under crosswinds. J. Wind Eng. Ind. Aerodyn. 2015, 137, 25–36. [Google Scholar] [CrossRef]
- Grm, A. Vehicle Aerodynamic Stability Analysis under High Crosswinds. Stroj. Vestn. J. Mech. Eng. 2017, 63, 191–200. [Google Scholar] [CrossRef]
- Salati, L.; Schito, P.; Rocchi, D.; Sabbioni, E. Aerodynamic Study on a Heavy Truck Passing by a Bridge Pylon under Crosswinds Using CFD. J. Bridge Eng. 2018, 23. [Google Scholar] [CrossRef]
- Brandt, A.; Sebben, S.; Jacobson, B.; Preihs, E.; Johansson, I. Quantitative High Speed Stability Assessment of a Sports Utility Vehicle and Classification of Wind Gust Profiles. In WCX SAE World Congress Experience; SAE Technical Paper 2020-01-0677; SAE International: Warrendale, PA, USA, 2020. [Google Scholar] [CrossRef]
- Brandt, A.; Jacobson, B.; Sebben, S. High speed driving stability of road vehicles under crosswinds: An aerodynamic and vehicle dynamic parametric sensitivity analysis. Veh. Syst. Dyn. 2022, 60, 2334–2357. [Google Scholar] [CrossRef]
- Rodriguez, J.; Codjoe, J.; Osman, O.; Ishak, S.; Wolshon, B. Experimental modeling of the effect of hurricane wind forces on driving behavior and vehicle performance. J. Emergency Manag. 2015, 13, 159–172. [Google Scholar] [CrossRef] [PubMed]
- Bocciolone, M.; Cheli, F.; Corradi, R.; Muggiasca, S.; Tomasini, G. Crosswind action on rail vehicles: Wind tunnel experimental analyses. J. Wind. Eng. Ind. Aerodyn. 2008, 96, 584–610. [Google Scholar] [CrossRef]
- Semeraro, F.F.; Cioffi, A.; Pellegrino, E.; Schito, P.; Vignati, M. Numerical Analysis of Wind-Break Fences for Truck Stability in Crosswind. Sae Int. J. Commer. Veh. 2022, 16, 2023. [Google Scholar] [CrossRef]
- Cioffi, A.; Semeraro, F.; Dellavedova, A.; Schito, P.; Vignati, M. A Numerical Methodology to Assess the Rollover Risk of a Generic Car- Caravan System in Different Driving Conditions. Int. J. Automot. Eng. 2022, 13, 103–113. [Google Scholar] [CrossRef] [PubMed]
- Chen, F.; Peng, H.; Ma, X.; Liang, J.; Hao, W.; Pan, X. Examining the safety of trucks under crosswind at bridge-tunnel section: A driving simulator study. Tunn. Undergr. Space Technol. 2019, 92, 103034. [Google Scholar] [CrossRef]
- Prakash, A.R. Evaluation of Heavy-Vehicle Driver Response to Cross-Wind Using a Dynamic Driving Simulator. Master’s Thesis, Politecnico di Milano, Milan, Italy, 2022. [Google Scholar]
- Prakash, A.R.; Cioffi, A.; Sabbioni, E.; Vignati, M.; Schito, P. An analysis of truck-driver system response to crosswind in tunnel exit conditions. In Proceedings of the XVII International Conference of the Italian Association for Wind Engineering IN-VENTO 2022, Milan, Italy, 4–7 September 2022; Zasso, A., Ed.; Springer: Berlin/Heidelberg, Germany, 2022; pp. 22–25, Not yet published. [Google Scholar]
- Pacejka, H. Tire and Vehicle Dynamics; Butterworth-Heinemann: Oxford, UK, 2012. [Google Scholar]
- Walczak, S. Analysis of vehicle dynamics under sadden cross wind. IOP Conf. Ser. Mater. Sci. Eng. 2016, 148, 012030. [Google Scholar] [CrossRef]
- Quattromani, G.; Rocchi, D.; Sabbioni, E.; Salati, L.; Schito, P. A force-distribution approach to simulate the aerodynamic loads acting on a vehicle passing by a bridge tower: Comparison with CFD simulations. In Dynamics of Vehicles on Roads and Tracks Vol 1: Proceedings of the 25th International Symposium on Dynamics of Vehicles on Roads and Tracks (IAVSD 2017), 1st ed.; Spiryagin, M., Gordon, T., Cole, C., McSweeney, T., Eds.; CRC Press: Rockhampton, QLD, Australia, 2017; Chapter 4. [Google Scholar]
- van Zanten, A.T. Bosch ESP Systems: 5 Years of Experience. SAE Trans. 2000, 109, 428–436. [Google Scholar]
Disclaimer/Publisher’s Note: The statements, opinions and data contained in all publications are solely those of the individual author(s) and contributor(s) and not of MDPI and/or the editor(s). MDPI and/or the editor(s) disclaim responsibility for any injury to people or property resulting from any ideas, methods, instructions or products referred to in the content. |
© 2023 by the authors. Licensee MDPI, Basel, Switzerland. This article is an open access article distributed under the terms and conditions of the Creative Commons Attribution (CC BY) license (https://creativecommons.org/licenses/by/4.0/).

