

Using Video Analytics to Improve Traffic Intersection Safety and Performance


 and
and 
Abstract
1. Introduction
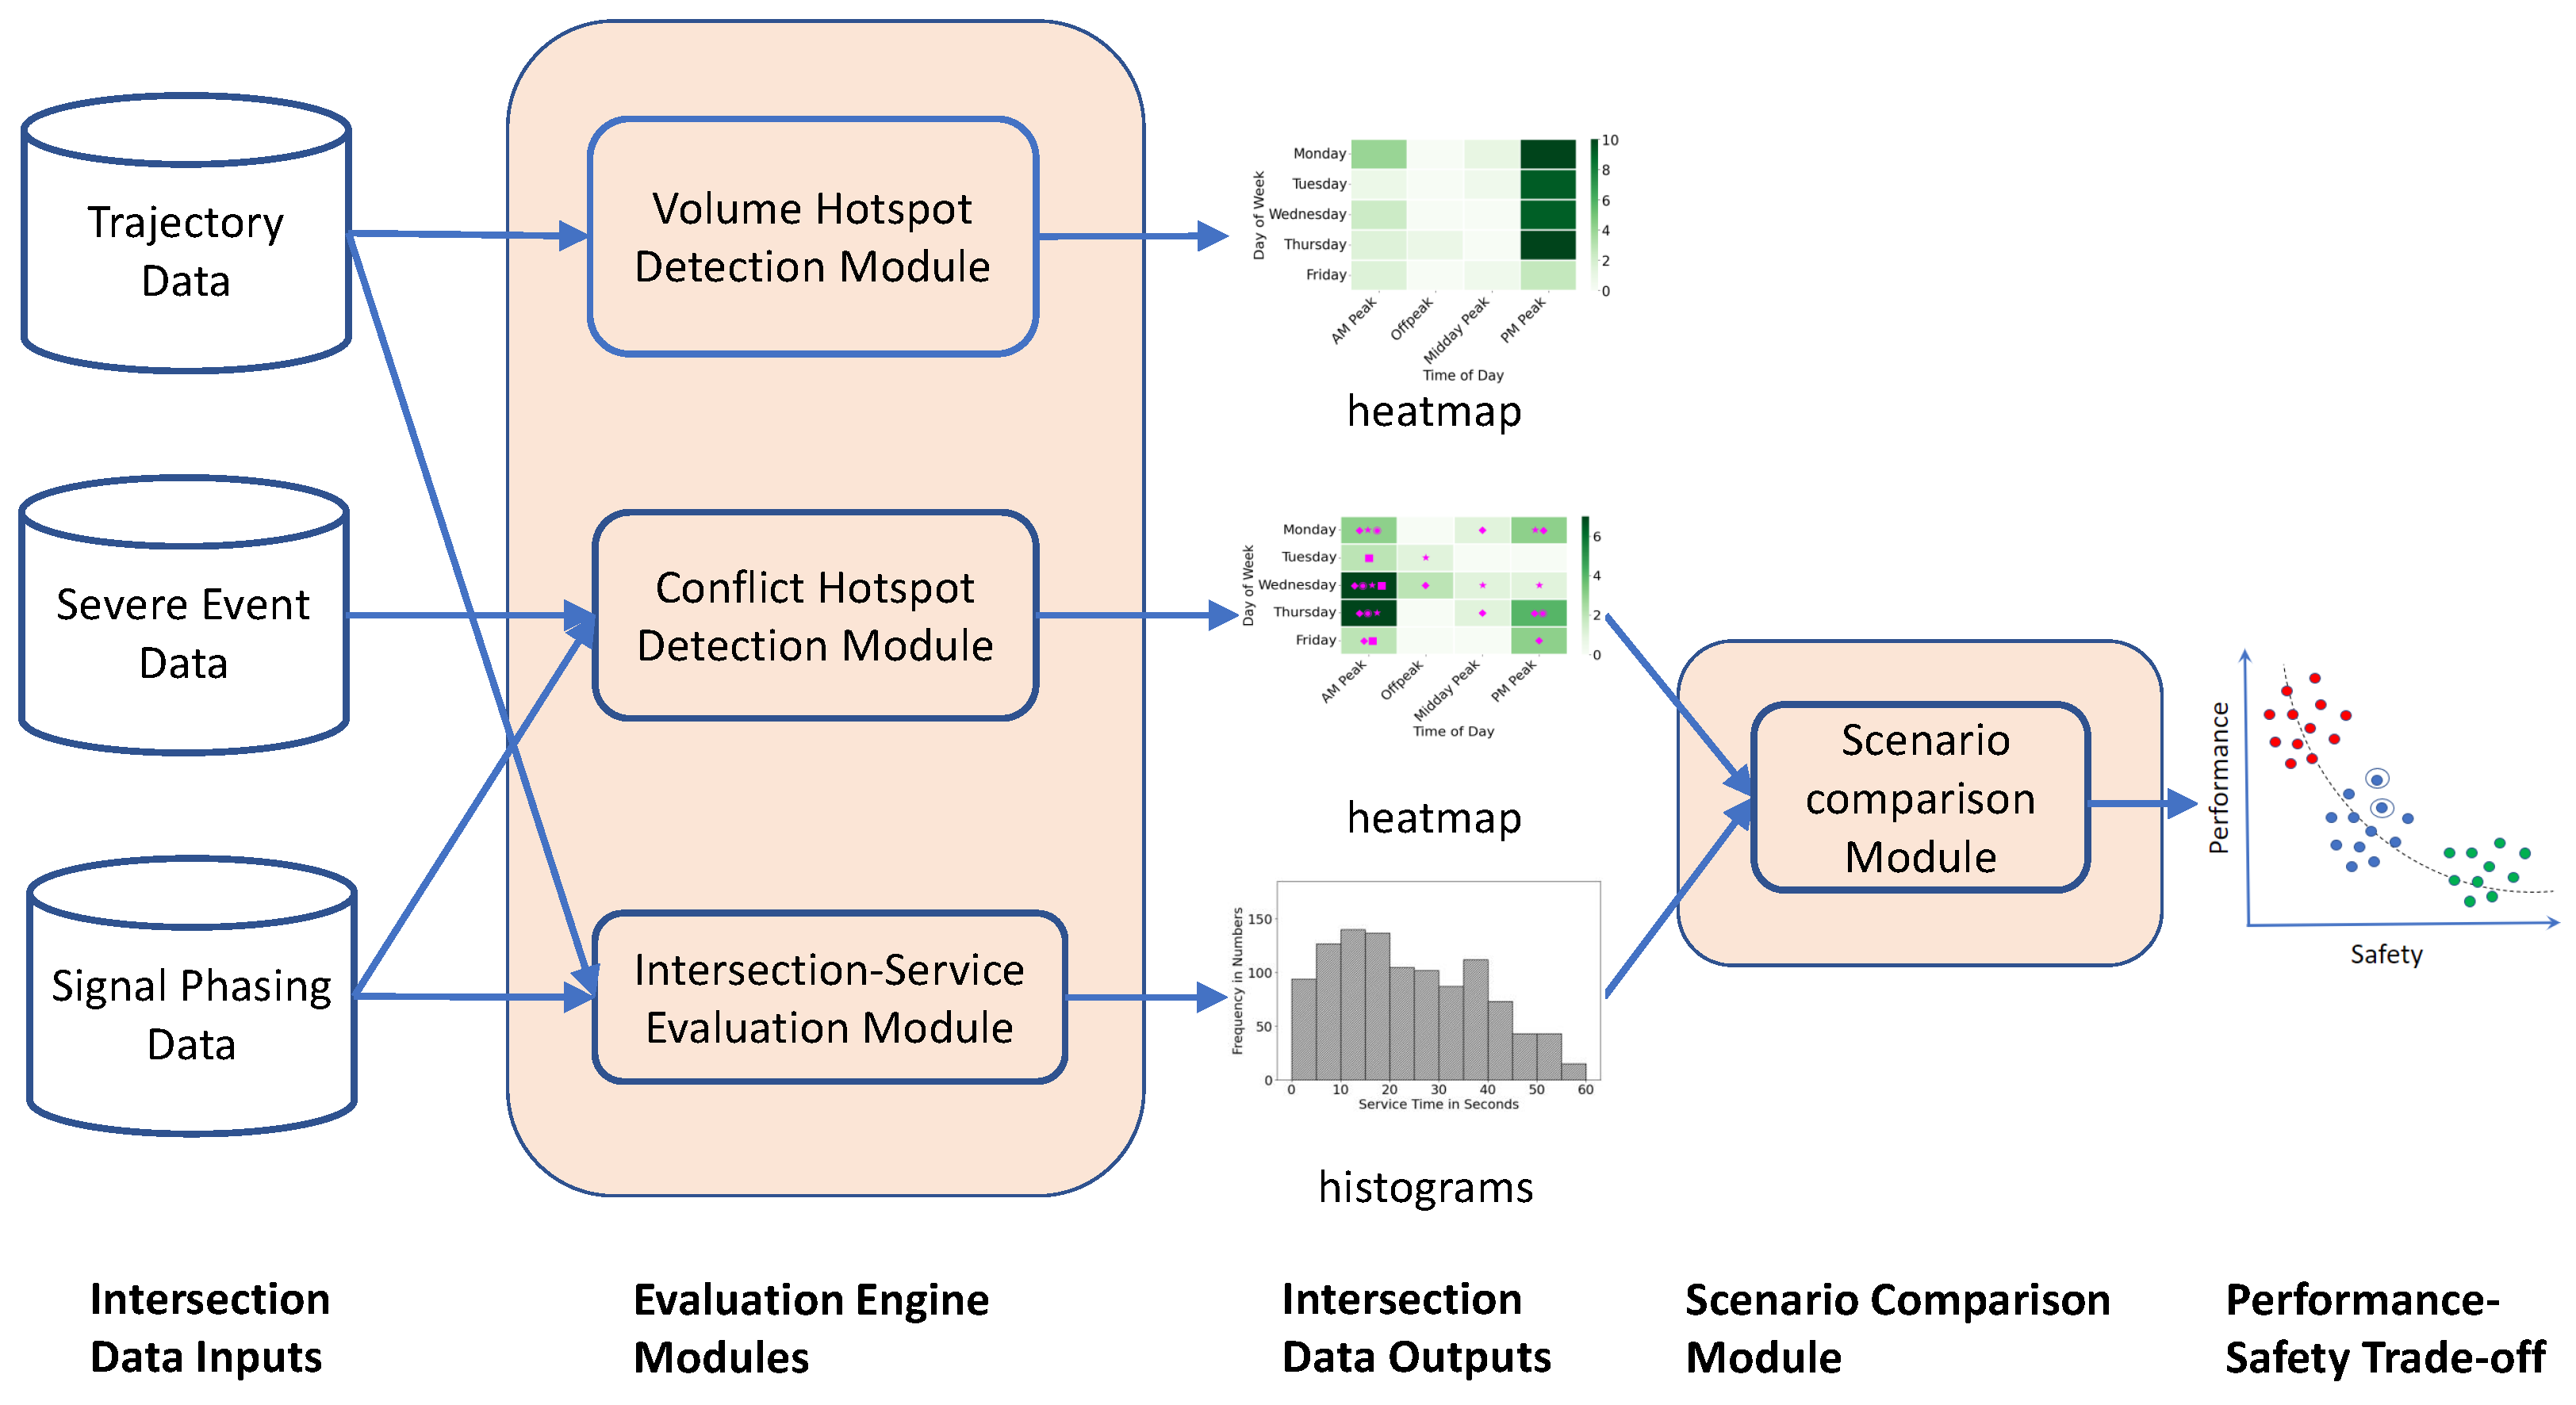
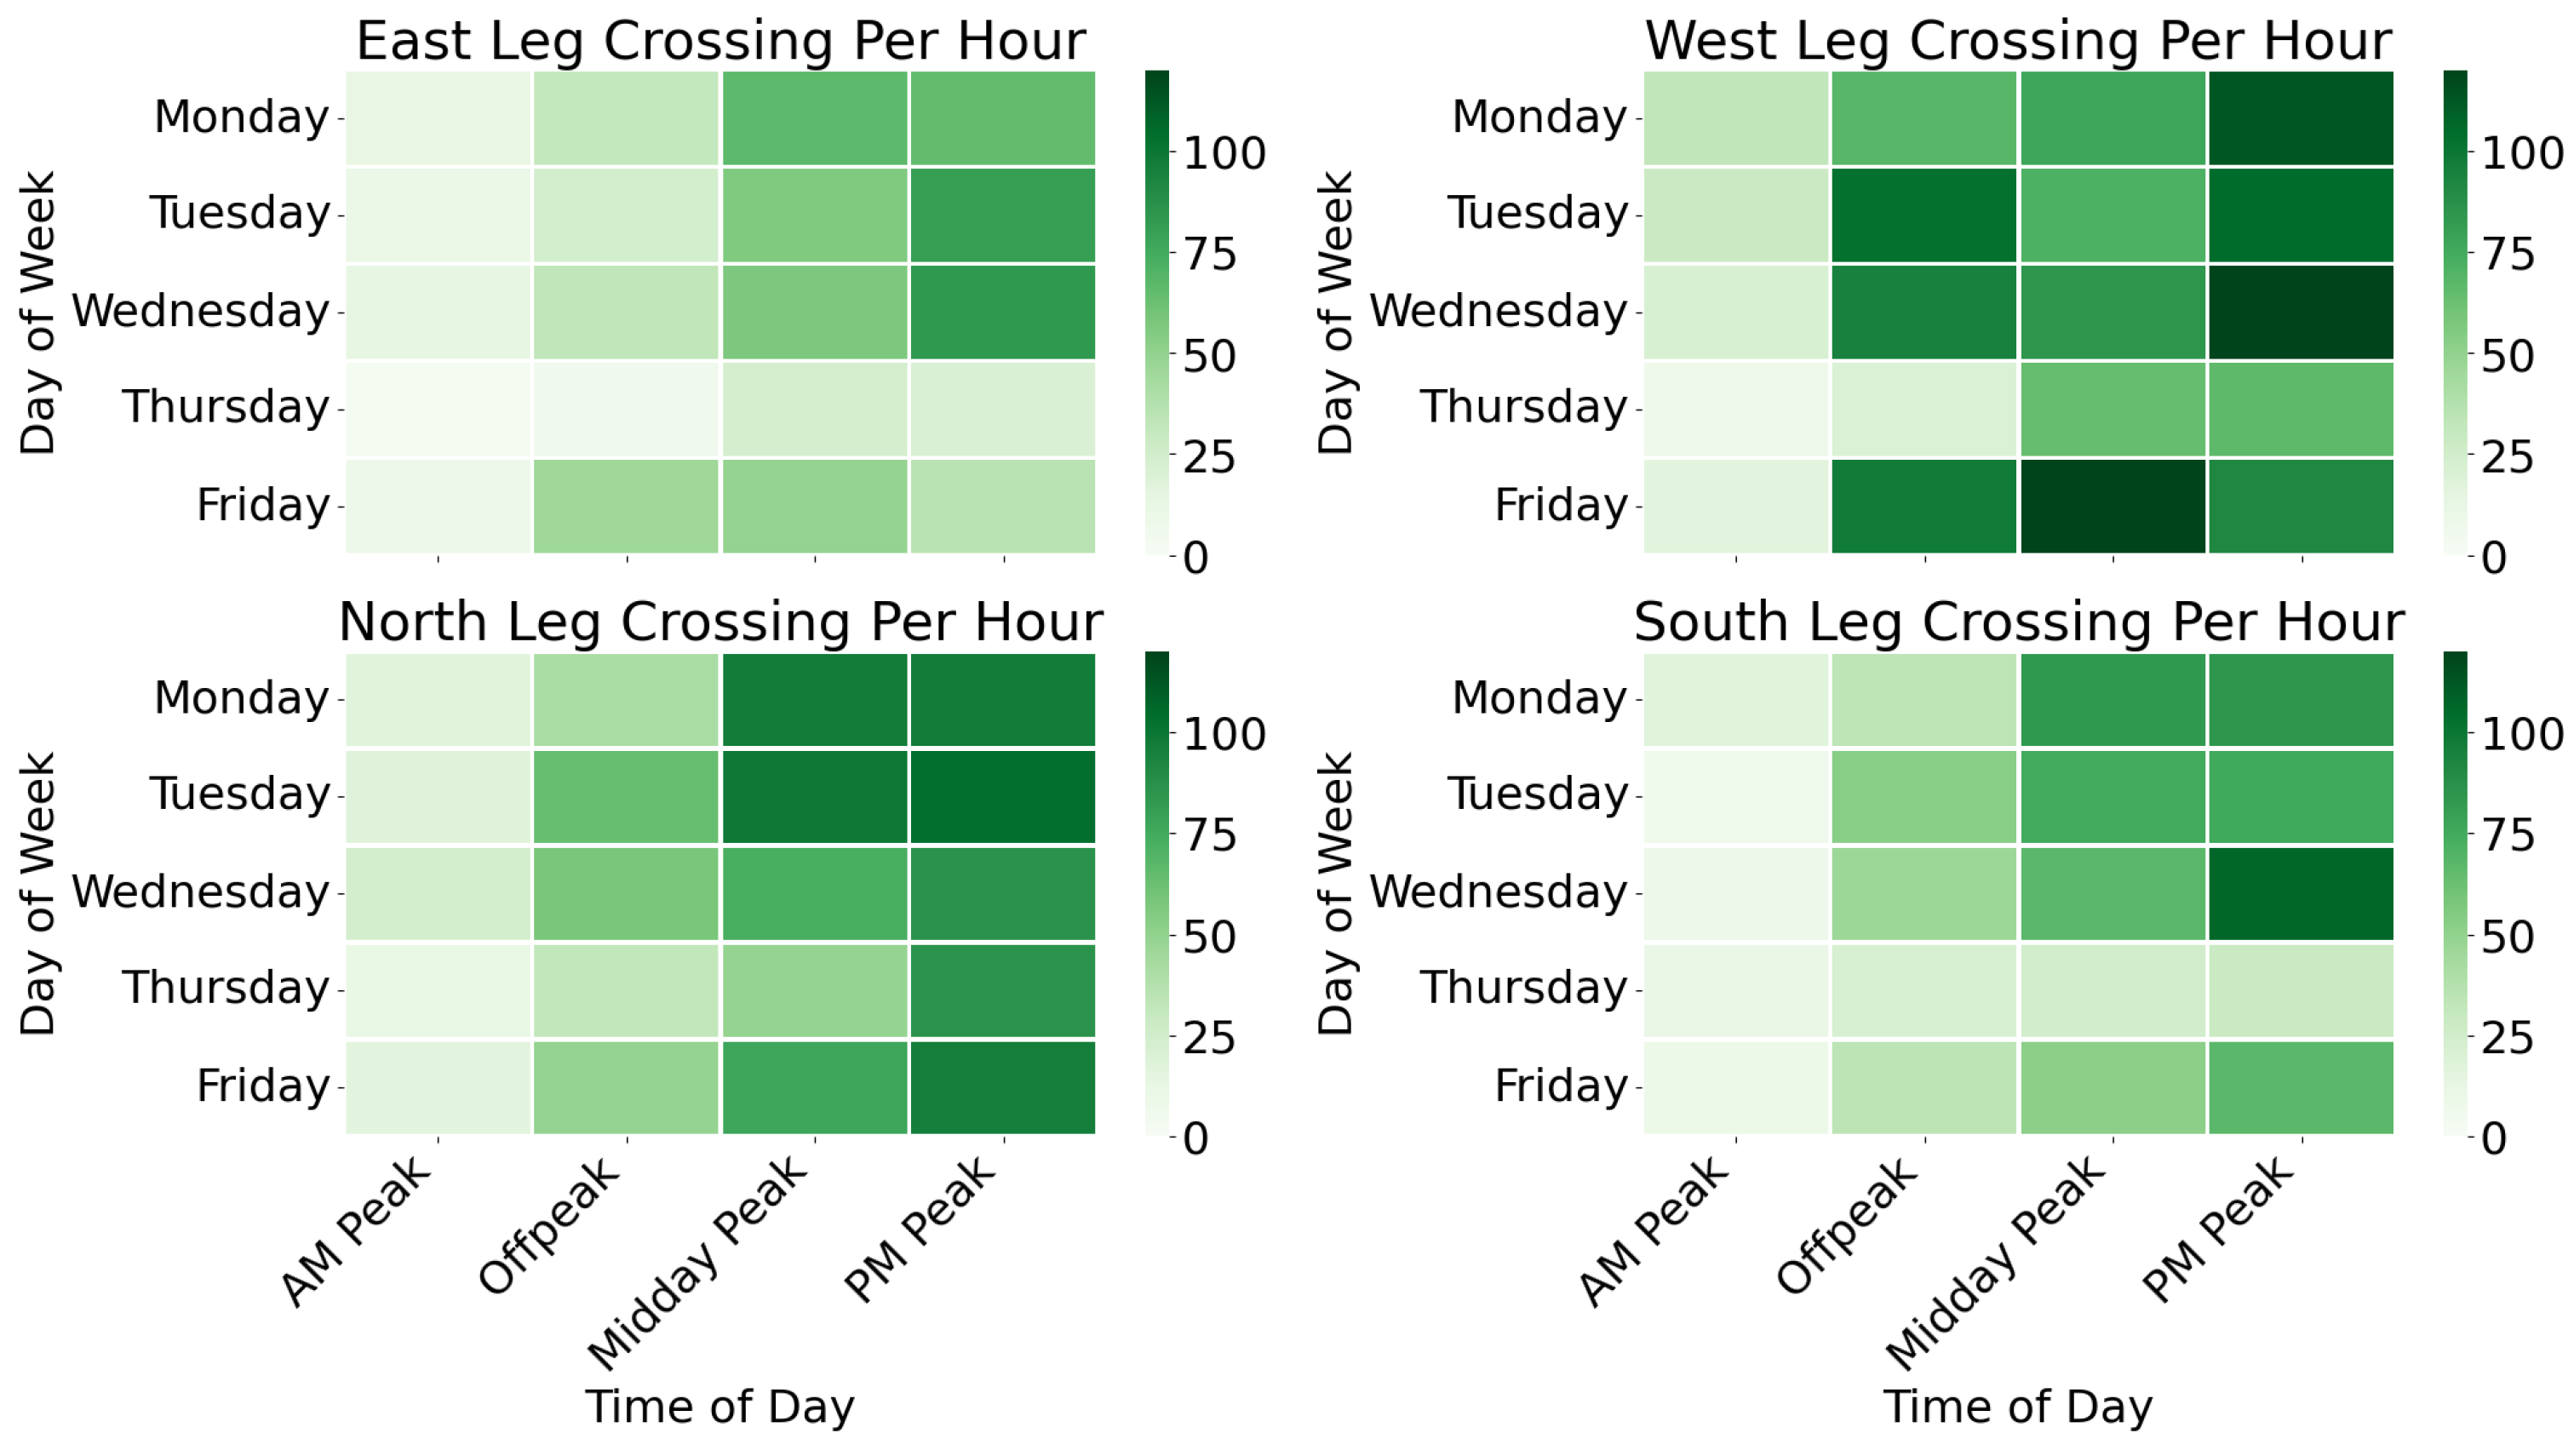
- The volume hotspot detection module computes the peaks and troughs in pedestrian and vehicle volume. It is useful to understand where the volume peaks and spikes are and if there are valleys and troughs in the volume. This information helps a traffic engineer implement signal timing changes to address safety issues only during the peak period instead of throughout the day.
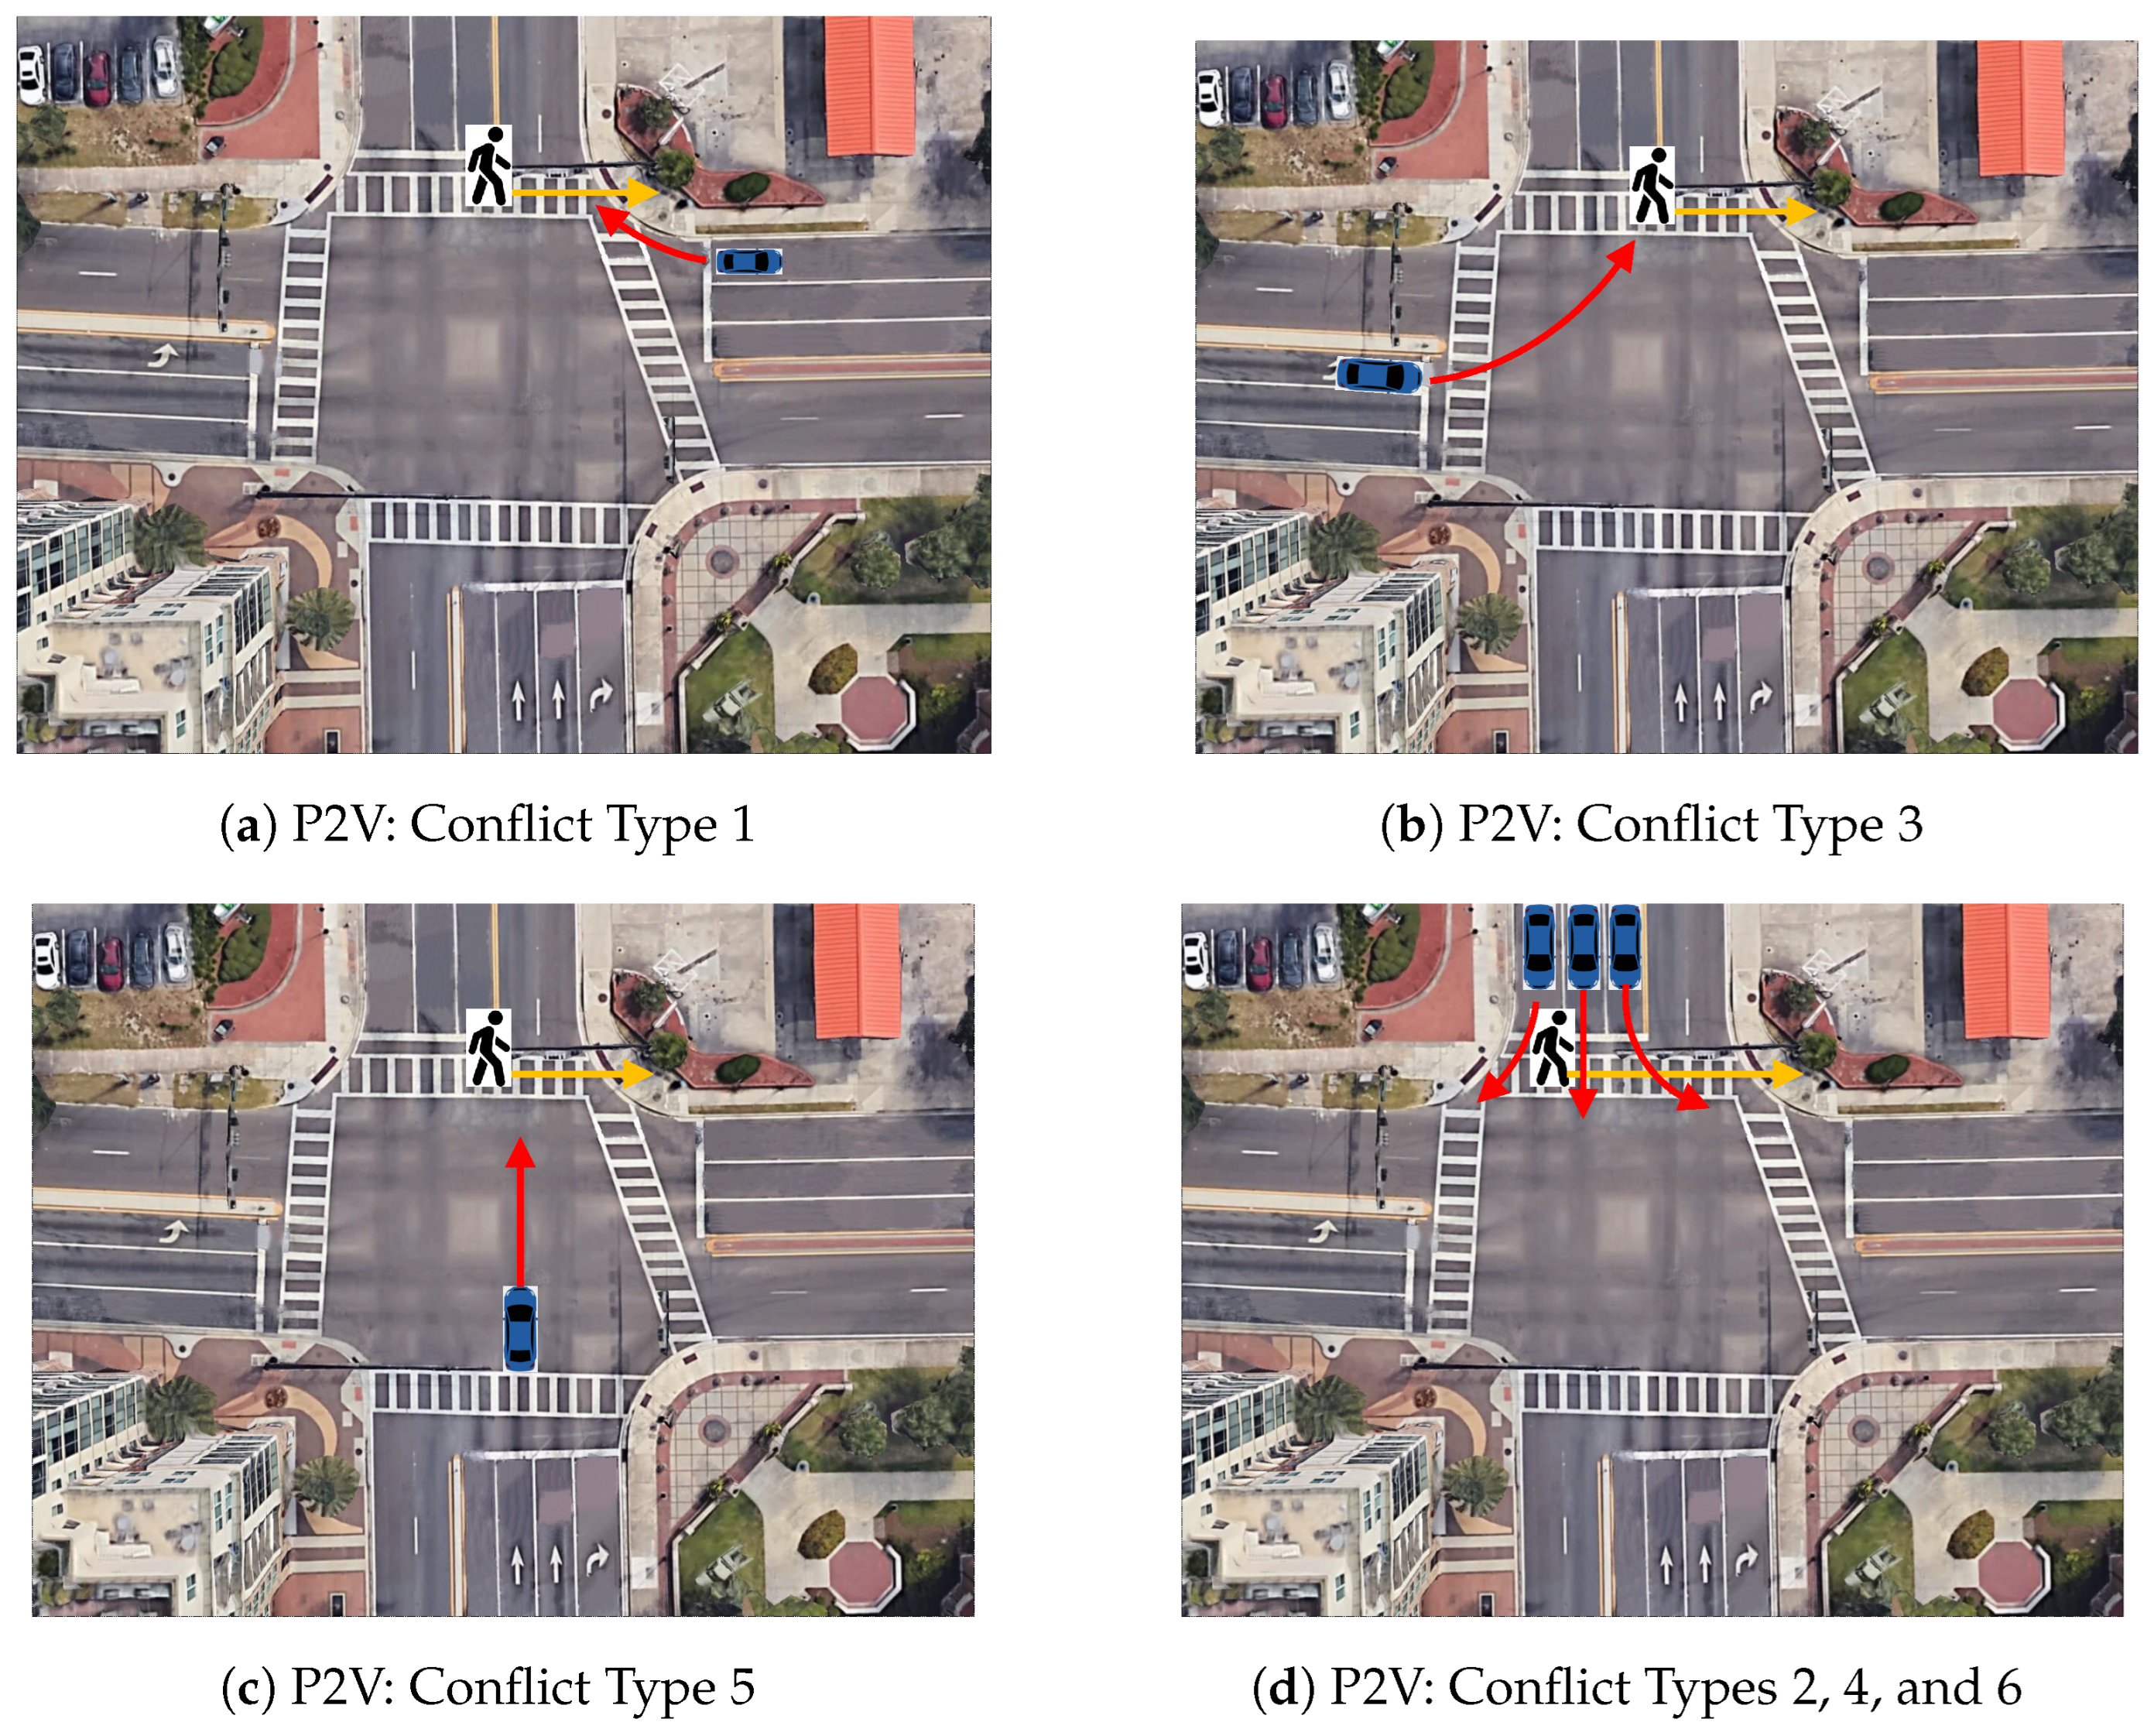
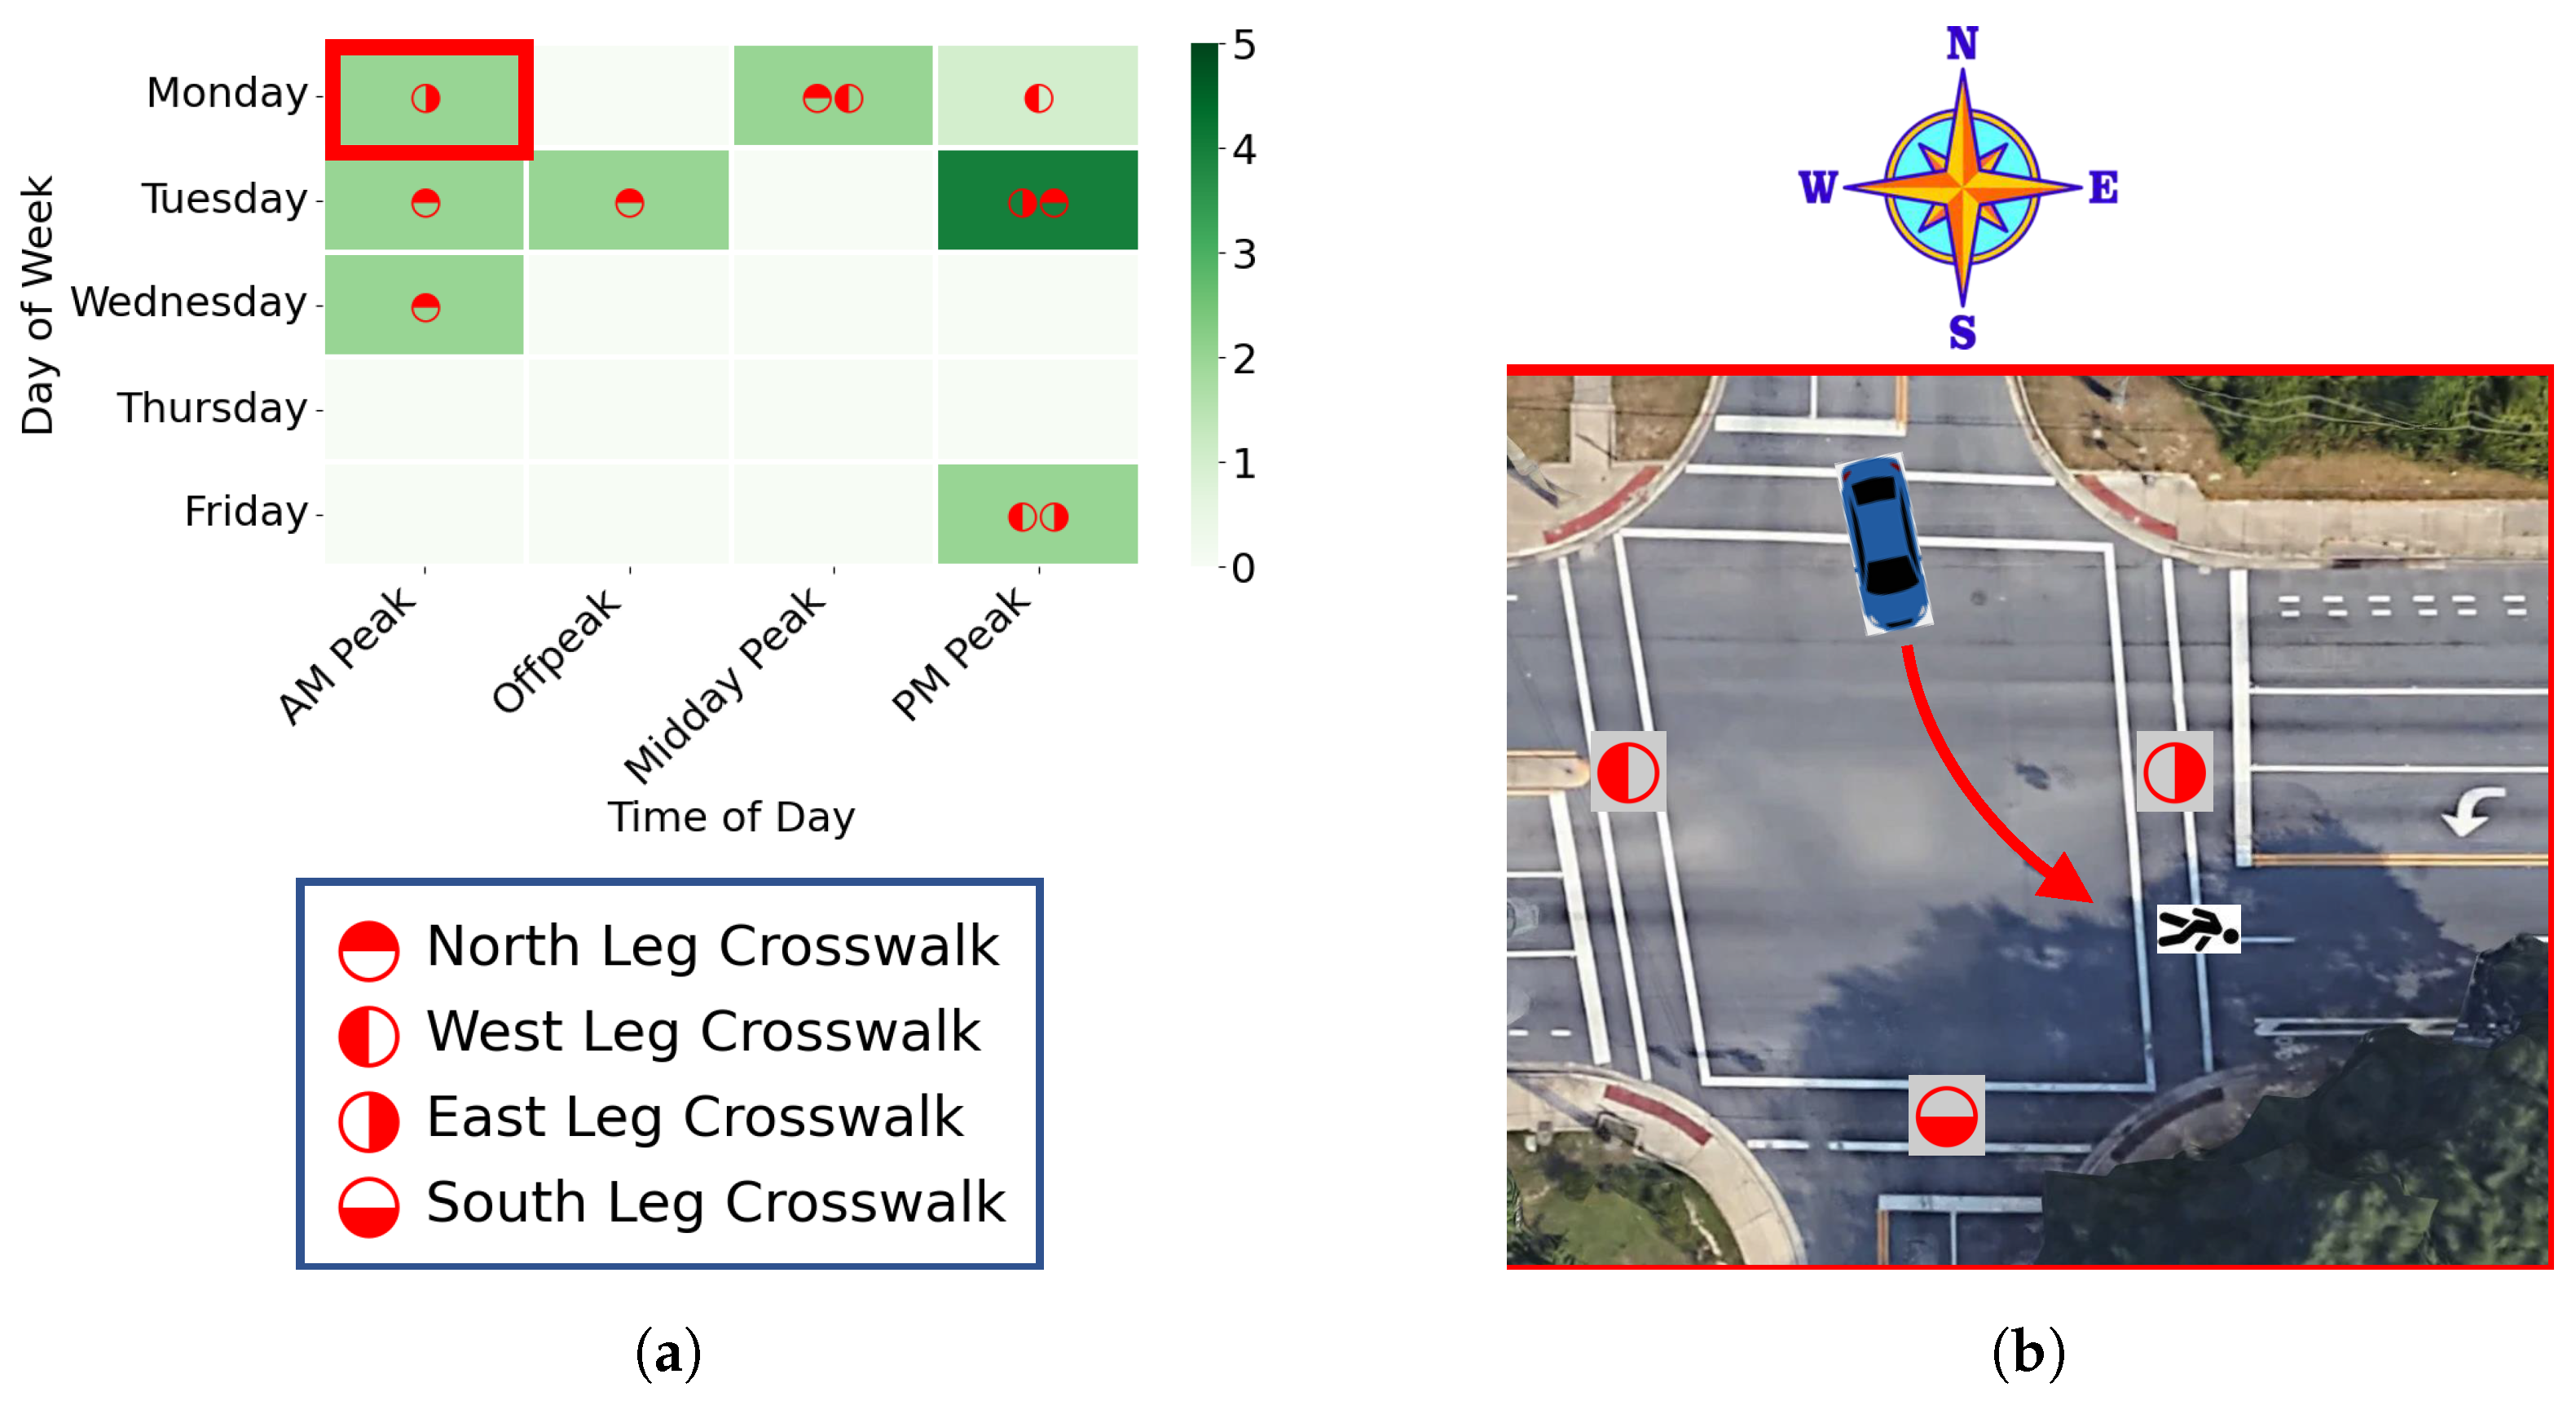
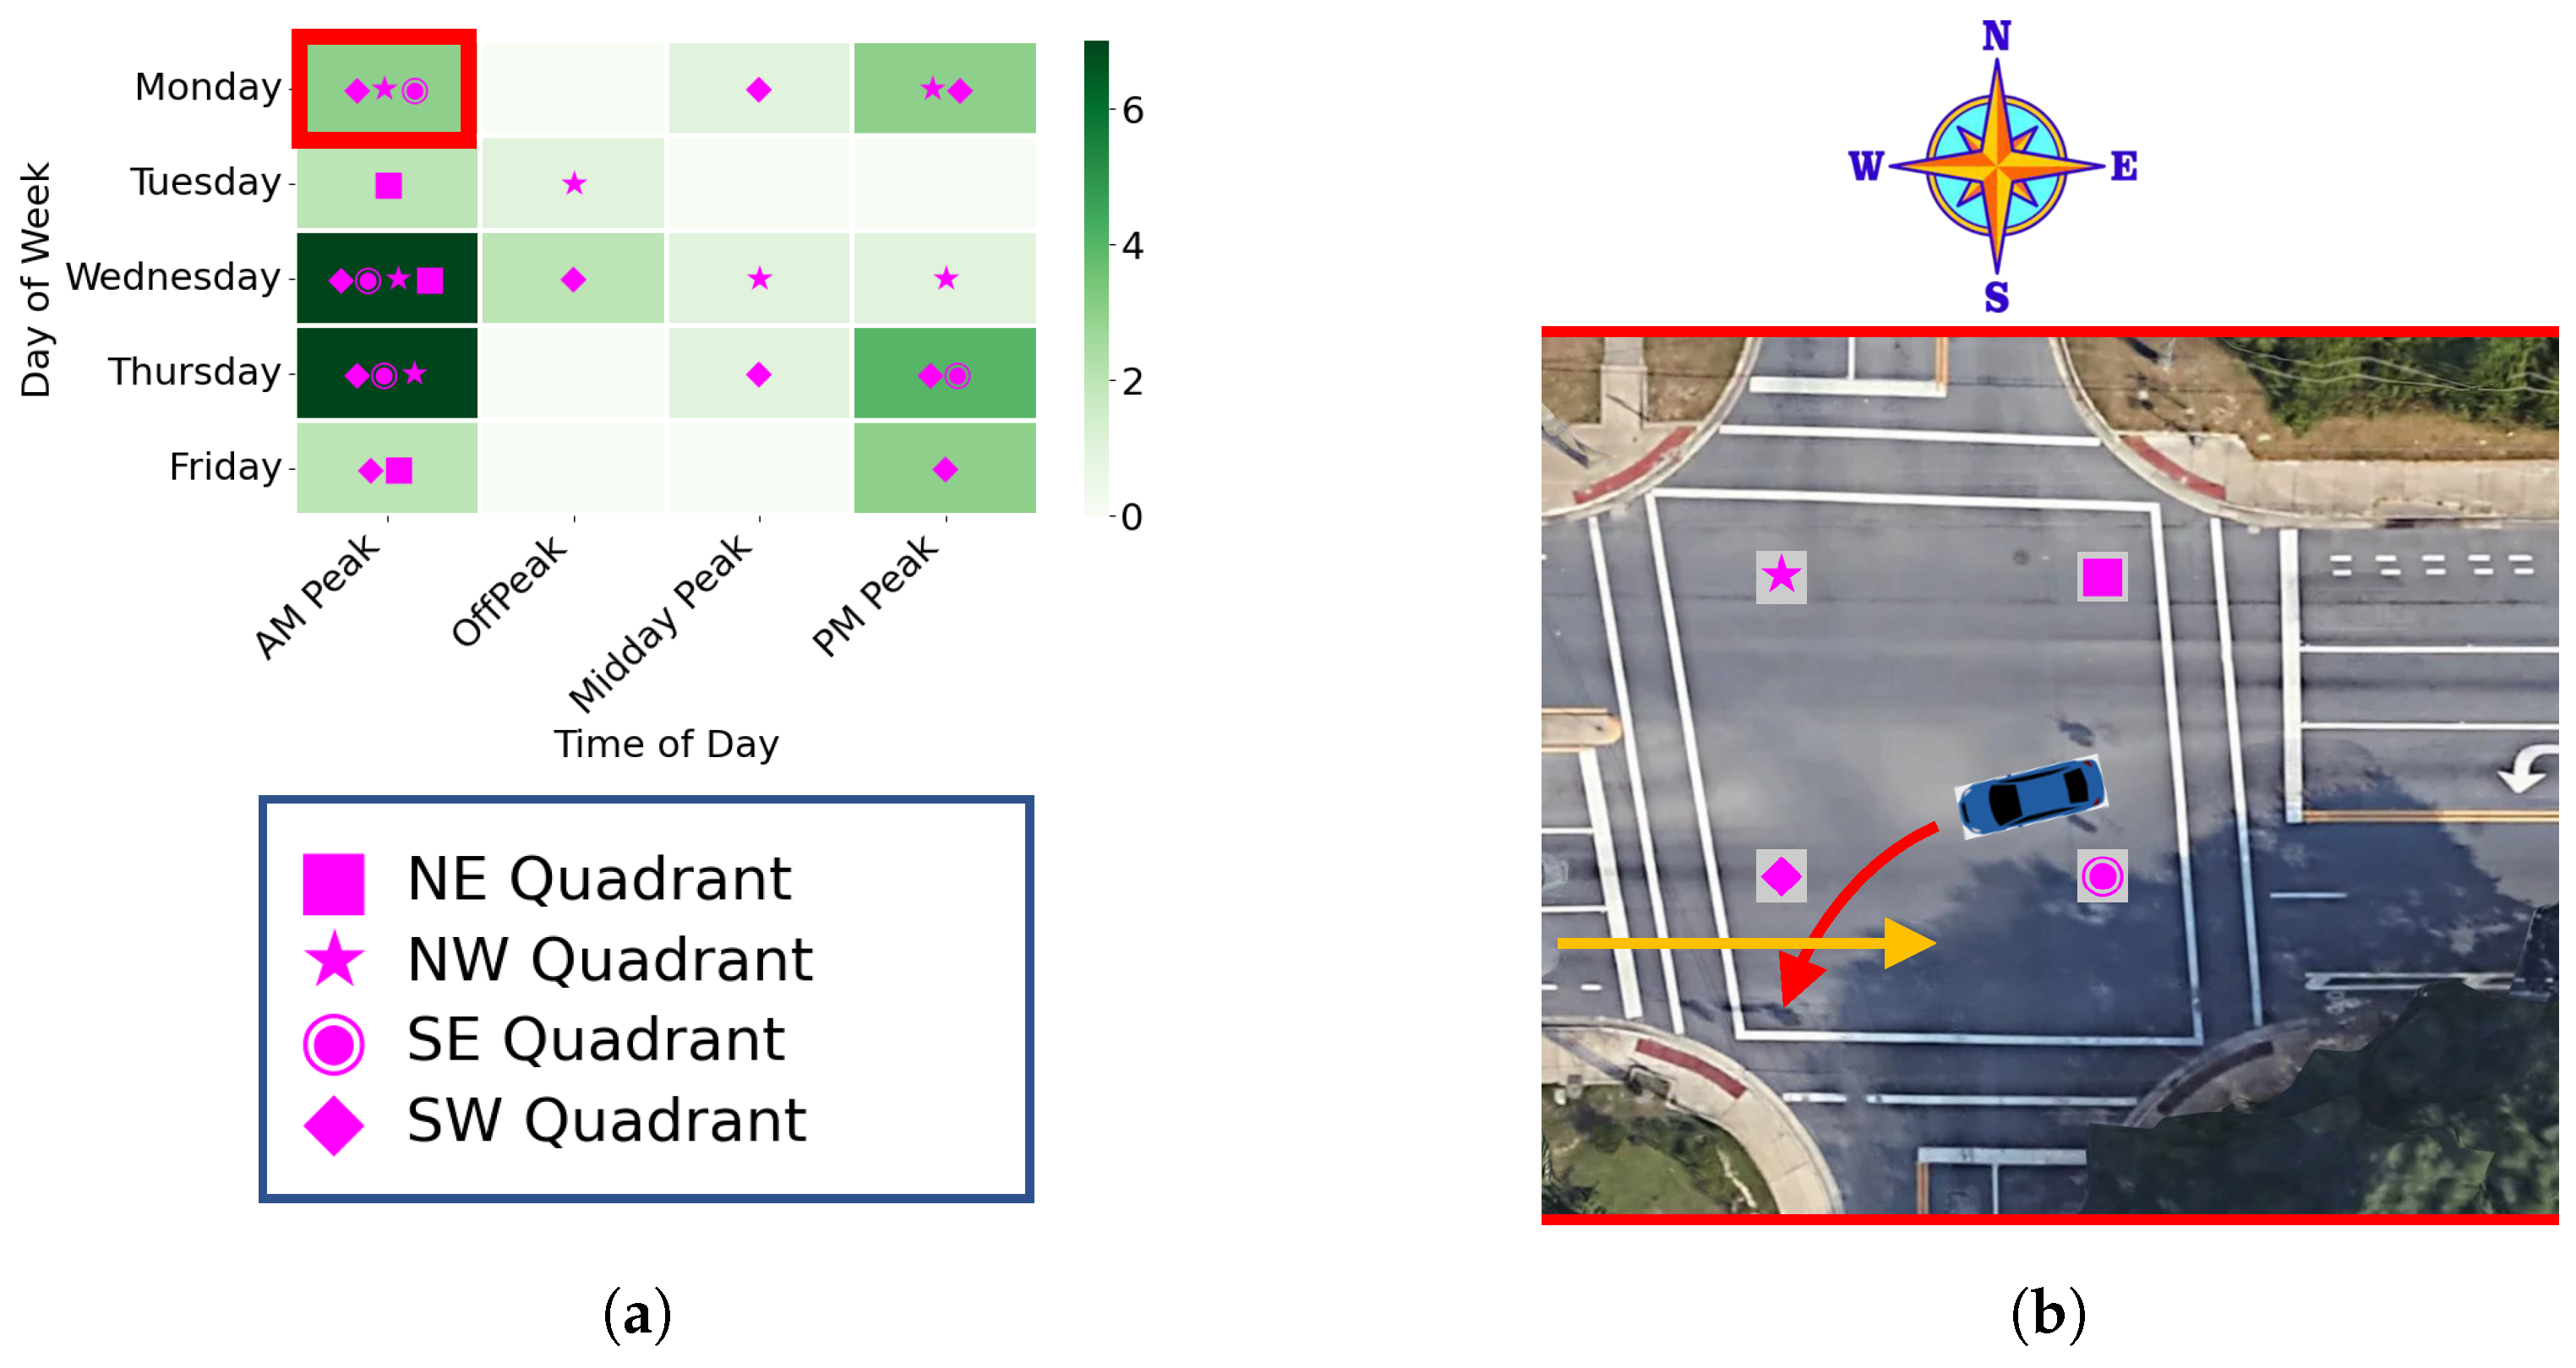
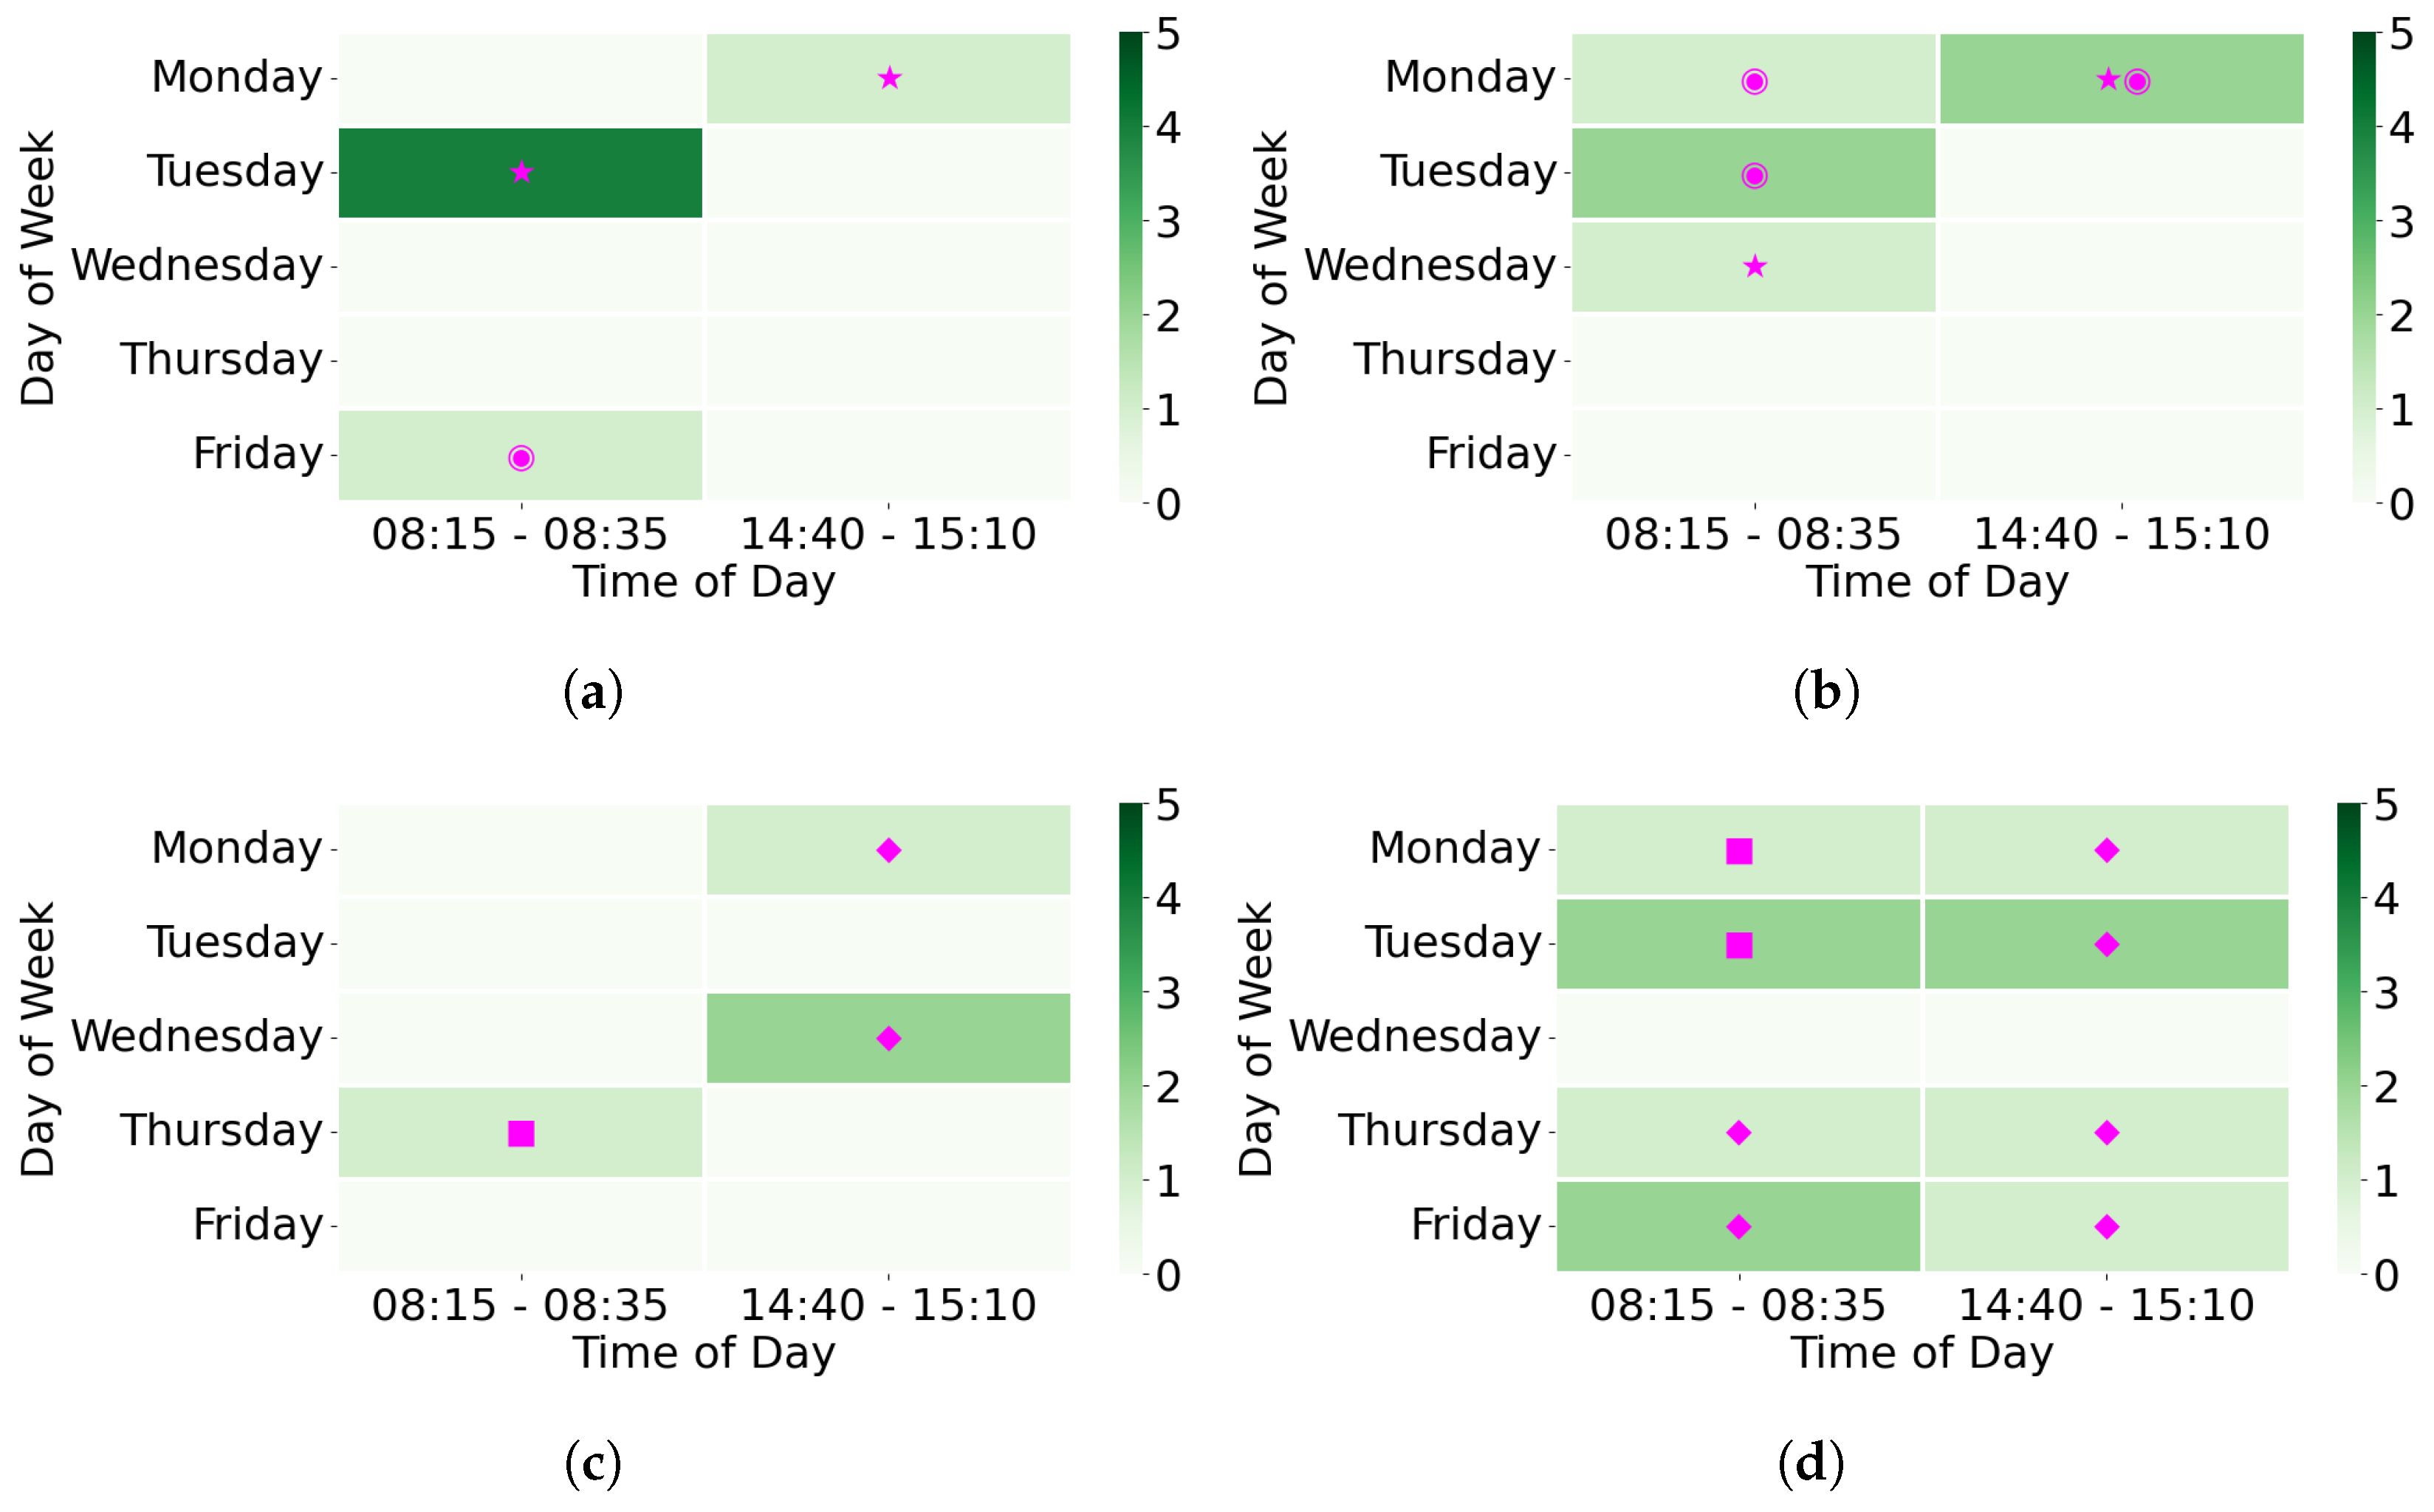
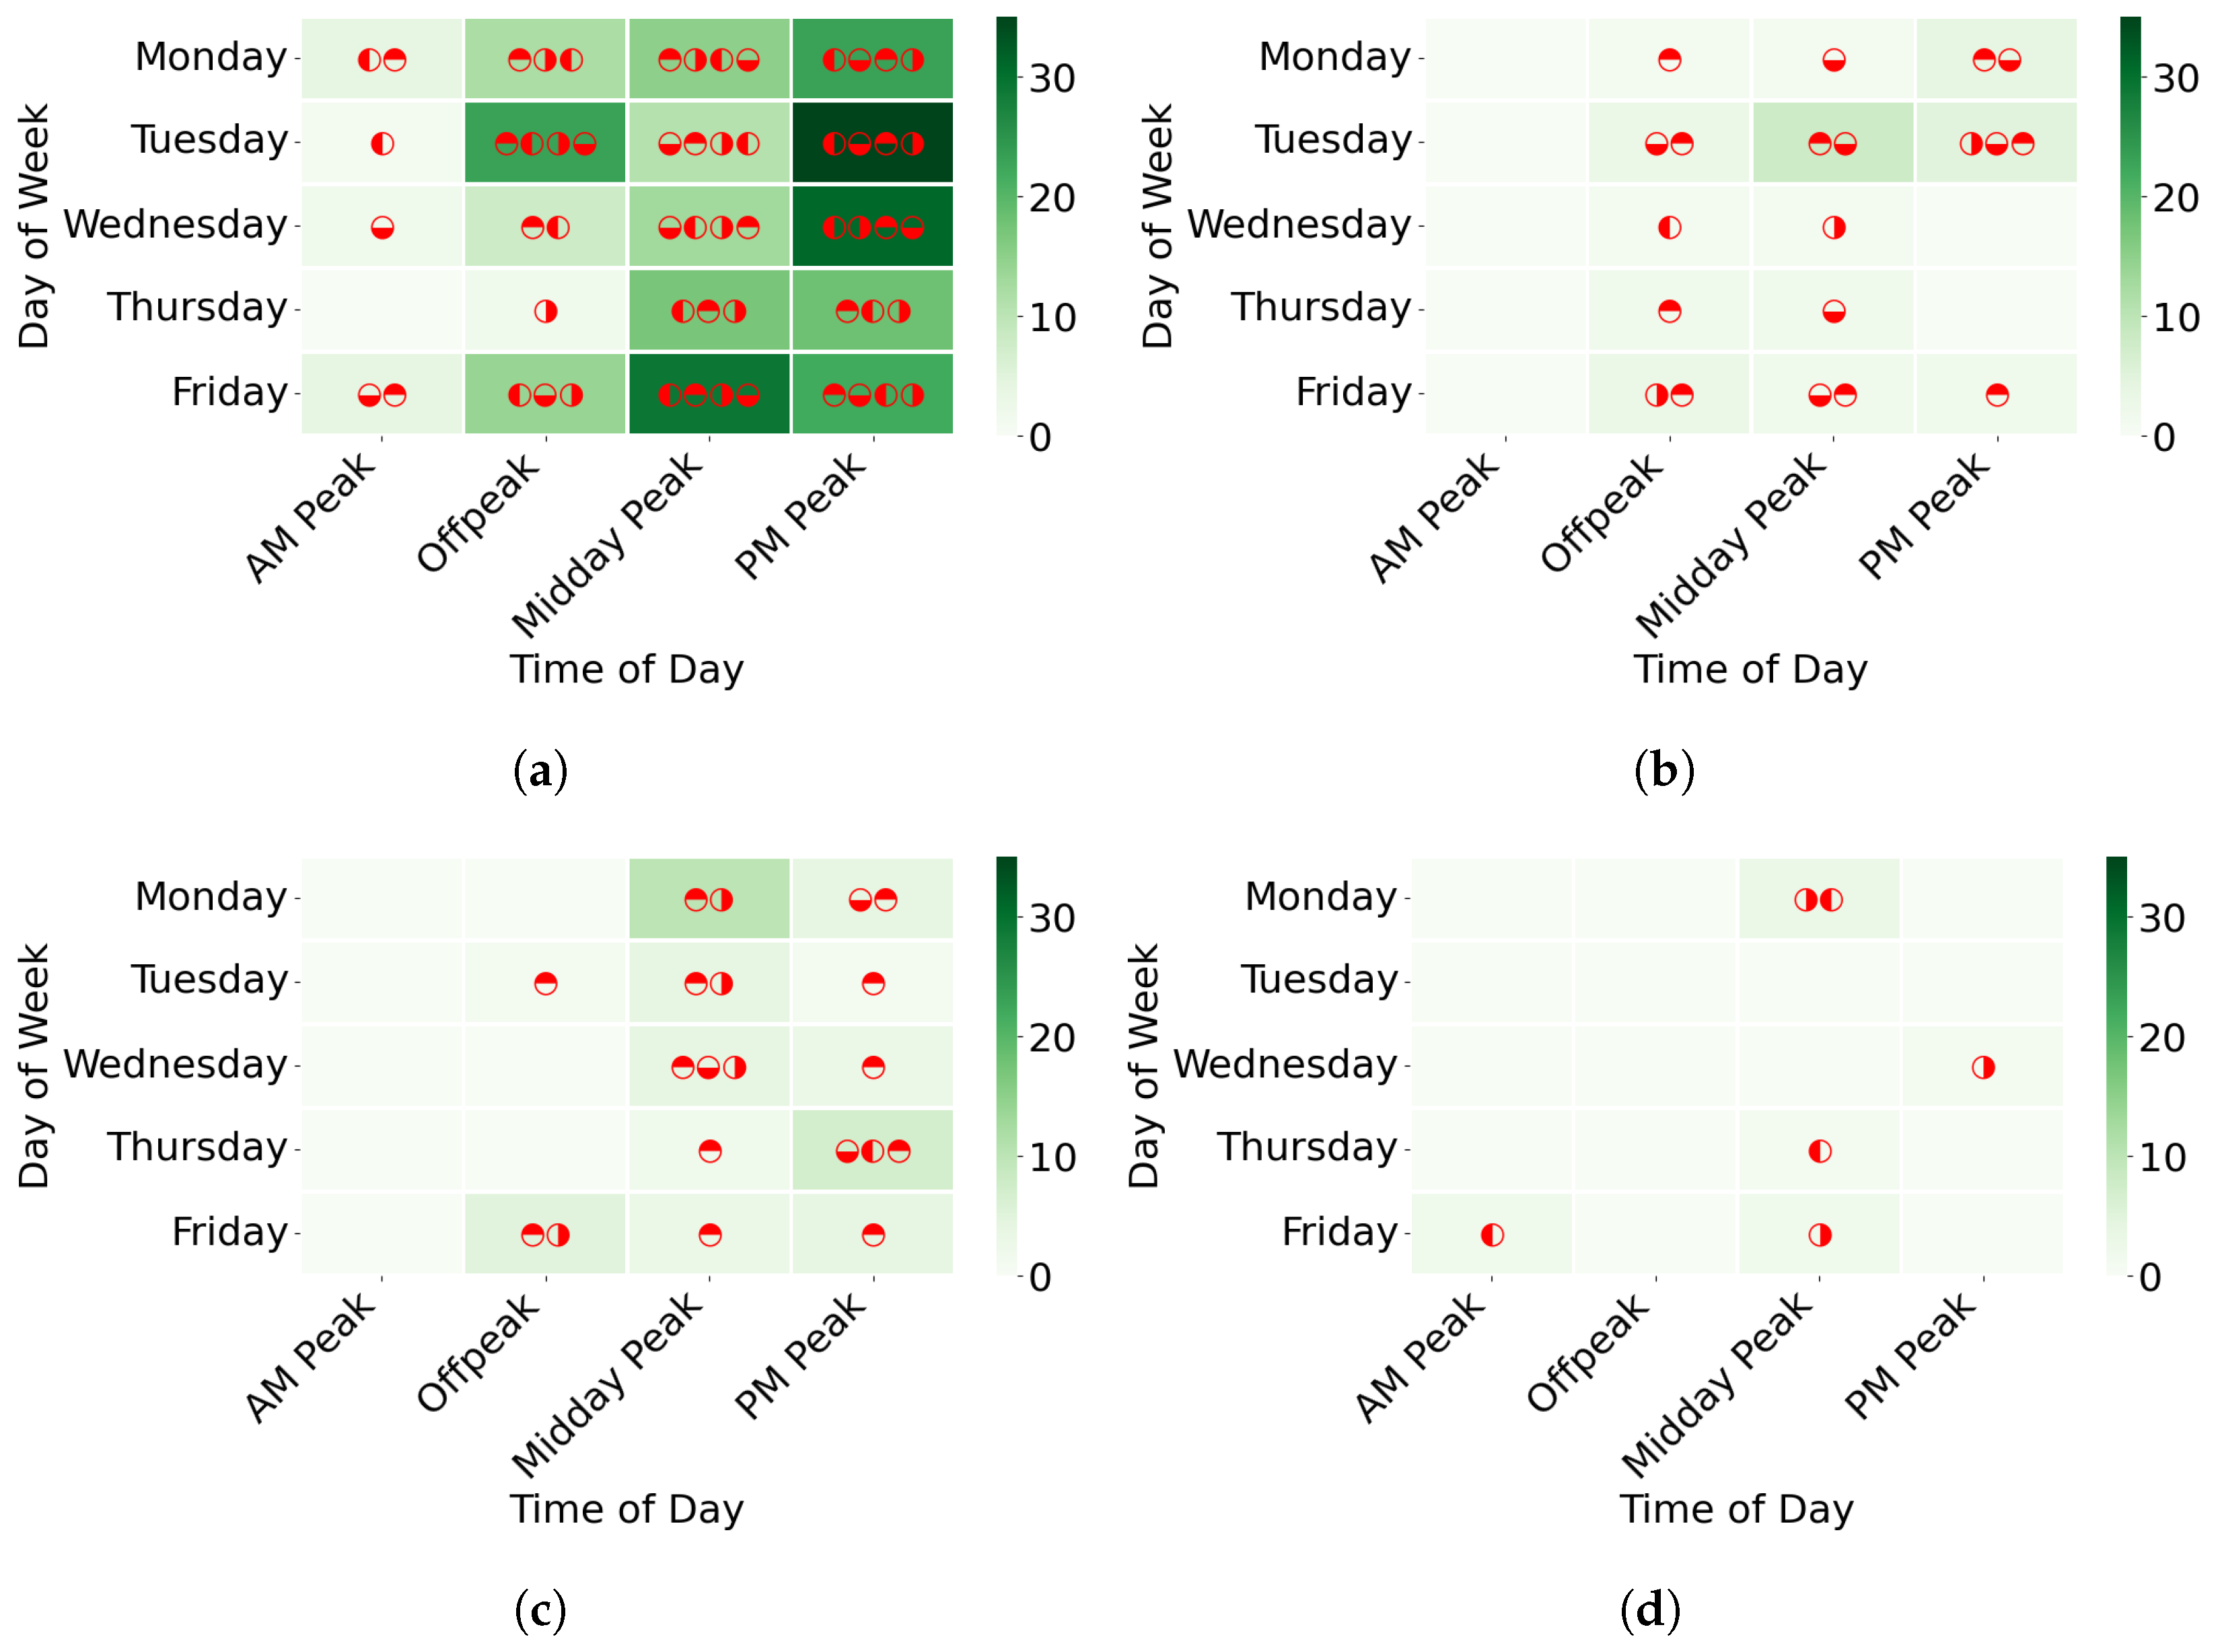
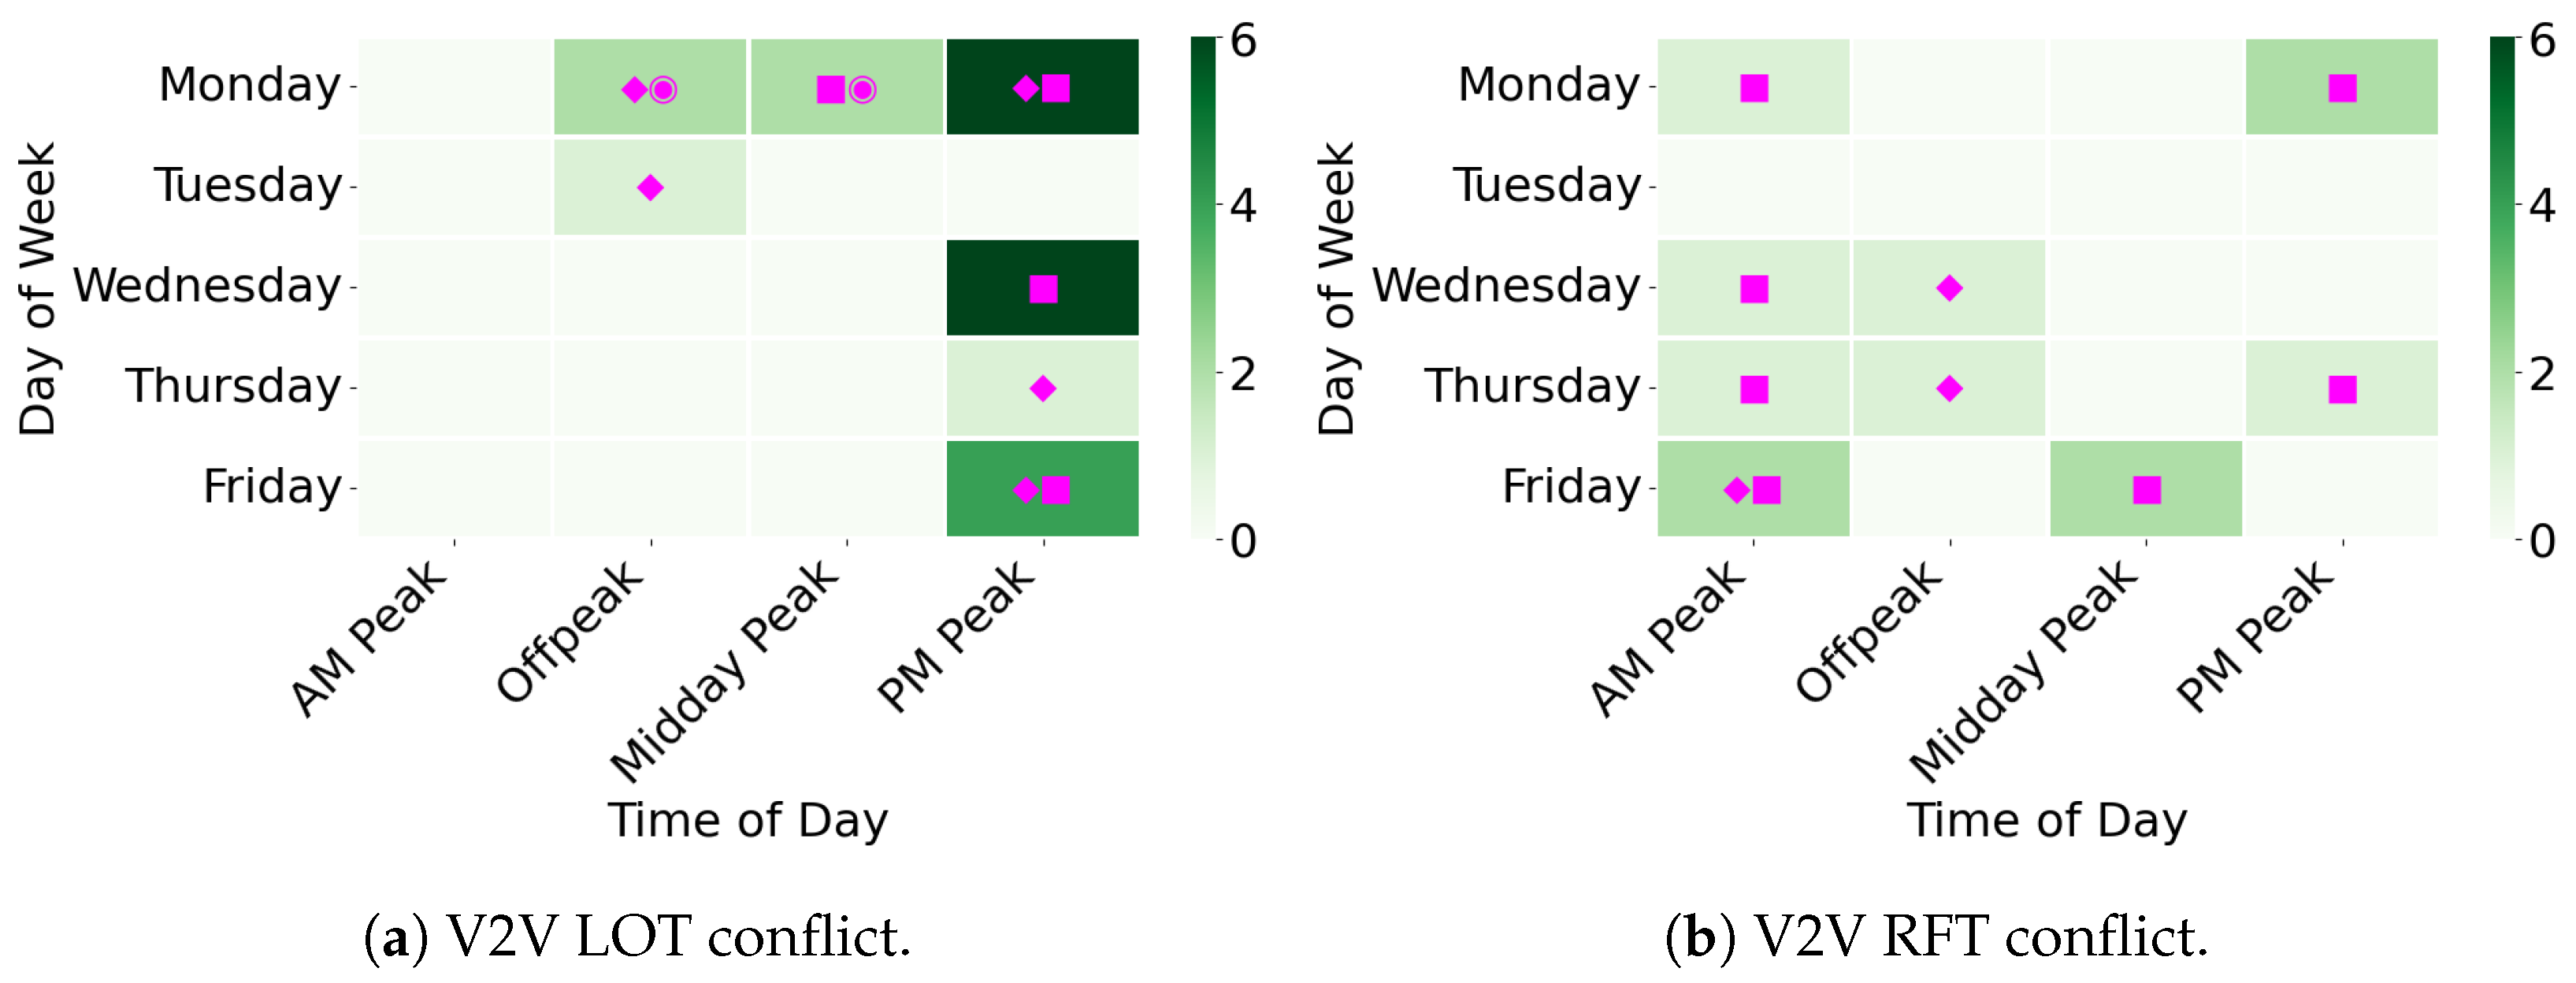
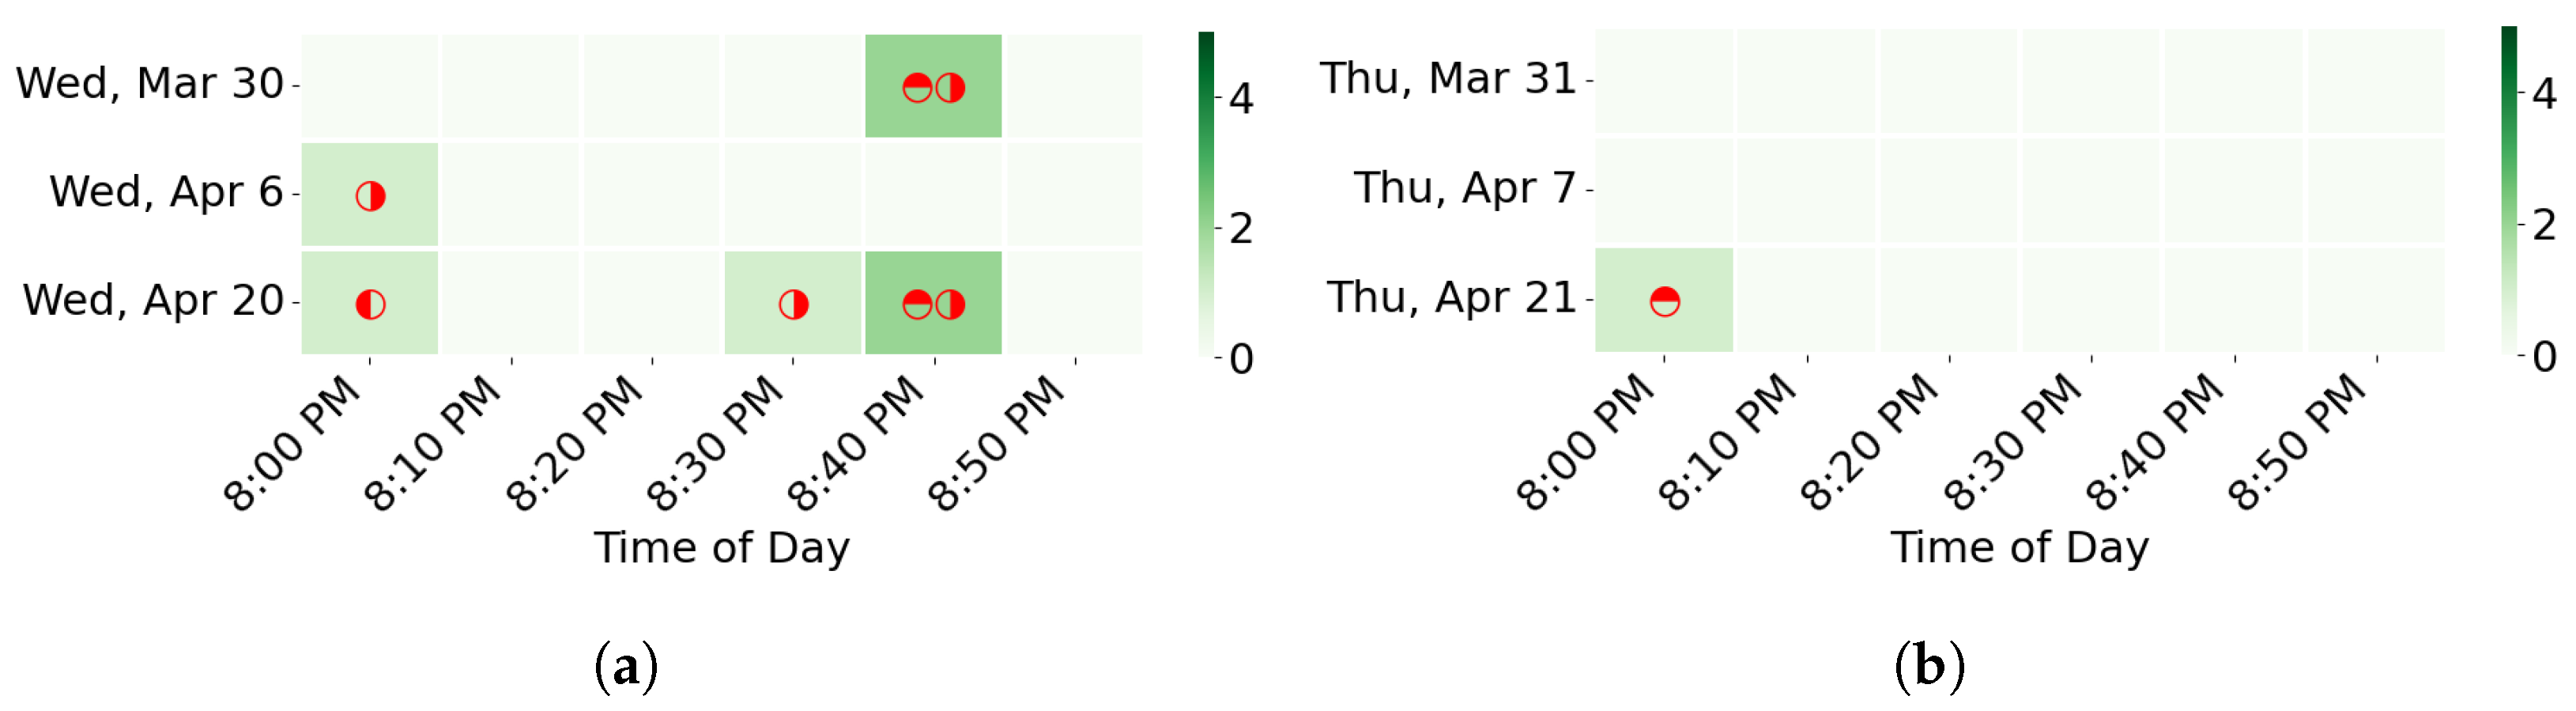
- The conflict hotspot detection module computes the temporal hotspots of P2V and V2V conflicts by the conflict types and movements of the involved trajectories. P2V conflicts occur when a pedestrian and a vehicle come dangerously close, and their two trajectories intersect. V2V conflicts are defined as the occurrence of evasive vehicular actions and are recognizable by braking or weaving maneuvers [5]. If a hotspot pattern emerges in the conflict analysis, a traffic engineer could apply a countermeasure to address those conflicts. The evaluation engine uses a novel visualization scheme to simultaneously represent temporal conflict hotspots with the spatial locations within the intersection where the conflicts occur. We use the reciprocal of the number of conflicts as a measure of intersection safety.
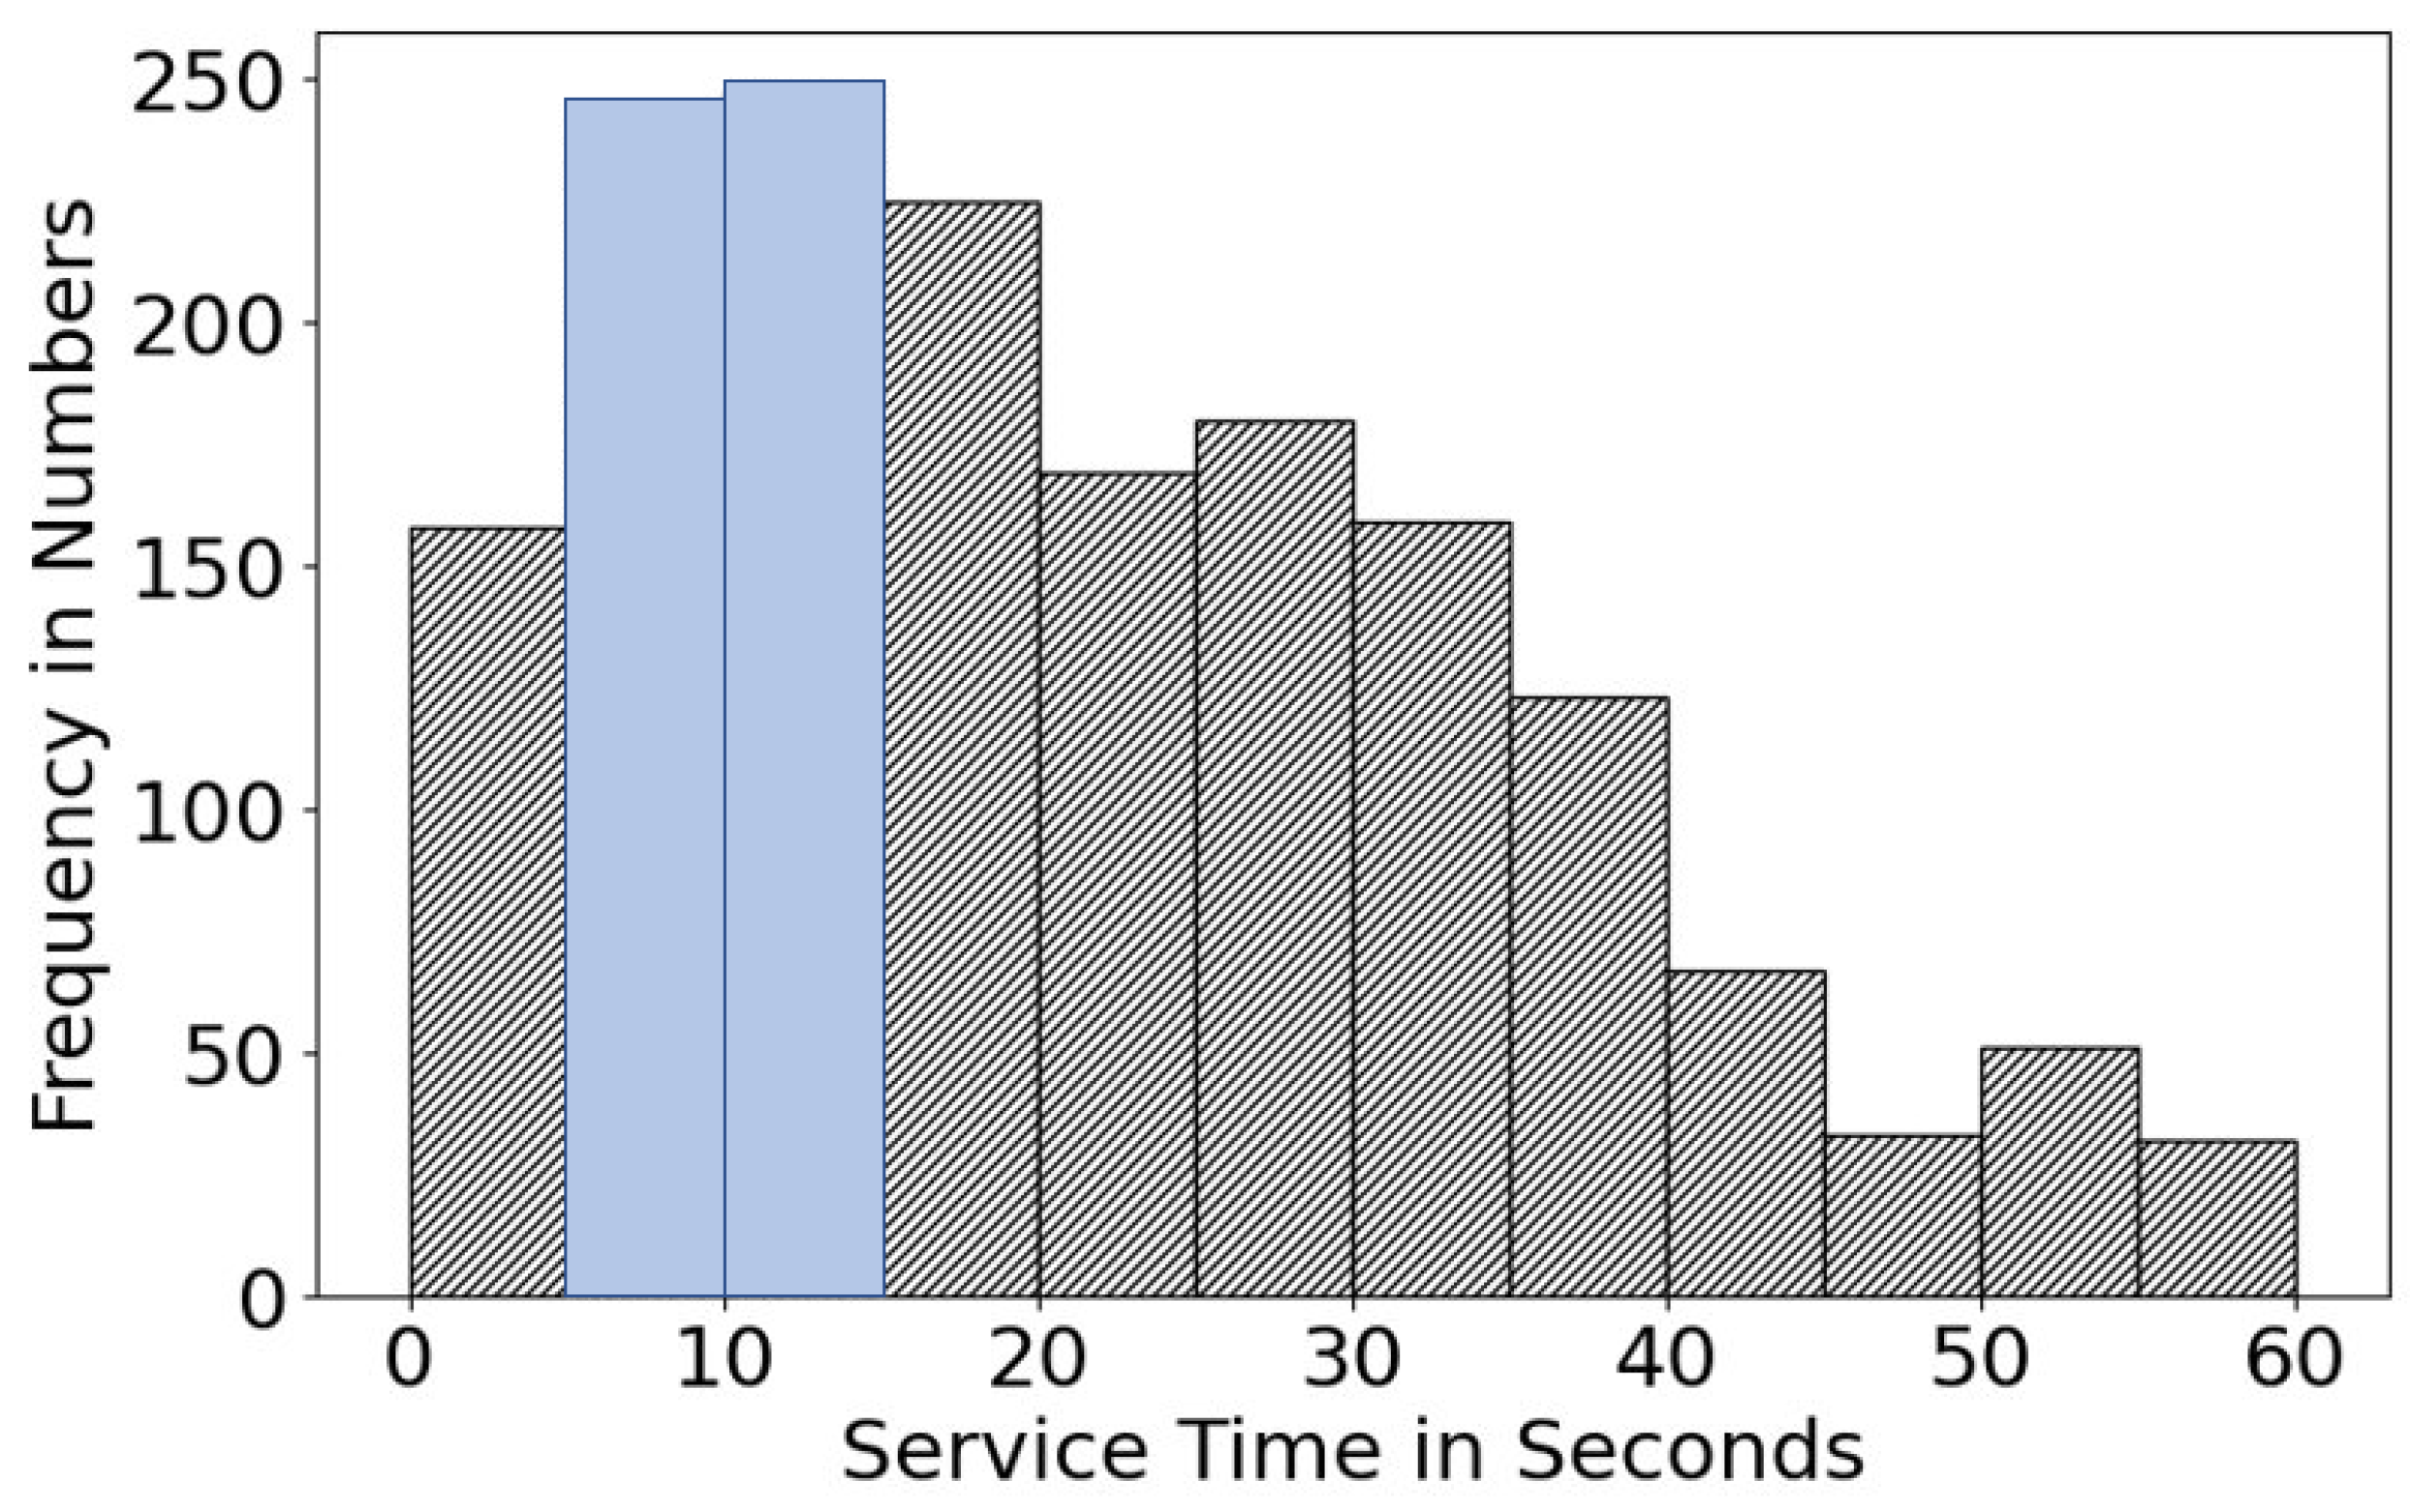
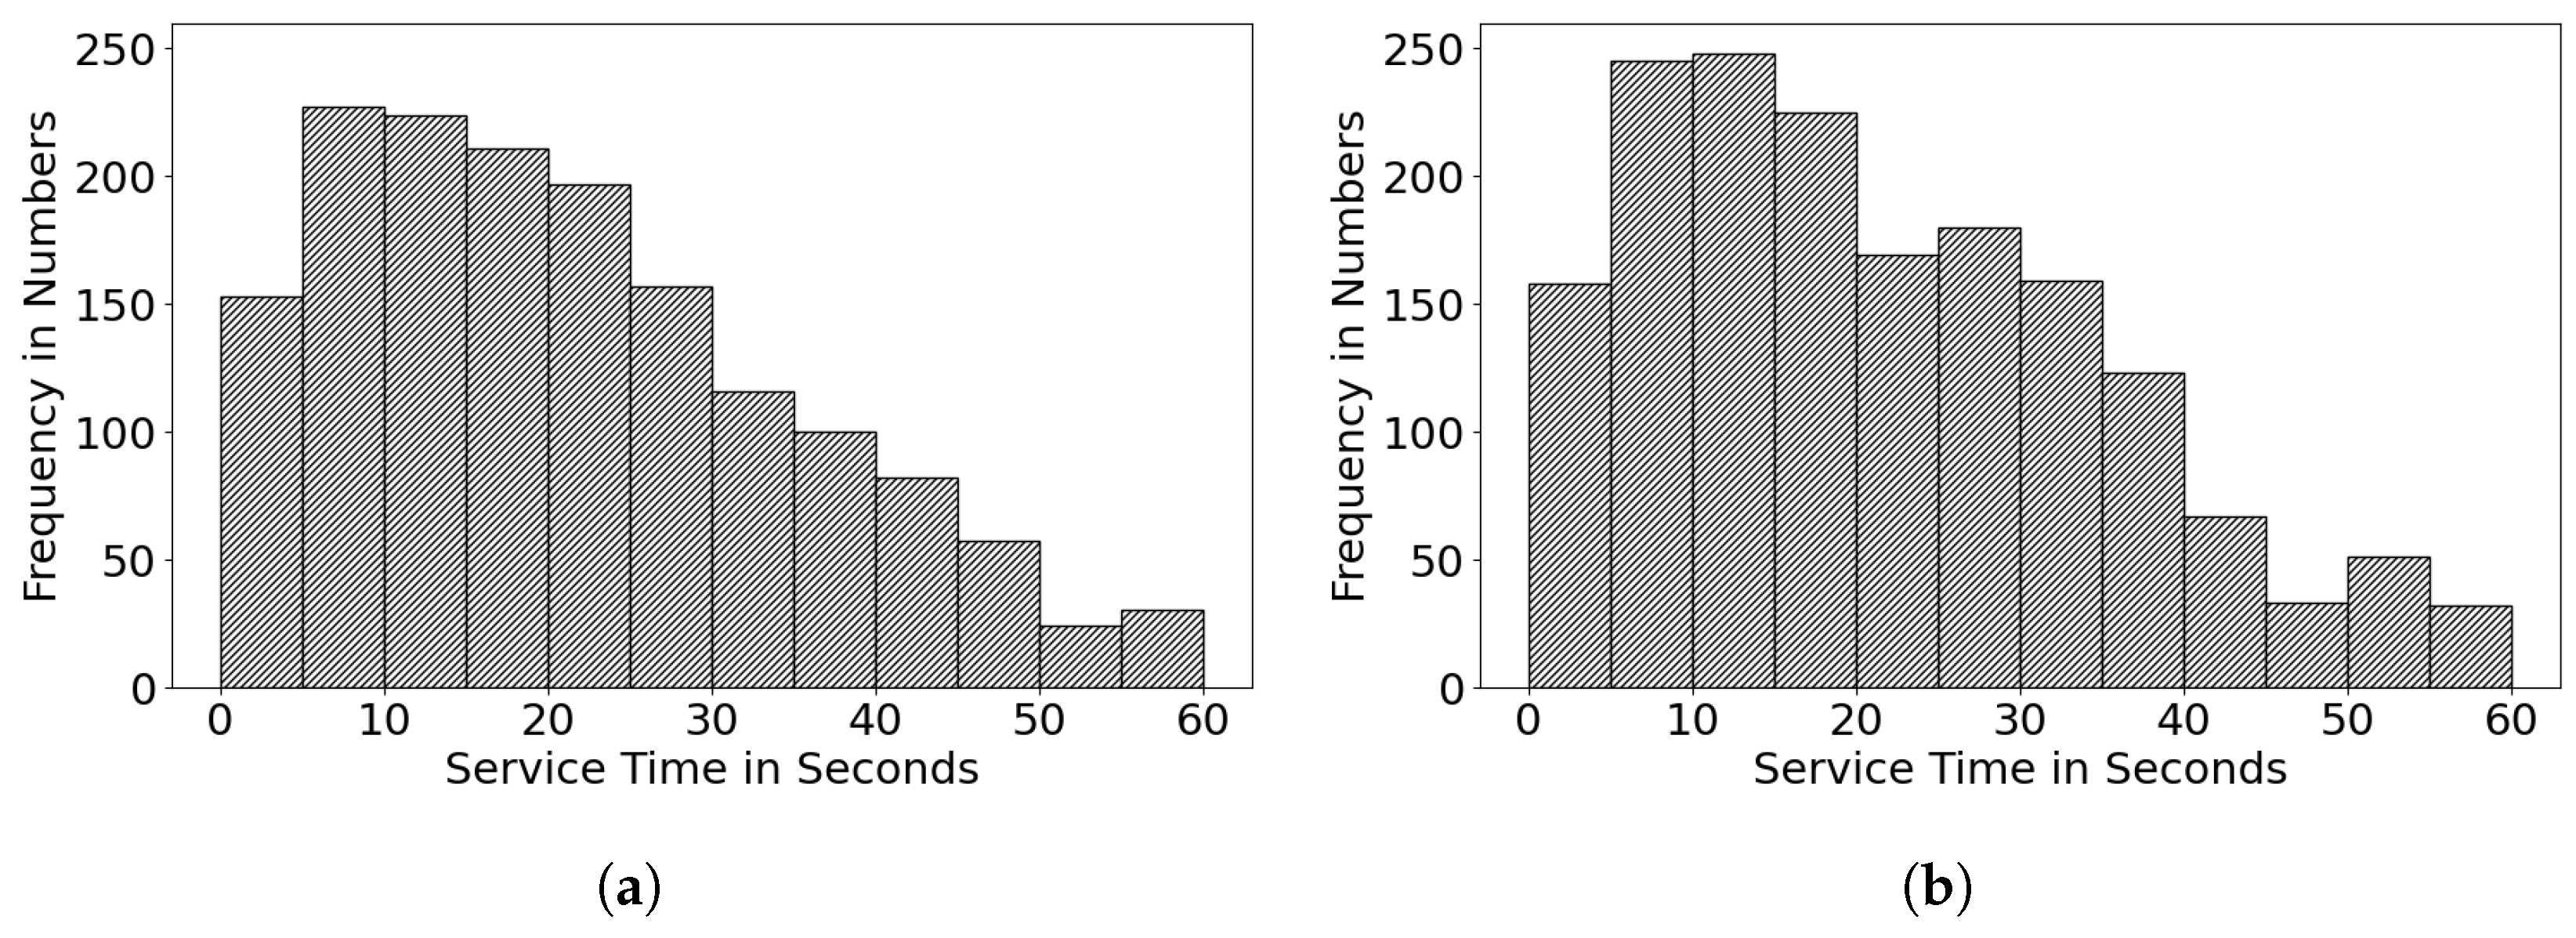
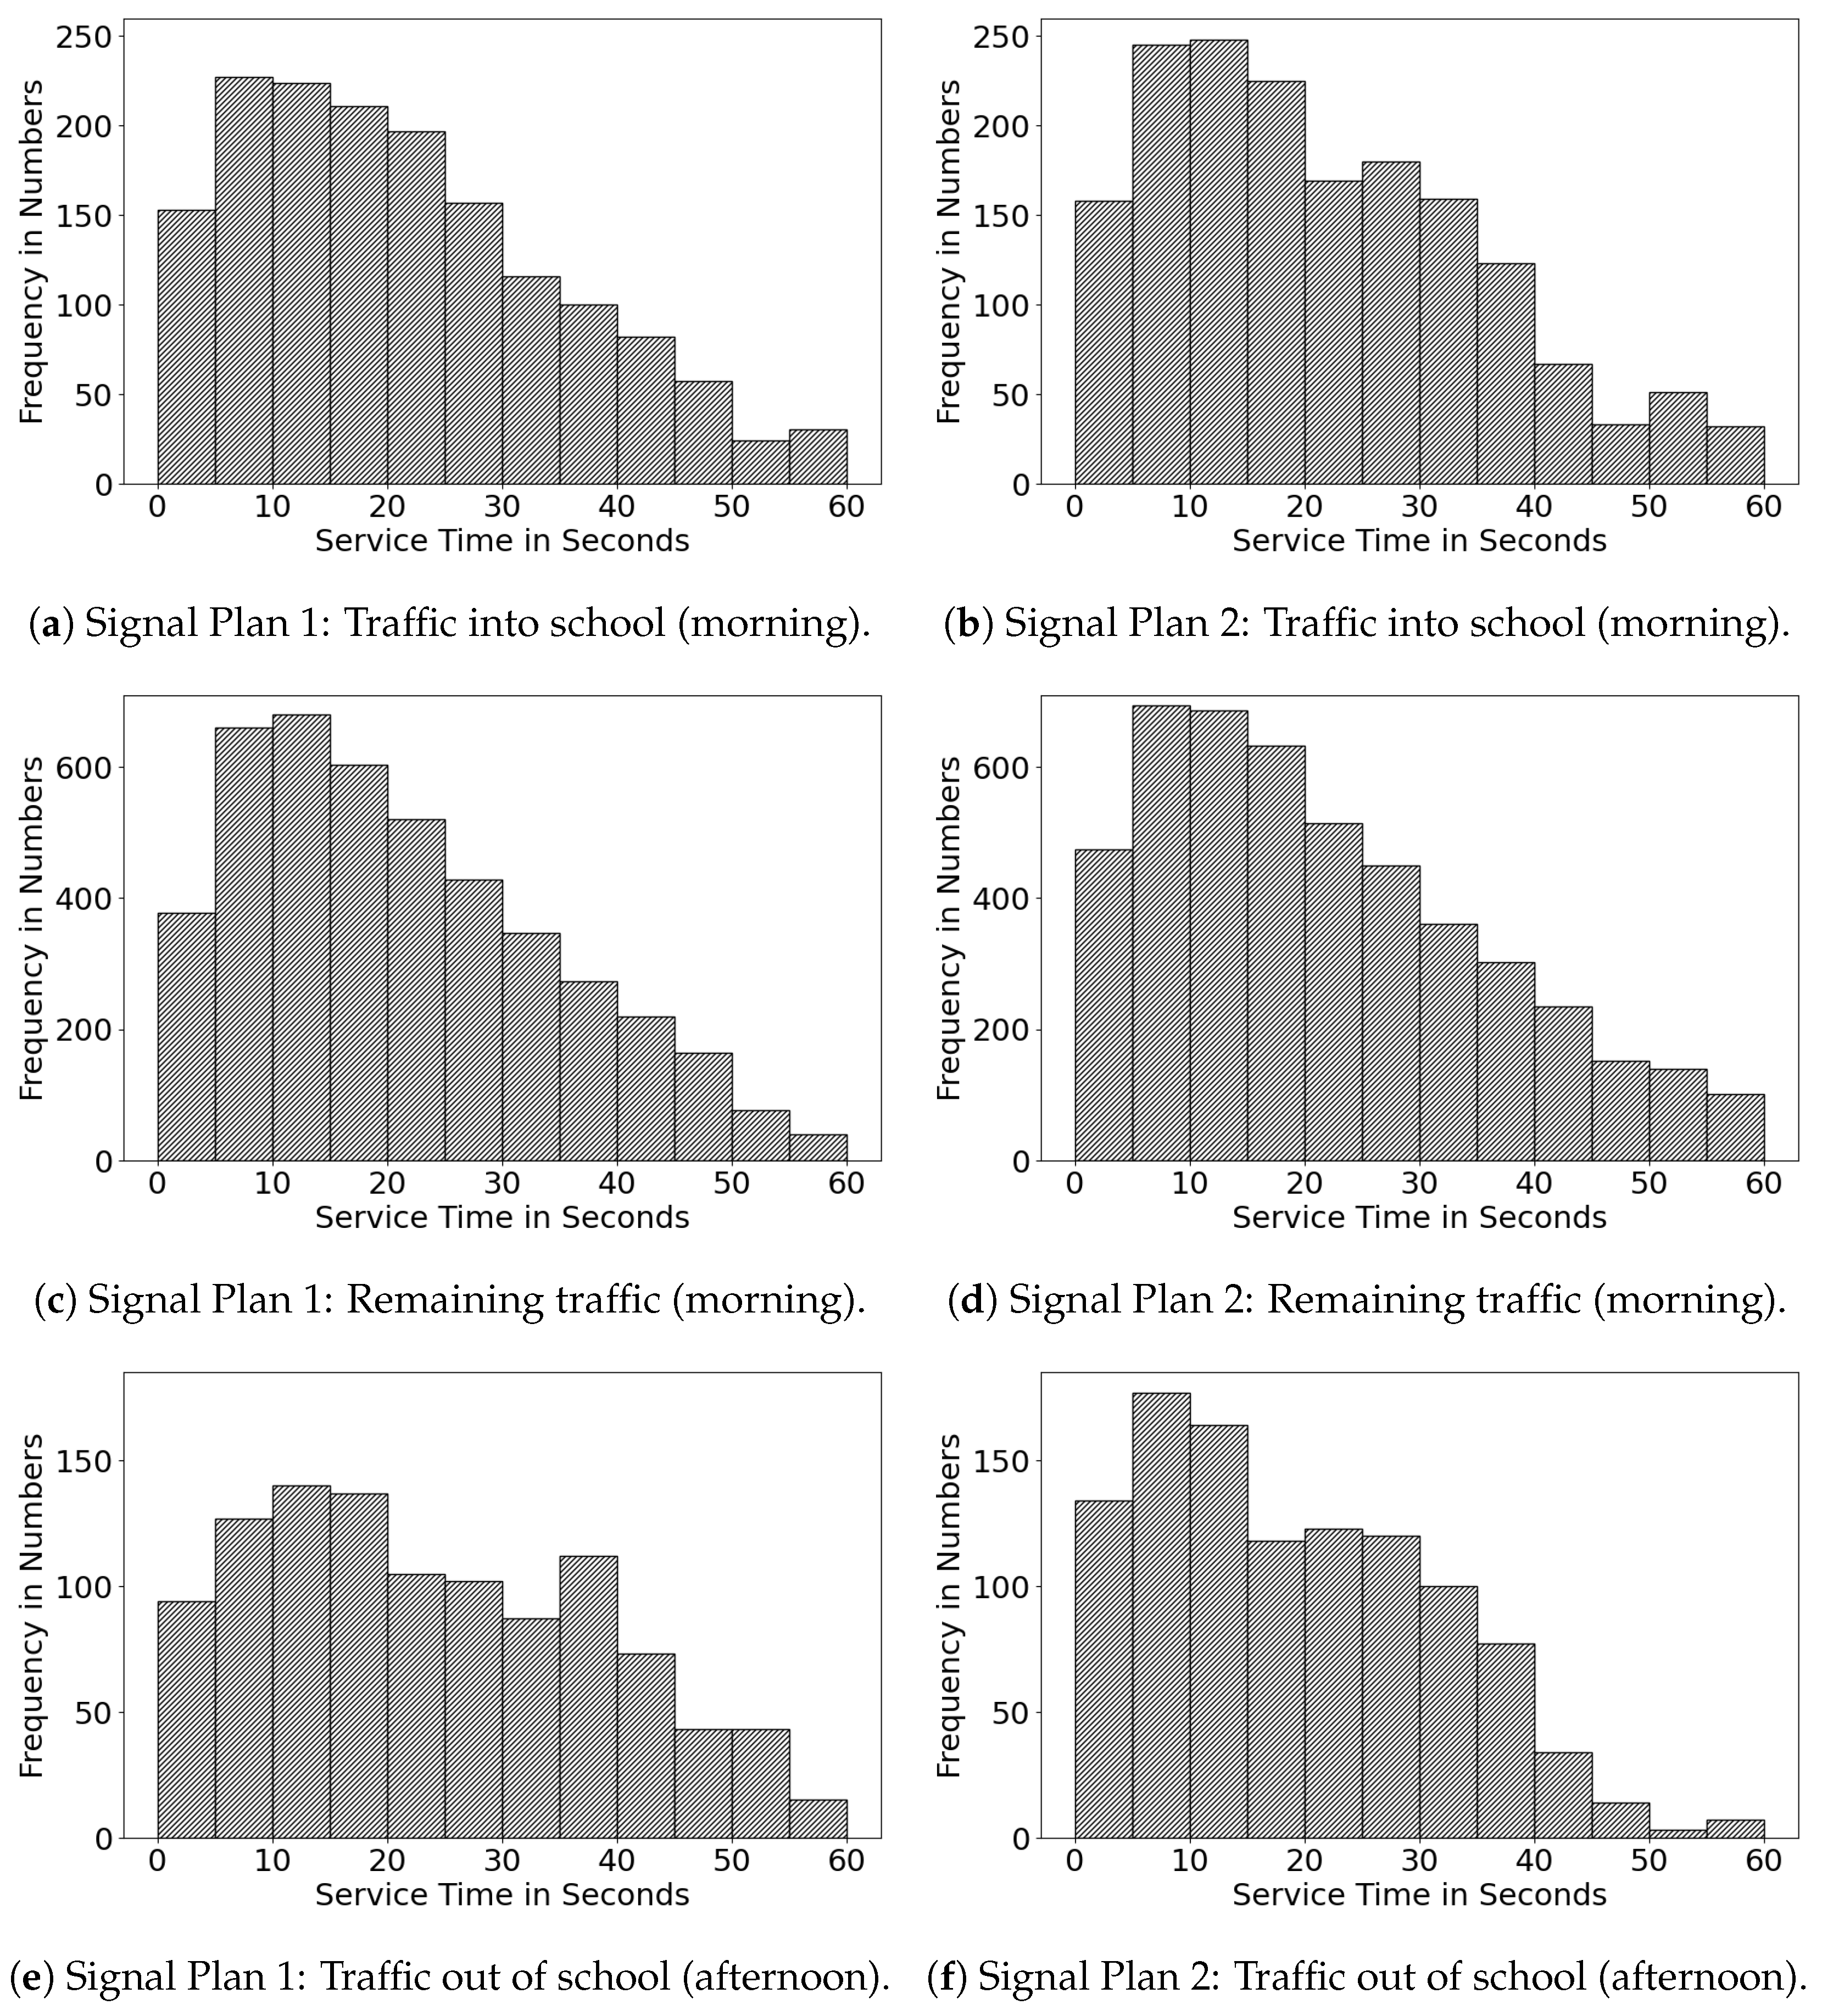
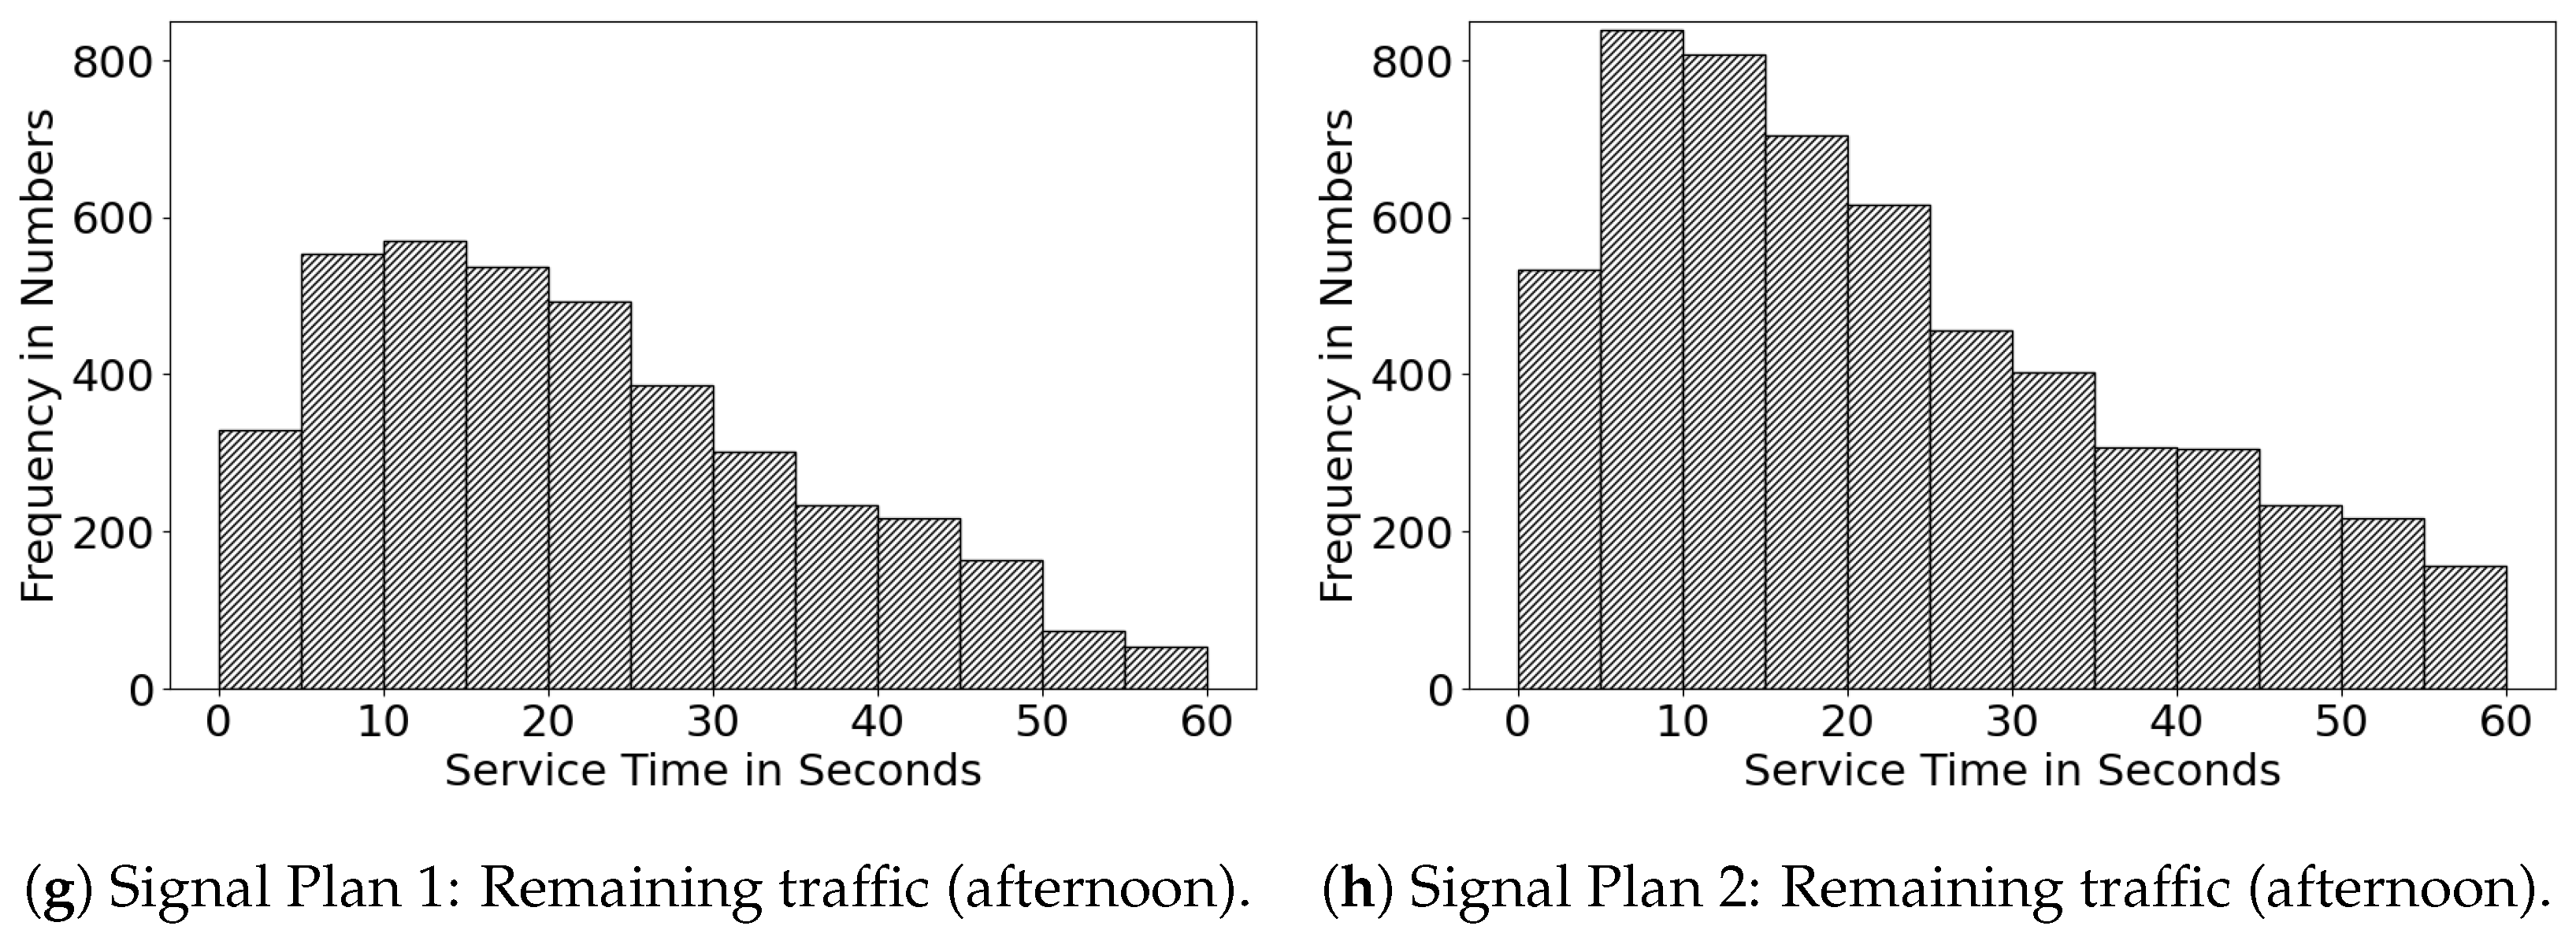
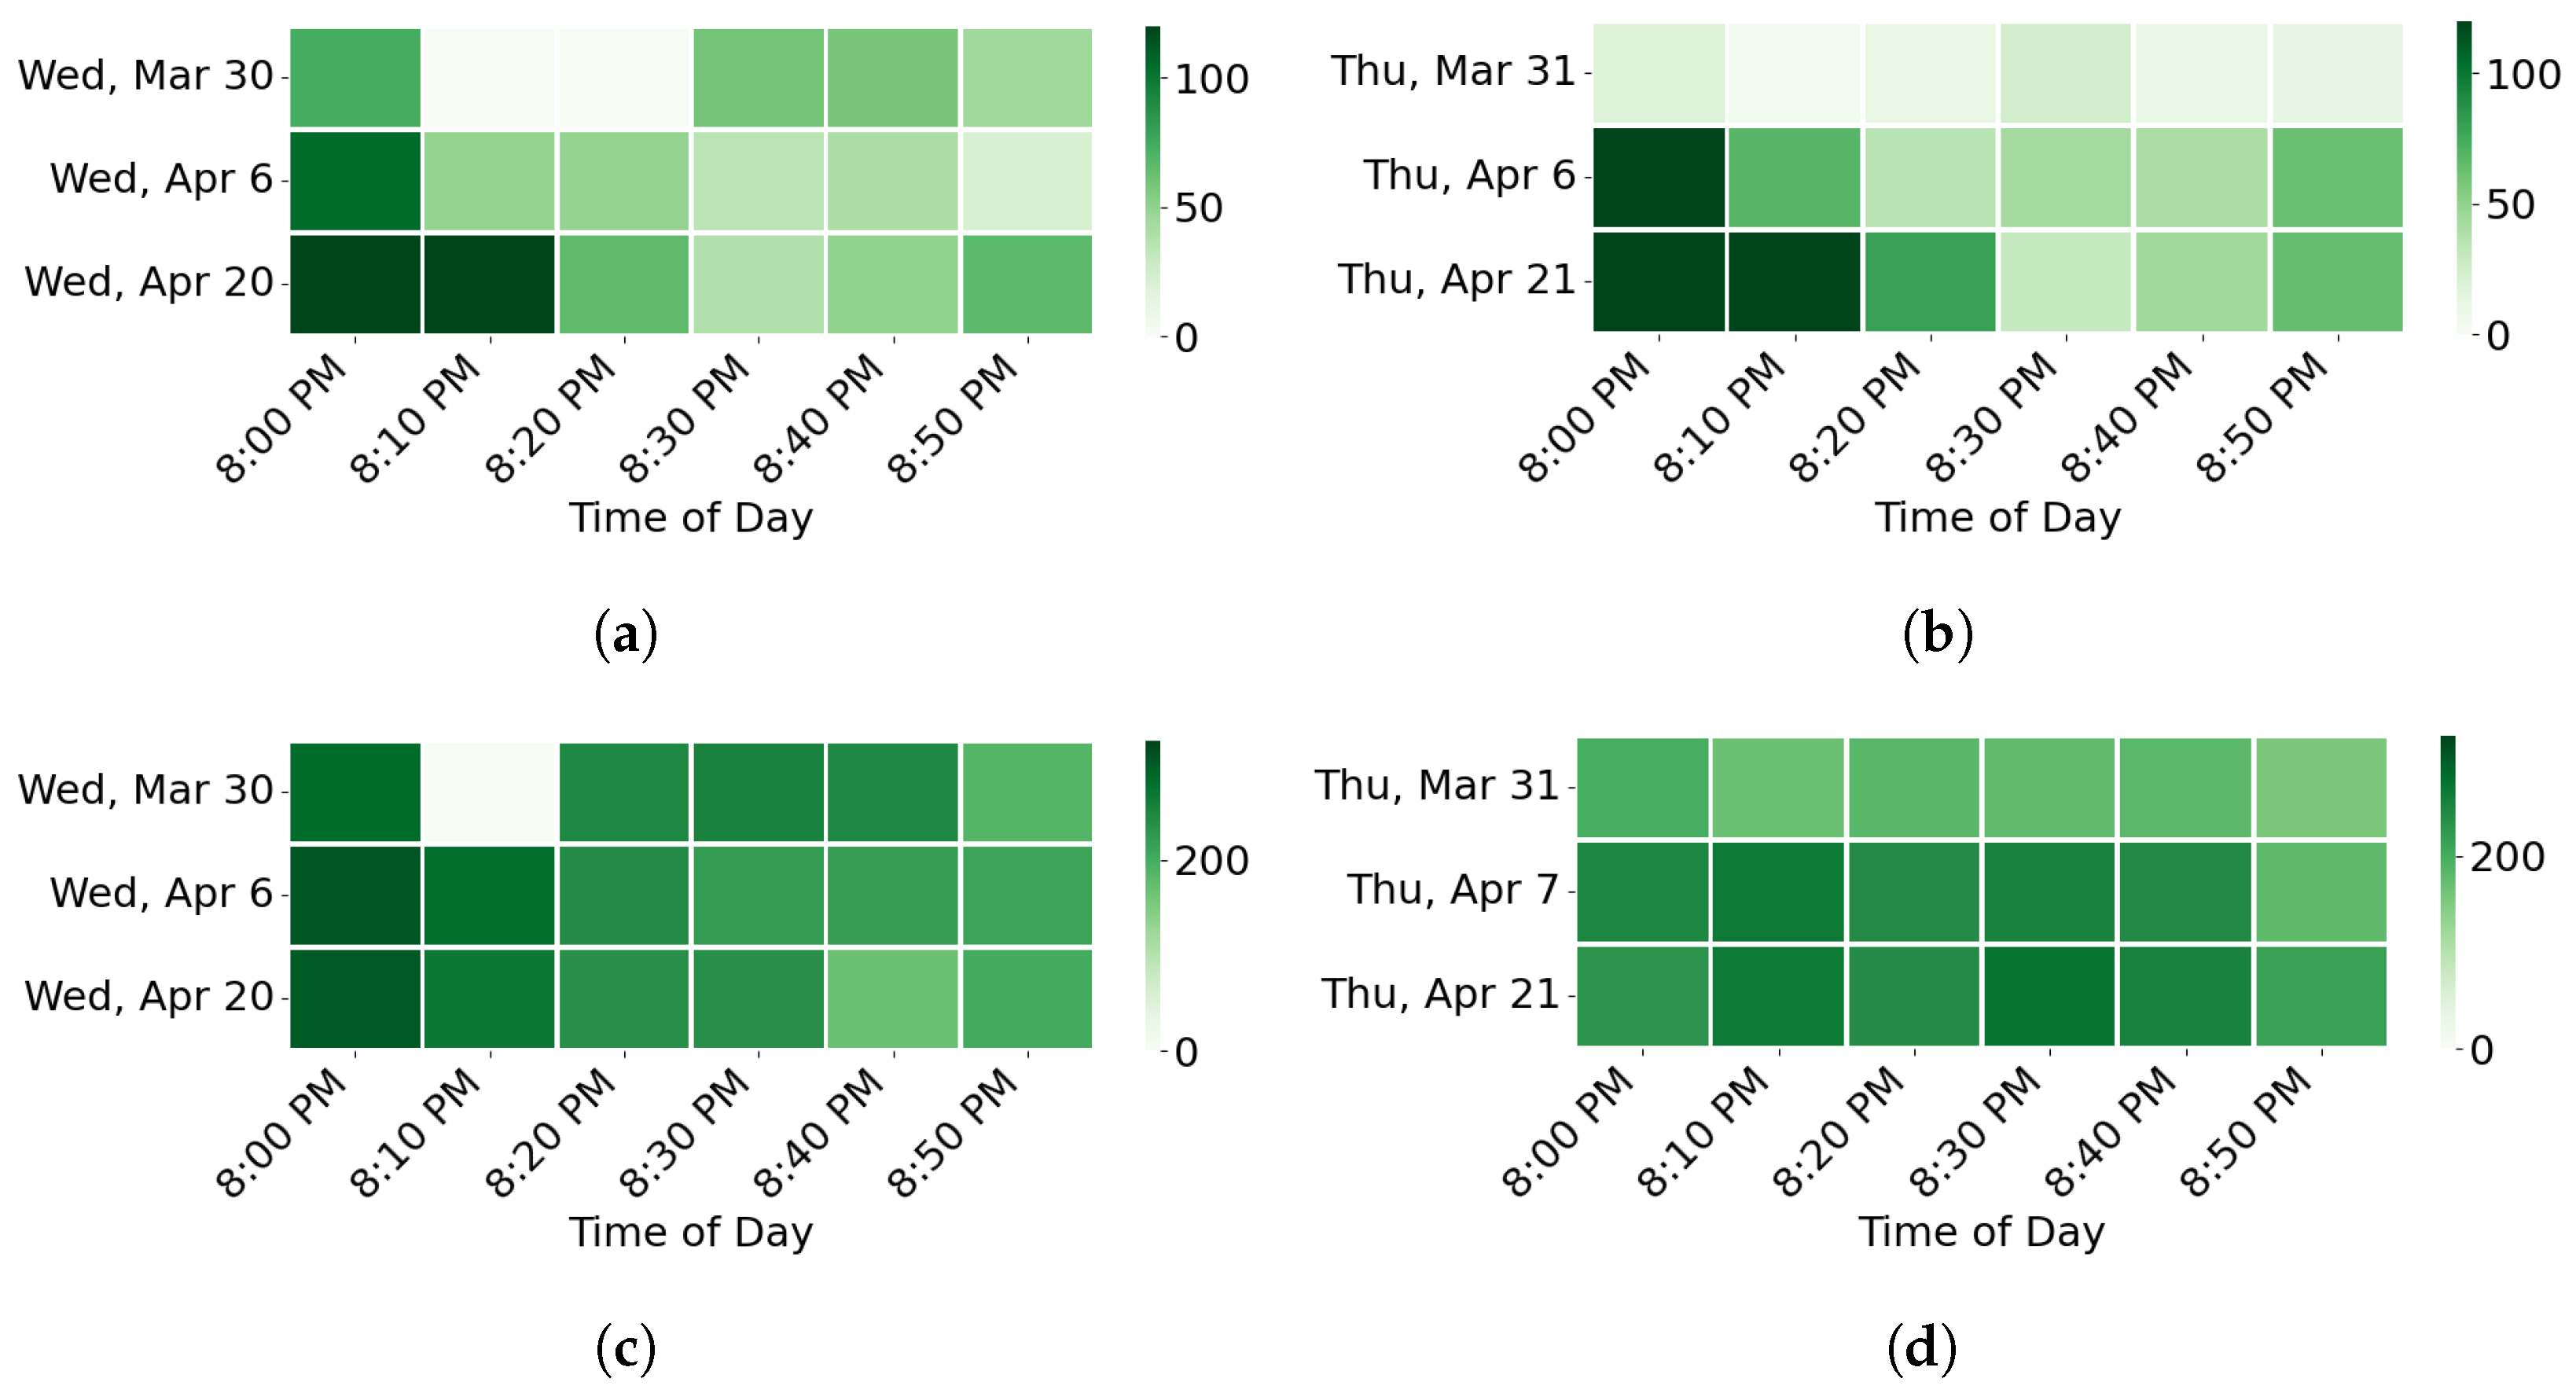
- The intersection-service evaluation module does a fine-grained aggregation of vehicle volume at subcycle levels and outputs an intersection service histogram that bins the number of vehicles entering an intersection in 5-s bins from the start of green. Vehicle volume is collected for 60 s. Vehicles from all cycles within the study period are aggregated to arrive at a single histogram. We use intersection-service evaluation as a proxy for a measure of intersection performance [6]. Specifically, we use the entering vehicle counts for all movements between the 5- and 15-s marks to represent the performance of the intersection. The rationale for aggregating the vehicle counts for 10 s, choosing the start and end points as 5-s and 15-s marks, respectively, is that we exclude the startup loss and measure the volume before saturation headway. This fine-grained aggregation of vehicle volume captures the effect of any temporal issues impacting intersection performance that may otherwise be unnoticeable in hourly aggregations. Examples of temporal issues impacting the performance may be the presence of many pedestrians at the intersection or a change in signal phasing configuration. We use the performance measure to compare two signal phasing configurations at the same intersection.
- We have developed a systematic end-to-end software to analyze intersection data to find intersection safety and performance metrics.
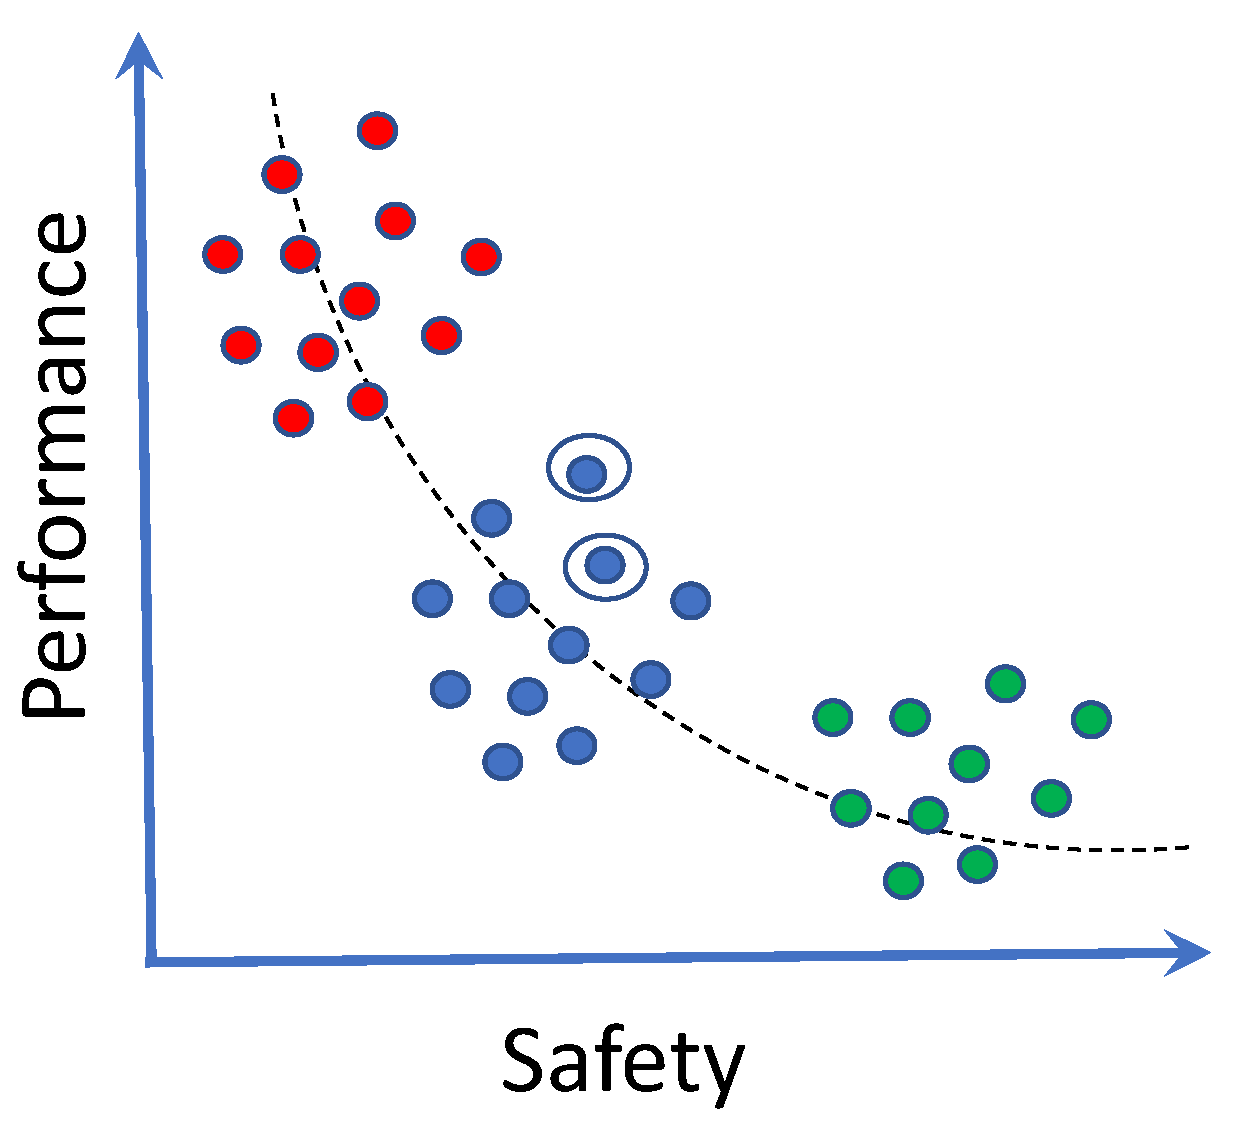
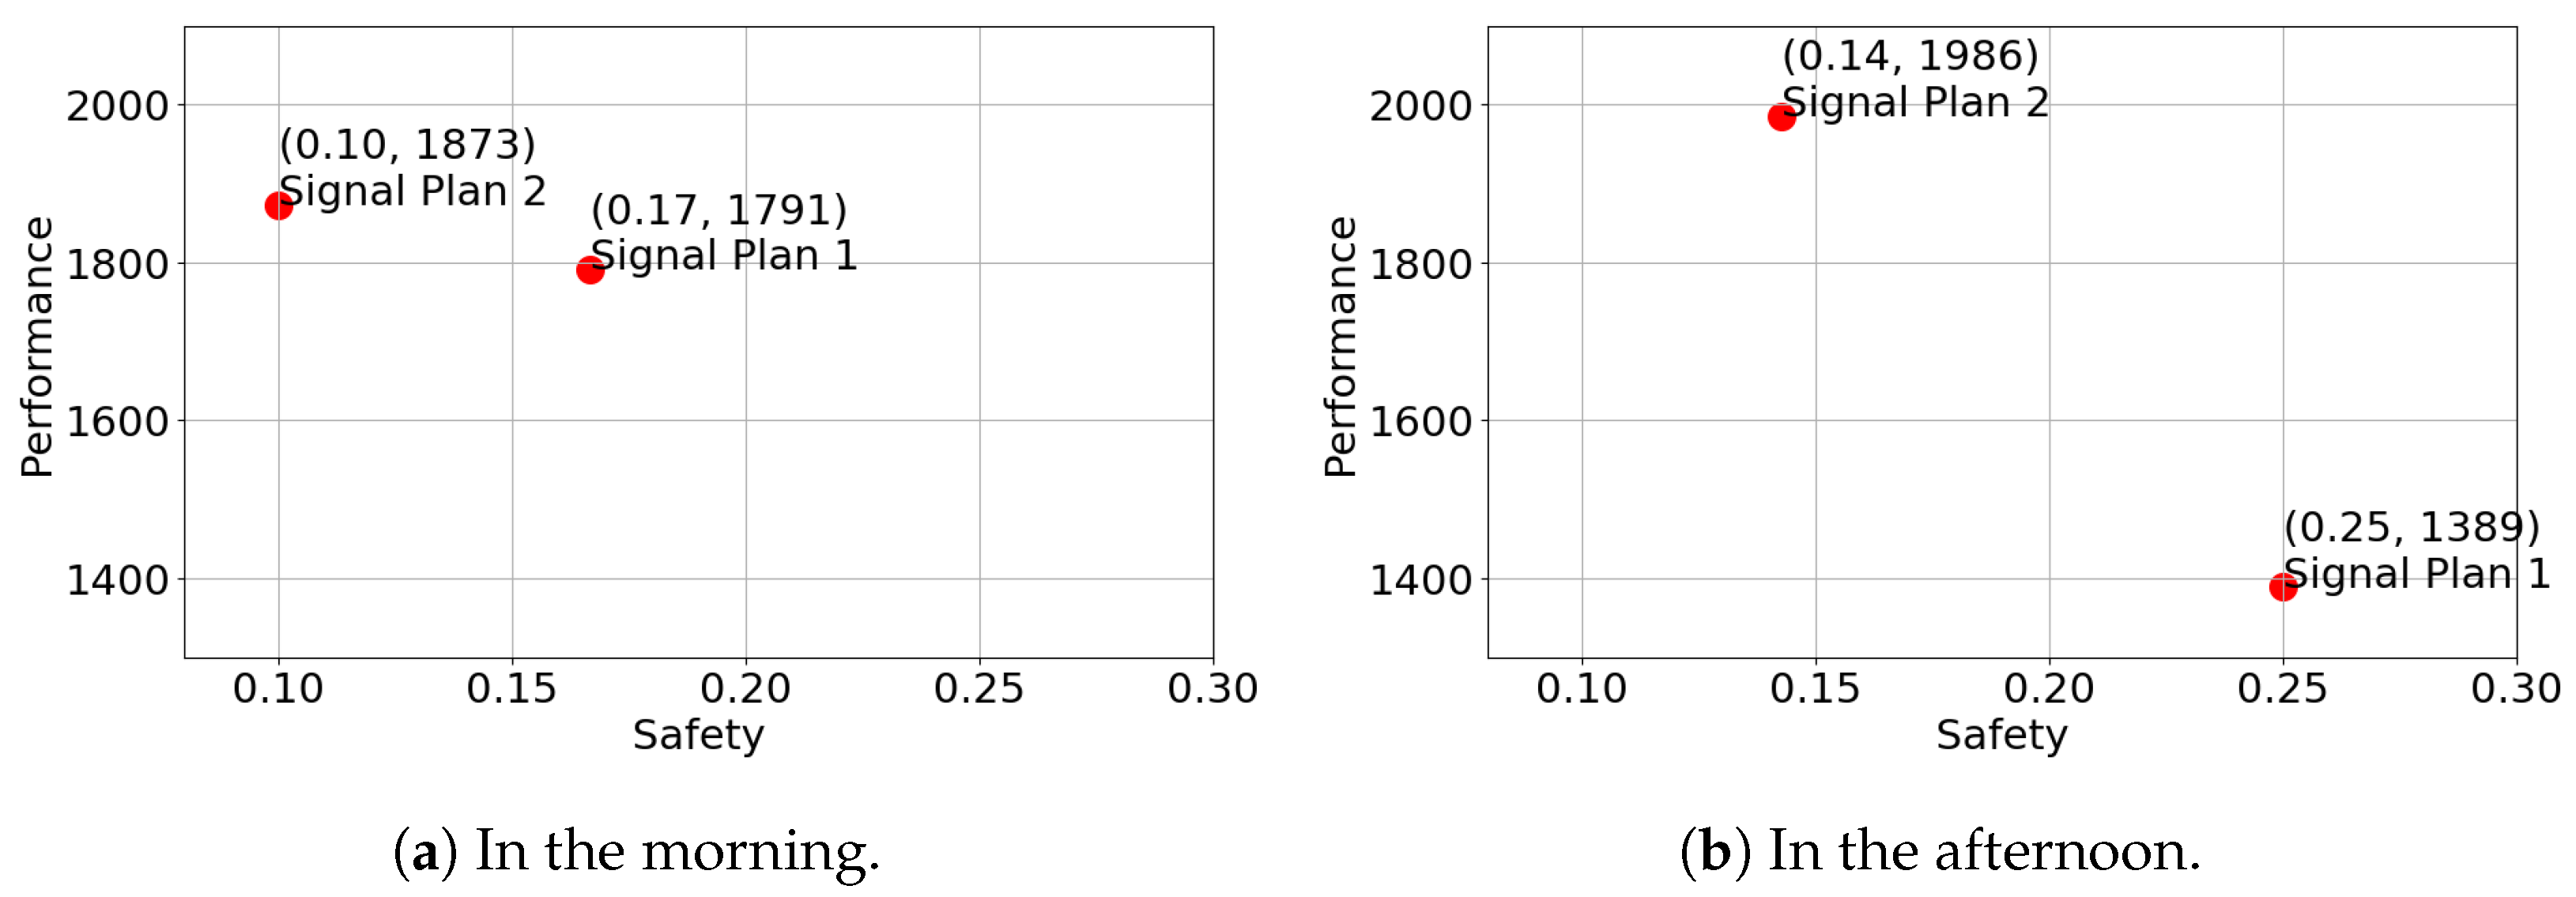
- We have formalized the simultaneous treatment of intersection safety and intersection performance producing performance versus safety trade-off charts
- Additionally, our graphical heatmap output is very helpful to figure out not only the temporal hotspots for pedestrian–vehicle and vehicle–vehicle conflicts, but also the spatial locations. This concise representation that simultaneously captures both the temporal and spatial properties of the conflicts is not described in the existing literature.
2. Related Work
2.1. Surrogate Safety Measures
2.2. Intersection Sensors
2.3. Intersection Safety Analysis Using Video Cameras
3. Background
3.1. Video Analysis
3.2. High-Resolution Controller Log Analysis
3.3. Feature Computation
- Standard near-miss attributes: We compute the standard risk assessment metrics for every event, such as TTC and PET.
- Signal phase information: The fused video and signal phasing dataset is used to determine features, such as the current vehicle signal, current pedestrian signal, and if the event occurs during the beginning (first 10% of the cycle), middle, or end (last 10% of the cycle) of the current signaling phase.
- Trajectory features: The trajectory-related features are the trajectory’s movement, associated phases, and lanes or crosswalks.
- Speed features: These include the current speeds and accelerations for vehicle–vehicle interactions.
- Distance: Spatial distance between two users at the time of the conflict.
3.4. Categorization of Severe Events
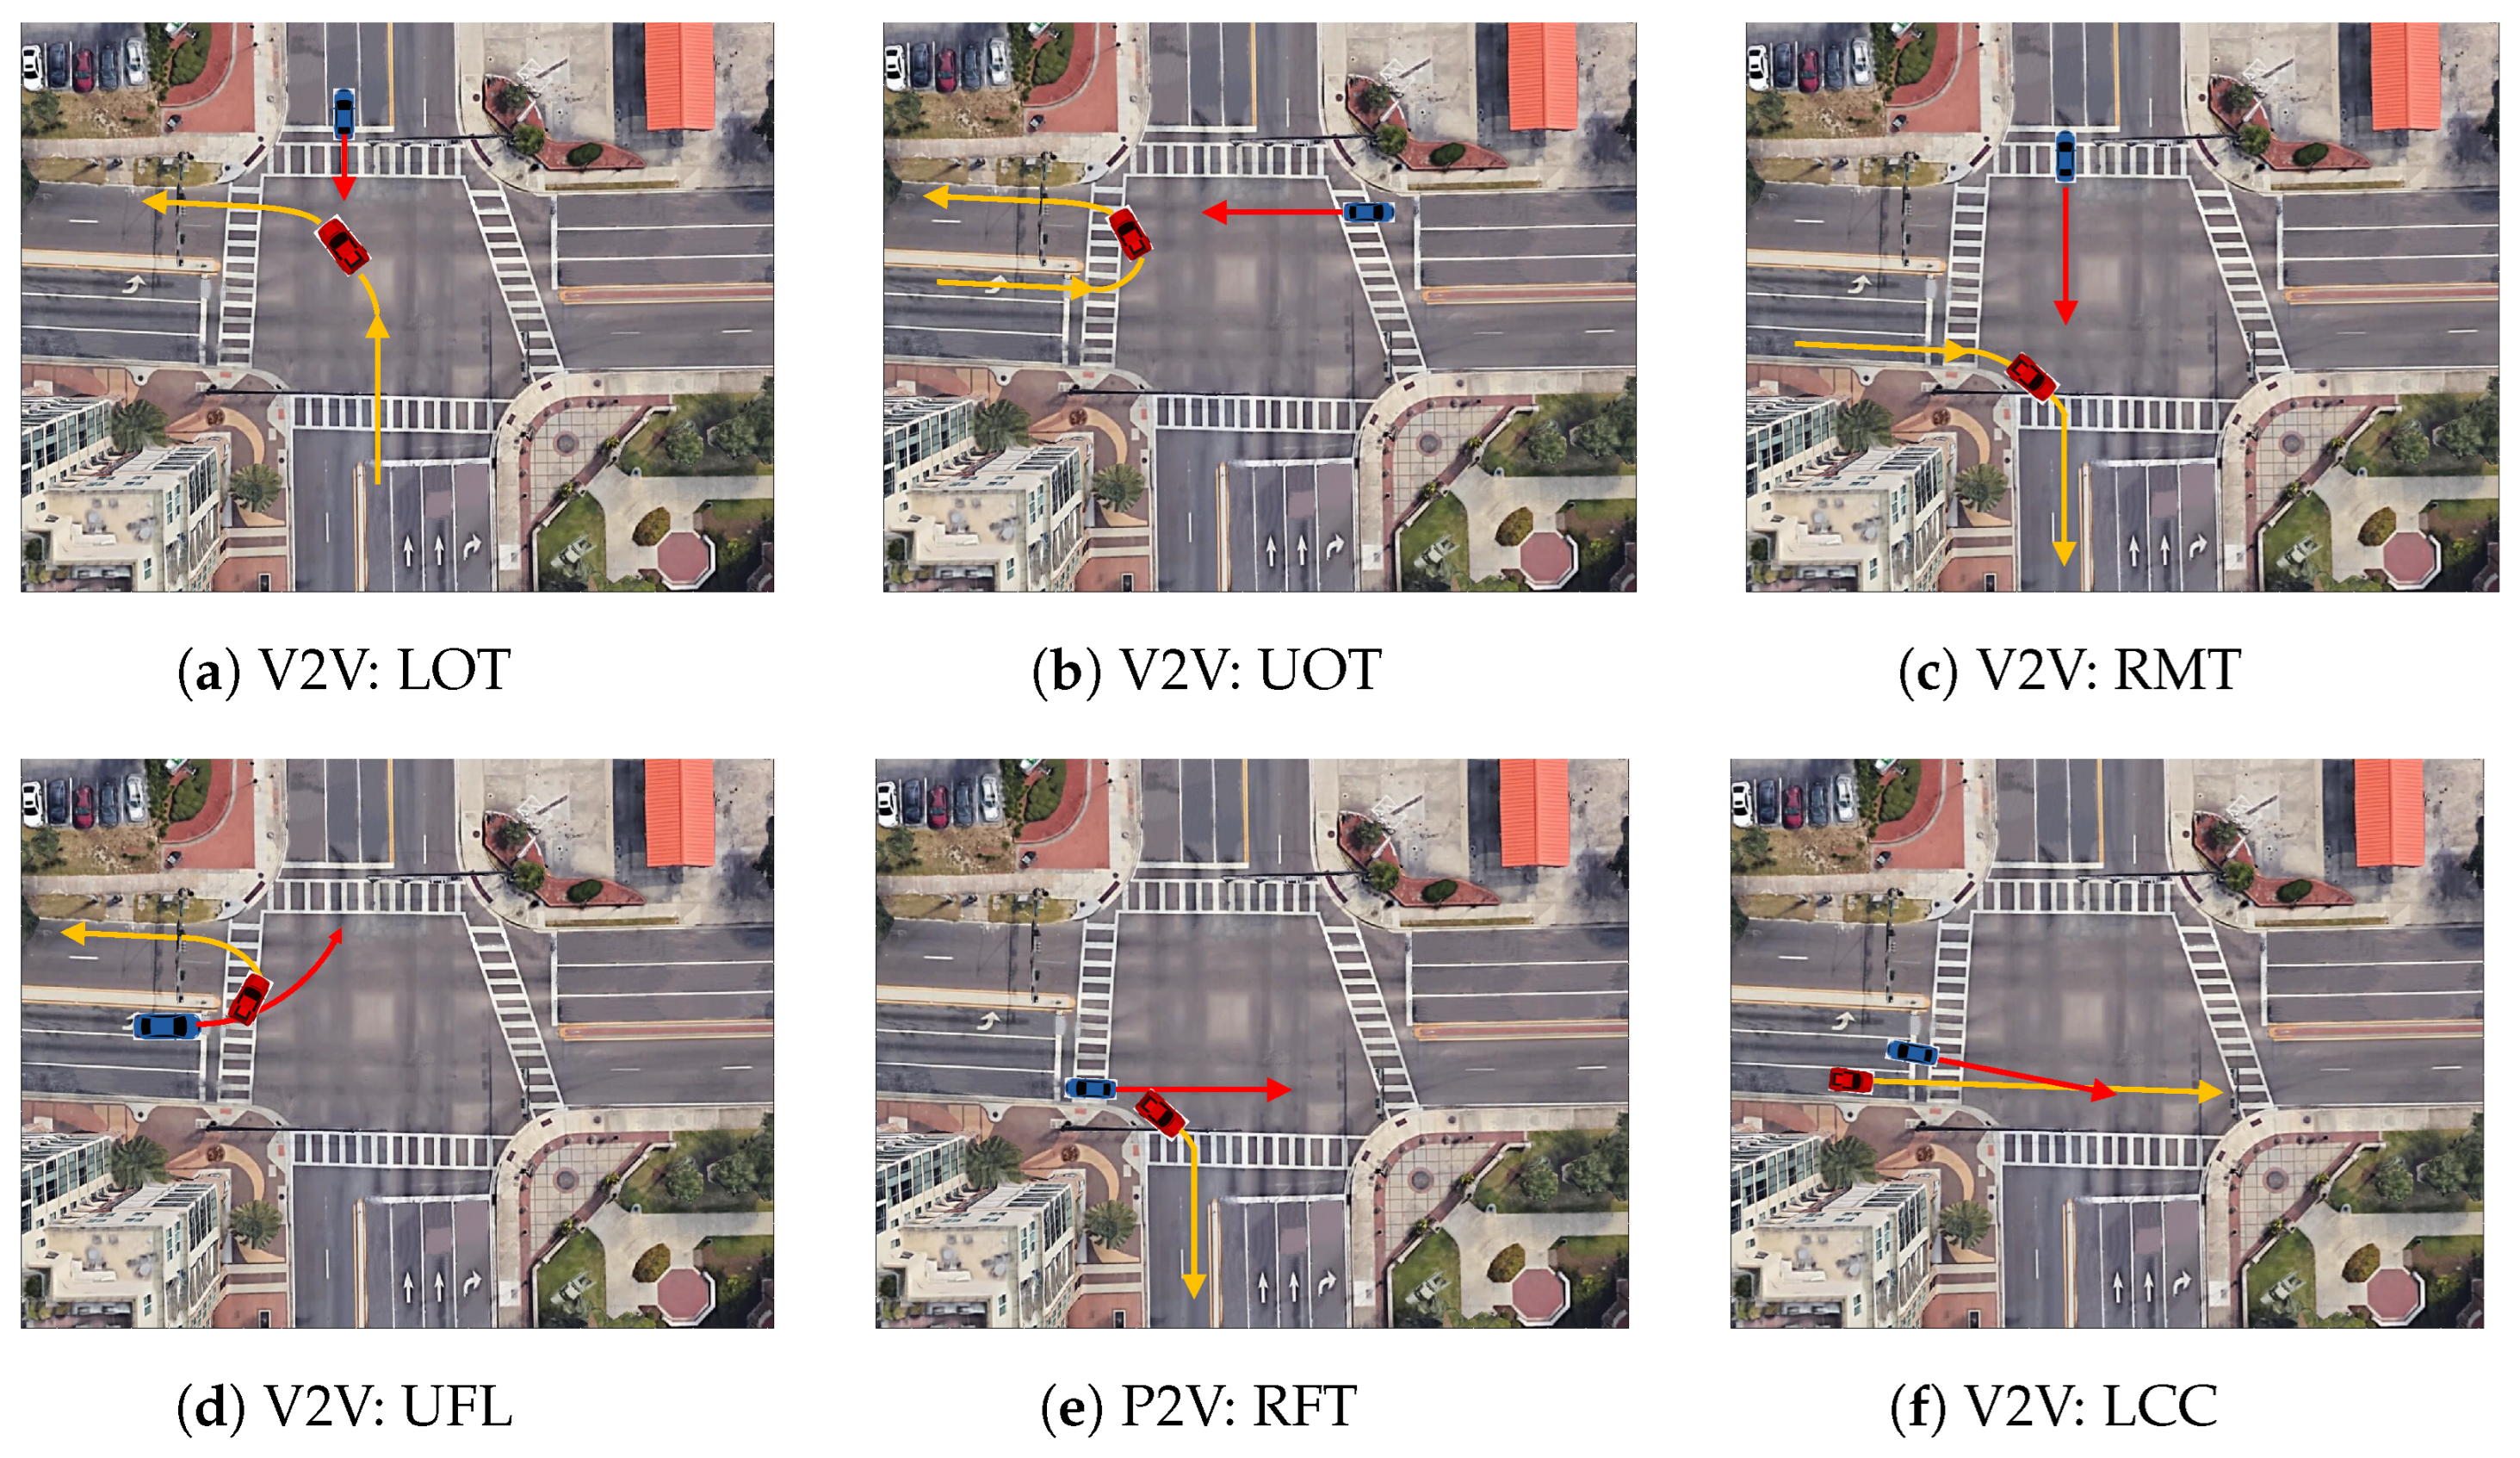
- Left turn and opposing through (LOT): A left-turning vehicle in a permitted phase conflicts with an opposing through movement (Figure 2a).
- U-turn and opposing through (UOT): A U-turning vehicle in a permitted phase conflicts with an opposing through movement (Figure 2b).
- Merging right and through (RMT): A right-turning vehicle merging on the same lane as a through vehicle (Figure 2c).
- U-turn and a following left-turn (UFL): A leading U-turn with a following left-turning vehicle (Figure 2d).
- Right turn and a following through (RFT): A leading right-turning vehicle with a following through vehicle (Figure 2e).
- Lane change and adjacent through (LCC): A lane-changing vehicle conflicting with adjacent through (Figure 2f).
- Rear-end conflicts (REC): A leading vehicle moves slower than the following vehicle in the same lane.
- A U-turn and an adjacent right turn.
4. Methodology
4.1. Evaluation Engine Modules
4.1.1. Volume Hotspot Detection Module
4.1.2. Conflict Hotspot Detection Module
4.1.3. Intersection-Service Evaluation Module
4.1.4. Scenario Comparison Module
- Change in signal phasing or sequencing pattern [51].
- Implementation of leading pedestrian interval (LPI) which typically gives pedestrians a 3–7 s head start when entering an intersection with a corresponding green signal in the same direction of travel [52].
- Implementation of exclusive pedestrian phasing (EPP), which stops all vehicular movement and allows pedestrians access to cross in any direction at the intersection [52].
5. Experiments
| For weekdays: | |
| AM Peak | 07:00–09:30 |
| Off-Peak | 09:30–11:00 |
| Midday Peak | 11:00–14:30 |
| PM Peak | 14:30–18:00 |
5.1. Intersection 1
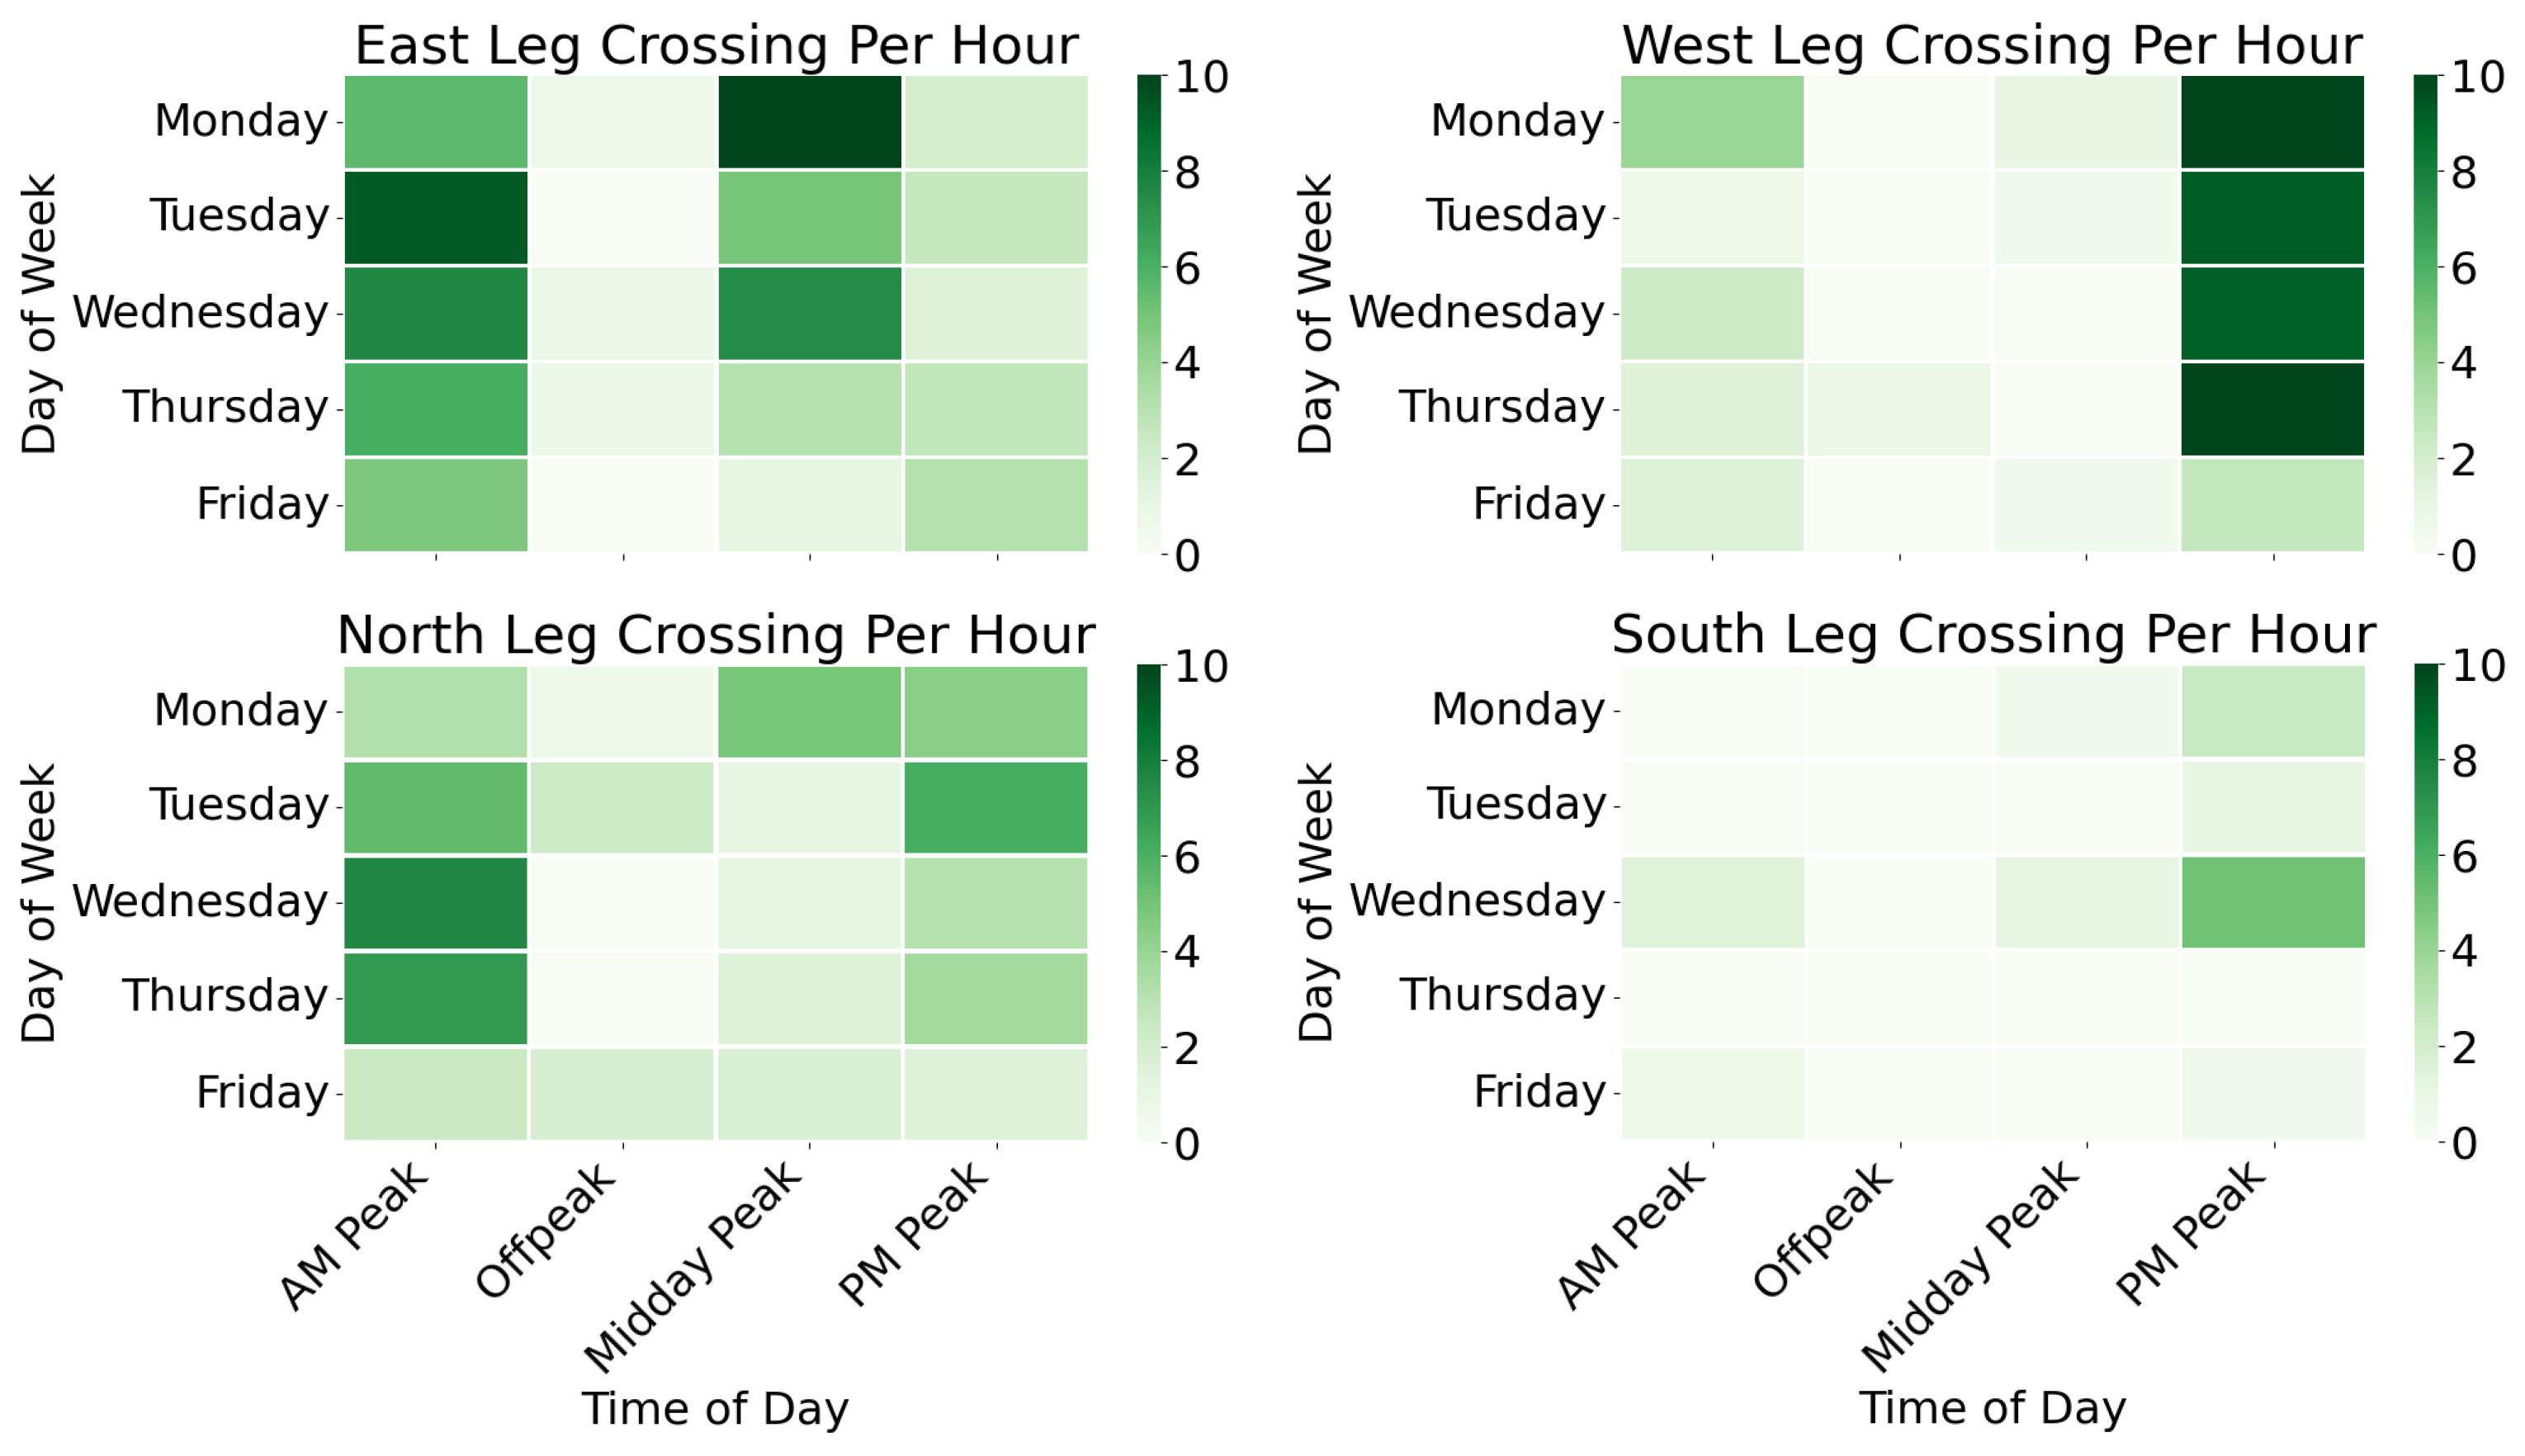
5.1.1. Pedestrian Volume
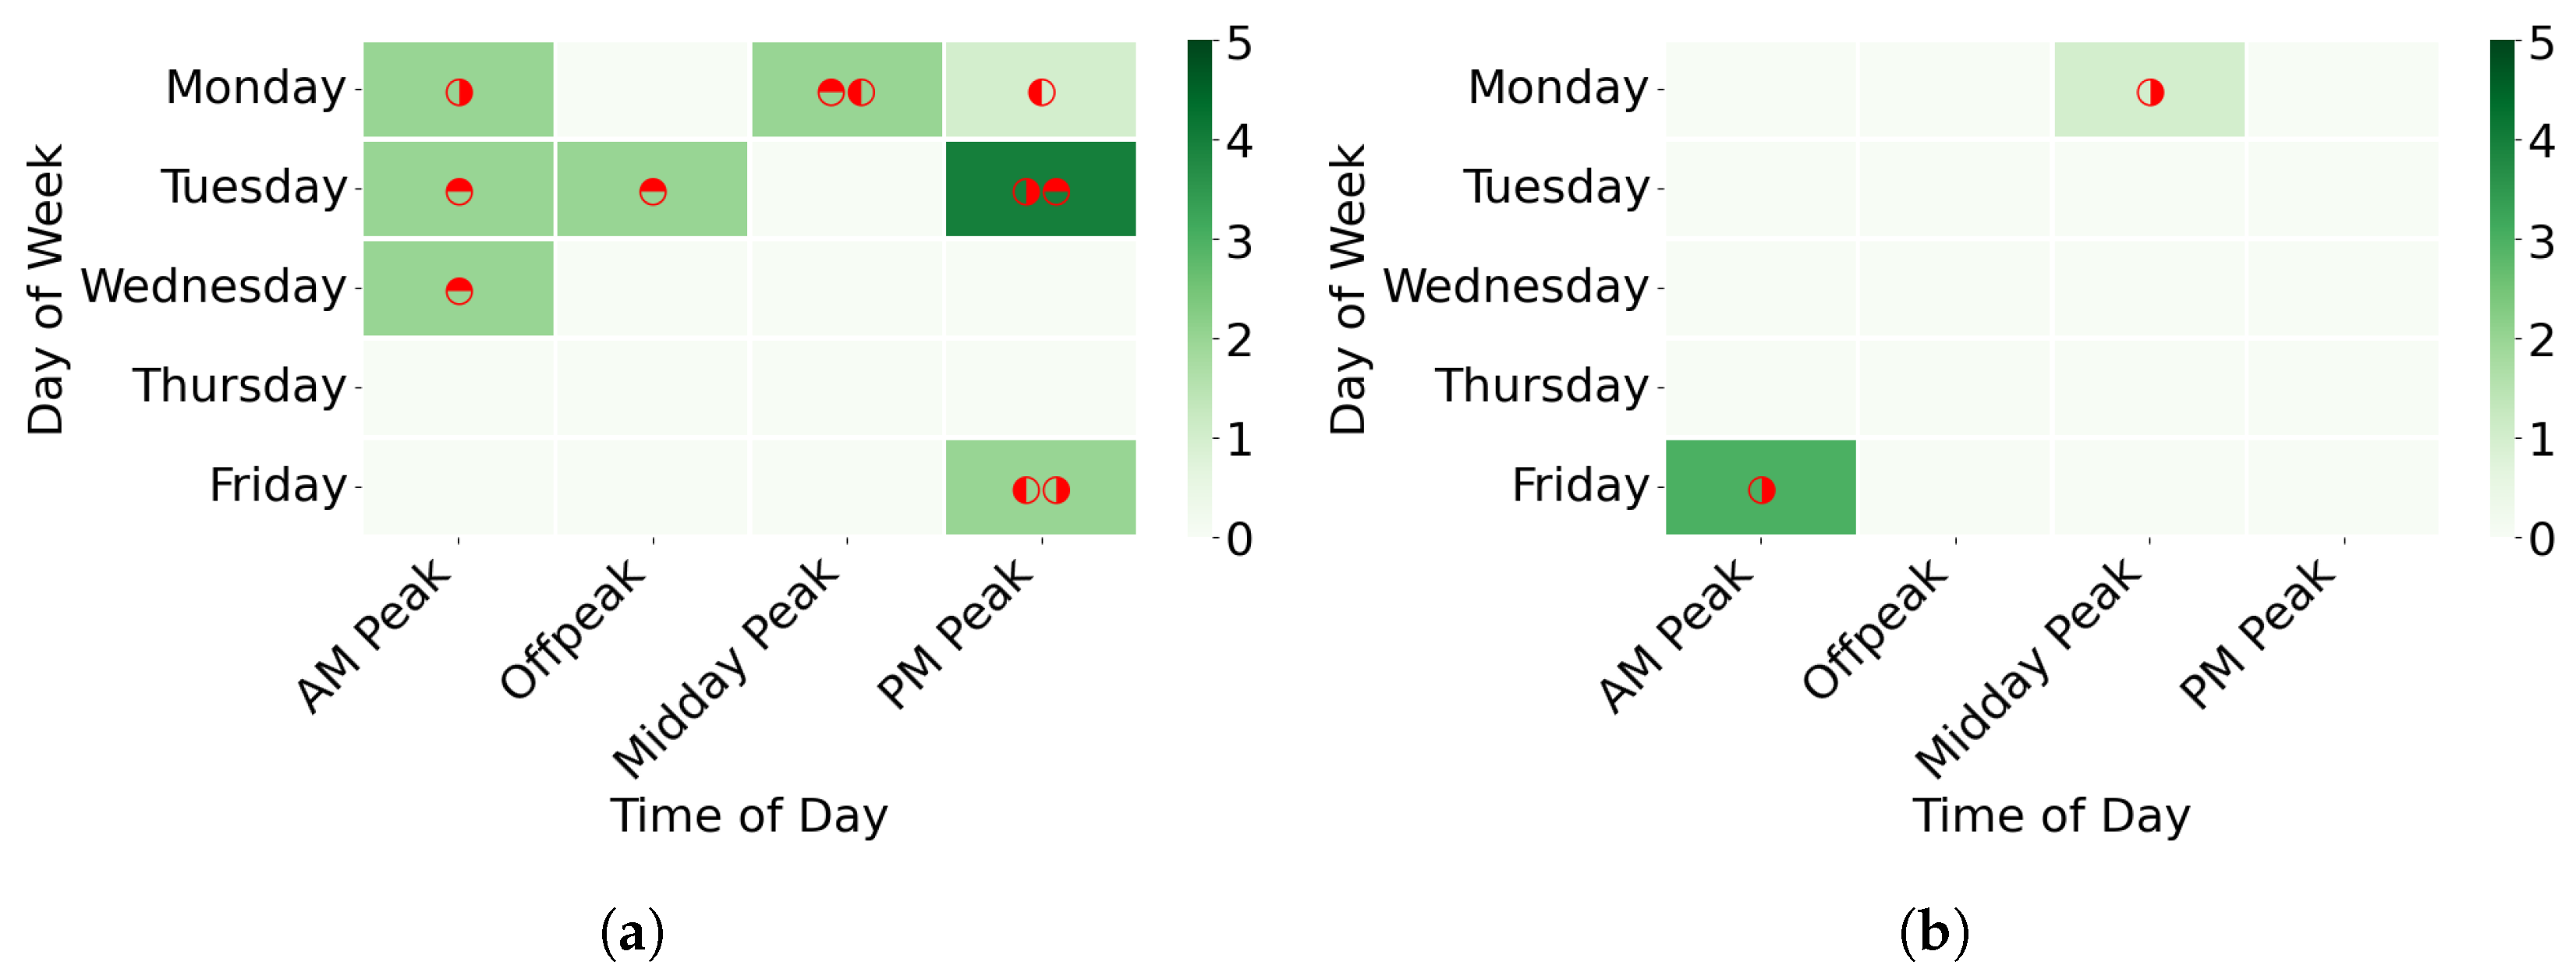
5.1.2. P2V Conflicts and Suggested Countermeasures
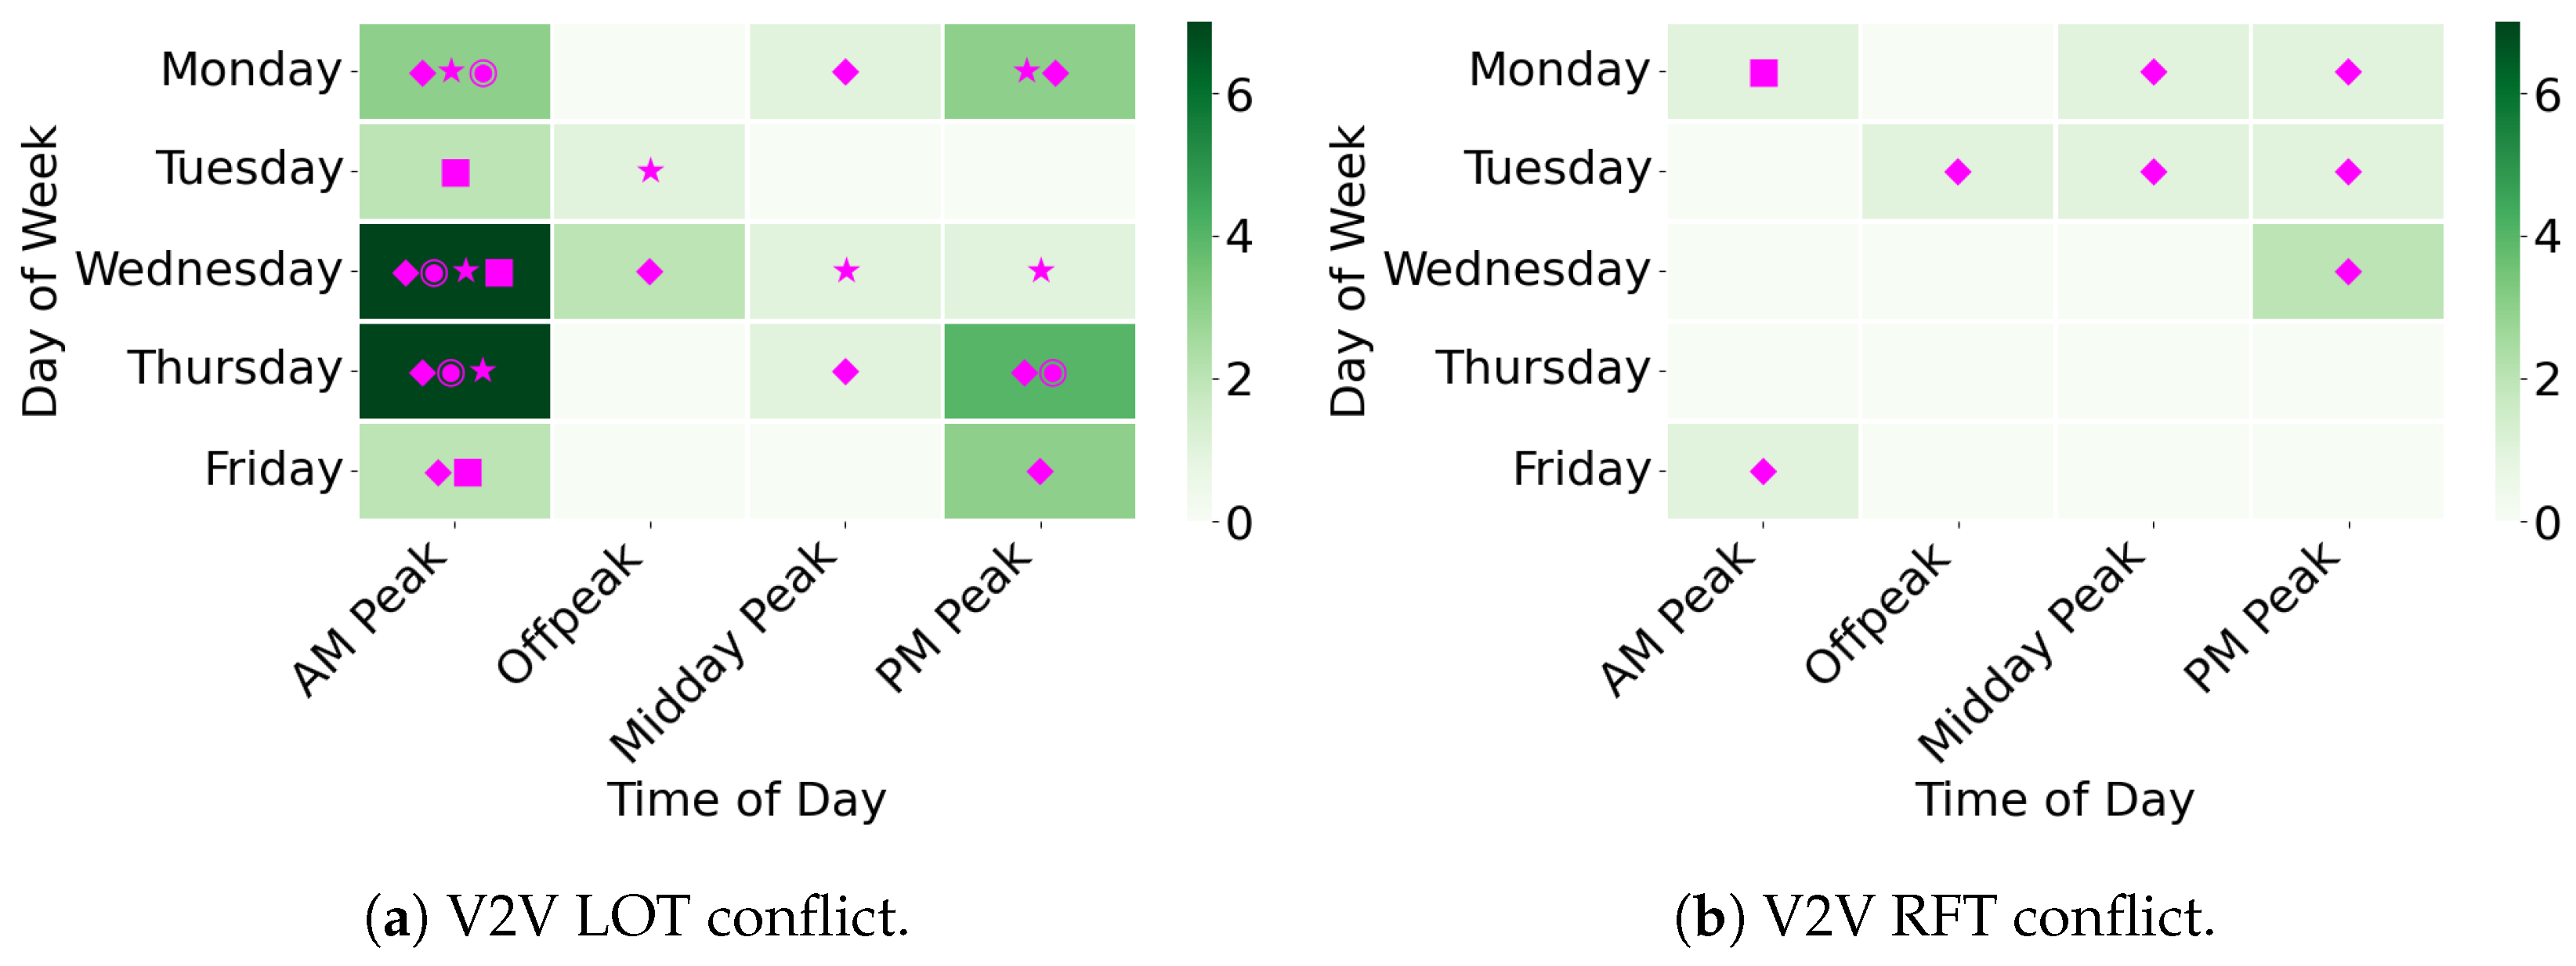
5.1.3. V2V Conflicts
5.1.4. Countermeasure Evaluation for Performance Metric
5.1.5. Countermeasure Evaluation for Safety Metric
5.1.6. Performance–Safety Trade-Off
5.2. Intersection 2
5.2.1. Pedestrian Volume
5.2.2. P2V Conflicts
5.2.3. V2V Conflicts
5.2.4. Suggested Countermeasures
5.2.5. Countermeasure Evaluation: EPP
6. Discussion
Author Contributions
Funding
Institutional Review Board Statement
Informed Consent Statement
Data Availability Statement
Conflicts of Interest
Abbreviations
| UF | University of Florida |
| EBT, WBT, SBT, NBT | East/West/South/North bound through |
| EBL, WBL, NBL, SBL | East/West/North/South bound left |
| EBR, WBR, NBR, SBR | East/West/North/South bound right |
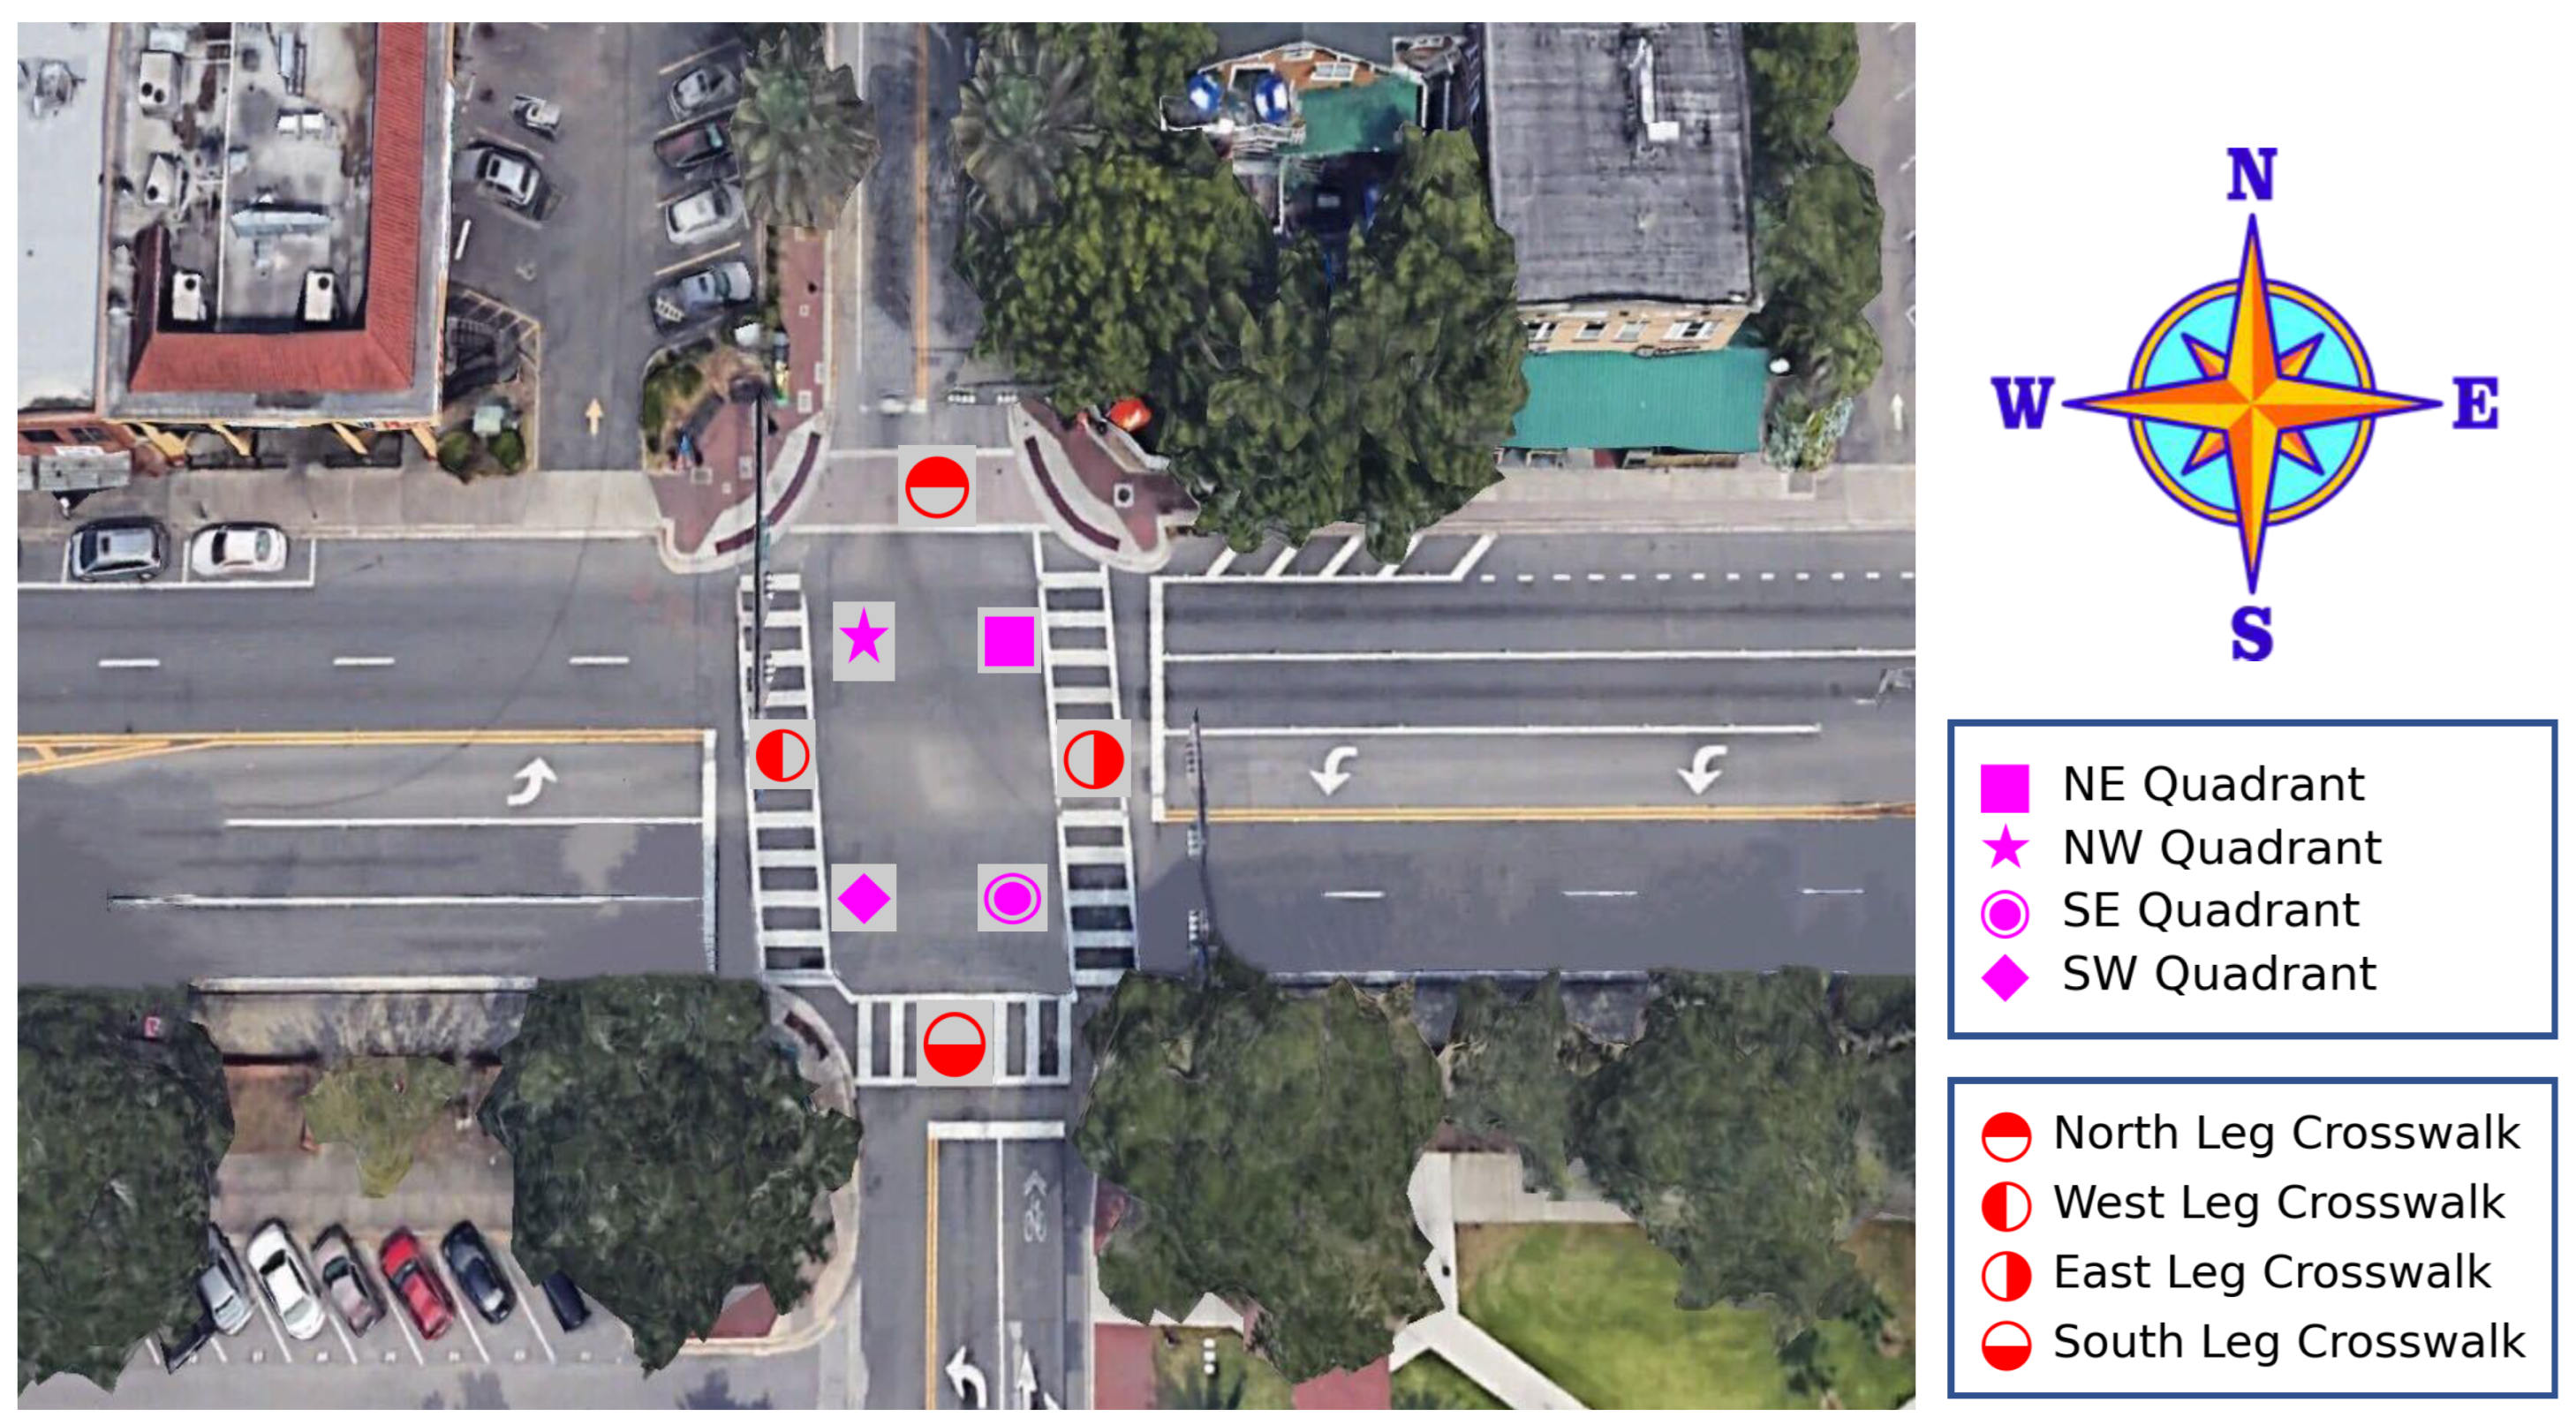
| NE, NW, SE, SW | Northeast, Northwest, Southeast, Southwest |
| P2V, V2V | Pedestrian–vehicle, Vehicle–vehicle |
| LOT | Left opposing through |
| RMT | Right merging through |
| LPI | Leading Phase Interval |
| EPP | Exclusive pedestrian phasing |
| RFT | Right following through |
| REC | Rear end conflict |
| FDOT | Florida Department of Transportation |
| USDOT | U.S. Department of Transportation |
| SOP | Signal Operating Procedure |
| TPS | Thin-plate spline |
| DB | Database |
| TTC | Time-to-collision |
| PET | Post-encroachment time |
| ATC | Advanced Traffic Controller |
References
- Fatality Analysis Reporting System (FARS). Available online: https://www.nhtsa.gov/research-data/fatality-analysis-reporting-system-fars (accessed on 15 August 2022).
- Historical Item Averages Cost. Available online: https://www.fdot.gov/programmanagement/estimates/documents/historicalitemaveragecostsreports (accessed on 10 June 2022).
- Takeda, H.; Yamasaki, M.; Moriya, T.; Minakawa, T.; Beniyama, F.; Koike, T. A Video-Based Virtual Reality System. In VRST ’99: Proceedings of the ACM Symposium on Virtual Reality Software and Technology; Association for Computing Machinery: New York, NY, USA, 1999; pp. 19–25. [Google Scholar] [CrossRef]
- Banerjee, T.; Chen, K.; Almaraz, A.; Sengupta, R.; Karnati, Y.; Bryce Grame, E.P.; Poddar, S.; Schenck, R.; Dilmore, J.; Srinivasan, S.; et al. A Modern Intersection Data Analytics System for Pedestrian and Vehicular Safety. In Proceedings of the IEEE 25th International Conference on Intelligent Transportation Systems (ITSC), Macau, China, 8–12 October 2022. [Google Scholar]
- Traffic Conflict Techniques for Safety and Operations—Observers Manual. Available online: https://www.fhwa.dot.gov/publications/research/safety/88027/88027.pdf (accessed on 19 April 2022).
- Traffic Analysis Toolbox Volume VI: Definition, Interpretation, and Calculation of Traffic Analysis Tools Measures of Effectiveness. Available online: https://ops.fhwa.dot.gov/publications/fhwahop08054/sect6.htm (accessed on 2 September 2022).
- Gettman, D.; Head, L. Surrogate Safety Measures from Traffic Simulation Models. Transp. Res. Rec. 2003, 1840, 104–115. [Google Scholar] [CrossRef]
- Wang, C.; Stamatiadis, N. Surrogate Safety Measure for Simulation-Based Conflict Study. Transp. Res. Rec. 2013, 2386, 72–80. [Google Scholar] [CrossRef]
- Lord, D.; Mannering, F. The statistical analysis of crash-frequency data: A review and assessment of methodological alternatives. Transp. Res. Part Policy Pract. 2010, 44, 291–305. [Google Scholar] [CrossRef]
- Abdel-Aty, M.; Pande, A. Crash data analysis: Collective vs. individual crash level approach. J. Saf. Res. 2007, 38, 581–587. [Google Scholar] [CrossRef]
- Hayward, J.C. Near miss determination through use of a scale of danger. Highw. Res. Rec. 1972, 384, 24–34. [Google Scholar]
- Allen, B.L.; Shin, B.T.; Cooper, P.J. Analysis of traffic conflicts and collisions. Transp. Res. Rec. 1978, 667, 67–74. [Google Scholar]
- Jiang, X.; Zhang, G.; Bai, W.; Fan, W. Safety evaluation of signalized intersections with left-turn waiting area in China. Accid. Anal. Prev. 2016, 95, 461–469. [Google Scholar] [CrossRef]
- Samara, L.; St-Aubin, P.; Loewenherz, F.; Budnick, N.; Miranda-Moreno, L. Video-Based Network-Wide Surrogate Safety Analysis to Support a Proactive Network Screening Using Connected Cameras: Case Study in the City of Bellevue (WA); Technical Report; Transportation Research Board: Washington, DC, USA, 2021. [Google Scholar]
- Sayed, T.; Zaki, M.H.; Autey, J. Automated safety diagnosis of vehicle-bicycle interactions using computer vision analysis. Saf. Sci. 2013, 59, 163–172. [Google Scholar] [CrossRef]
- Mahmud, S.S.; Ferreira, L.; Hoque, M.S.; Tavassoli, A. Application of proximal surrogate indicators for safety evaluation: A review of recent developments and research needs. IATSS Res. 2017, 41, 153–163. [Google Scholar] [CrossRef]
- Shi, X.; Wong, Y.; Li, M.; Chai, C. Key risk indicators for accident assessment conditioned on pre-crash vehicle trajectory. Accid. Anal. Prev. 2018, 117, 346–356. [Google Scholar] [CrossRef]
- Arun, A.; Haque, M.M.; Bhaskar, A.; Washington, S.; Sayed, T. A systematic mapping review of surrogate safety assessment using traffic conflict techniques. Accid. Anal. Prev. 2021, 153, 106016. [Google Scholar] [CrossRef] [PubMed]
- Amundsen, F.H. Workshop on Traffic Conflicts. In Proceedings: First Workshop on Traffic Conflicts Oslo 77; Norwegian Council for Scientific and Industrial Research: Oslo, Norway, 1977. [Google Scholar]
- Hydén, C.; Linderholm, L. The Swedish Traffic-Conflicts Technique. In International Calibration Study of Traffic Conflict Techniques; Springer: Berlin/Heidelberg, Germany, 1984; pp. 133–139. [Google Scholar] [CrossRef]
- Vogel, K. A comparison of headway and time to collision as safety indicators. Accid. Anal. Prev. 2003, 35, 427–433. [Google Scholar] [CrossRef]
- Peesapati, L.N.; Hunter, M.P.; Rodgers, M.O. Evaluation of Postencroachment Time as Surrogate for Opposing Left-Turn Crashes. Transp. Res. Rec. 2013, 2386, 42–51. [Google Scholar] [CrossRef]
- Feng, G.; Klauer, S.G.; McGill, M.; Dingus, T. Evaluating the Relationship Between Near-Crashes and Crashes: Can Near-Crashes Serve as a Surrogate Safety Metric for Crashes? Transp. Res. Board 2010, 811, 382. [Google Scholar]
- Johnsson, C.; Laureshyn, A.; Ceunynck, T.D. In search of surrogate safety indicators for vulnerable road users: A review of surrogate safety indicators. Transp. Rev. 2018, 38, 765–785. [Google Scholar] [CrossRef]
- Fu, T.; Miranda-Moreno, L.; Saunier, N. A novel framework to evaluate pedestrian safety at non-signalized locations. Accid. Anal. Prev. 2018, 111, 23–33. [Google Scholar] [CrossRef]
- Chen, W.; Wang, T.; Wang, Y.; Li, Q.; Xu, Y.; Niu, Y. Lane-based Distance-Velocity model for evaluating pedestrian–vehicle interaction at non-signalized locations. Accid. Anal. Prev. 2022, 176, 106810. [Google Scholar] [CrossRef]
- Yang, D.; Xie, K.; Ozbay, K.; Yang, H. Fusing crash data and surrogate safety measures for safety assessment: Development of a structural equation model with conditional autoregressive spatial effect and random parameters. Accid. Anal. Prev. 2021, 152, 105971. [Google Scholar] [CrossRef]
- Astarita, V.; Festa, D.C.; Giofrè, V.P.; Guido, G. Surrogate Safety Measures from Traffic Simulation Models a Comparison of different Models for Intersection Safety Evaluation. Transp. Res. Procedia 2019, 37, 219–226. [Google Scholar] [CrossRef]
- Morando, M.; Tian, Q.; Truong, L.; Vu, H. Studying the Safety Impact of Autonomous Vehicles Using Simulation-Based Surrogate Safety Measures. J. Adv. Transp. 2018, 2018. [Google Scholar] [CrossRef]
- Wang, C.; Xie, Y.; Huang, H.; Liu, P. A review of surrogate safety measures and their applications in connected and automated vehicles safety modeling. Accid. Anal. Prev. 2021, 157, 106157. [Google Scholar] [CrossRef] [PubMed]
- Anderson, R. Electromagnetic loop vehicle detectors. IEEE Trans. Veh. Technol. 1970, 19, 23–30. [Google Scholar] [CrossRef]
- Karnati, Y.; Mahajan, D.; Rangarajan, A.; Ranka, S. Machine Learning Algorithms for Traffic Interruption Detection. In Proceedings of the 2020 Fifth International Conference on Fog and Mobile Edge Computing (FMEC), Paris, France, 20–23 April 2020; pp. 231–236. [Google Scholar] [CrossRef]
- Kamijo, S.; Matsushita, Y.; Ikeuchi, K.; Sakauchi, M. Traffic monitoring and accident detection at intersections. IEEE Trans. Intell. Transp. Syst. 2000, 1, 108–118. [Google Scholar] [CrossRef]
- Zhao, H.; Cui, J.; Zha, H.; Katabira, K.; Shao, X.; Shibasaki, R. Monitoring an intersection using a network of laser scanners. In Proceedings of the 2008 11th International IEEE Conference on Intelligent Transportation Systems, Beijing, China, 12–15 October 2008; pp. 428–433. [Google Scholar] [CrossRef]
- Ling, B.; Zeifman, M.I.; Gibson, D.R. Multiple pedestrian detection using IR LED stereo camera. In Proceedings of the Intelligent Robots and Computer Vision XXV: Algorithms, Techniques, and Active Vision; Casasent, D.P., Hall, E.L., Röning, J., Eds.; International Society for Optics and Photonics (SPIE): Bellingham, WA, USA, 2007; Volume 6764, p. 67640A. [Google Scholar] [CrossRef]
- Messelodi, S.; Modena, C.; Zanin, M. A computer vision system for the detection and classification of vehicles at urban road intersections. Pattern Anal. Appl. 2005, 8, 17–31. [Google Scholar] [CrossRef]
- Schwach, J.; Morris, T.; Michalopoulos, P. Rapidly Deployable Low-Cost Traffic Data and Video Collection Device; CTS (Series: Minneapolis, Minn.); 750 Intelligent Transportation Systems Institute, Center for Transportation Studies, University of Minnesota: Minneapolis, MN, USA, 2009. [Google Scholar]
- Datondji, S.R.E.; Dupuis, Y.; Subirats, P.; Vasseur, P. A Survey of Vision-Based Traffic Monitoring of Road Intersections. IEEE Trans. Intell. Transp. Syst. 2016, 17, 2681–2698. [Google Scholar] [CrossRef]
- Zhang, X.; Feng, Y.; Angeloudis, P.; Demiris, Y. Monocular Visual Traffic Surveillance: A Review. IEEE Trans. Intell. Transp. Syst. 2022, 23, 14148–14165. [Google Scholar] [CrossRef]
- Saunier, N.; Sayed, T.; Ismail, K. Large-Scale Automated Analysis of Vehicle Interactions and Collisions. Transp. Res. Rec. 2010, 2147, 42–50. [Google Scholar] [CrossRef]
- Ismail, K. Application of Computer Vision Techniques for Automated Road Safety Analysis and Traffic Data Collection. Ph.D. Thesis, University of British Columbia, Vancouver, BC, Canada, 2010. [Google Scholar]
- Stipancic, J.; Miranda-Moreno, L.; Saunier, N.; Labbe, A. Network screening for large urban road networks: Using GPS data and surrogate measures to model crash frequency and severity. Accid. Anal. Prev. 2019, 125, 290–301. [Google Scholar] [CrossRef]
- St-Aubin, P.; Saunier, N.; Miranda-Moreno, L.; Ismail, K. Use of Computer Vision Data for Detailed Driver Behavior Analysis and Trajectory Interpretation at Roundabouts. Transp. Res. Rec. 2013, 2389, 65–77. [Google Scholar] [CrossRef]
- Kronprasert, N.; Sutheerakul, C.; Satiennam, T.; Luathep, P. Intersection Safety Assessment Using Video-Based Traffic Conflict Analysis: The Case Study of Thailand. Sustainability 2021, 13, 12722. [Google Scholar] [CrossRef]
- Bochkovskiy, A.; Wang, C.; Liao, H.M. YOLOv4: Optimal Speed and Accuracy of Object Detection. arXiv 2020, arXiv:2004.10934. [Google Scholar]
- Wojke, N.; Bewley, A.; Paulus, D. Simple online and realtime tracking with a deep association metric. In Proceedings of the 2017 IEEE International Conference on Image Processing (ICIP), Beijing, China, 17–20 September 2017; pp. 3645–3649. [Google Scholar] [CrossRef]
- Wood, S.N. Thin plate regression splines. J. R. Stat. Soc. Ser. (Stat. Methodol.) 2003, 65, 95–114. [Google Scholar] [CrossRef]
- Mundhenk, T.N.; Rivett, M.J.; Liao, X.; Hall, E.L. Techniques for fisheye lens calibration using a minimal number of measurements. In Proceedings of the Intelligent Robots and Computer Vision XIX: Algorithms, Techniques, and Active Vision; Casasent, D.P., Ed.; International Society for Optics and Photonics: Bellingham, WA, USA, 2000; Volume 4197, pp. 181–190. [Google Scholar] [CrossRef]
- Huang, X.; Banerjee, T.; Chen, K.; Varanasi, N.; Rangarajan, A.; Ranka, S. Machine Learning based Video Processing for Real-time Near-Miss Detection. In Proceedings of the 6th International Conference on Vehicle Technology and Intelligent Transport Systems (VEHITS), Prague, Czech Republic, 2–4 May 2020; pp. 169–179. [Google Scholar] [CrossRef]
- Zhou, Q.; Mohammadi, R.; Zhao, W.; Zhang, K.; Zhang, L.; Wang, Y.; Roncoli, C.; Hu, S. Queue Profile Identification at Signalized Intersections with High-Resolution Data from Drones. In Proceedings of the 2021 7th International Conference on Models and Technologies for Intelligent Transportation Systems (MT-ITS), Heraklion, Greece, 16–17 June 2021; pp. 1–6. [Google Scholar] [CrossRef]
- Signal Operating Procedure. Available online: https://www.fdot.gov/docs/default-source/roadway/DS/13/IDx/17870.pdf (accessed on 5 November 2021).
- Safety. Available online: https://safety.fhwa.dot.gov (accessed on 20 February 2022).


| ID | Intersection | Speed Limit (mph) | Pedestrian Presence (%) | Left Turn Type | Flashing Yellow Arrow | Right Turn on Red |
|---|---|---|---|---|---|---|
| 1 | NW 23rd Ave. and NW 55th St. | 45/30 | 1.6 | Protected/ Permissive | No | Yes |
| 2 | University Ave. and 17th St. | 25/25 | 41.8 | Protected/ Permissive | Yes | Yes |
| Traffic Involved | Signal Plan 1 | Signal Plan 2 |
|---|---|---|
| Vehicles going into school (morning) | 5 | 4 |
| Remaining intersection vehicles (morning) | 1 | 6 |
| Vehicles out of school (afternoon) | 1 | 2 |
| Remaining vehicles (afternoon) | 3 | 5 |
Publisher’s Note: MDPI stays neutral with regard to jurisdictional claims in published maps and institutional affiliations. |
© 2022 by the authors. Licensee MDPI, Basel, Switzerland. This article is an open access article distributed under the terms and conditions of the Creative Commons Attribution (CC BY) license (https://creativecommons.org/licenses/by/4.0/).
Share and Cite
Mishra, A.; Chen, K.; Poddar, S.; Posadas, E.; Rangarajan, A.; Ranka, S. Using Video Analytics to Improve Traffic Intersection Safety and Performance. Vehicles 2022, 4, 1288-1313. https://doi.org/10.3390/vehicles4040068
Mishra A, Chen K, Poddar S, Posadas E, Rangarajan A, Ranka S. Using Video Analytics to Improve Traffic Intersection Safety and Performance. Vehicles. 2022; 4(4):1288-1313. https://doi.org/10.3390/vehicles4040068
Chicago/Turabian StyleMishra, Ahan, Ke Chen, Subhadipto Poddar, Emmanuel Posadas, Anand Rangarajan, and Sanjay Ranka. 2022. "Using Video Analytics to Improve Traffic Intersection Safety and Performance" Vehicles 4, no. 4: 1288-1313. https://doi.org/10.3390/vehicles4040068
APA StyleMishra, A., Chen, K., Poddar, S., Posadas, E., Rangarajan, A., & Ranka, S. (2022). Using Video Analytics to Improve Traffic Intersection Safety and Performance. Vehicles, 4(4), 1288-1313. https://doi.org/10.3390/vehicles4040068