Abstract
The Highway Safety Manual (HSM) initial version provides several safety performances functions (SPFs) that can be used to predict collisions on a roadway network. The calibration of the HSM SPFs for Fatal and Injury (FI), Property Damage Only (PDO), and Total crashes for Urban Four-lane Divided Roadway Segments (U4D) in Muscat, Sultanate of Oman, and the development of new SPFs were investigated in this paper. The HSM SPFs were calibrated first with the HSM methodology, and then new forms of specific SPFs were evaluated for Muscat urban roads to determine the best model using the Poisson-Gamma regression technique. The results of this study show that the HSM calibrated SPFs provide the best fit of the data used in this study and would be the best SPFs for predicting collisions in the City of Muscat. The developed collision model describes the mean crash frequency as a function of the natural logarithm of the annual average daily traffic, segment length, and speed limit. Overall, this study provides an important foundation for the implementation of HSM methods in Muscat city, and it may aid in making SPFs established in more developed countries adaptable for use in less developed countries.
1. Introduction
Muscat, the Sultanate of Oman’s capital city, has grown in terms of population and vehicle growth. The increase in motorization is accompanied by a significant increase in the size of the road network [1]. This has led to several multi-lane roads in Muscat (see Figure 1). Such growth has resulted in a higher crash frequency level at several locations, resulting in fatalities and major economic and social concerns in the country. Previous studies have identified traffic safety in Muscat as a serious issue that necessitated the immediate implementation of stringent and comprehensive measures [2,3,4].
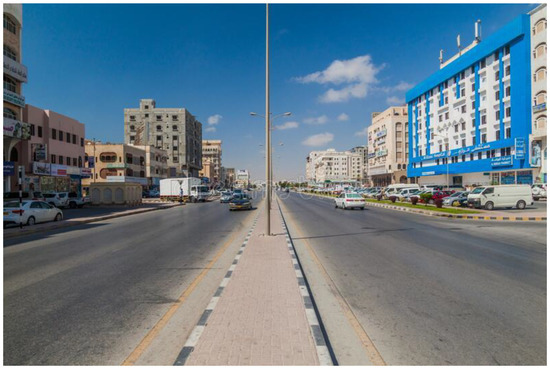
Figure 1.
Urban Four-Lane Divided Roadways in Muscat.
In general, traffic accidents were the second leading cause of death in Gulf Cooperative Council (GCC) countries, trailing only cardiovascular diseases. In comparison to European and American countries, GCC countries have a very high fatality rate in road accidents. In 2001, 14.8 and 7.3 people were killed per 10,000 vehicles on Saudi and Qatari roads, respectively [5]. According to a statistical study of traffic crashes in Oman in 2013, there were 7829 crashes for a total of 1082,996 registered vehicles. These crashes resulted in 913 fatalities, 5591 injuries, and 1481 property damage only crashes respectively [6], which has higher rates of fatalities and injuries than other more developed countries. On a global scale, however, approximately 1.35 million people are killed in road traffic accidents each year [7]. These numbers are concerning, especially in light of the existing safety models [8].
Thus, there is an urgent need to address the seriousness of the Sultanate of Oman traffic safety problem, which will serve as a model for other GCC countries facing similar issues. As a result, the purpose of this paper is to fill these research gaps by calibrating and transferring Highway Safety Manual predictive models as well as developing new models. The primary goals of this paper are to calibrate the HSM SPFs for Muscat conditions using the HSM methodology. The second goal is to create new SPFs using the negative binomial (NB) regression technique. Finally, the transferability model developed was validated using Goodness-of-fit (GOF) methodology. Recommendations are also made for transferring the HSM’s wealth of SPFs and safety knowledge to GCC countries.
2. Background and Novelty of the Study
Several studies have documented the creation of SPFs for freeways, rural highways, and urban arterials [9,10,11,12,13,14,15,16,17]. Srinivasan et al. [18], studied the application of highway safety manual equation for Florida conditions. The foundational models for the HSM safety prediction approaches were created using information from certain highway authorities across Florida. Calibrations of these base models are necessary to apply these models to Florida’s many geographic regions and take into account how crash trends change over time within the same location. The results demonstrated that for project-level safety evaluations performed in the state of Florida, the calibration factors offered in this report should be utilized in conjunction with the applicable SPFs.
Al-Ahmadi et al. [19] used the Calibration of the Highway Safety Manual Predictive Models for Multilane Rural Highway Segments in Saudi Arabia. The result revealed that The Highway Safety Manual (HSM) provides dependable and consistent CPMs for a variety of roadway infrastructure, also known as safety performance functions (SPFs). SPFs are statistical regression models that calculate expected crash frequencies by crash type, severity, and facility type as a function of roadway geometry features and traffic exposure.
Cafiso et al. [20] applied the Highway Safety Manual to Italian Divided Multilane Highways. Results were assessed using Safety Performance Functions (SPF), which are considered to produce more accurate estimates than HSM calibration and were developed directly with data for the particular Italian road infrastructure.
Moraldi et al. [21] used the Highway Safety Manual (HSM) formulation to provide a consistent framework for developing accurate predictions of crash frequency in Germany for rural two-lane, two-way roads even though the predictive accuracy of the majority of accident prediction models remains unclear. The results prompted the creation of a model to be applied to the HSM technique for calculating crash frequency on German rural two-lane, two-way road segments. However, limited study has been performed on addressing the traffic accident in Oman using the Highway Safety Manual approach. Furthermore, Highway Safety Manual predictive model development for Oman will address the traffic safety problem being experienced in Oman and is the core objective of this study.
In comparison to calibrated HSM SPFs [22], it was discovered that jurisdiction-specific SPFs better suit their collision data. Although this comparison was done to uncalibrated HSM SPFs. Garber et al. [15] discovered that jurisdiction-specific SPFs for intersections showed a better model fit than the HSM SPFs. The majority of researchers have investigated the effect of HSM SPF calibration on the performance of collision prediction for local roadway networks [23,24,25,26,27,28]. Although these studies generally conclude that calibrated HSM models perform better (as measured by model fit) than uncalibrated HSM models, a common problem that researchers run into is the size of the data set needed for the HSM’s calibration procedure. Examples of this data set include roadway characteristics, traffic volumes, and collision data spanning several years.
In the majority of underdeveloped nations, where data availability and quality are unclear, this might be very difficult. Sacchi et al. [12] employed cumulative residual (CURE) plots to judge the accuracy of jurisdiction-specific models in their assessment of the transferability of the HSM to Italy’s roads, but they did not make a comparison to the HSM SPFs. Srinivasan et al. [29] calculated the single calibration factor for the overall data sample and multiple calibration factors for different ranges of traffic volume and segment length when transferring the HSM’s SPF to rural two-lane roads in Arizona, but the two types of calibration factors did not provide a good fit to Arizona data. To model the observed crash frequency as a function of the predicted ones using conventional least squares, NB, or Poisson regressions, the calibration function was proposed. Agreements were found among the studies and the results were adequate.
For all types of intersections, it was discovered that the calibrated HSM and jurisdiction-specific SPFs provide the optimum fit. Consequently, in the City of Regina, the jurisdiction-specific SPFs were the best SPFs for foretelling collisions at junctions with three and four legs. To calibrate the SPF, Cafiso et al. [23] investigated the effects of utilizing various segmentation approaches. They looked at using short vs. long roadway segments. Along with the segment selection criteria, more treatment kinds have been found in addition to those that were already covered by the HSM. A study on the transferability of SPFs and the identification of hotspots for freeways in China and the United States was presented by Feng et al. [4]. For each of the five locales separately, SPFs were created within the frameworks of Poisson, Poisson-lognormal, and negative binomial regressions, and were calibrated using the calibration functions before being transferred. Additionally, Kaaf et al. [6] looked into the applicability of the HSM model for urban four-lane divided roadways in Saudi Arabia using both the HSM default CMFs and the locally developed CMFs. They discovered that the Cr value (0.31) based on the HSM default CMFs is significantly worse than the predicted Cr value (0.56) based on locally produced CMFs
Farrag et al. [30] provided a method for calibrating a microscopic model with the help of VISSIM in the Sultanate of Oman. Their technique did not take the collision aspect into account. Al-Aamri et al. [2] attempted to provide data for road crashes at Oman. Their study’s primary objective was to locate hot spots and spatial clusters of road traffic crashes (RTCs) in the governorate of Muscat.
Recently, Ramana et al. [31] investigated the causes of accident on a selected roads in muscat. Their result revealed that accidents can occur for a variety of causes, but the main one that contributes to them is excessive vehicle speeds. This study sought to investigate the factors that lead to accidents to enhance road safety in Muscat.
Despite several studies performed using highway safety manuals to predict and reduce traffic accidents in different countries, detail stud using this approach to predict collisions on a roadway network in Muscat has not be reported. Therefore, this paper’s effort to determine whether the provided SPFs in the HSM perform well in terms of predicting the number of collisions on the roadway network of Muscat city or whether it would be recommended to develop new models was motivated by findings from previous studies and the dearth of trustworthy models in the GCC countries.
3. Muscat Data Description
The Muscat data set includes urban 4-lane divided roads (U4D) in Muscat from 2010 to 2011, as shown in Table 1. The collision and traffic data used in this study were obtained from two different sources: the Muscat Municipality (MM) and the Royal Oman Police, Directorate General of Traffic (DGC). Because the ARC GIS is still not used for traffic crash study in Oman, the crash data used in the analysis were manually extracted from the DGC’s filing system. The location description in the crash report and DGC annual reports are useful in learning more about the characteristics of each crash and determining its location. For the period 2010–2011, 627 police-reported crashes on urban four-lane divided roadway segments were collected. Two subsets of crashes were sampled. The first included 344 serious accidents and the other subset included 283 PDO crashes.

Table 1.
Descriptive Statistics of Variables.
The traffic volume data for road segments in Muscat city used in this study were obtained in non-electronic format from Muscat Municipality (MM) (PDF files). The traffic volume counts were collected by a private consultancy company in 2011 using manual (MTC) and automatic traffic counts (ATC).
The median width (MW) and driveway density (DD) were collected using Google Earth Maps because no database contains this information. Great effort was required to follow along the routes in both the GIS environment and Google Earth imagery to accurately capture the necessary data.
For accurate data collection, verification of each segment to ensure that it comes under the facility type is necessary for accurate data gathering (urban four-lane divided roadway segments). The segment would also be split into two new segments if it had an intersection, with the beginning or end positions of the new segments being determined to exclude 250 feet on either side of the intersection. Individual segments were identified and accurately characterized after which the necessary geometric, cross-sectional, and collision features were suitably assembled.
Segment length SE, AADT, driveway density DD, speed limit SL, and median width MV were among the factors in the data sets. The data on collisions, traffic volume, and cross-section road features were all combined into a single file in the end. The generated database included details on the collisions that occurred in each section as well as its geometrical and traffic features. Table 1 provides some relevant statistical data used to develop the prediction models. In the data description for the 2 years (2010–2011) considered, TOTAL represents the number of fatal and injury crashes occurring in the study segments during the period, PDO represents the number of property damage only crashes occurring in the study segments. While TOTAL stands for the number of FI and PDO crashes occurring on the study segments for the period considered, SE represents the length of the segment in miles, and ND stands for the number of driveways on the study segments. DD represents the number of driveways per mile, and SL means the Actual posted speed limit in mile per hour and MW represents the Median width(ft).
For the entire City of Muscat, the segmentation algorithm produced 104 homogenous segments with average lengths of 0.48 mi and lengths ranging from 0.12 mi to 1.8 mi. There were 627 recorded crashes on the 104 segments from the segmentation procedure between 2010 and 2011. The estimating and validation components of the crash data were separated. Thirty percent of the segments (31 segments) were utilized as validation data, while the remaining seventy percent (73 segments) were randomly chosen and used as estimation data to construct the SPFs.
4. Methodology
In this investigation, three main tasks are involved. The first step is calibrating the base SPF models using the method suggested by HSM. The second goal is to create unique, complete, and easy SPFs for Muscat. The next subsections describe the information and techniques used to complete the three tasks. Finally, statistical Goodness-of-Fit (GOF) measurements will be used to compare the performance of various models.
4.1. HSM Calibration of Urban Four-Lane Divided Roads
The HSM safety predictive model is divided into three components: a Safety Performance Function (SPF) created concerning the highway facility under predetermined base conditions, the Crash Modification Factors (CMFs), and the Calibration Factor (Cr) calculated to calibrate the model to local conditions. The HSM outlines five steps for correctly calibrating a model. The first is to choose the type of roadway to calibrate on. The second is to choose the sites to calibrate at, using a minimum sample size of 30 to 50 sites. Additionally, it advises picking sites at random rather than picking only those with a high crash rate and at least 100 crashes annually. The next stage after establishing the sites is to gather the overall crash frequency for the years selected for observation and site characteristics. In the fourth step, the predictive model in Equation (1) is used in accordance with HSM recommendation [32] to calculate the anticipated crash frequency for each site over the specified number of years as follows:
Npredicted = Nspfx × (CMF1x × CMF2x × … × CMFyx)
And the final step is to compute the calibration factor using the following equation:
where:
Nspfx = predicted average crash frequency determined for base conditions of the SPF developed for site type x.
CMFyx = collision modification factors specific to site type x and for specific geometric design and traffic control features y.
The above equations apply a base model and then uses CMFs to improve the prediction made by the base model. For sites that satisfy the base requirements, the base model forecasts the anticipated number of collisions. The predictions of the base model are then modified to account for the effects of other factors that are distinct from those of the base model using CMFs, which have been put together by a group of experts and documented in the HSM.
4.2. Developed Models
Safety performance models are typically created using a negative binomial (NB) regression, as is widely acknowledged by researchers [4,33,34]. Due to the naturally high variability of accident frequencies, whose variance is larger than the mean, the negative binomial distribution is well suited for modeling crashes. Because crashes within a site fit a Poisson distribution but variation across several sites is gamma distributed, negative binomial models are also known as Poisson-gamma models [4,33,34]. The observed statistical significance of the overdispersion parameter dictates the choice of the negative binomial over the Poisson model for crash simulation. The negative binomial model simply converts to a Poisson regression with variance equal to the mean if the overdispersion parameter is not substantially different from zero. The Poisson model should not be used if it is bigger than zero; instead, the negative binomial is the suitable option.
5. Results and Discussion
5.1. HSM Calibration Models
There were 249, 208, and 457 reported FI, PDO, and total crashes on the 73 segments in the estimation data set for 2010–2011, respectively. As shown in Equation (3), HSM base models for urban/suburban arterial roadway segments have separate equations for a single vehicle and multiple vehicle collisions. It implies that for single vehicle crash prediction, Equation (3) can be applied. Table 2 shows the HSM SPF coefficients for a single vehicle (SV) and multiple vehicles (MVs) on urban four-lane divided segments.
Table 2.
SPF Coefficients for Single and Multiple Collisions on Urban Roadway Divided Segments.
The HSM’s instructions for the usage of CMFs are still required by the SPFs. On-street parking, fixed objects along the side of the road, median width, lighting, and automated speed enforcement are CMFs used in urban areas. Since speed enforcement was not used on urban arterial segments, the crash modification factor for auto speed enforcement is unity for all segments. The roadside fixed object crash modification factor is expected to be 1. The result is in agreement with study of Wu et al. [17] that used developed crash modification factor for to predict that the horizontal curve radius has a significant role in the risk of a crash. In this study, the CMFs for parking, lighting, and median width were estimated using the HSM technique. The procedure is briefly explained in the section below. Equations (4)–(6) were used to identify the HSM CMFs; Parking: the crash modification factor was estimated based on research by [35], as
where:
CMF = 1 + Ppk (fpk − 1)
Ppk = proportion of curb length with on-street parking (=0.5 Lpk/L), Lpk = curb length with on-street parking (mi), L = roadway segment length (mi), and fpk = factor from Table 12–19 of the HSM, [32]. The sum of curb length (Lpk) was determined from Google Earth.
Lighting: The CMF for lighting calculated based on the work of [36] as
where:
CMF = 1 − (Pnr × (1.0 − 0.72 Pinr − 0.83 Ppnr))
Pinr = proportion of total nighttime crashes for unlighted roadway segments that involve a nonfatal injury,
Ppnr = proportion of total nighttime crashes for unlighted roadway segments that involve PDO crashes only, and
Pnr = proportion of total crashes for unlighted roadway segments that occur at night.
The HSM default values of Pnr,, Pinr, and Ppnr for urban four-lane divided roadway segments are 0.410,0.364 and 0.636, respectively resulting in a CMF = 0.914. The CMF was estimated based on Tables 12–22 of the HSM [32].
The total calibration factor for urban four-lane division was calculated using the HSM CMFs as depicted in Figure 2. As observed in Figure 2, the local Muscat calibration factors for the PDO and TOTAL collision categories are higher than one, indicating that the mean crash rates for these collision types on urban four-lane divided highways in Muscat are underestimated by the HSM base SPFs. Contrarily, the FI crashes have a lower calibration factor, indicating that Muscat City experiences fewer severe crashes than the jurisdictions used to construct the HSM’s urban/suburban SPFs.
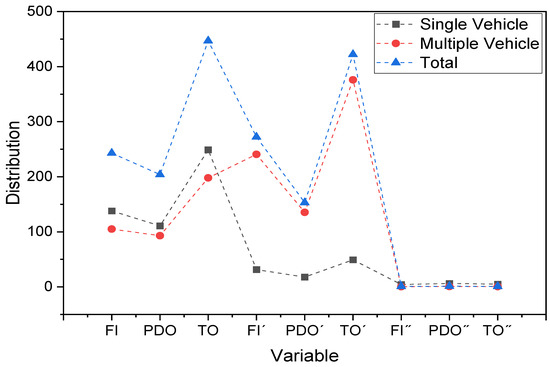
Figure 2.
Estimated calibration factors.
From Figure 2, for the Fatal and Injury, FI represents Observed Crashes, FI’ Predicted Crashes, and represents the FI” Calibration Factor. For Property Damage Only, PDO represents Observed Crashes, PDO’ Predicted Crashes, PDO” Calibration Factor; and for the Total crashes, TO represents Total Observed Crashes, TO’ Total Predicted Crashes, TO” Total Calibration Factor.
The low fatal and injury calibration factors in Muscat city observed in Figure 2 could be attributed to the following possible reasons:
- Crashes involving both slight injury and damage to property may be recorded as “Property Damage Only” crashes.
- Slight injury crashes may suffer from underreporting.
- Differences in reporting criteria between the City of Muscat and the jurisdictions from which the HSM SPFs were developed.
- It is possible that collisions in the City of Muscat are simply less severe due to local roadway conditions, climatic effects, and/or driver behavior.
The performances of the calibration factors will be discussed in the “Validation and Comparison” subsection.
5.2. Developed Models
Jurisdiction-Specific Negative Binomial Models
Using two alternative model types and the negative binomial modeling technique, six SPFs were created. The first model type maintains the HSM base SPF form because it is straightforward and has few constraints for data availability as shown in Equation (6):
where,
N = EXP [β0 + β1 AADT + β2L]
N = number of predicted crashes.
AADT = Annual Average Daily Traffic.
L = Segment Length (mi), and
β0, β1, and β2 are parameters to be estimated.
The second model type is full a model that takes the form of the Equation (7) shown below.
xi = independent variable, and
p = number of independent variables.
The parameter estimates, p-values, and goodness-of-fit metrics for the six collision severity models are presented in Table 3.
Table 3.
Crash Severity models.
The three variables in the full models for PDO and TOTAL crashes are ln(AADT), Segment length, and Speed limit. The Segment Length, Speed Limit, and Median Width are the four variables in the FI Full Model, which includes five variables.
From the Table 3, the full models outperform the partial models in terms of deviation, dispersion, and log-likelihood (LL) values. The two model forms make intuitive sense where the goodness-of-fit metrics are comparable for simple and full models. This leads to the conclusion that, when compared to the basic model, the entire full model is superior. Furthermore, it can be seen from Table 3 that except FI crashes, on which the median width has a tangentially significant negative impact, the three collision categories’ median width and driveway density factors were found to be unimportant. The number of cars passing through a segment increases the exposure to potential collisions and the number of conflicts, which is attributed to the ln(AADT) having a positive association with crash frequency. The frequency of crashes is found to be positively correlated with speed limits agree with previous reported studies [37,38].
5.3. Validation and Comparisons
Goodness-of-fit (GOF) metrics were looked at to understand how well a statistical model fit the data set. The disparities between observed and expected values from associated SPFs are summarized by GOF measures. The mean absolute deviation (MAD), mean squared prediction error (MSPE), mean prediction bias (MPB), and Bayesian information criteria are among the GOF indicators that are used to evaluate performance (BIC). The data from the 30 percent validation were subjected to statistical GOF testing. Table 4 displays the performance of each model. Except the FI model, the values of MAD, MPB, and MSPE for simple models are lower than those for fully developed models for the severity collisions, indicating that the simplicity of the model results in lower prediction error and less bias in the prediction.
Table 4.
Goodness of fit measures for the HSM calibrated and developed models.
However, in terms of BIC value, full models perform better than simple models. Overall, the straightforward model outperforms the fully developed model.
It can be seen from Table 4 that the Muscat local calibrated models outperform the newly produced, particular models in terms of MAD, MSPE, and MPB. However, the new specific models perform better in terms of BIC measure when compared with the total calibrated models.
This suggests that in terms of mean-related measures, locally calibrated HSM models outperform the newly constructed models.
5.4. Limitation of the Model
More factors beyond those considered in this study affect road safety. Additional information can be gathered to aid in determining the safety-related characteristics and forecasting the potential number of collisions during a specific time period. The created model and specific variables provided in the HSM or utilized in this study are appropriate places to start when modeling crash frequencies. These linkages may be shown by additional modeling that takes into account the multiplicative and interaction impacts of the model variables.
6. Conclusions
This paper’s goals were to create new jurisdiction-specific SPFs and calibrate the HSM SPF for urban four-lane split roadways. To build the SPFs, data from 73 homogeneous segments on urban roadways in the City of Muscat over two years (2010–2011) were randomly chosen, with the remaining 31 segments serving as the validation data. Muscat data were used to build new specialized SPFs that quantify the relationship between projected crash rates and different road and traffic features as well as calibration factors to adjust the HSM-based SPFs. The initial goal was to calibrate the HSM SPFs for Muscat conditions using the HSM approach. The NB regression technique was used to create new SPFs in the second goal. Several performance indicators were taken into consideration, including MAD, MSPE, MPB, and BIC. Given that the calibration factors for PDO and TOTAL were more than 1, it followed that the mean crash frequencies on urban four-lane divided roads in Muscat for this two-collision severity were underestimated by the HSM base SPFs. The FI calibration factor, however, is less than one. The calibration factors and performance measure comparisons suggested that the HSM calibrated models perform better than the newly designed SPFs. However, it is discovered that produced SPFs surpass every other calibrated model in terms of BIC value.
According to the new jurisdiction-specific models, Muscat’s highway features and crash relationships appear to be similar to those described in the HSM. When the variables AADT, segment length, and speed restriction were increased, for instance, the new SPFs predicted more crashes. The HSM SPFs data revealed less improvement than the created models, offering a viable method for quantitative safety assessments in Muscat and GCC nations that needs further investigation and study. The HSM calibration application for Muscat accident situations emphasizes how crucial it is to deal with reporting threshold variations. One of the research’s conclusions is that the TOTAL and PDO traffic crashes in Muscat were unaffected by the median width and driveway density, while the FI crashes adversely impacted by median width. Overall, this study offers a crucial foundation for the use of HSM techniques in Muscat and may aid in the informed decision-making of the city’s transportation officials concerning road safety initiatives. Through these outcomes and appropriate road safety initiative and measures taken, traffic accident in Muscat can be significantly reduced and prevented.
The paradigm offered can be used by other GCC countries, which typically have similar criteria for driver behavior and design even though this study uses data from Muscat.
In essence, these algorithms can be used to predict collisions on arterial portions with many lanes between crossings. Additionally, this study is one of the initial attempts to understand the feasibility of calibrating HSM models and creating new models in the GCC Countries. The outcomes of the study significantly suggest that that the HSM may be applied to other nations and not all models from nearby nations may be readily transferable.
Author Contributions
K.A.A.: Conceptualization, methodology, original draft preparation, writing—review and editing, visualization, supervision. M.A.-A.: formal analysis, investigation, resources, data curation, writing, writing—review and editing, visualization, supervision. All authors have read and agreed to the published version of the manuscript.
Funding
This research received no external funding.
Acknowledgments
The authors wish to thank the Royal Oman Police, Directorate of General Traffic (DGC), and Muscat Municipality for providing the data that were used in this study.
Conflicts of Interest
The authors declare no conflict of interest.
References
- Didero, M.; Farooq, A.; Nebel, S.; Pfaffenbach, C. Urban Oman: From Modern to Postmodern Mobility in Muscat? Middle East Top. Argum. 2019, 12, 87–98. [Google Scholar] [CrossRef]
- Al-Aamri, A.K.; Hornby, G.; Zhang, L.-C.; Al-Maniri, A.A.; Padmadas, S.S. Mapping road traffic crash hotspots using GIS-based methods: A case study of Muscat Governorate in the Sultanate of Oman. Stat. Spat. 2021, 42, 100458. [Google Scholar] [CrossRef]
- Islam, M.M.; Al Hadhrami, A.Y.S. Increased motorization and road traffic accidents in Oman. J. Emerg. Trends Econ. Manag. Sci. 2012, 3, 907–914. [Google Scholar]
- Feng, M.; Wang, X.; Lee, J.; Abdel-Aty, M.; Mao, S. Transferability of safety performance functions and hotspot identification for freeways of the United States and China. Accid. Anal. Prev. 2020, 139, 105493. [Google Scholar] [CrossRef] [PubMed]
- Bener, A.; Abu-Zidan, F.M.; Bensiali, A.K.; Al-Mulla, A.A.; Jadaan, K.S. Strategy to improve road safety in developing countries. Saudi Med. J. 2003, 24, 603–608. [Google Scholar] [PubMed]
- Kaaf, K.A.; Abdel-Aty, M. Transferability and Calibration of Highway Safety Manual Performance Functions and Development of New Models for Urban Four-Lane Divided Roads in Riyadh, Saudi Arabia. Transp. Res. Rec. 2015, 2515, 70–77. [Google Scholar] [CrossRef]
- World Health Organization. Global Status Report on Road Safety 2018; World Health Organization: Geneva, Switzerland, 2018. [Google Scholar]
- Rezapur-Shahkolai, F.; Afshari, M.; Doosti-Irani, A.; Bashirian, S.; Maleki, S. Interventions to prevent road traffic injuries among pedestrians: A systematic review. Int. J. Inj. Control Saf. Promot. 2022, 1–17. [Google Scholar] [CrossRef] [PubMed]
- Bornheimer, C.; Schrock, S.D.; Wang, M.-H.; Lubliner, H. Developing a Regional Safety Performance Function for Rural Two-Lane Highways. In Proceedings of the 91st Annual Meeting of the Transportation Research Board, Washington, DC, USA, 22 January 2012. [Google Scholar]
- Brimley, B.K.; Saito, M.; Schultz, G.G. Calibration of Highway Safety Manual Safety Performance Function: Development of New Models for Rural Two-Lane Two-Way Highways. Transp. Res. Rec. 2012, 2279, 82–89. [Google Scholar] [CrossRef]
- Martinelli, F.; La Torre, F.; Vadi, P. Calibration of the Highway Safety Manual’s Accident Prediction Model for Italian Secondary Road Network. Transp. Res. Rec. 2009, 2103, 1–9. [Google Scholar] [CrossRef]
- Sacchi, E.; Persaud, B.; Bassani, M. Assessing International Transferability of Highway Safety Manual Crash Prediction Algorithm and Its Components. Transp. Res. Rec. 2012, 2279, 90–98. [Google Scholar] [CrossRef]
- Tegge, R.A.; Jo, J.-H.; Ouyang, Y. Development and Application of Safety Performance Functions for Illinois; National Technical Information Service: Springfield, VA, USA, 2010. [Google Scholar]
- Young, J.; Park, P. Comparing the Highway Safety Manual’s Safety Performance Functions with Jurisdiction-Specific Functions for Intersections in Regina. In Proceedings of the Annual Conference of the Transportation Association of Canada Fredericton, Fredericton, NB, Canada, 14 October 2012. [Google Scholar]
- Garber, N.J.; Rivera, G.; Lim, I.-k. Safety Performance Functions for Intersections in Virginia. In Proceedings of the Transportation Research Board 90th Annual Meeting’s Compendium of Papers, Washington, DC, USA, 23 January 2011. [Google Scholar]
- Lyon, C.; Haq, A.; Persaud, B.; Kodama, S.T. Safety Performance Functions for Signalized Intersections in Large Urban Areas: Development and Application to Evaluation of Left-Turn Priority Treatment. Transp. Res. Rec. 2005, 1908, 165–171. [Google Scholar] [CrossRef]
- Wu, L.; Lord, D.; Geedipally, S.R. Developing Crash Modification Factors for Horizontal Curves on Rural Two-Lane Undivided Highways Using a Cross-Sectional Study. Transp. Res. Rec. 2017, 2636, 53–61. [Google Scholar] [CrossRef]
- Srinivasan, S.; Haas, P.R.; Dhakar, N.; Hormel, R.; Torbic, D.J.; Harwood, D.W. Development and Calibration of Highway Safety Manual Equations for Florida Conditions; Florida Department of Transportation: Tallahassee, FL, USA, 2011. [Google Scholar]
- Al-Ahmadi, H.M.; Jamal, A.; Ahmed, T.; Rahman, M.T.; Reza, I.; Farooq, D. Calibrating the Highway Safety Manual Predictive Models for Multilane Rural Highway Segments in Saudi Arabia. Arab. J. Sci. Eng. 2021, 46, 11471–11485. [Google Scholar] [CrossRef]
- Cafiso, S.; Di Silvestro, G.; Di Guardo, G. Application of Highway Safety Manual to Italian Divided Multilane Highways. Procedia Soc. Behav. Sci. 2012, 53, 910–919. [Google Scholar] [CrossRef]
- Moraldi, F.; La Torre, F.; Ruhl, S. Transfer of the Highway Safety Manual predictive method to German rural two-lane, two-way roads. J. Transp. Saf. Secur. 2020, 12, 977–996. [Google Scholar] [CrossRef]
- Lu, J.; Haleem, K.; Alluri, P.; Gan, A.; Liu, K. Developing local safety performance functions versus calculating calibration factors for SafetyAnalyst applications: A Florida case study. Saf. Sci. 2014, 65, 93–105. [Google Scholar] [CrossRef]
- Cafiso, S.; D’Agostino, C.; Persaud, B. Investigating Influence of Segmentation in Estimating Safety Performance Functions for Roadway Sections. J. Traffic Transp. Eng. 2013, 5, 129–136. [Google Scholar] [CrossRef]
- Matarage, I.C.; Dissanayake, S. Calibration of highway safety manual predictive models for Kansas freeway segments. Int. J. Inj. Control Saf. Promot. 2019, 26, 251–259. [Google Scholar] [CrossRef]
- Mehta, G.; Lou, Y. Calibration and Development of Safety Performance Functions for Alabama:Two-Lane, Two-Way Rural Roads and Four-Lane Divided Highways. Transp. Res. Rec. 2013, 2398, 75–82. [Google Scholar] [CrossRef]
- Persaud, B.; Lord, D.; Palmisano, J. Calibration and Transferability of Accident Prediction Models for Urban Intersections. Transp. Res. Rec. 2002, 1784, 57–64. [Google Scholar] [CrossRef]
- Sun, X.; Li, Y.; Magri, D.; Shirazi, H.H. Application of Highway Safety Manual Draft Chapter:Louisiana Experience. Transp. Res. Rec. 2006, 1950, 55–64. [Google Scholar] [CrossRef]
- Xie, F.; Gladhill, K.; Dixon, K.K.; Monsere, C.M. Calibration of Highway Safety Manual Predictive Models for Oregon State Highways. Transp. Res. Rec. 2011, 2241, 19–28. [Google Scholar] [CrossRef]
- Srinivasan, R.; Colety, M.; Bahar, G.; Crowther, B.; Farmen, M. Estimation of Calibration Functions for Predicting Crashes on Rural Two-Lane Roads in Arizona. Transp. Res. Rec. 2016, 2583, 17–24. [Google Scholar] [CrossRef]
- Farrag, S.G.; Outay, F.; Yasar, A.U.-H.; Janssens, D.; Kochan, B.; Jabeur, N. Toward the improvement of traffic incident management systems using Car2X technologies. Pers. Ubiquitous Comput. 2021, 25, 163–176. [Google Scholar] [CrossRef]
- Ramana, G.V.; Reddy, N.S.; Praneeth, D.M.V. Analysis on Traffic Safety and Road Accidents: A Case Study on Selected Roads in Muscat, Oman. Int. J. Civ. Eng. Technol. 2018, 9, 417–427. [Google Scholar]
- AASHTO. Highway Safety Manual; American Association of State Highway and Transportation Officials: Washington, DC, USA, 2010. [Google Scholar]
- Mitra, S.; Washington, S. On the nature of over-dispersion in motor vehicle crash prediction models. Accid. Anal. Prev. 2007, 39, 459–468. [Google Scholar] [CrossRef]
- Park, B.-J.; Lord, D. Adjustment for Maximum Likelihood Estimate of Negative Binomial Dispersion Parameter. Transp. Res. Rec. 2008, 2061, 9–19. [Google Scholar] [CrossRef]
- Bonneson, J.; Zimmerman, K.; Fitzpatrick, K. Roadway Safety Design Synthesis; FHWA/TX-05/0-4703-P1; Texas Transportation Institute: Austin, TX, USA, 2005. [Google Scholar]
- Elvik, R.; Vaa, T.; Hoye, A.; Sørensen, M. The Handbook of Road Safety Measures, 2nd ed.; Emerald Group Publishing Limited: Bingley, UK, 2009. [Google Scholar] [CrossRef]
- Harwood, D.W.; Bauer, K.M.; Richard, K.R.; Gilmore, D.K.; Graham, J.L.; Potts, I.B.; Torbic, D.J.; Hauer, E. Methodology to Predict the Safety Performance of Urban and Suburban Arterials; Transportation Research Board: Washington, DC, USA, 2007. [Google Scholar]
- Jadaan, K.S. Traffic safety in Gulf countries with special reference to Kuwait. Transp. Rev. 1988, 8, 249–265. [Google Scholar] [CrossRef]


Publisher’s Note: MDPI stays neutral with regard to jurisdictional claims in published maps and institutional affiliations. |
© 2022 by the authors. Licensee MDPI, Basel, Switzerland. This article is an open access article distributed under the terms and conditions of the Creative Commons Attribution (CC BY) license (https://creativecommons.org/licenses/by/4.0/).