Abstract
Transport service provision in many urban areas is dominated by car users, resulting in several traffic externality issues (e.g., noise, pollution, accidents). This paper investigates the perception and satisfaction of private vehicle (PV) users, including micro-mobility users, during their commute by car in an Eastern European country context. The study used empirical data from a sample of 500 commuters in Budapest, Hungary, between October and November 2020. To achieve a deeper understanding of the motivation and explore the perception of PV users towards using sustainable transport services. For analysis in this study, descriptive statistics and segmentation techniques were applied. The key findings indicate that PV users can be attracted to using sustainable transport by designing the travel service quality to provide the level of service desired by customers. Moreover, the majority (73%) of PV commuters were satisfied or very satisfied with the quality attributes of the car service, assessed on a scale of 1 to 5; at the same time, PV users agreed that using public transport helps towards improving the environment and serves to reduce problems derived from traffic. In addition, various elements influence transport choice; for example, results from ordered logit models (OLMs) indicate that security, relaxation, flexibility and comfort are the main significant attributes influencing PV users’ overall satisfaction with cars. The results suggest the necessity for a segmentation technique in the analysis of travel attitudes and satisfaction aimed at reducing the frequency of existing car use to enhance sustainable transportation.
1. Introduction
With the increase in traffic problems in metropolitan areas, such as traffic accidents [1], congestion and pollution [2], considering how to shift private car users to using sustainable transport has become increasingly important [3], along with increasing the existing sustainable transport service [4]. However, in numerous large cities, many investments are being made in public transport (PT) to make it more attractive, especially for private vehicle (PV) users [5]. In general, sustainable transportation can be addressed in three main areas: (i) decreasing travel demand and PV usage, (ii) helping to shift to sustainable modes through the improvement of PT and integrating transport planning, and (iii) restricting PV users by introducing rules such as parking constraints [6] and congestion charges [7,8].
A worthwhile alternative to private vehicles is public transportation, which tends to be more sustainable [9,10], or a private electric vehicle (EV), which is helpful for improving the environment and reducing fossil fuels [11]. However, previous research revealed that public transport is not always acceptable for enthusiastic private car users [12].
According to Mann and Abraham [13], the majority of people are more interested in using a private car than public transportation; in addition to this, another study [14] found that most private drivers enjoy the car and feel that it offers more privacy than PT. Moreover, it has been stated that a private car is more flexible and more comfortable than a PT [12,15]. On the one hand, Redman et al. [16] acknowledge, after reviewing 74 papers related to PT service quality, that car users are attracted to PT if the service is reliable and sufficiently frequent. Additionally, in an experiment where around 1000 car users received a free one-month travel ticket, the study found that, as expected, the cost has an essential influence on users changing their travel mode from PV to PT [17]. The results of an interesting survey on the willingness of PV users to switch to PT suggested that increases in the cost of travel by private vehicle have a greater influence than providing sufficient speed of PT service [18].
Shifts in choice of transport mode may be affected by various factors, including individual perceptions, socioeconomic status, psychological and cultural values, and even lifestyle [12,16]. A recent paper [19] concluded that the frequency of using private cars and PV consumption is substantially related to different interrelated aspects, for instance, perceived car values [20,21]. Therefore, it is recommended for the policymaker to either consider the aim of PV ownership or examine the impact of behavior on shifting attitudes. Additionally, using a private vehicle is associated with their lifestyle and quality of life and increases the potential revenue by providing more opportunities to find jobs [22]. Furthermore, researchers highlighted that gender and car ownership were the most crucial elements contributing to preferred private car usage [23].
Likewise, recently emerging transport modes, for instance, autonomous vehicles and electric vehicles, must be considered by transport providers and researchers [11,24]. Moreover, due to the advancement of information and technology, there are wide-ranging opportunities to enhance energy efficiency and reduce climate change risks, such as providing autonomous vehicles (AVs) [25]. Another innovative transport mode suitable for short-distance travel in urban areas is micro-mobility (commonly single-person vehicles for instance, bicycles and scooters), which has been considered as a sustainable alternative to replace the conventional private car [26,27]. Micro-mobility systems are quickly evolving and promise to contribute to a more sustainable transportation system [28].
Several studies have measured the influence of different socioeconomic and environmental factors on mode choice, for example, research by Jing et al. [23]. However, studies considering the attitude of travelers, including their satisfaction, remain limited [29]. Transport planners have used different models and approaches to investigate market segmentation and heterogeneity analysis [30]. The ordered logit model (OLM) is used in this study as a promising technique [3,31].
To achieve more sustainable urban mobility, transport operators and decision-makers need to be careful when implementing travel services [32]. Further research is necessary to examine the response to demand for sustainable travel development [33], which will help to reduce the gap between the current service levels and levels required to encourage users toward sustainable modes [34]. In the literature regarding sustainable transportation measurement, there have been many studies addressing the measurement of PT systems from the passenger’s point of view and other research focusing on different stakeholder groups [35]. Some recent studies have considered the PV user’s opinion [3,30].
In bridging the identified literature gap, understanding the opinion of PV users regarding PT service quality is essential to improving specific service quality attributes (SQAs) and achieving the goal of sustainability. This agrees with the suggestion that more consideration should be paid to PV users’ perceptions in the evaluation of PT service [3]. Nonetheless, there are fewer studies in the literature analyzing PT service quality from the perspective of private vehicle users [30,36].
Consequently, an empirical examination of the relationship between the perception of service quality and user satisfaction is essential in the field of transportation [37]. This study contributes to the practical investigation regarding the satisfaction of PV users, intending to encourage a shift towards using sustainable transport. It uses actual data to estimate models of PV users for different socioeconomic and mobility characteristics segments and PV users’ perceptions of the PT system.
Based on Hungarian statistics, the number of road vehicles in the country at the end of the year 2020 included 3,920,799 passenger cars, contributing to an increase in traffic congestion particularly in the capital city of Budapest [38], notwithstanding Budapest has a good public transportation system [39]. This brings another motivation to conduct this research. In summary, perceived service quality has a substantial influence on the satisfaction of users [29] and, in addition to this, user satisfaction leads to loyalty and behavior intention to the PT service with reduced service complaints.
Against this background, although there are important studies on the motivation of private car users, no effort has been made to examine the impact of various private vehicle users on the perception of private car and PT service quality attributes. Therefore, the objectives of this study are as follows:
- Provide the most comprehensive customer service quality assessment of the private car and public transport based on a quantitative survey and up-to-date literature review in an Eastern European country.
- Categorize whether there are any differences in service quality perception among the different segments and how this perception affects their overall satisfaction.
- To the best of our knowledge, this study will be the first research that considers PV users’ opinions regarding car service quality and PT systems simultaneously using new segmentation technique. The remainder of this paper is structured as follows. Section 2 provides a brief overview of the survey design and the sample descriptive statistics, and then presents an overview of analysis tools. Results are presented in Section 3 including the descriptive analysis and an estimate of 15 models following this, discusses the model estimation results where we provide a comparative assessment of the differences in satisfaction found in the segmentation analysis. Finally, some conclusions are drawn in the last section.
2. Materials and Methods
2.1. Survey Design and Sample Description
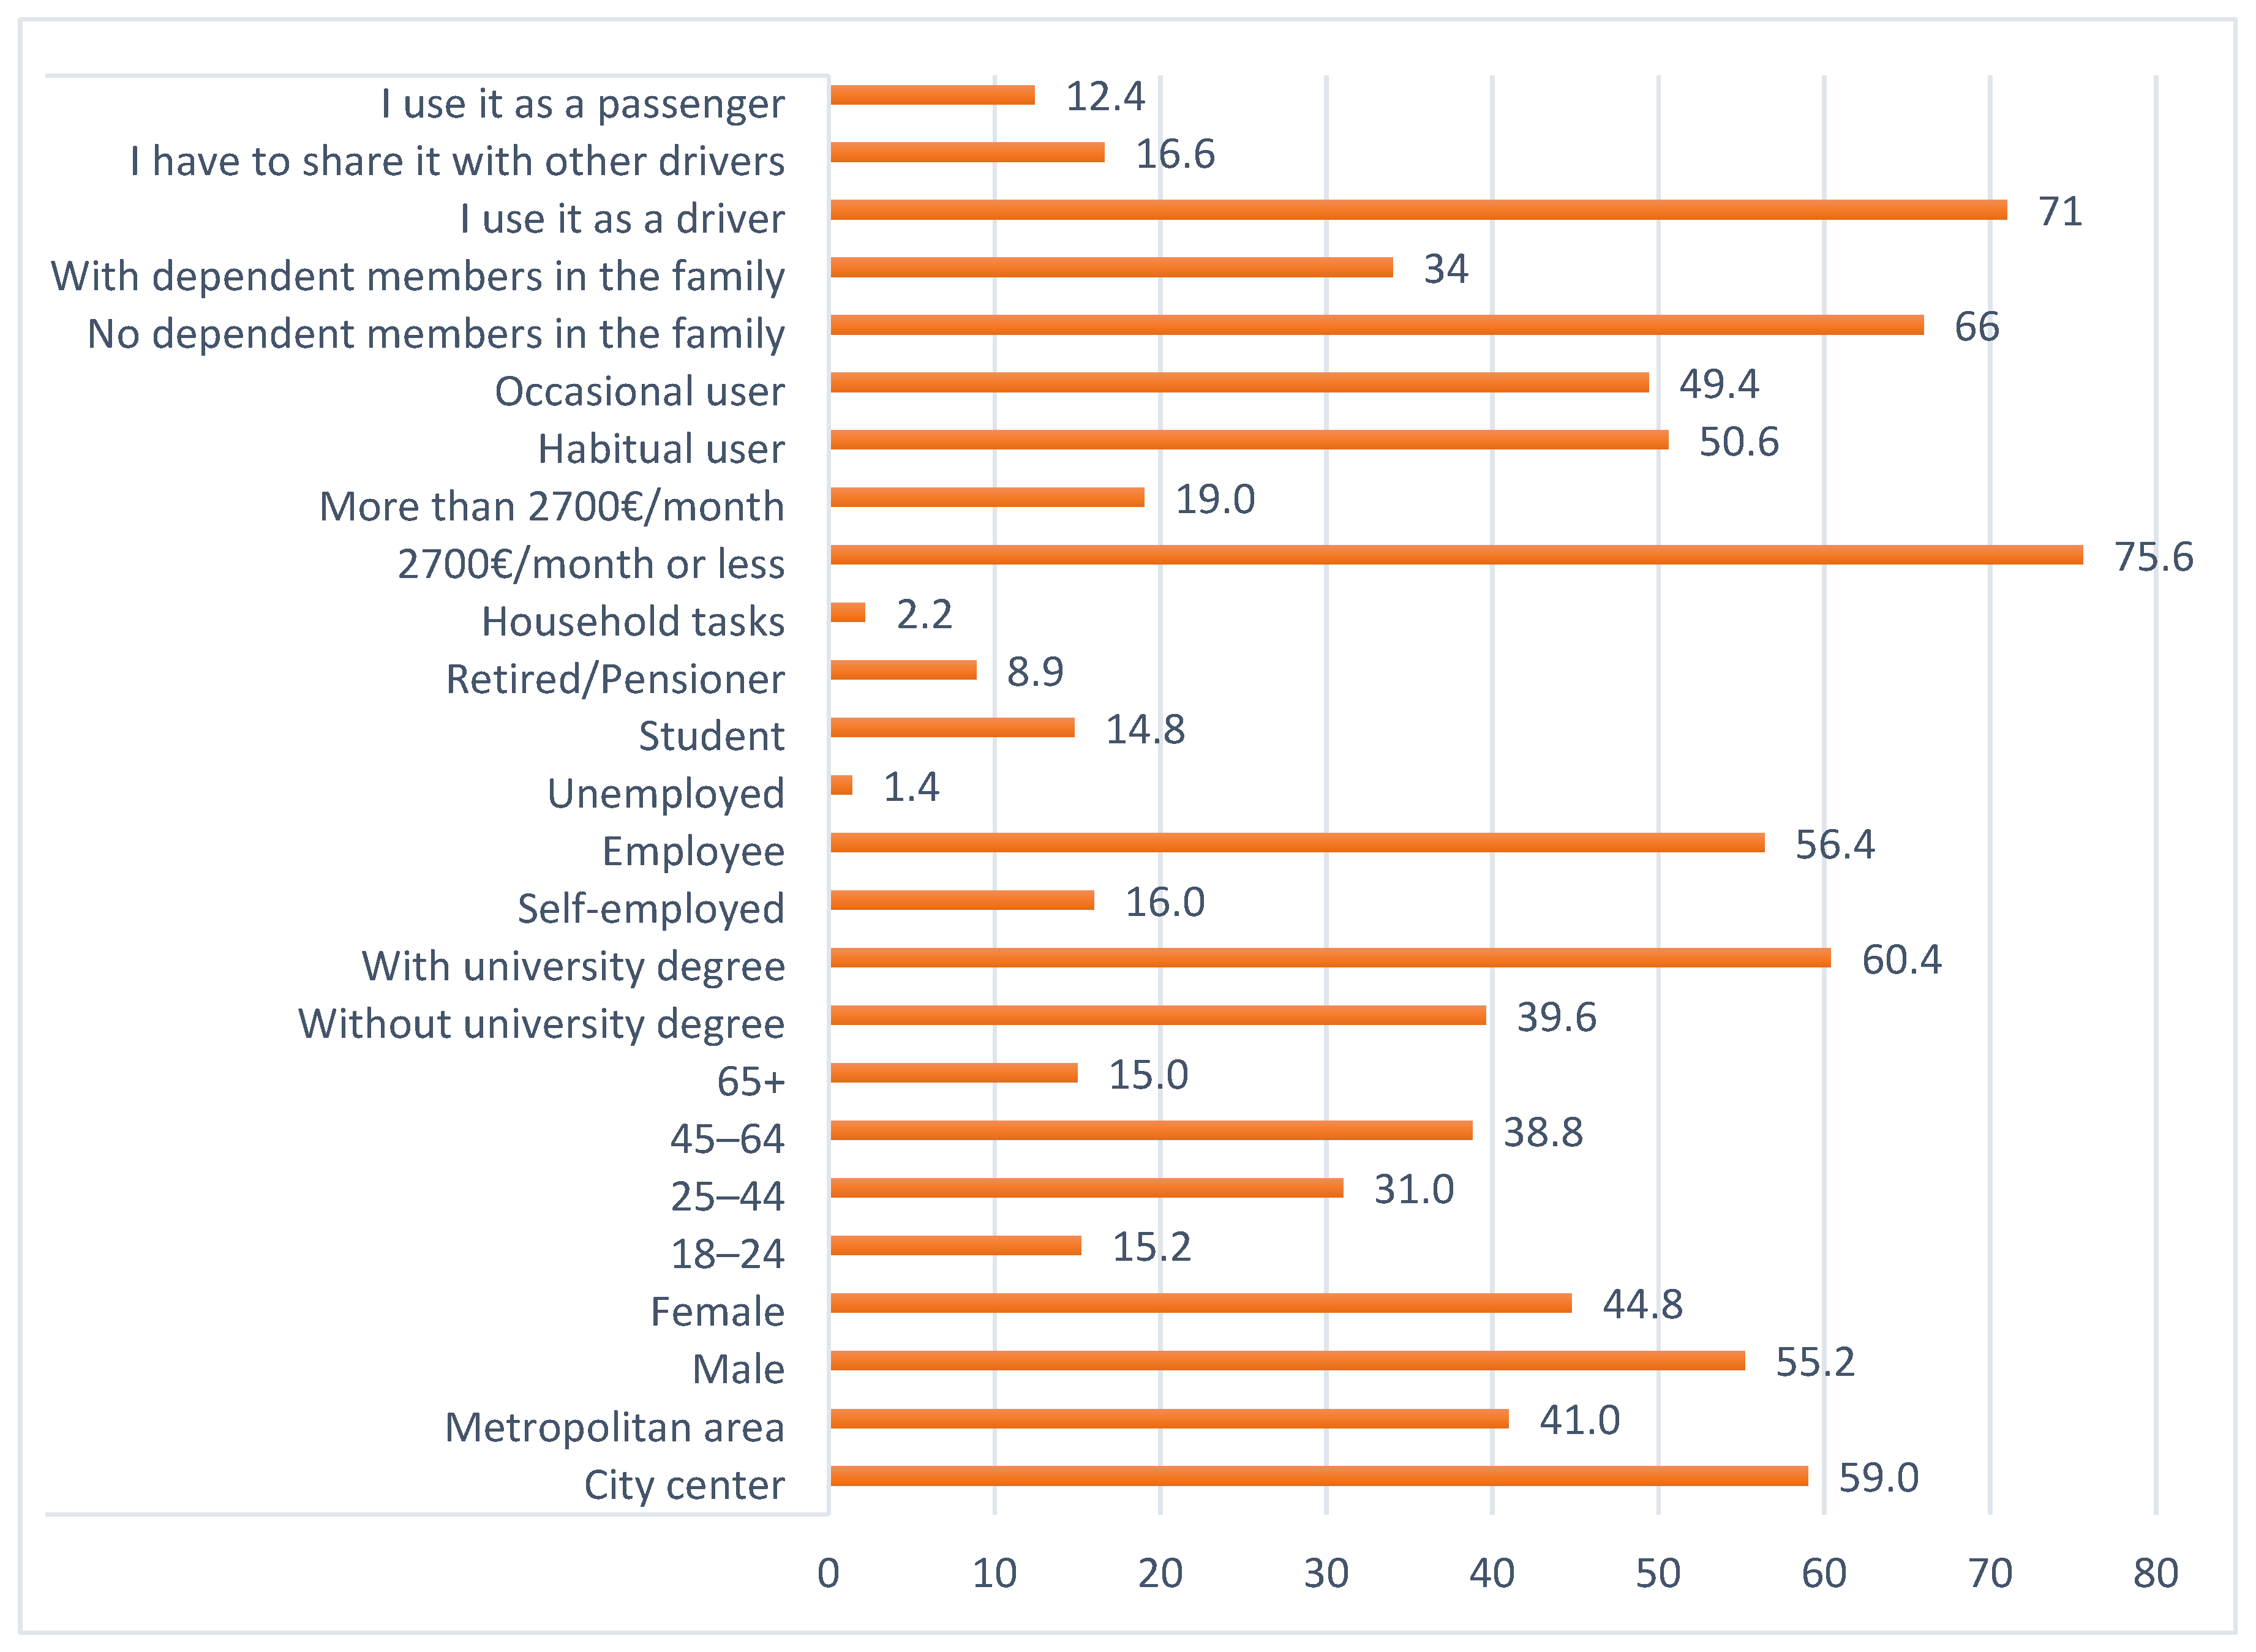
This paper aims to analyze how PV users perceived the quality of the private car service and the PT service in Budapest. These respondents are recognized as those who use a motorized vehicle (i.e., cars, motorcycles or scooters) on their daily trips and those who have knowledge about the PT provided service. The survey was collected through an online and printed questionnaire in the Budapest urban area during October and November 2020. The questionnaire contains several sections with questions regarding: the satisfaction of PV users with the use of the car and mode choice; perceptions of PT service; the overall satisfaction with PVs and the PT transport system; and sociodemographic and mobility characteristics. Figure 1 describes the sample of 500 respondents that contributed to the survey. Survey results show that the majority of the participating PV users are male (55%) and live in the city center (59%). It can be seen that 31% of participants are 25 to 44 years old, and 38.8% are between 45 and 64 years old, with 60.4% having a university degree. Predictably, the majority of PV users are employed (56.4%) followed by self-employed (16%), and most earn a net income of 2700 EUR/month or less (75.6%). Regarding travel characteristics, both habitual and occasional PT users are at similar rates (50.6% and 49.4%, respectively). In terms of autonomy in the mobility of family members, 66% of PV users have no dependent members in their family and use their car to drive mainly by themselves.
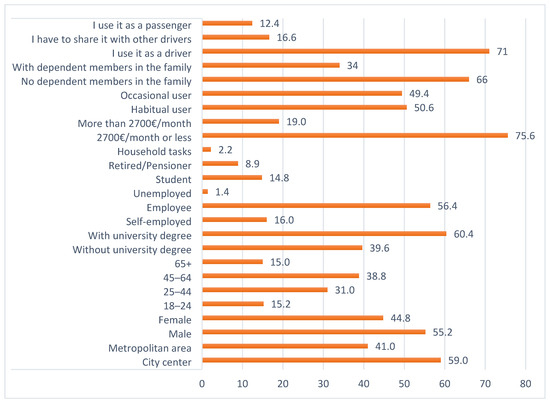
Figure 1.
The sample description and characteristics of the survey.
2.2. Analysis Tolls
This paper analyses the perception of quality that regular PV (i.e., car, motorcycle, or scooter) users have about private cars and PT simultaneously in an Eastern European context. This study tries to fill the previous research gap in understanding PV users’ motivations that could encourage mode change [40,41,42,43]. Before the primary investigation, a descriptive statistical analysis was conducted to overview the perception of PV users regarding car and PT services. Then, to achieve a comprehensive analysis and deal with the heterogeneity in perceptions, 15 models were developed for the entire sample and 14 user segments for private car service quality. This study can explore the heterogeneity analysis in travelers’ evaluations of PT and personal car service by applying market segmentation methods [41]. Hence, market segmentation studies suggest disaggregating data into segments, defined as a data mining technique, which can then be used to identify groups of respondents who have similar characteristics [42].
In this study, a promising model [3], the ordered logit model (OLM) was used because the nature of the data and the dependent variable is ordinal in this case and performing a simple regression result is biased for the outcomes [31]. To compare different OLMs in this study, the results of the estimated coefficients (B) and the significant values (p-value) shown for each quality-of-service attribute were significant at the 95% confidence level. The dependent variable is one item (overall satisfaction), and the eight independent variables are those car service attributes utilized for the calculation. The ordered logit model shows in Equation (1) as follows: Defining y* as a latent variable, the structural model is:
where i is the observation and ε is a random error. In this case, y*i is the dependent variable (satisfaction); xi is the set of independent variables for individual i (quality of service perceptions); β are the parameter estimates to be calculated; and εi is the error term [40]. All statistical analysis was performed using STATA/MP-15.
y*i = β⋅xi + εi
3. Results and Discussion
3.1. Descriptive Statistics Analysis
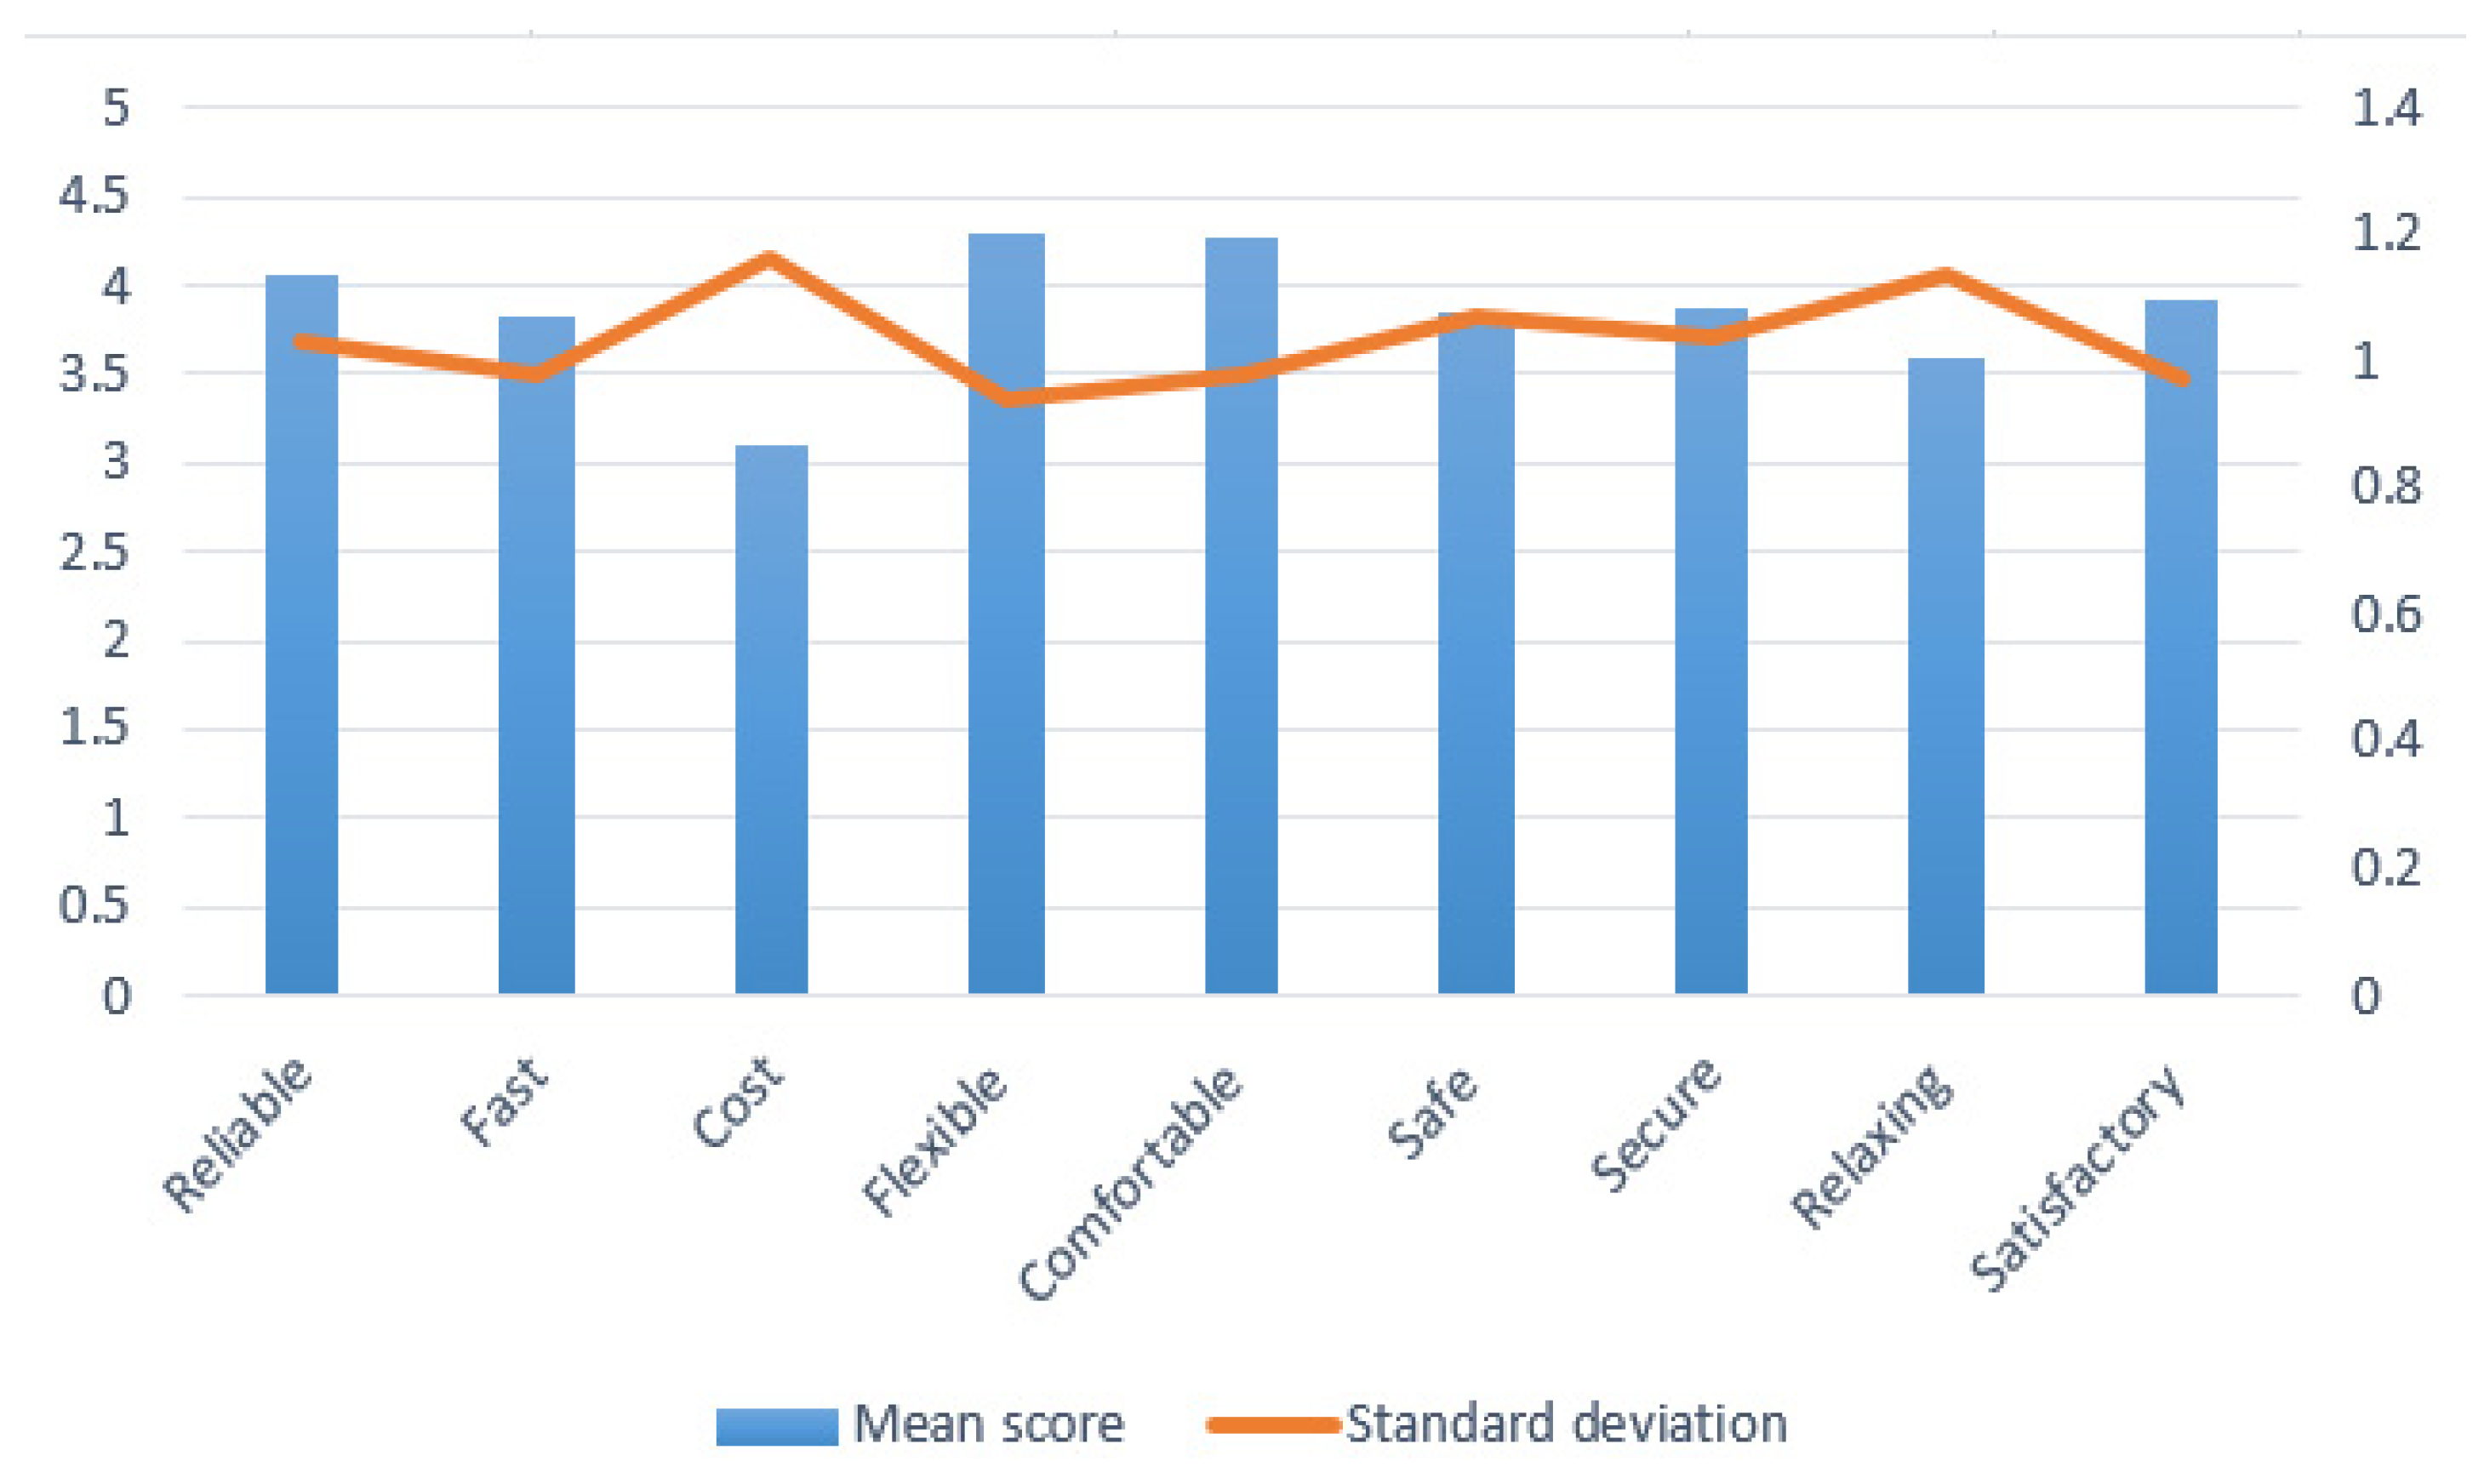
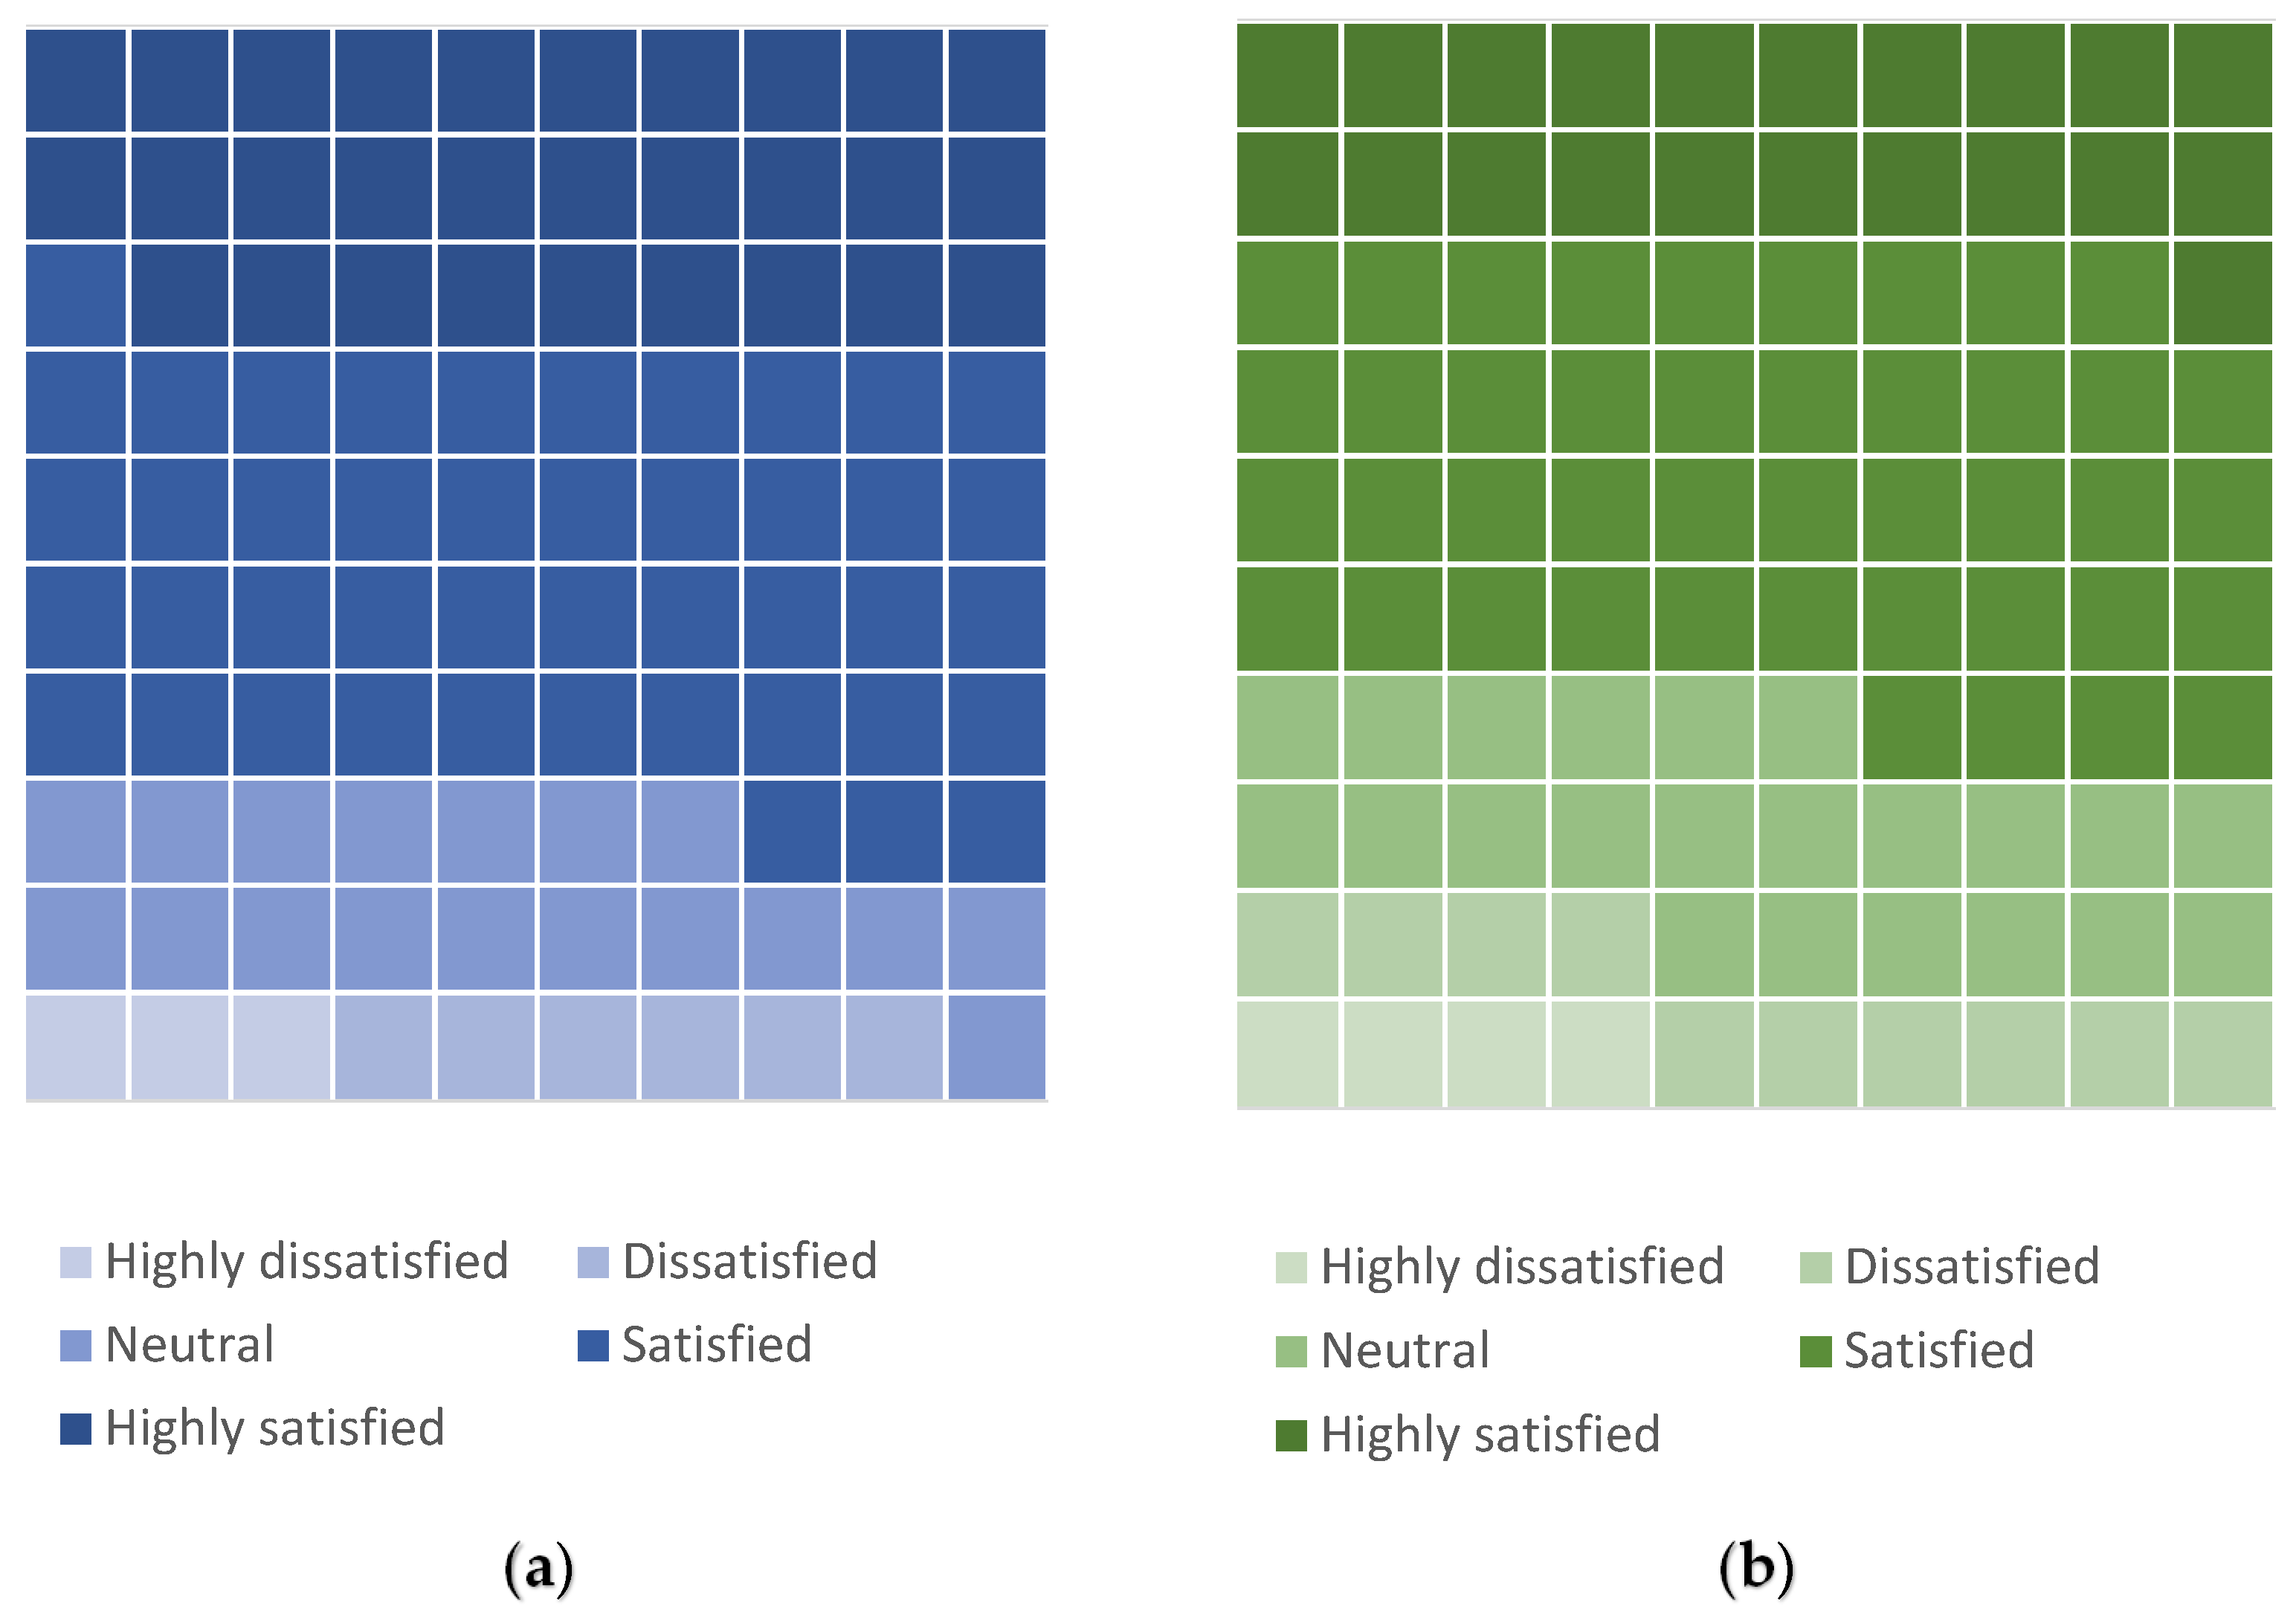
Figure 2 shows that the PV users perceived a higher average satisfaction score for flexibility and comfort, followed by reliability (4.29, 4.26 and 4.05, respectively). Moreover, the results indicate that the PV users’ satisfaction with car service is overall satisfactory. However, good value for money has a lower mean score. Figure 3a presents the overall satisfaction of PV users with the car, and Figure 3b with PT service on a 5-point Likert scale (1: highly dissatisfied, to 5: highly satisfied). It can be seen that 73% of PV users are satisfied or highly satisfied with the car service during their commute by car, while 64% of PV users are satisfied or highly satisfied based on overall satisfaction with the PT system.
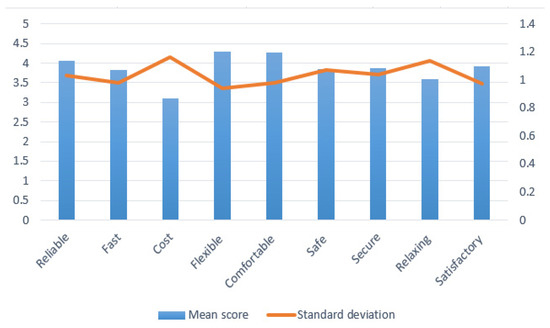
Figure 2.
The mean and standard deviation of car service quality attributes.
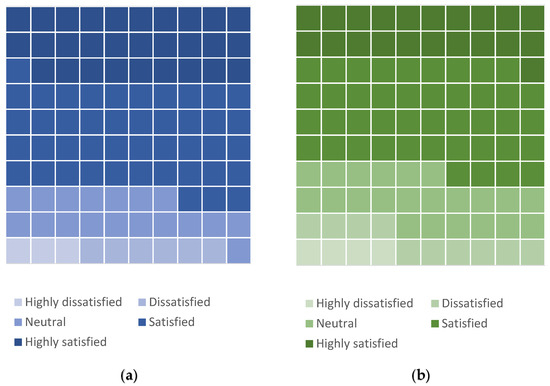
Figure 3.
The overall satisfaction of PV users with car service (a) and with PT service (b) on 1–5 Likert scale.
Additionally, the respondents who at least have knowledge of PT were asked to respond to eight statements adopted from [43] to evaluate the PT system, as follows: To what extent do you agree with the following statements? Using a 5-point Likert scale (1. completely disagree, 5. completely agree).
Q1. Public transport is only for citizens with low income.
Q2. Public transport gives me the freedom to move around the area easily.
Q3. Although it is an effort for me to use public transport, I am rewarded because I save time and money.
Q4. I feel that using public transport is in line with my lifestyle.
Q5. When using public transport, I am helping towards improving the environment.
Q6. I feel that by traveling on public transport I am helping to reduce problems derived from traffic (in other words, traffic jams, noise, pollution, etc.).
Q7. The people that are most important to me recommend that I use public transport.
Q8. I think that by using public transport I can improve the way that relatives and friends judge me.
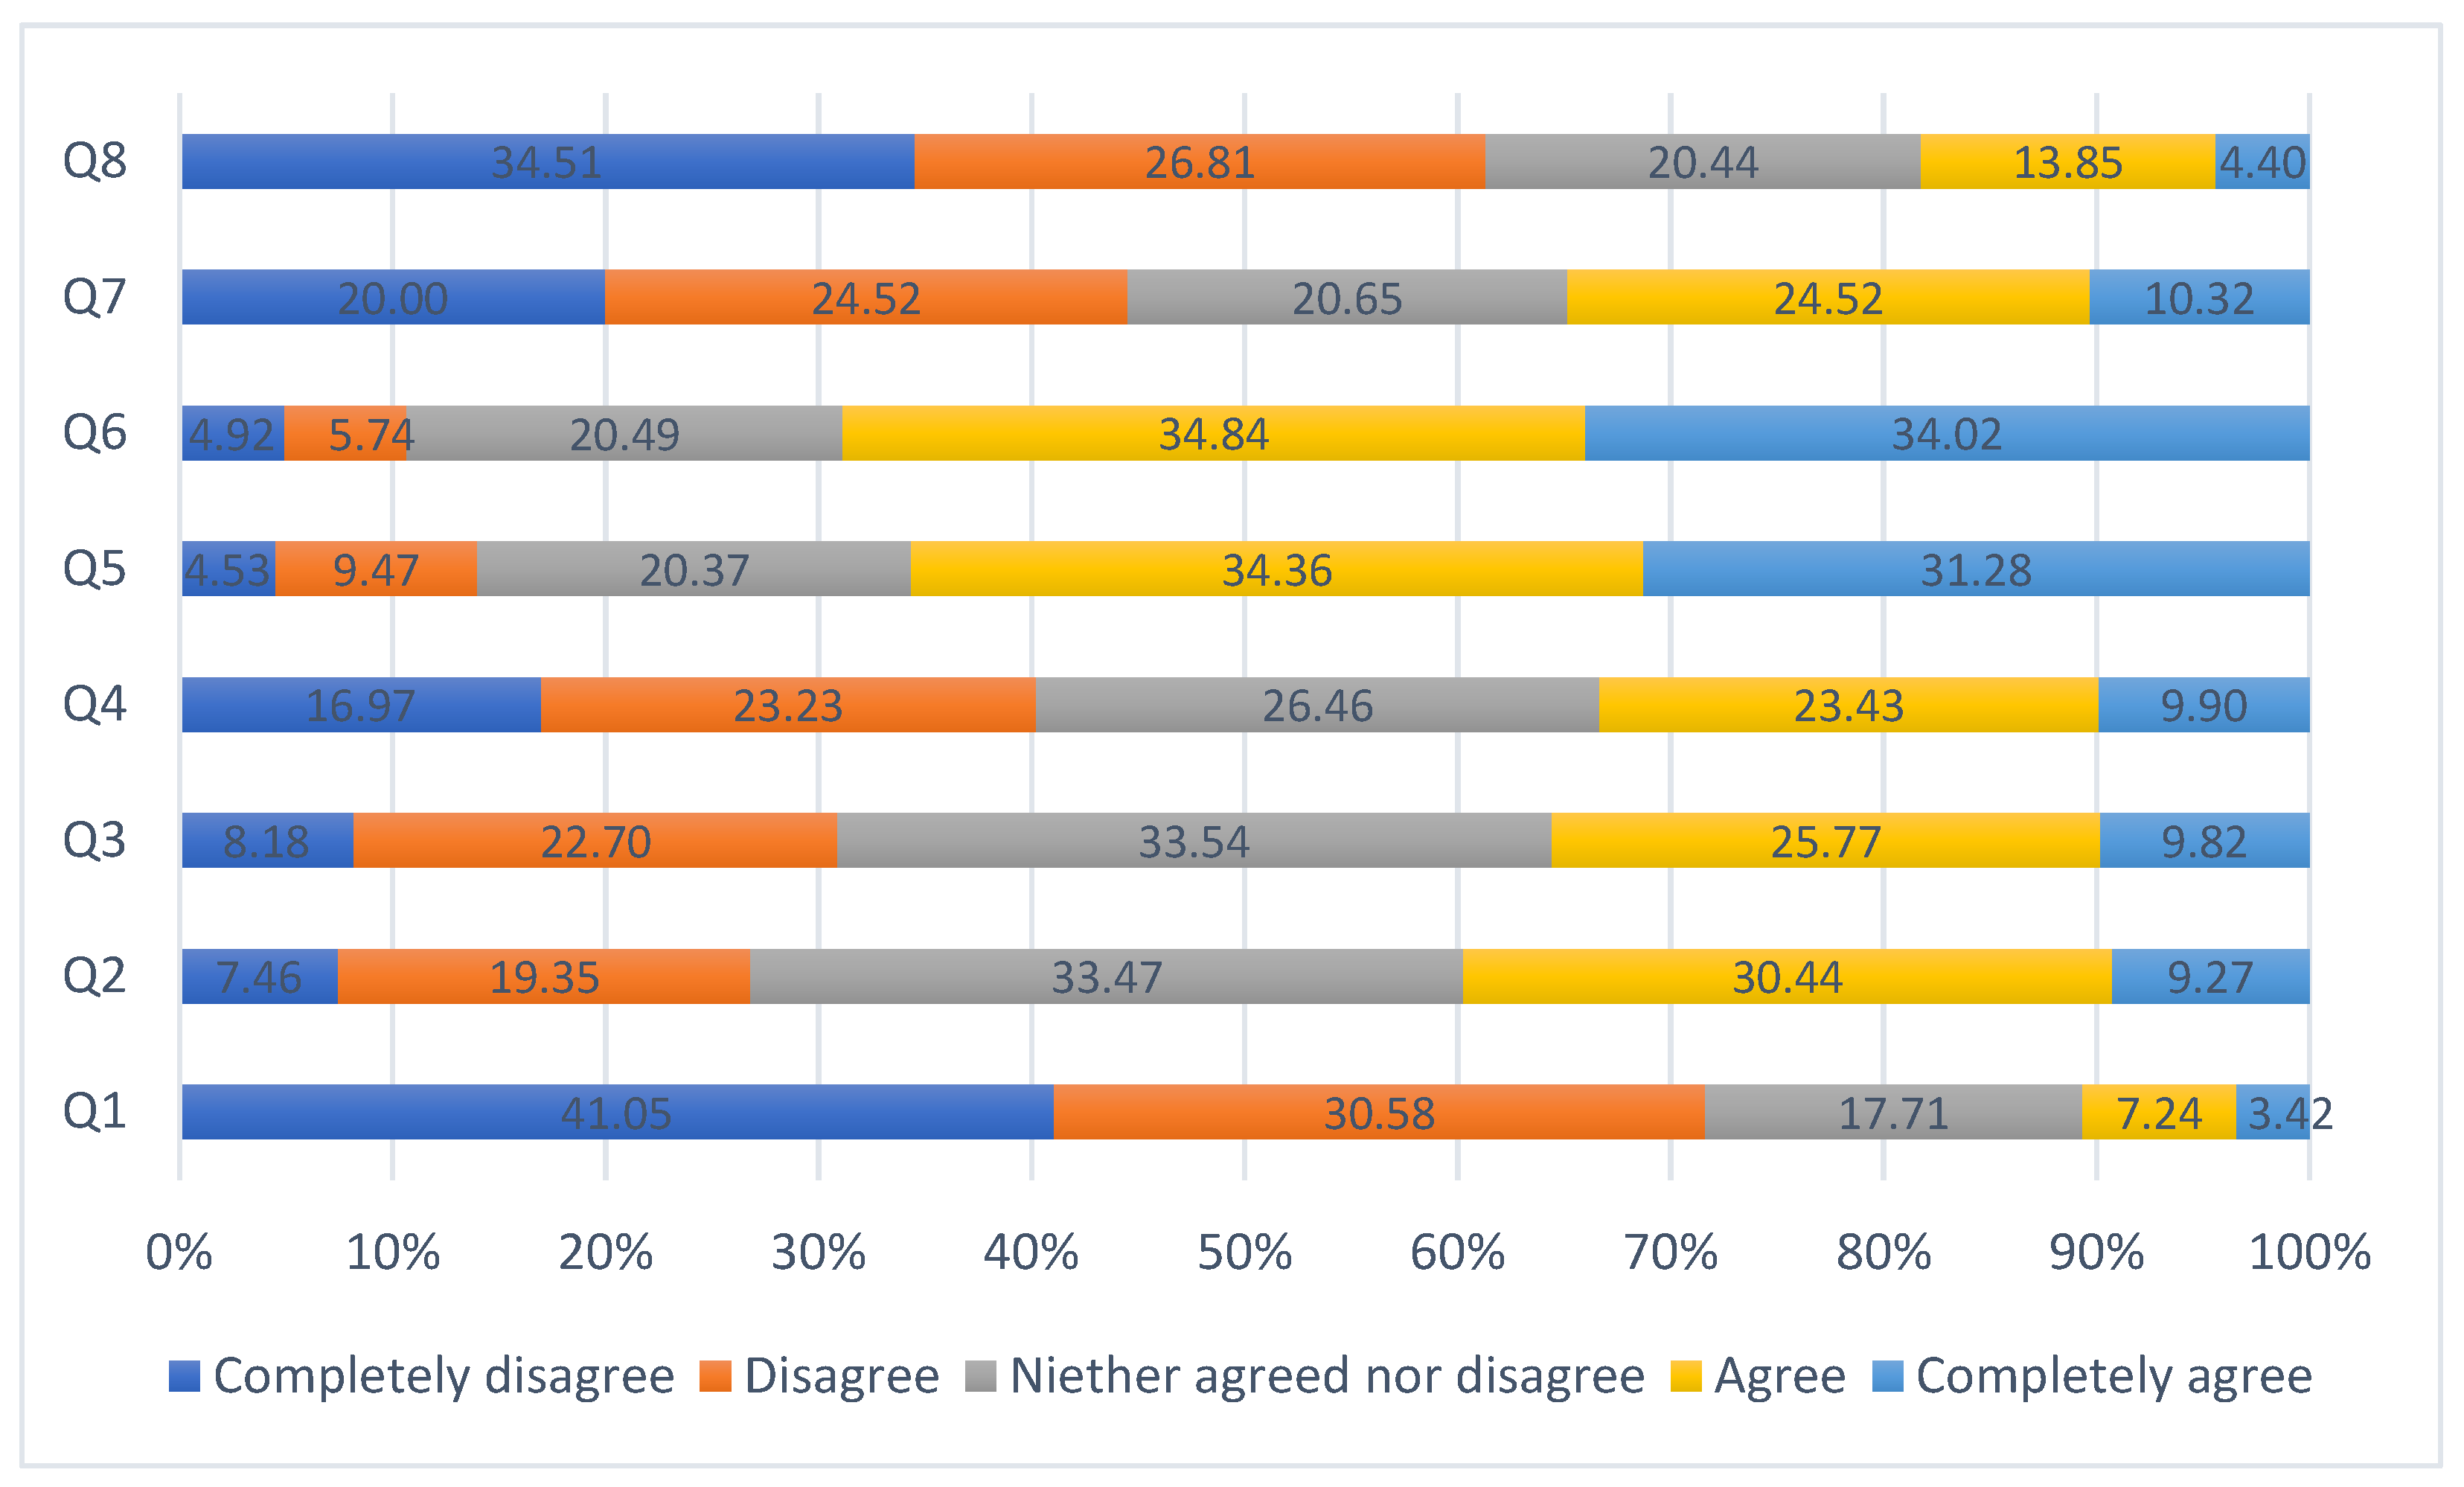
Figure 4 shows that the majority of PV users agreed that using the PT service is good for improving the environment and reducing traffic externalities (e.g., noise, accidents, traffic congestion) 65.64% and 68.86%, respectively. However, many respondents, approximately 34% of PV users neither agree nor disagree to save time and money by using PT. Moreover, 39% with Likert 1–2 of PV users’ consensus is that the PT system is not appropriate for their lifestyle.
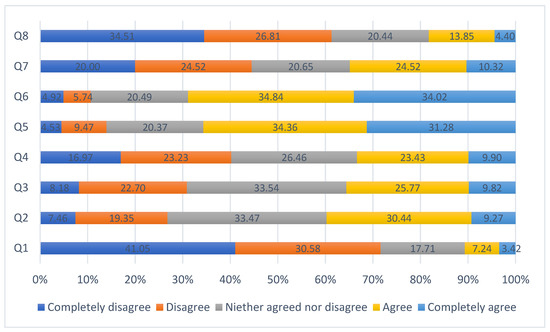
Figure 4.
The PV users’ opinions regarding PT service on a 1–5 Likert scale.
3.2. General Model and Market Segment Results
Transport operators and policymakers need to understand how private PV users perceive quality and identify what is important to them. This could be utilized to attract potential users towards the sustainable transport in Eastern European country. For this purpose, segmentation analysis enabled a depth of insight into the experience of private vehicle users regarding car service quality and their motivation for private car use. Table 1 illustrates the estimated result coefficient and p-value for each service quality attribute of the car that was significant at a 95% confidence level. Looking at the results, safe with regard to robbery (security) and relaxing were the most significant impacts on almost all models. Flexibility had the next place of significance (12 models), followed by comfortability (11 models). Safe with regard to accidents (safety) had no significant influence on any segment, and good value for money (cost) was the second-least significant attribute, being significant for only 2 models. This was followed by the fast variable, being significant for 3 models. Reliability was found to be not significant for 4 models. Table 1 demonstrates the comparison for the following segments:

Table 1.
The results of ordered logit models for several segments of socio-demographic and travel characteristics.
- City center vs. urban area: reliability, comfort, flexibility, security and relaxation are important attributes for both segments. However, PV users consider the speed of their travel (fast) significant, while it is not significant for the urban area segment.
- Male vs. female: interestingly, flexibility, security and relaxation are the important attributes for females, whereas the majority of attributes are significant for males.
- From 18 to 44 years old vs. older than 44 years old: Reliable, safe with regard to robbery and violence (security) and relaxing are significant attributes for both. However, safe with regard to accidents (safety) and speed (fast) are not important for both segments.
- Habitual PT user’s occasional PT users: for occasional PT users, only two attributes are important (fast and relaxing), while five attributes are important for those who use PT more than four times a week.
- With university education vs. without a university degree: surprisingly, for both segments, three attributes are not important (fast, cost and safe regarding accidents).
- With dependent family members without dependent members in the family: similar to the previous segment, cost and safety are not significant for both. Fast is not significant only for those with no dependent family members, while reliable is not significant for those with dependent family members.
- Low income vs. high income: Safe with regard to robbery (safety) and relaxing are significant attributes for both high-income and low-income users, while the other important attributes for low-income users are comfortable, flexible and reliable.
Based on the results displayed in Table 1, the adjusted R2 (pseudo) values ranging from 0.315 to 0.470 can be taken to indicate a good model fit for customer satisfaction data. Moreover, the log-likelihood ratio test reveals that for all 15 models, including general and all segmentations, the proposed models are better for customer satisfaction data than the intercept-only models.
To attract PV users towards using sustainable transport such as PT and emerging transport modes. It is vital for transport planners, policymakers and transport providers to enhance their grasp of the perception of PV users and identify the priority service attributes that have a more significant influence on their level of overall satisfaction. It could be beneficial for making plans to attract these potential users. Both descriptive and market segmentation analysis were carried out in this study. They have shown how to understand the motivation of the PV users and identify the most significant attributes for particular segments and discover the similarities and differences between them.
Overall, this research has determined that safety concerning robbery and relaxation had an enormous impact on almost all models, similar to the previous work [14], which identified that security in the vehicle and stations is important for PV users.
Interestingly, findings show that the safety factor regarding accidents is insignificant and good value for money is significant for only one or two segments. Several factors, for example, reliability and safety regarding accidents, play important roles in selecting a specific transport mode [44].
A market segmentation technique was selected for this study, which is very useful for analyzing and identifying the relevant attributes for a specific segment, as well as for making comparisons among the segments, for example, the gender group (i.e., male vs. female). Furthermore, using segmentation analysis leads to higher heterogeneity for different socioeconomic and travel characteristics.
A previous study pointed out that several PT service quality attributes significantly affect PV users’ general satisfaction [3,30]. This study has found that PV users are satisfied overall with the PT service, in line with previous research that found PV users judged less negatively about the PT system [12]. Hence, there may be intentions among PV users to use PT more regularly. In addition, another study found that public transport supply and car ownership are important predictors of using a car [45].
In contrast, in a previous study, most PV users agreed or very much disagreed that the PT system is not suitable for their lifestyle [12]. Therefore, transport provider should make more efforts to ensure PT can compete with private cars. In addition, due to mobility changes, it may become essential to introduce an emergency new service, such as mobility as a service for vehicles [46]. Moreover, enhance the adoption of commercial private electric vehicles (EVs) which is currently less than that of conventional private cars [47].
Without a doubt, the results of this study have some limitations. First, segmentation analysis was based on the PV users’ perceptions of car service. Future studies should consider the other PT service quality perceptions for segmentation analysis. The specific results should not be generalized without additional study because of the differences in the context and attitudes of different people. In addition, this technique should be used for sustainable private vehicles (emerging transport modes) to analyze perceptions associated with them. We also acknowledge that PV users’ opinions were considered in this research, including micro-mobility users. Further research should separate private car and micro-mobility users’ perceptions and satisfaction. Finally, this study found that PV users may intend to use PT, so future research should consider behavioral intentions of PV users concerning PT service quality attributes.
4. Conclusions
From the transport planning point of view, decision-makers and transport operators need to understand how to reduce PV usage and attract users towards using sustainable transport (e.g., public transport). Several effective measures should be considered, such as accommodating congestion pricing, removing free parking and providing enhancements in service quality as desired by passengers. Therefore, it is vital to thoroughly understand how PV users perceive the quality of private car service during their commute. In addition, it is important to identify which attributes are the most significant for satisfying PV users. This research aimed to contribute to the existing knowledge about how PV users perceive car service and PT service in Budapest. In this study, regular-PV-user satisfaction was analyzed using a 500-participant sample size. Additionally, determining the main elements influencing the overall satisfaction was aimed at making suggestions for policymakers.
The key findings show that 73% of PV users are satisfied or highly satisfied with the car service during their commute by car, based on overall satisfaction. In comparison, 64% of PV users are satisfied or highly satisfied with the PT system in the urban area of Budapest city. On the other hand, the majority of PV users agreed that using the PT service is good for the environment and reduces traffic externalities (e.g., noise, accidents and traffic congestion). Second from the heterogeneity analysis, this study found that, more specifically, relaxing was the only attribute that was known to be important in all the models. However, being safe with regard to robbery and violence was significant for 14 models. Thus, to attract PV users to use PT, the service providers need to introduce high security and relaxation in the PT vehicles during customer travel as an alternative to the private car. Conversely, the good value for money and fast attributes were significant in many models, and the safety regarding accidents attribute was not important in any of the models.
Predictably, this shows that the PT system is safer than a personal vehicle from an accident point of view. This study would be beneficial for sustainable transport providers to properly determine the priority attributes for PV users from a different point of view to avoid wasting money and valuable resources.
Finally, future studies should use the segmentation technique to analyze PT users’ opinions regarding the PT system and consider emerging transport modes (i.e., autonomous vehicles and electric vehicles) and other travel attitude concepts, such as behavioral intention, acceptance and prediction.
Author Contributions
The authors confirm contributions as follows: conceptualization, K.I. and S.D.; methodology, K.I.; software, K.I.; validation, K.I. and S.D.; formal analysis, K.I.; investigation, K.I.; resources, K.I.; data curation, K.I.; writing—original draft preparation, K.I.; writing—review and editing, K.I.; visualization, K.I.; supervision, S.D.; project administration, K.I. All authors have read and agreed to the published version of the manuscript.
Funding
This research received no external funding.
Institutional Review Board Statement
Not applicable.
Informed Consent Statement
Not applicable.
Data Availability Statement
Not applicable.
Conflicts of Interest
The authors declare no conflict of interest.
References
- Ismael, K.; Razzaq, N.A. Traffic Accidents Analysis on Dry and Wet Road Bends Surfaces in Greater Manchester-UK. Kurd. J. Appl. Res. 2017, 2, 284–291. [Google Scholar] [CrossRef] [Green Version]
- Beirão, G.; Cabral, J.A.S. Understanding attitudes towards public transport and private car: A qualitative study. Transp. Policy 2007, 14, 478–489. [Google Scholar] [CrossRef]
- De Oña, J.; Estévez, E.; De Oña, R. Perception of Public Transport Quality of Service among Regular Private Vehicle Users in Madrid, Spain. Transp. Res. Rec. J. Transp. Res. Board 2020, 2674, 213–224. [Google Scholar] [CrossRef]
- Saeidi, T.; Mesbah, M.; Habibian, M. Sequenced Ordered Logit Model Considering Latent Variables for Determining Trip Satisfaction of Metro Passengers. Transp. Res. Rec. J. Transp. Res. Board 2020, 2674, 755–766. [Google Scholar] [CrossRef]
- Anik, M.A.H.; Ahmed, F.; Atin, F.N.; Ahmed, N.T.; Mutsuddy, A.; Al Imran, M.; Rayhan, R. Motivating Factors for Private Car Users to Use Public Transport. Int. J. Traffic Transp. Eng. 2018, 8, 82–98. [Google Scholar]
- Borhan, M.N.; Ismail, A.; Rahmat, R.A.O.; Ambak, K. Effect of transport policies to shifting private car users to park-and-ride in Putrajaya, Malaysia. Aust. J. Basic Appl. Sci. 2011, 5, 303–308. [Google Scholar]
- Webb, R. Public transport versus the private car: A study of attitudes towards transport modes in Plymouth. Plymouth Stud. Sci. 2011, 4, 325–371. [Google Scholar]
- Jakobsson, C.; Fujii, S.; Gärling, T. Determinants of private car users’ acceptance of road pricing. Transp. Policy 2000, 7, 153–158. [Google Scholar] [CrossRef]
- Holmgren, J. Meta-analysis of public transport demand. Transp. Res. Part A Policy Pract. 2007, 41, 1021–1035. [Google Scholar] [CrossRef] [Green Version]
- Nguyen-Phuoc, D.Q.; Young, W.; Currie, G.; De Gruyter, C. Traffic congestion relief associated with public transport: State-of-the-art. Public Transp. 2020, 12, 455–481. [Google Scholar] [CrossRef]
- Luo, Y.; Wu, Y.; Li, B.; Qu, J.; Feng, S.; Chu, P.K. Optimization and cutting-edge design of fuel-cell hybrid electric vehicles. Int. J. Energy Res. 2021, 45, 18392–18423. [Google Scholar] [CrossRef]
- Steg, L. CAN PUBLIC TRANSPORT COMPETE WITH THE PRIVATE CAR? IATSS Res. 2003, 27, 27–35. [Google Scholar] [CrossRef] [Green Version]
- Mann, E.; Abraham, C. The role of affect in UK commuters’ travel mode choices: An interpretative phenomenological analysis. Br. J. Psychol. 2006, 97, 155–176. [Google Scholar] [CrossRef] [PubMed]
- Gatersleben, B.; Uzzell, D. The journey to work: Exploring commuter mood among driver, cyclists, walkers and users of public transport. Environ. Behav. 2007, 39, 416–431. [Google Scholar] [CrossRef] [Green Version]
- Paez, A.; Whalen, K. Enjoyment of commute: A comparison of different transportation modes. Transp. Res. Part A Policy Pract. 2010, 44, 537–549. [Google Scholar] [CrossRef]
- Redman, L.; Friman, M.; Gärling, T.; Hartig, T. Quality attributes of public transport that attract car users: A research review. Transp. Policy 2013, 25, 119–127. [Google Scholar] [CrossRef]
- Thøgersen, J.; Møller, B. Breaking car use habits: The effectiveness of a free one-month travelcard. Transportation 2008, 35, 329–345. [Google Scholar] [CrossRef]
- Fiorio, C.; Percoco, M. Would You Stick to Using Your Car Even If Charged? Evidence from Trento, Italy. Transp. Rev. 2007, 27, 605–620. [Google Scholar] [CrossRef]
- Moody, J.; Zhao, J. Travel behavior as a driver of attitude: Car use and car pride in U.S. cities. Transp. Res. Part F Traffic Psychol. Behav. 2020, 74, 225–236. [Google Scholar] [CrossRef]
- Miralles-Guasch, C.; Melo, M.M.; Sarda, O.M. On user perception of private transport in Barcelona Metropolitan area: An experience in an academic suburban space. J. Transp. Geogr. 2014, 36, 24–31. [Google Scholar] [CrossRef]
- Lois, D.; López-Sáez, M. The relationship between instrumental, symbolic and affective factors as predictors of car use: A structural equation modeling approach. Transp. Res. Part A Policy Pract. 2009, 43, 790–799. [Google Scholar] [CrossRef]
- Hiscock, R.; Macintyre, S.; Kearns, A.; Ellaway, A. Means of transport and ontological security: Do cars provide psycho-social benefits to their users? Transp. Res. Part D Transp. Environ. 2002, 7, 119–135. [Google Scholar] [CrossRef]
- Jing, L.I.; Kevin, L.O.; Meng, G.U.O. What Influences the Choice Between Private Car and Public Transport for Shopping Trips? Impact of Socio-economic and Built Environment Factors. J. Asian Energy Stud. 2018, 2. [Google Scholar] [CrossRef] [Green Version]
- Borhan, M.N.; Ibrahim, A.N.H.; Syamsunur, D.; Rahmat, R.A. Why Public Bus is a Less Attractive Mode of Transport: A Case Study of Putrajaya, Malaysia. Period. Polytech. Transp. Eng. 2017, 47, 82–90. [Google Scholar] [CrossRef] [Green Version]
- Dixit, A.; Chidambaram, R.K.; Allam, Z. Safety and Risk Analysis of Autonomous Vehicles Using Computer Vision and Neural Networks. Vehicles 2021, 3, 595–617. [Google Scholar] [CrossRef]
- Abduljabbar, R.L.; Liyanage, S.; Dia, H. The role of micro-mobility in shaping sustainable cities: A systematic literature review. Transp. Res. Part D Transp. Environ. 2021, 92, 102734. [Google Scholar] [CrossRef]
- Sareen, S.; Remme, D.; Haarstad, H. E-scooter regulation: The micro-politics of market-making for micro-mobility in Bergen. Environ. Innov. Soc. Transit. 2021, 40, 461–473. [Google Scholar] [CrossRef]
- McQueen, M.; Abou-Zeid, G.; MacArthur, J.; Clifton, K. Transportation transformation: Is micro mobility making a macro impact on sustainability? J. Plan. Lit. 2021, 36, 46–61. [Google Scholar] [CrossRef]
- Ibrahim, A.N.H.; Borhan, M.N. The Interrelationship Between Perceived Quality, Perceived Value and User Satisfaction Towards Behavioral Intention in Public Transportation: A Review of the Evidence. Int. J. Adv. Sci. Eng. Inf. Technol. 2020, 10, 2048–2056. [Google Scholar] [CrossRef]
- Ismael, K.; Duleba, S. Investigation of the Relationship between the Perceived Public Transport Service Quality and Satisfaction: A PLS-SEM Technique. Sustainability 2021, 13, 13018. [Google Scholar] [CrossRef]
- Woldeamanuel, M.; Obsie, A.; Woldetensae, B. Passengers’ perception towards socioeconomic benefits of Addis Ababa light rail transit. Case Stud. Transp. Policy 2021, 10, 198–207. [Google Scholar] [CrossRef]
- De Dios Ortúzar, J. Sustainable Urban Mobility: What Can Be Done to Achieve It? J. Indian Inst. Sci. 2019, 99, 683–693. [Google Scholar] [CrossRef]
- Balcombe, R.; Mackett, R.; Paulley, N.; Preston, J.; Shires, J.; Titheridge, H.; White, P. The Demand for Public Transport: A Practical Guide; Transportation Research Laboratory: London, UK, 2004; Available online: https://discovery.ucl.ac.uk/id/eprint/1349/ (accessed on 1 April 2022).
- Moslem, S.; Alkharabsheh, A.; Ismael, K.; Duleba, S. An Integrated Decision Support Model for Evaluating Public Transport Quality. Appl. Sci. 2020, 10, 4158. [Google Scholar] [CrossRef]
- Alkharabsheh, A.; Duleba, S. Public Transportation Service Quality Evaluation during the COVID-19 Pandemic in Amman City Using Integrated Approach Fuzzy AHP-Kendall Model. Vehicles 2021, 3, 330–340. [Google Scholar] [CrossRef]
- Woods, R.; Masthoff, J. A comparison of car driving, public transport and cycling experiences in three European cities. Transp. Res. Part A Policy Pract. 2017, 103, 211–222. [Google Scholar] [CrossRef] [Green Version]
- Al-Ayyash, Z.; Abou-Zeid, M. Investigating commute satisfaction differences of private car users and public transport users in a developing country context. Transportation 2019, 46, 515–536. [Google Scholar] [CrossRef]
- Hungarian Central Statistical Office. Available online: https://www.ksh.hu/docs/eng/xstadat/xstadat_annual/i_ode008.html (accessed on 1 April 2022).
- Bucsky, P. Modal share changes due to COVID-19: The case of Budapest. Transp. Res. Interdiscip. Perspect. 2020, 8, 100141. [Google Scholar] [CrossRef]
- De Oña, J.; Estévez, E.; de Oña, R. How does private vehicle users perceive the public transport service quality in large metropolitan areas? A European comparison. Transp. Policy 2021, 112, 173–188. [Google Scholar] [CrossRef]
- Abenoza, R.F.; Cats, O.; Susilo, Y.O. Travel satisfaction with public transport: Determinants, user classes, regional disparities and their evolution. Transp. Res. Part A Policy Pract. 2017, 95, 64–84. [Google Scholar] [CrossRef] [Green Version]
- Silver, S.D. Multivariate methodology for discriminating market segments in urban commuting. Public Transp. 2017, 10, 63–89. [Google Scholar] [CrossRef]
- De Oña, J.; Estévez, E.; de Oña, R. Public transport users versus private vehicle users: Differences about quality of service, satisfaction and attitudes toward public transport in Madrid (Spain). Travel Behav. Soc. 2021, 23, 76–85. [Google Scholar] [CrossRef]
- Liao, F.; Correia, G. Electric carsharing and micromobility: A literature review on their usage pattern, demand, and potential impacts. Int. J. Sustain. Transp. 2020, 16, 269–286. [Google Scholar] [CrossRef]
- Saeidizand, P.; Fransen, K.; Boussauw, K. Revisiting car dependency: A worldwide analysis of car travel in global metropolitan areas. Cities 2021, 120, 103467. [Google Scholar] [CrossRef]
- Dorynek, M.; Derle, L.-T.; Fleischer, M.; Thanos, A.; Weinmann, P.; Schreiber, M.; Schumann, S.; Tunc, T.; Bengler, K. Potential Analysis for a New Vehicle Class in the Use Case of Ride-Pooling: How New Model Developments Could Satisfy Customers and Mobility Makers. Vehicles 2022, 4, 199–218. [Google Scholar] [CrossRef]
- Mo, T.; Lau, K.-T.; Li, Y.; Poon, C.-K.; Wu, Y.; Chu, P.K.; Luo, Y. Commercialization of Electric Vehicles in Hong Kong. Energies 2022, 15, 942. [Google Scholar] [CrossRef]
Publisher’s Note: MDPI stays neutral with regard to jurisdictional claims in published maps and institutional affiliations. |
© 2022 by the authors. Licensee MDPI, Basel, Switzerland. This article is an open access article distributed under the terms and conditions of the Creative Commons Attribution (CC BY) license (https://creativecommons.org/licenses/by/4.0/).

