1. Introduction
Long wave infrared (LWIR) cameras are becoming more popular in the consumer section and, therefore, more suitable for monitoring applications. Especially in the automotive environment, Advanced Driver Assist Systems (ADAS) can make use of cheaper thermal sensors for the detection of objects outside the car and for driver monitoring inside the car. While object tracking or especially head tracking is a common task in image processing, the majority of the research is focused on the visible spectrum. Starting in the 1990s, several authors including [
1,
2,
3,
4,
5,
6] demonstrated various head tracking methods in the visible spectrum. Basu et al., La Cascia et al. and Ohayon et al. relied on 3D descriptions of the face allowing to retrieve additional orientation parameters [
1,
3,
6]. Birchfield focused on out-of-plane rotation where the frontal face is not visible using color and gradient information [
2]. Kim et al. and Sebastian et al. demonstrated head tracking using cross correlation, which is based on a template matching [
4,
5]. Focusing on driver monitoring, Smith et al. described a head tracking system using optical flow and color predicates for driver alertness detection [
7]. Baker et al. and Nuevo et al. showed early success with their implementations of Active Appearance Models (AAM) inside the car [
8,
9] and Zhu et al. demonstrated a face tracking method applying Gaussian Mixture Model (GMM) [
10]. Separating the face pixel into foreground and background pixel, they built a two component GMM and performed image back projection to gather the face region. However, outside the visual domain, object tracking is still a challenge. Being invariant against lighting conditions, LWIR cameras allow to record day and night, delivering unvaried video signal quality. Especially for automotive applications the light invariance is of particular interest. In the visual domain the lighting conditions vary not only between day and night. Even during daytime lighting variations are quite complex inside a car. They depend on the position of sun and arising shadows for instance while driving through an avenue. LWIR cameras on the other hand, in contrast to the visible domain, enables new opportunities in gathering information from the video signal. Using the knowledge of the common temperature range of a specific object, the regions containing temperature values in that particular interval can be extracted. The patterns in the infrared image are based on temperature variations and differences of thermal emission. With the information about usual skin surface temperature, for example, in the car, detection and tracking of skin regions can be applied more reliable. Skin region including facial regions can provide data about blood circulation, respiration or measuring stress levels of a person through the combination of the data mentioned before. Extracting these information outside the laboratory conditions is a demanding task which requires additional information about the movement of measuring region. While traditional tracking algorithms are built on data from the visible domain, these algorithms might not work in the far infrared (IR) domain, because the IR image usually provides a low resolution image due to the small sensor size and less detail in texture information because of small temperature variations of a surface. Looking at the typical algorithms that work in the visual domain, Tan et al. displayed the challenge of the commonly used scale invariant feature transform (SIFT) feature descriptor on LWIR images [
11]. They point out the upcoming errors applying SIFT on LWIR videos showing the need of adaption of standard procedures. Zhang et al. carried out a cross-modality evaluation with edgelet and Histogram of oriented gradients (HOG) features on videos of pedestrians, outlining that IR domain and visible domain might share features of this type [
12]. Berg et al. evaluated seven different types of trackers in terms of accuracy and robustness. On an IR dataset, three trackers could achieve a high accuracy: normalized cross-correlation (NCC), discriminative correlation filter-based and discriminative classifier combined with a generative model tracker [
13].
In the medical field, respiratory rate can be calculated from IR videos by measuring the temperature differences at the nostrils while breathing. For automatic extraction of the correct region, head trackers are an essential part and the first step before extracting the facial features or facial subregions. Al-Khalidi et al. applied edge filtering to find the head and search for hotspot/coldspots to extract the relevant region [
14]. Based on segmentation and template matching, Alkali et al. tracked head and nose region to extract the physiological signal [
15]. Kopaczka et al. successfully trained an Active Appearance Model for the tracking of the head and multiple facial features in the infrared domain using a high resolution sensor (1024 × 768 pixel) [
16].
In terms of ADAS Kolli et al. found the head by segmentation, region growing or morphological operations as a prior step to extract drivers emotions from the face [
17]. A vision based airbag deployment system was realized by Trivedi et al. and Krotosky et al. [
18,
19]. Here, the IR camera is not in front of the face or the dashboard but mounted on the side of the driver. After preprocessing steps, like background removal, the head tracking was done by ellipse contour template matching. This system (combined with a stereo setup in the visible domain) has been running on a Xeon-PC from 2004 at 15 frames per second. While not having a training database like in [
16], the other approaches [
14,
15,
17,
18,
19] just relied on image processing methods based on observation. Only the works of [
18,
19] were even tested in an automotive environment.
Picking up the previous work from [
18,
19], we decided to use a simplified shape based descriptor in the proposed algorithm as main component.
Instead of using Sobel operator and extract ellipse contours to describe the head as an ellipse, we will also use a simplified shape, but based on multiple recordings. The scene specialized shape covering the neck region as well will be used with NCC as shown in the benchmark of [
13]. Before the NCC is applied, the image is histogram equalized. In addition to the NCC an optical flow movement estimation is added to cover tracking at the border regions of the image. While the two approaches [
18,
19] use a camera mounted on the side of the driver, we will use cameras mounted in the dashboard and describe a different tracking scenario from the front.
Please note that in an automotive context, the usage of mid-resolution thermal cameras, are currently still unlikely since the prices are not suitable for mass market. Therefore, not only the original image size is evaluated, but also all images are scaled down by bilinear interpolation to simulate a possibly cheaper low-resolution sensors like thermopile arrays.
2. Materials and Methods
The proposed approach is the development of an algorithm for fast reliable head tracking using a thermal camera inside a car for estimating the driver’s posture. Despite using two individual IR cameras, we will evaluate the tracking results of the 2D information from each single camera. Training sequences were recorded to develop the algorithm. Testing of the algorithm was done on a different set of videos containing special head movements.
2.1. Mockup
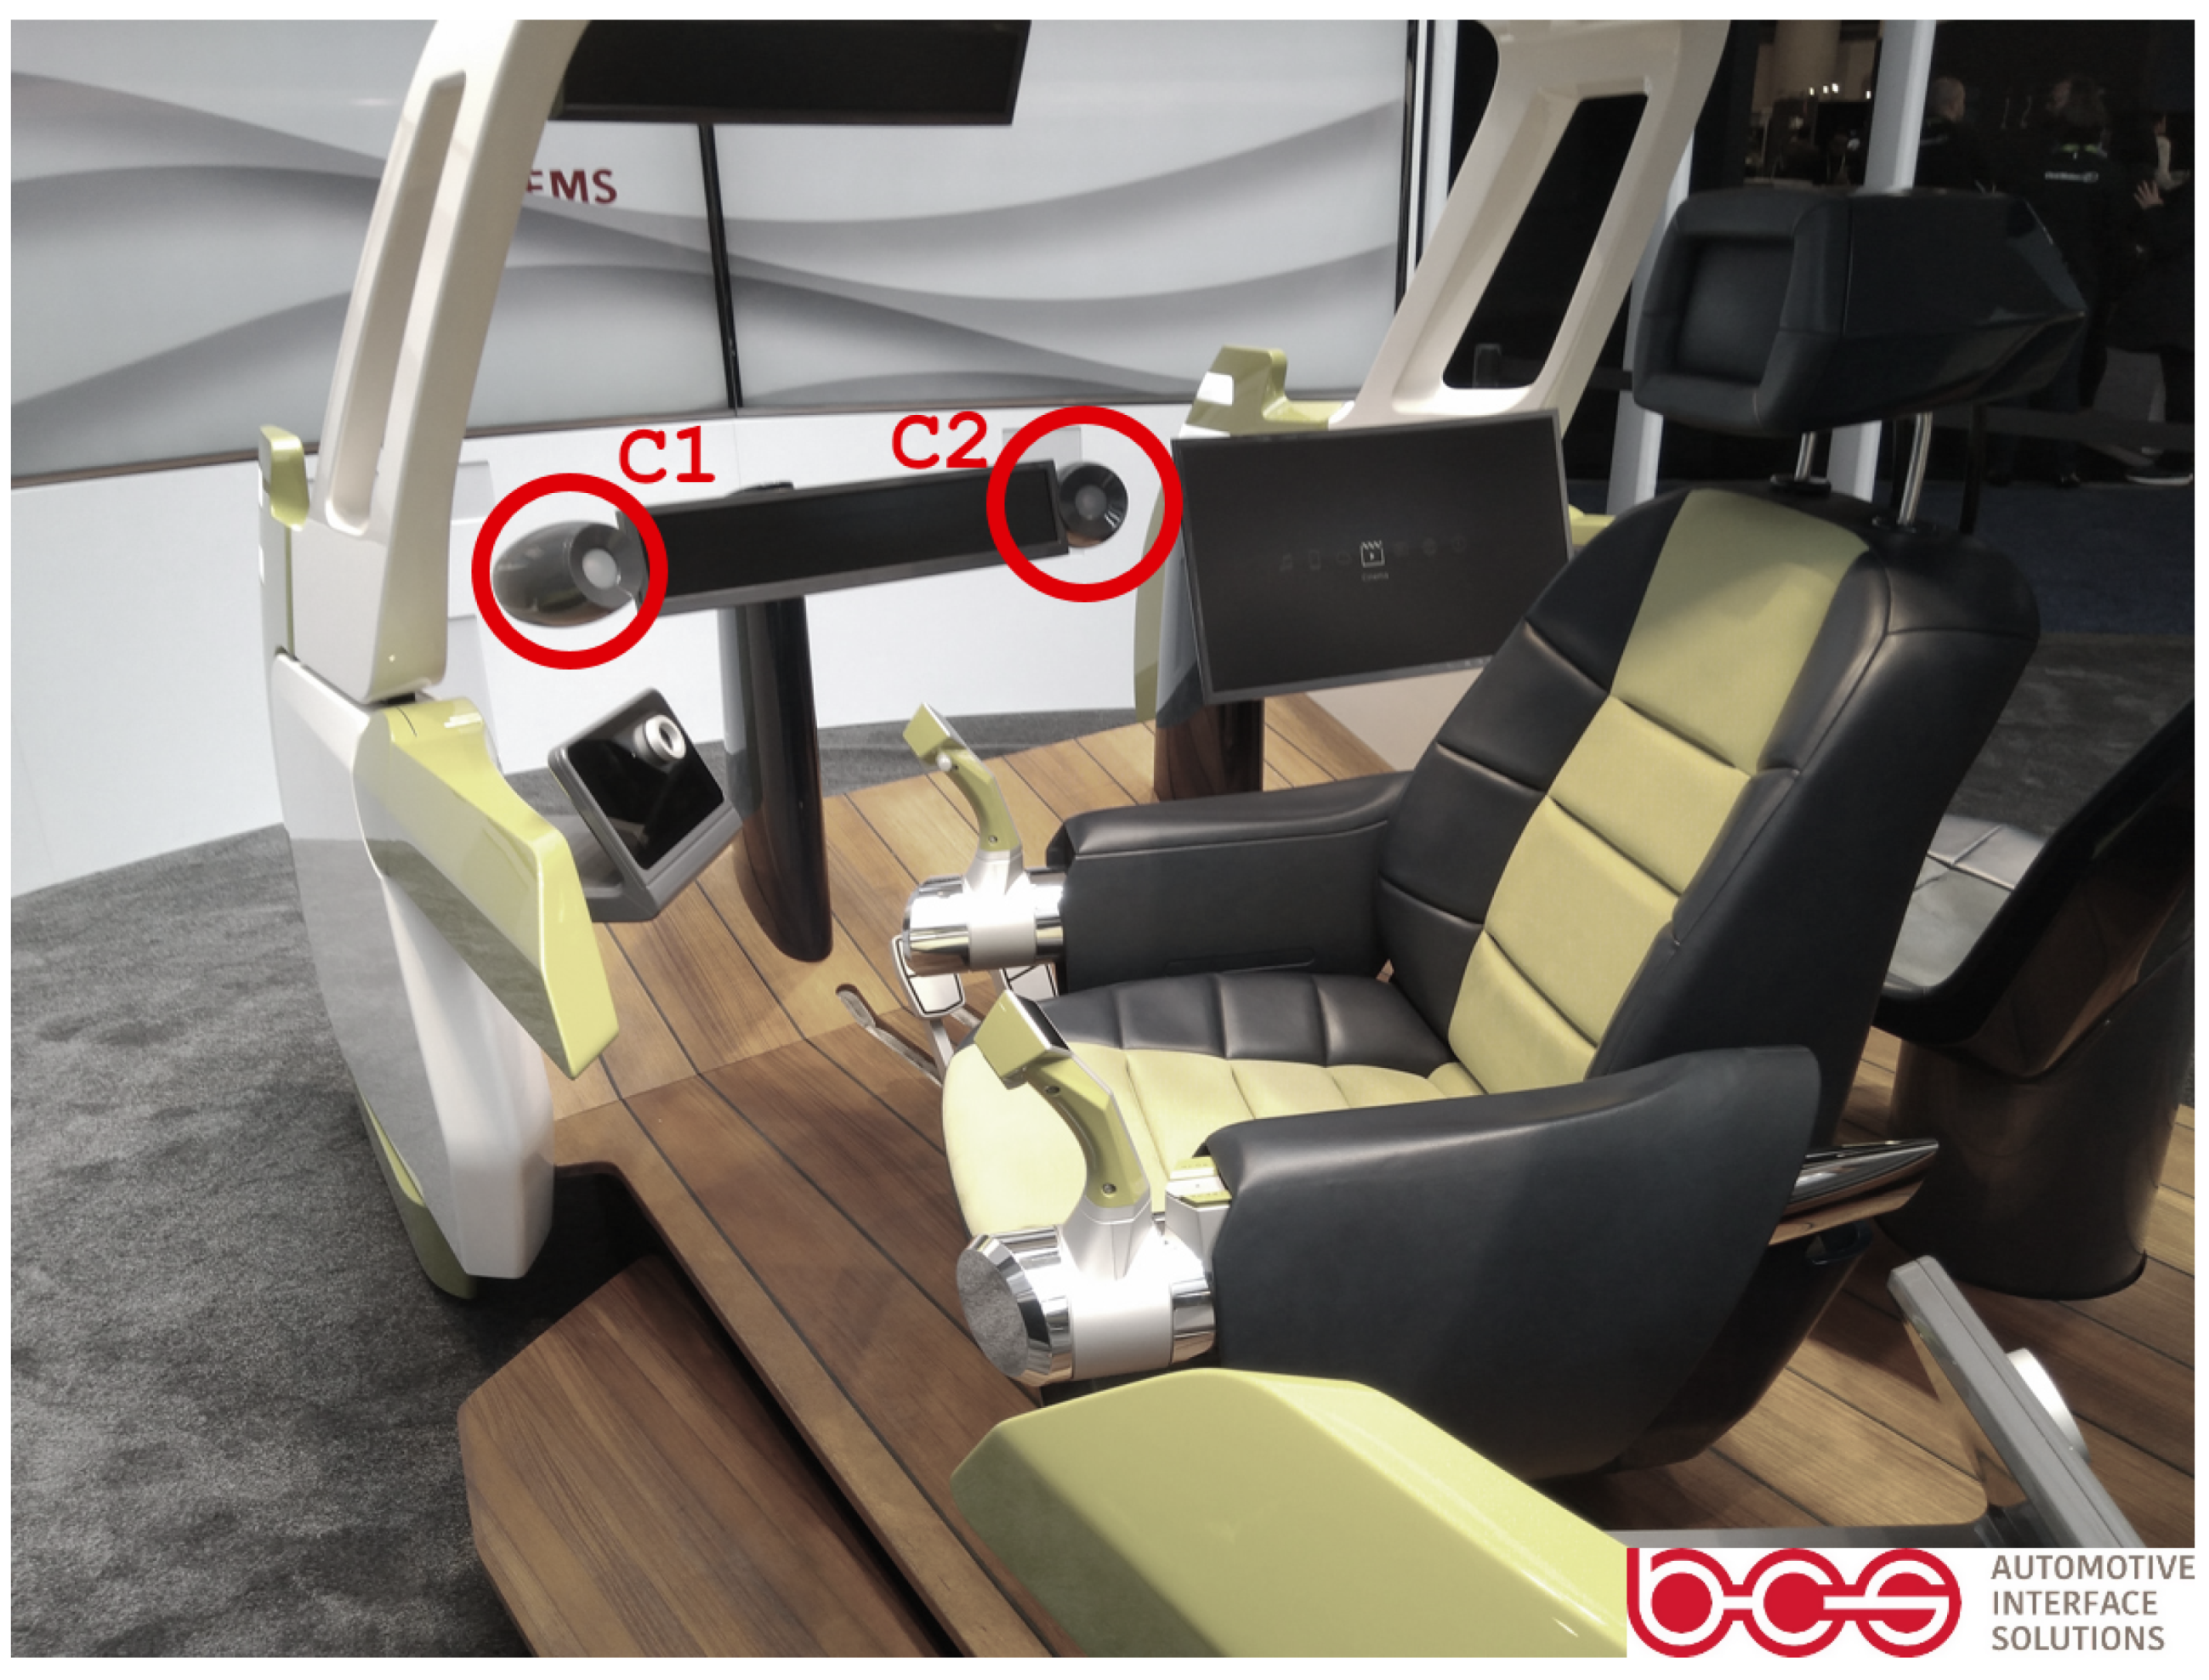
The recording of thermal video data was performed in a specially designed mockup for semi-autonomous driving, with two thermal cameras, located in the dashboard and facing the driver. Having no doors or windows on the sides, the mockup was not enclosed by surroundings, so that the recording also included unwanted background information. The interior included a rotatable driver-seat (
Figure 1) used for easy (de-)boarding and the possibility of facing multimedia screens on the co-driver’s dashboard while driving in autonomous mode.
The demonstrated maneuvering equipment consists of joystick-like drive sticks directly attached to the seat, instead of a common steering wheel. Therefore, usually no hand- or body-movements can occur due to steering. Being a special build for Consumer Electronics Show (CES) in Las Vegas, the futuristic looking mockup is virtually drivable through a driving simulation displayed on panels in the front. The mockup was able to work in two different modes. While in driving mode, the driver’s seat and so the driver was facing the road. In autonomous mode, the drive sticks were inoperative and the seat was rotated towards the co-driver’s dashboard. The rear-view mirror was virtualized too and hence integrated into the simulation. While the front panels showed a simulation in a static view, the field of view inside the mirror was dynamically adjustable and provides an extended field of view without blind spots for advanced safety purposes. This movement of the virtual rear-view mirror needed to be controlled by an input fed into the simulation. The most realistic input would be the coordinates of the center of the driver’s eyes. Here we used the developed head-tracking to determine the position of the head’s center and adjusted the mirror with these values.
2.2. Camera Setup
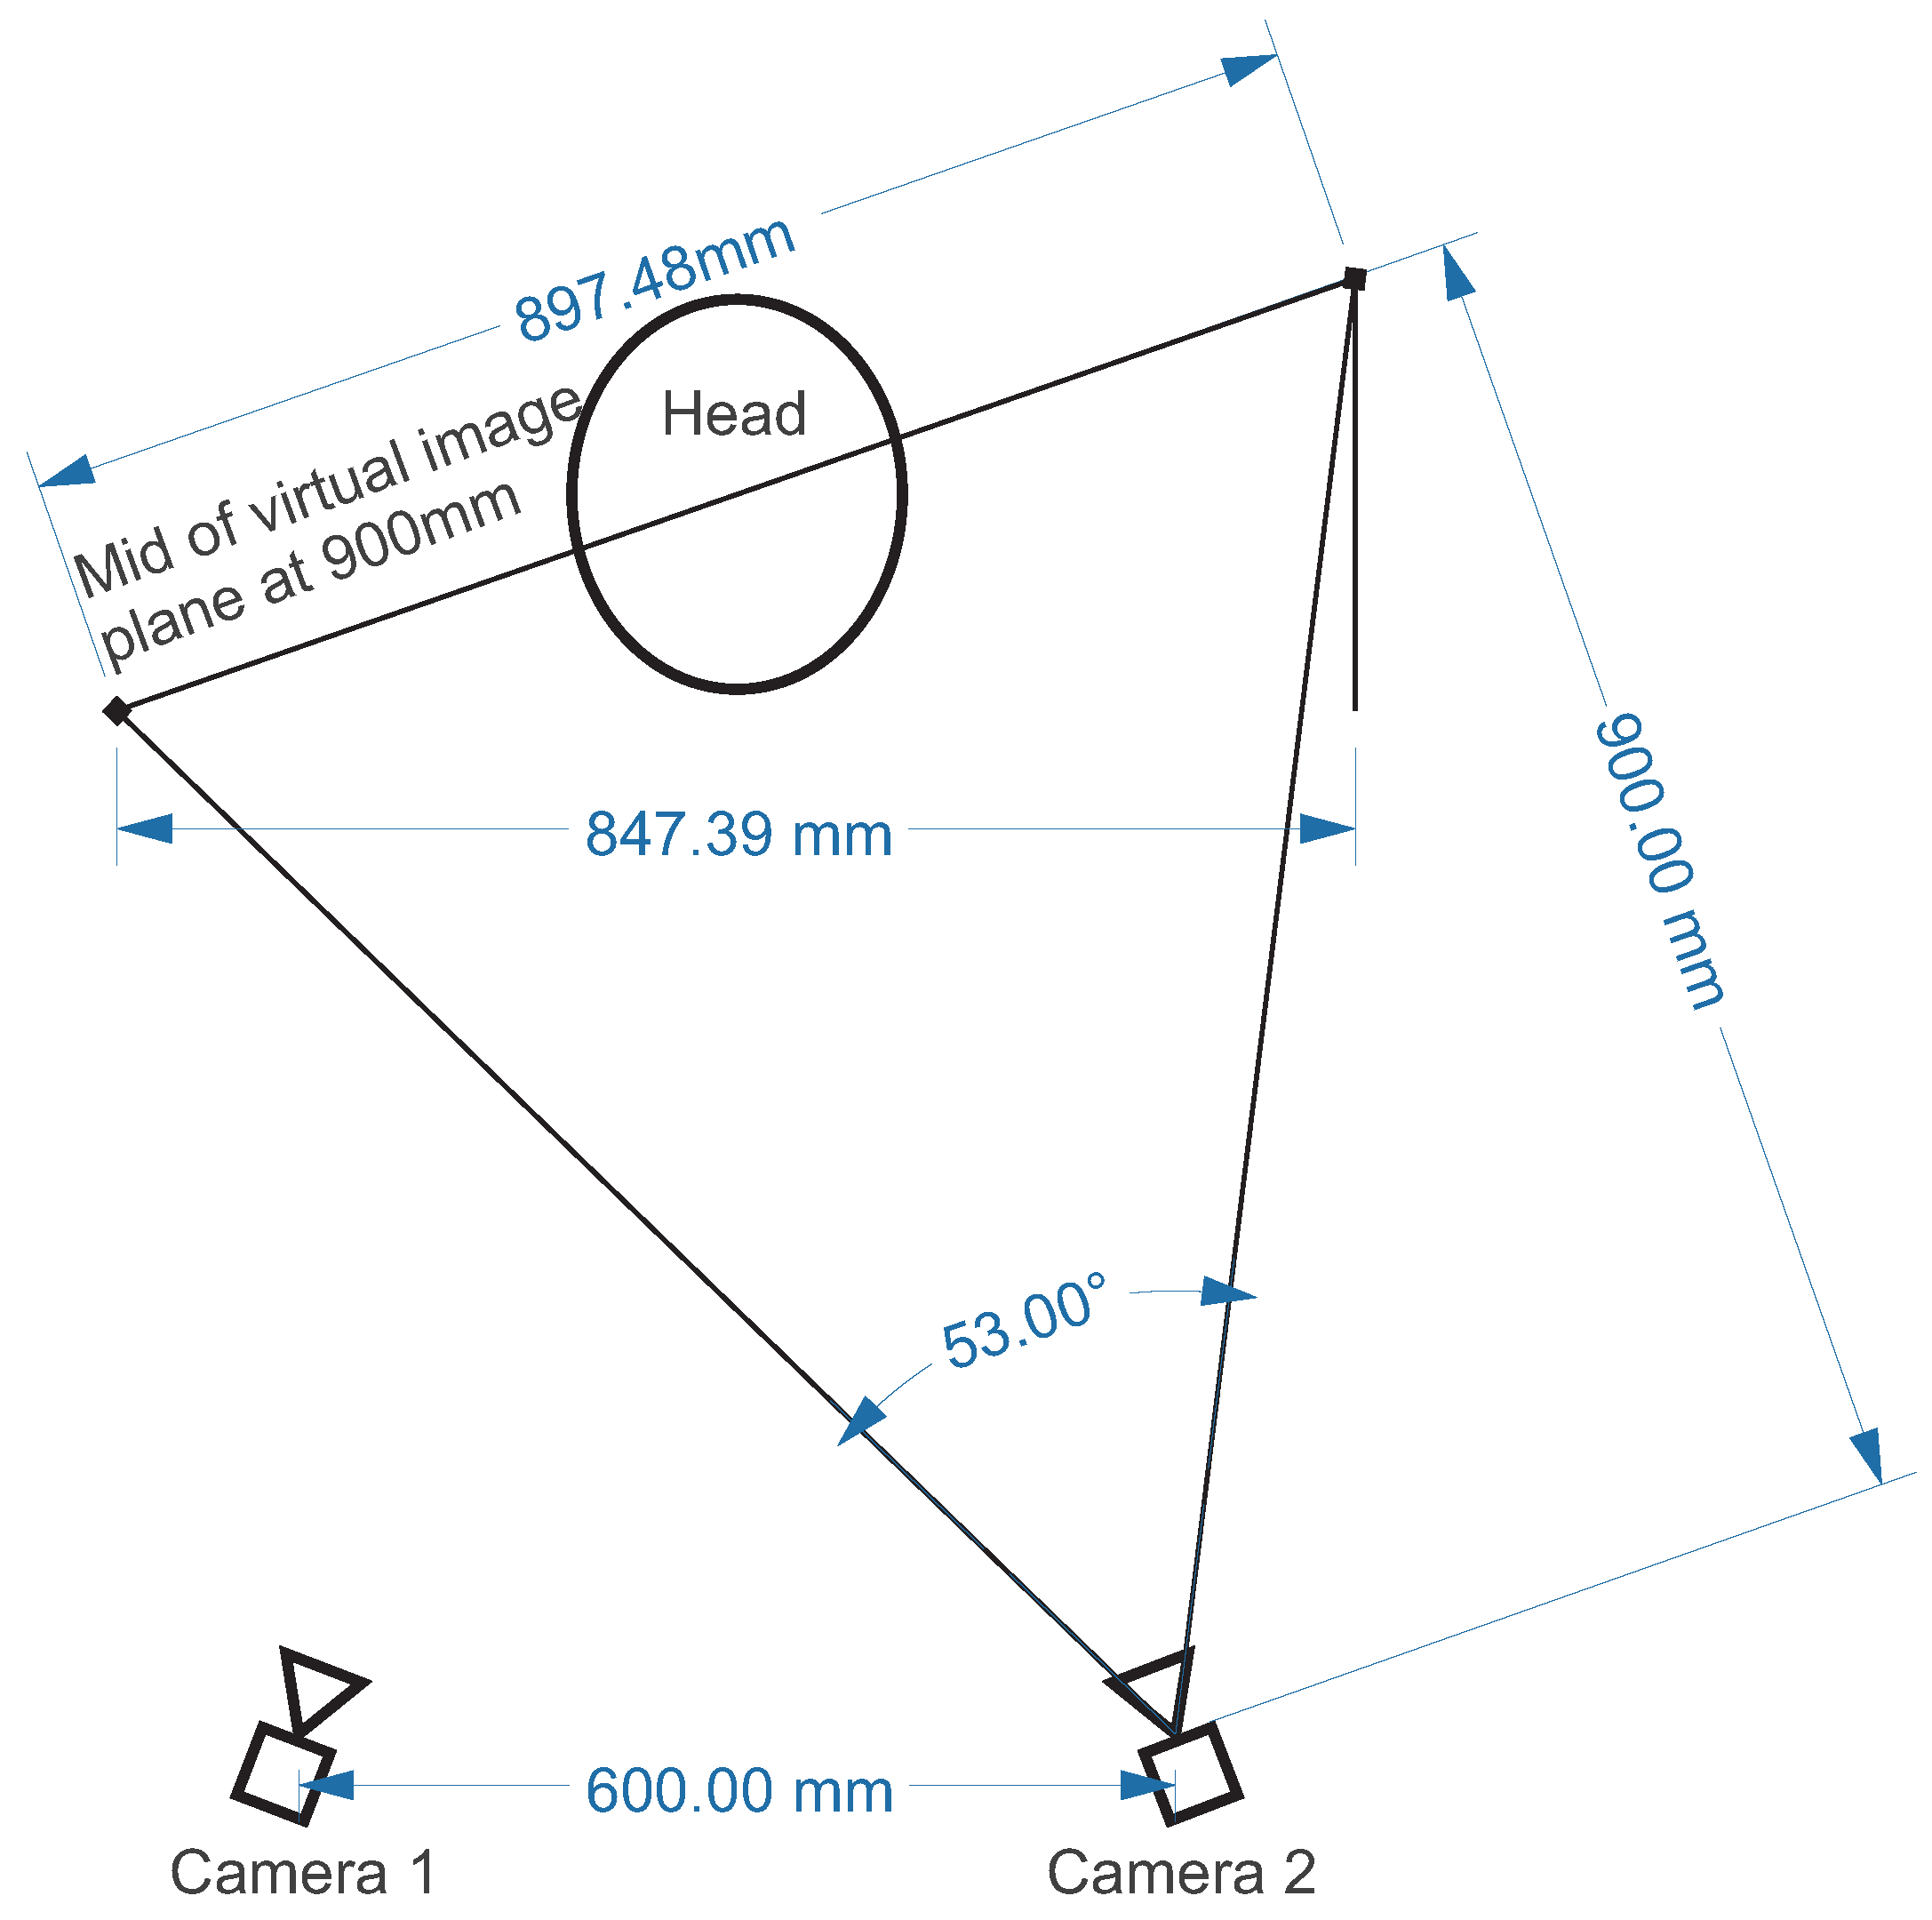
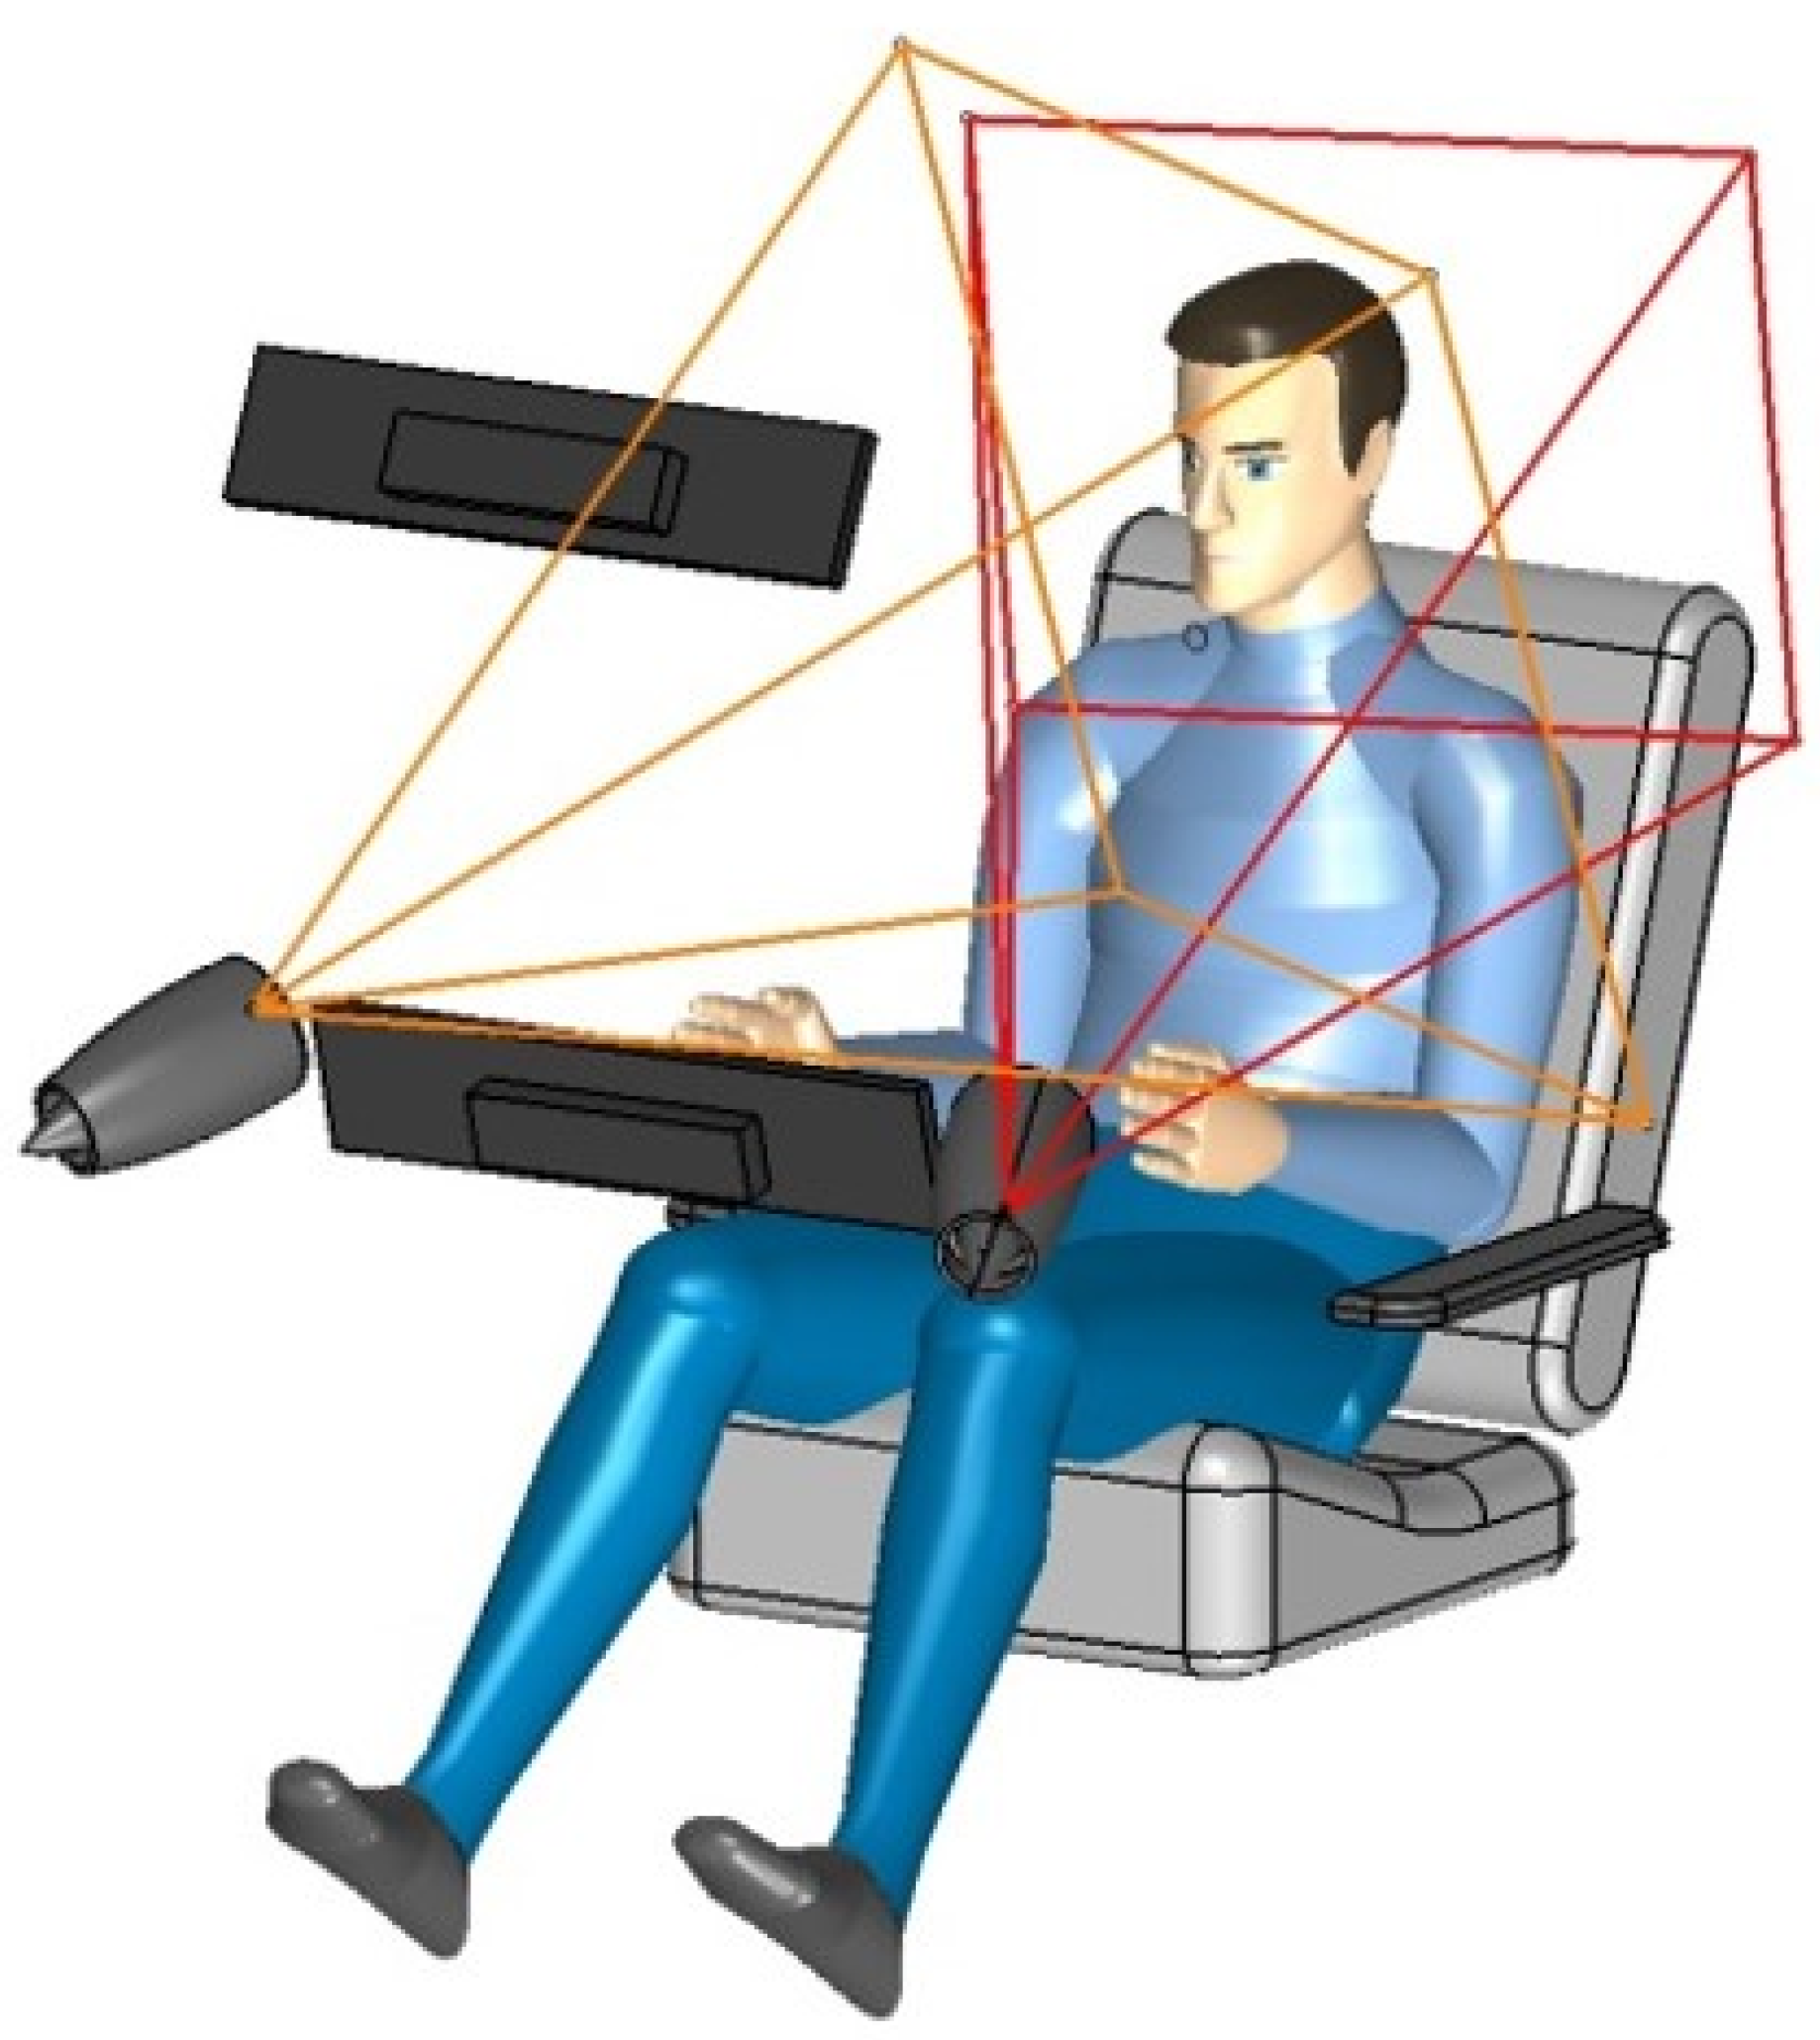
Located at the mockup’s dashboard in front of the driver, two thermal cameras were used as recording devices. According to the data sheets, the cameras (Optris PI 400 Optris GmbH, Berlin, Germany) have a resolution of 382 × 288 pixel (px) with a sensitivity of
. Acquiring at 27 frames per second (fps), the devices were running in software-trigger mode. Using a lens with
×
angle allowed a wide field of view, but resulted in less detailed images. Having a wide field of view allowed us to cover all common movements of the head in the driver seat. In the dashboard the cameras were integrated in front of the driver with a distance of about
to each other (
Figure 2 and
Figure 3) each facing the driver.
The spacing between cameras and head was about resulting in a facial resolution (instantaneous field of view, IFOV) of per pixel in the center of the image, when the head was leaned back in the driver seat. The cameras were calibrated to temperatures from to 100 , while the non-uniformity correction (NUC) was only allowed between the recordings, leading to drifting of absolute temperature values. Additionally, the cameras were placed behind an IR window, in this case a polymer film. Note that the Optris PI 400 is sensitive in the spectral range from 8 –14 . The transmissivity of the IR window is not constant varying from 40% to 60% in that spectral range, leading to various attenuation effects. Due to the drifting temperature effect, absolute temperature values measured by the camera were not assumed to be reliable.
2.3. Training and Algorithm
Building a fast robust generic head tracker for the interior of the mockup required a set of images for training. Due to the lack of suitable public training databases, in this case a small amount of pictures was used for creating a generic mask or template. Five different persons (four male and one female) were recorded for this purpose. In those sequences, head and shoulders were manually cut out of images from both cameras when the person was looking just straight ahead into one of them. Displaying the temperatures
to 100
from black to white and using histogram equalization from [
20] leads to:
with cumulative distribution function (
) being the cumulative histogram,
L the number of gray levels and
the number of pixel. The warm head region is highlighted due to the contrast gain as long as there is not a hotter background. Merging these pictures through 50% blending,
leads to a blurry mask. This step was performed using manual adjustment in an image manipulation program. A simplification of the mask could be achieved by thresholding it to a binary mask. Through mirroring the left side the shape of the mask was further adjusted to a symmetrical shape (
Figure 4).
Using the recordings with the LWIR camera, the shape could have been derived by pictures from the visible domain as well. Here we used the samples, to obtain correct dimensions of the shape.
Using OpenCV, the following image processing steps were developed in C++. Created during the training, the mask is the basic element of the proposed algorithm. To cover different head sizes, additionally two scaled versions (95% and 105%) were created. Before using the mask, a scene specialized segmentation was applied to the image. The camera was calibrated from
to 100
and we assumed the scene to majorly contain temperatures between 15
to 40
. Knowing this, one could just segment by absolute temperature. As pointed out in
Section 2.2, we can not rely on the absolute values given by the camera. Therefore, we used a binned histogram (four values of an 8-bit input image are binned: 64 bins ≡
/Bin) to find the region with the majority of the pixel. By using the median of the binned histogram and thresholding around it, the relevant pixel was defined. With the standard deviation
of the pixel of the input image and the median
of the binned histogram, we defined the region around the median by:
Even when the temperatures are drifting, the region will cover all relevant pixel, since they will be shifted with the median. The resulting image is histogram-equalized to achieve a boost in contrast and create a better match to the created shape. Finally, we introduced the mask by using template matching. The mask was slid over the input image while using the normalized cross-correlation (NCC) function [
21]:
The global maximum of this function gives us the position of the best match between mask and input image. Having different scales of the mask, this process is done several times for every scale and in the end, the best match (highest correlation) is taken as position information. Relying only on this output might lead to discontinuities of the detection because the maximum could vary frame by frame. Berg et al. already showed that the robustness for the NCC is low, probably because of the discontinuity issue [
13]. Therefore, in this work we combined an optical flow method for estimating movement direction with template matching. If the detected position between two frames changes more than a certain threshold, there is a high possibility of a false detection, since the inter-frame time is 37
and movement speed in the driver seat is limited. While assuming a maximum velocity of
/
, the maximum allowed change of the position is 12 pixel. In this case, we rely on the flow estimation. At the borders of the input image (10% on each side) the optical flow estimation is used as well to cover re-entry scenarios, if the head was outside the picture. If the correlation value is too low, we currently hold the position, but it is marked as invalid position, since there is probably no face visible.
2.4. Validation Scenario
In total, 53 subjects were recorded (40 male, 13 female). Sitting in the previously mentioned rotatable drivers seat, the subjects were asked to perform certain movements with their head, upper body and hands in a specific order. The recording starts while the subject is about to enter the mockup. In the boarding phase, the seat was rotated towards the a-pillar for simplified access. The subject was asked to enter the mockup and sit down. The chair was then rotated to the normal straight front driving position, while the subject was resting for several seconds with hands at the drivesticks and head at the headrest. The first pose was stretching the upper body and head as much as possible to the left and right. With this movement an extended view into the rear-side mirror is simulated. Back in the normal position, the subject rotated the head to the right and left side and then leaned forward, so that rotation and scaling were covered in the recordings. Leaning back again, the hands should be moved in front of the body. While both arms were stretched forward, one arm after another was moved upwards in front of body and head. This moveset was concluded by waving the hands in front of the camera and was used for occlusion scenarios, for example, pointing figures. Switching the mockup to autonomous driving (
Section 2.1), the seat was now turned into the direction of the co-driver’s side where the multimedia display was located and the free roaming phase began. Here the subject could look around freely for one minute. The rotation of the seat and deboarding the mockup led to the end of the recording. During the whole recordings, several people were walking beside or behind the mockup to simulate exhibition-viewers or interference sources in general, creating distractions for the tracking algorithm.
3. Results and Discussion
This section describes the accuracy of the headtracking for single frames out of the testing videos. The algorithm evaluated the whole video and not just the reference frame. Otherwise, only the template matching would be evaluated and the flow estimation (based on previous frames) could not occur.
The reference is a manual annotation of 1293 pictures displaying various head poses out of all recorded videos. Since the shape to detect (
Figure 4) includes head and the upper part of the shoulders, the expected center position is lower than the midpoint of the head. The generation of the annotation, meaning manual clicking the position for each picture, is considering this.
As already explained, the tracking was tested on downscaled versions of the videos to simulate lower resolution sensors. The following resolutions were tested: 382 × 288 (original size), 95 × 72 (1/16th of original size), 76 × 57 (1/25th), 47 × 36 (1/64th) and 31 × 24 (1/144th) pixel for comparison with thermopile arrays. While the reference is based on the original image size, the detected position on the downscaled image was upscaled to match the reference by multiplying the coordinates with the inverse downscale factor.
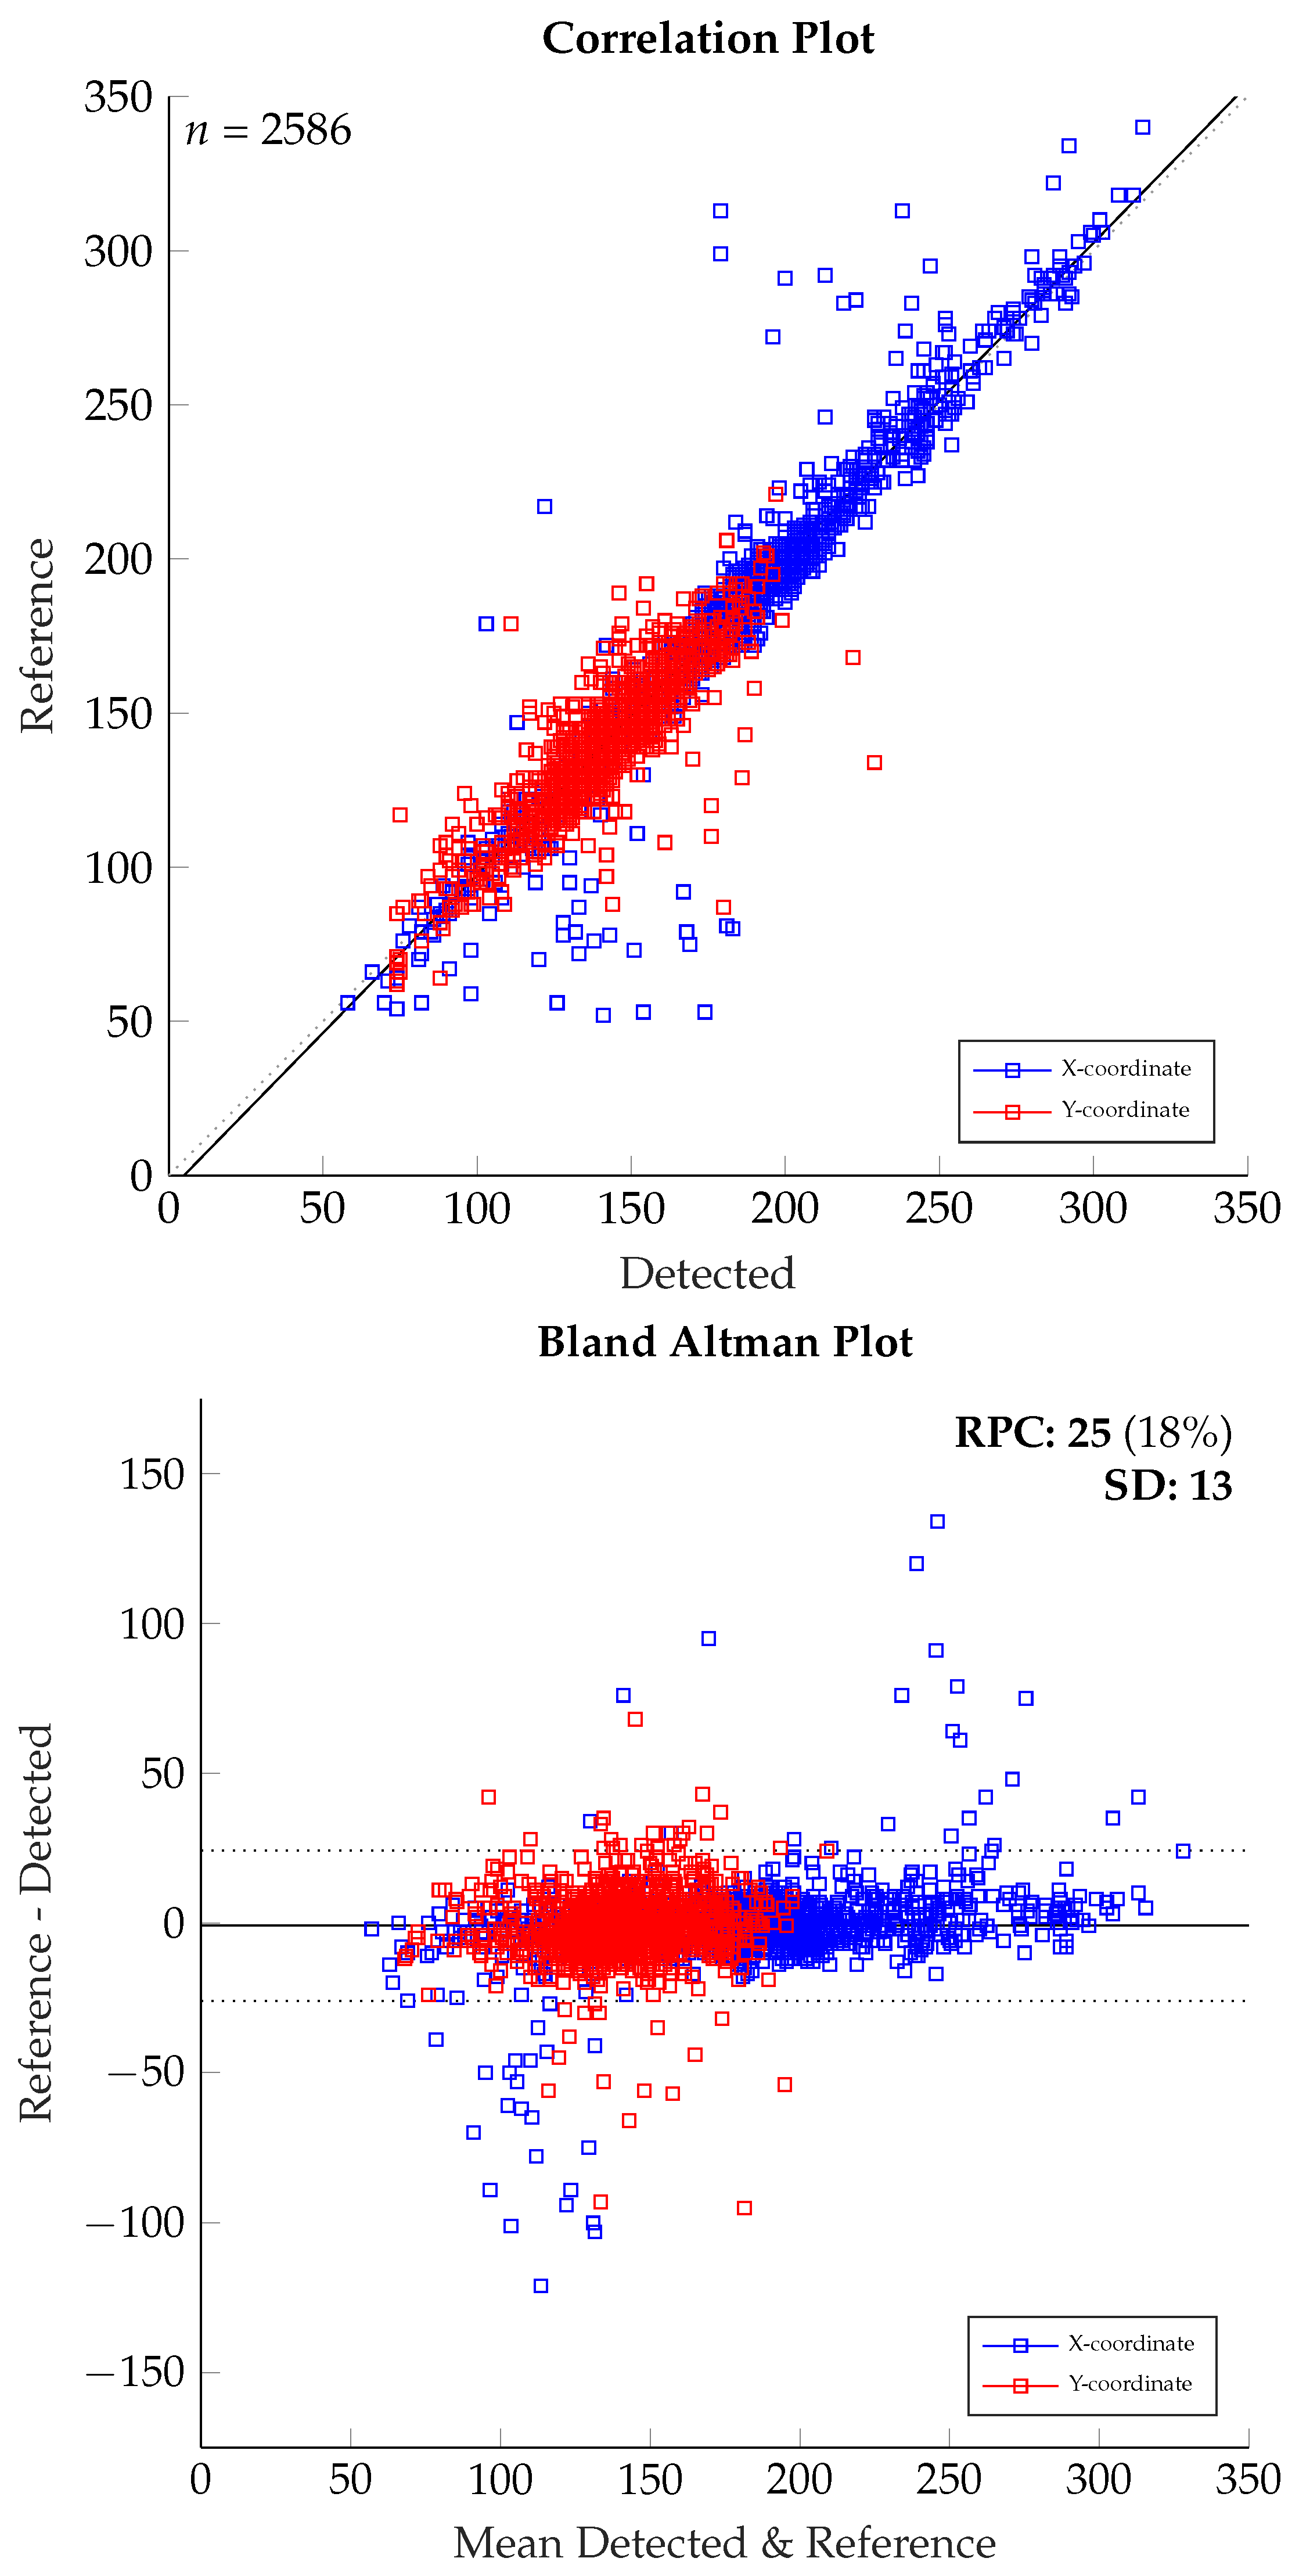
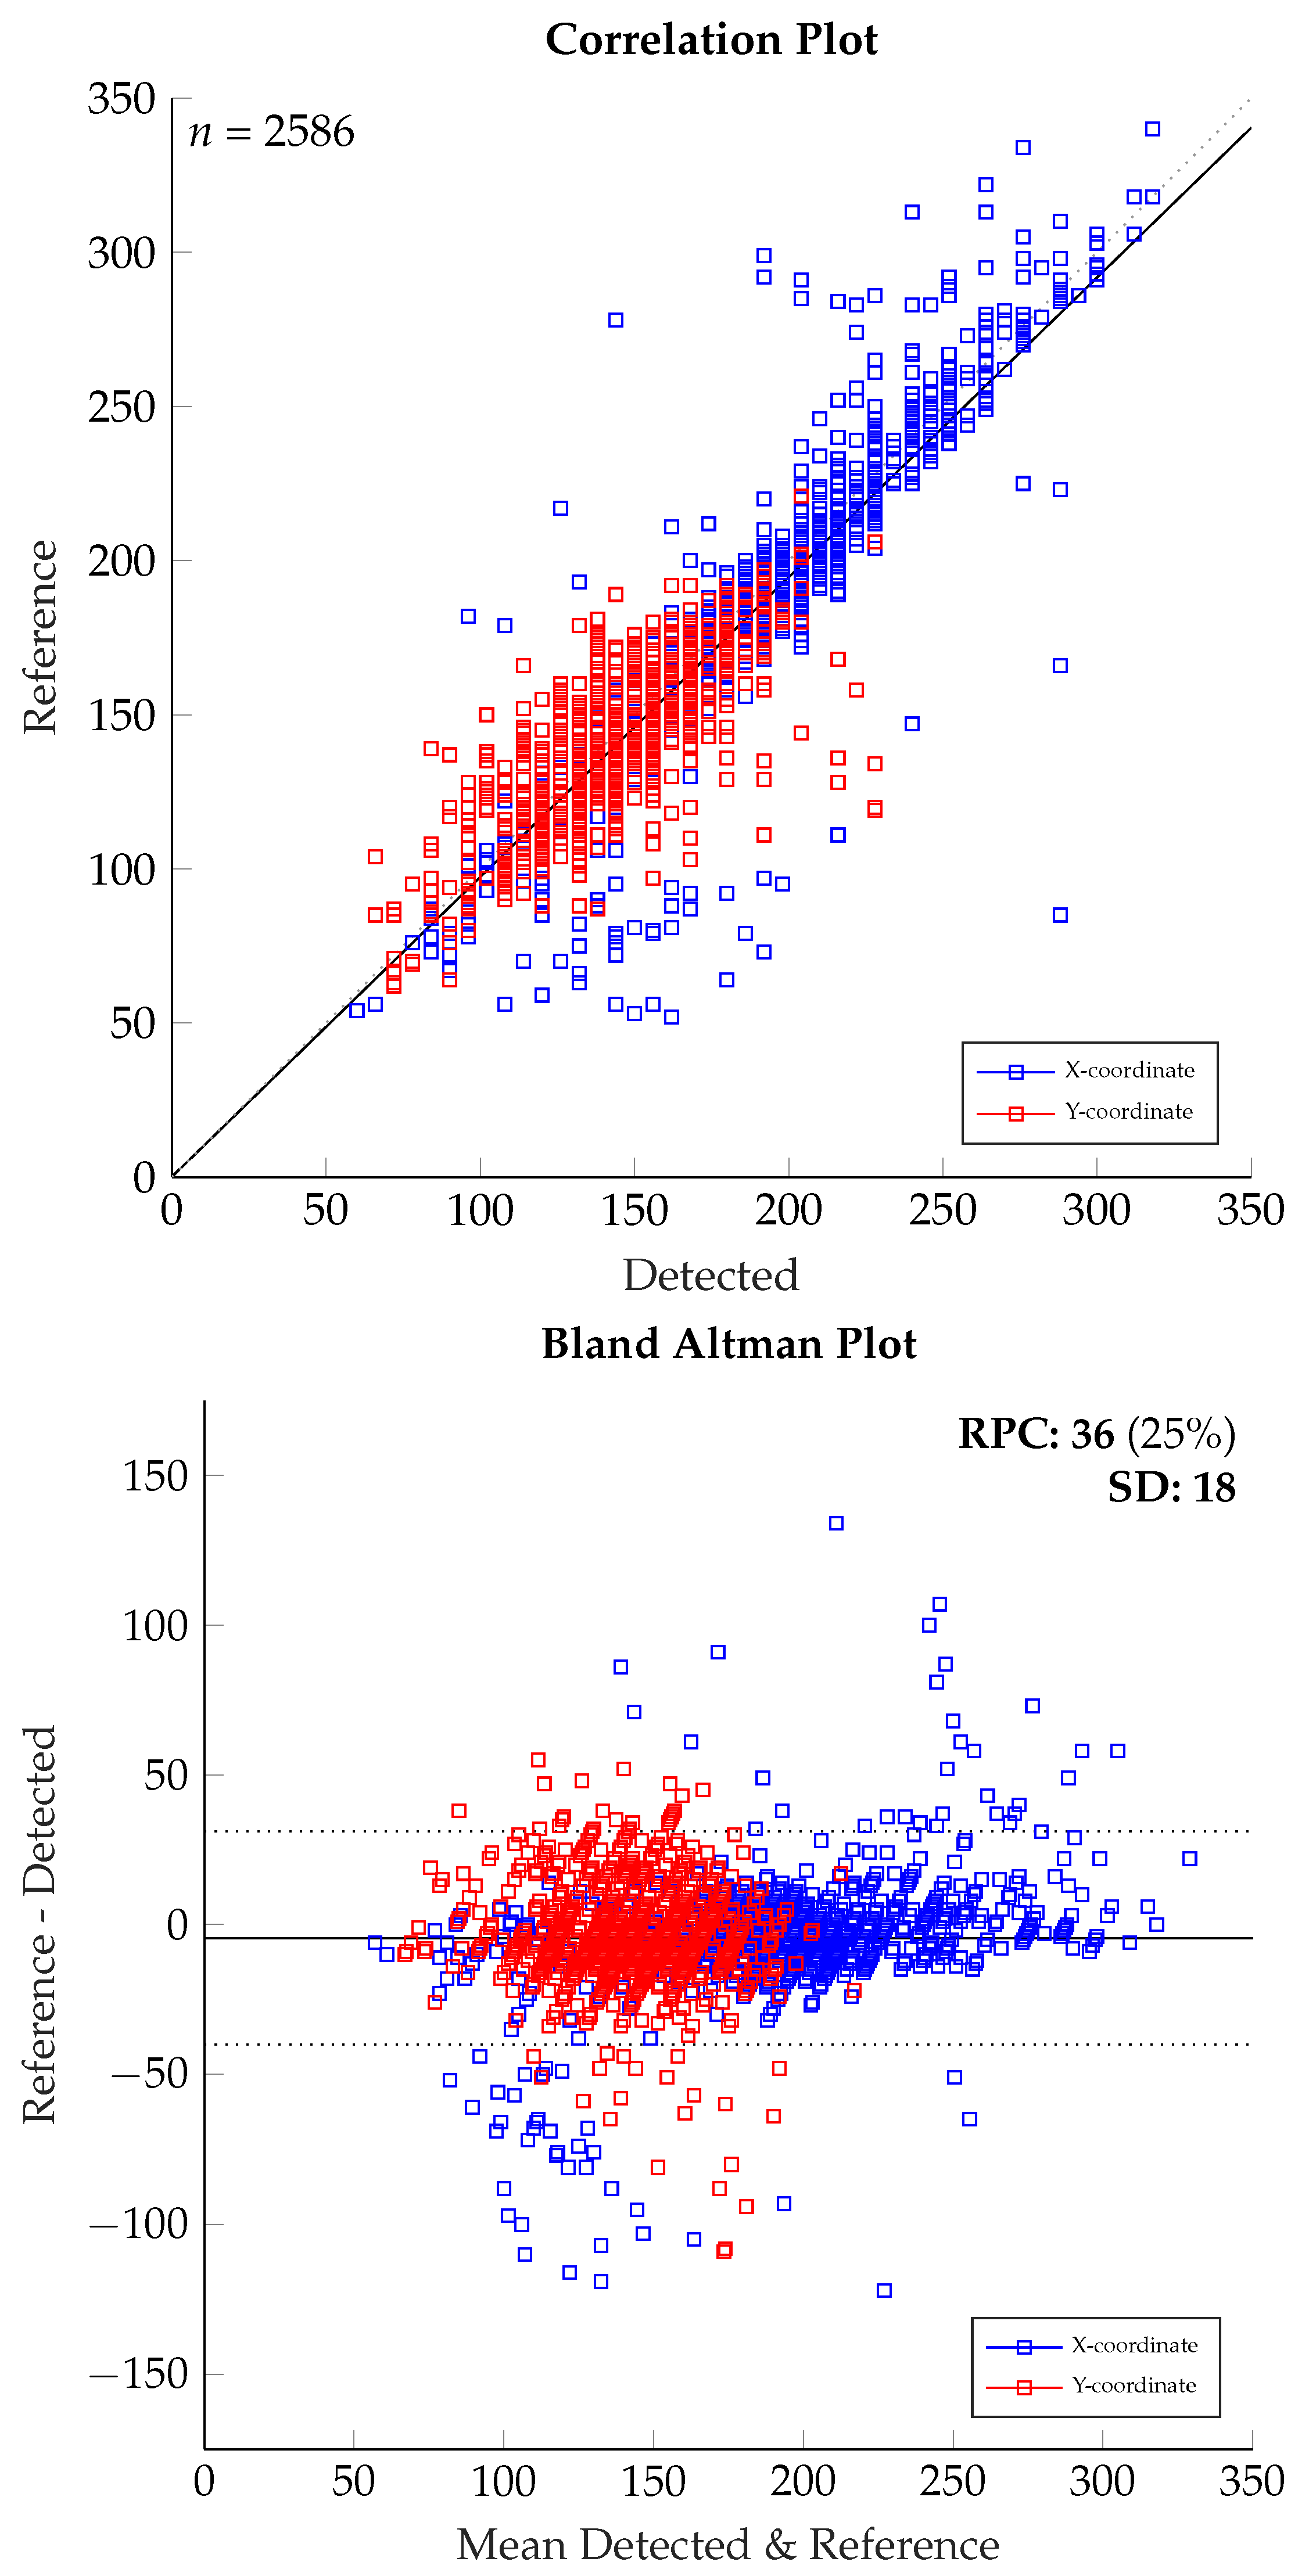
Figure 5 and
Figure 6 display the correlation and Bland–Altman plots for the detected and reference points, while X- and Y-coordinates (X: blue, Y: red) are displayed inside the same plot. Due to the image ratio and restricted movement of the body on the driver seat the Y-coordinates are limited to a smaller range, than the X-coordinates. In
Figure 5 we can see the results of tracking using the original image size of 382 × 288 pixel.
In general, there is a good correlation visible for both coordinates. The huge outliers for the X-coordinate seem not to be in the center, but in the border regions. For both border regions in X-axis the detected points tend to be located closer to the center. For the Y-coordinate it is different, because outliers are most prominent in the center and the detection point is below the face in the neck region. The interval of agreement is between
and
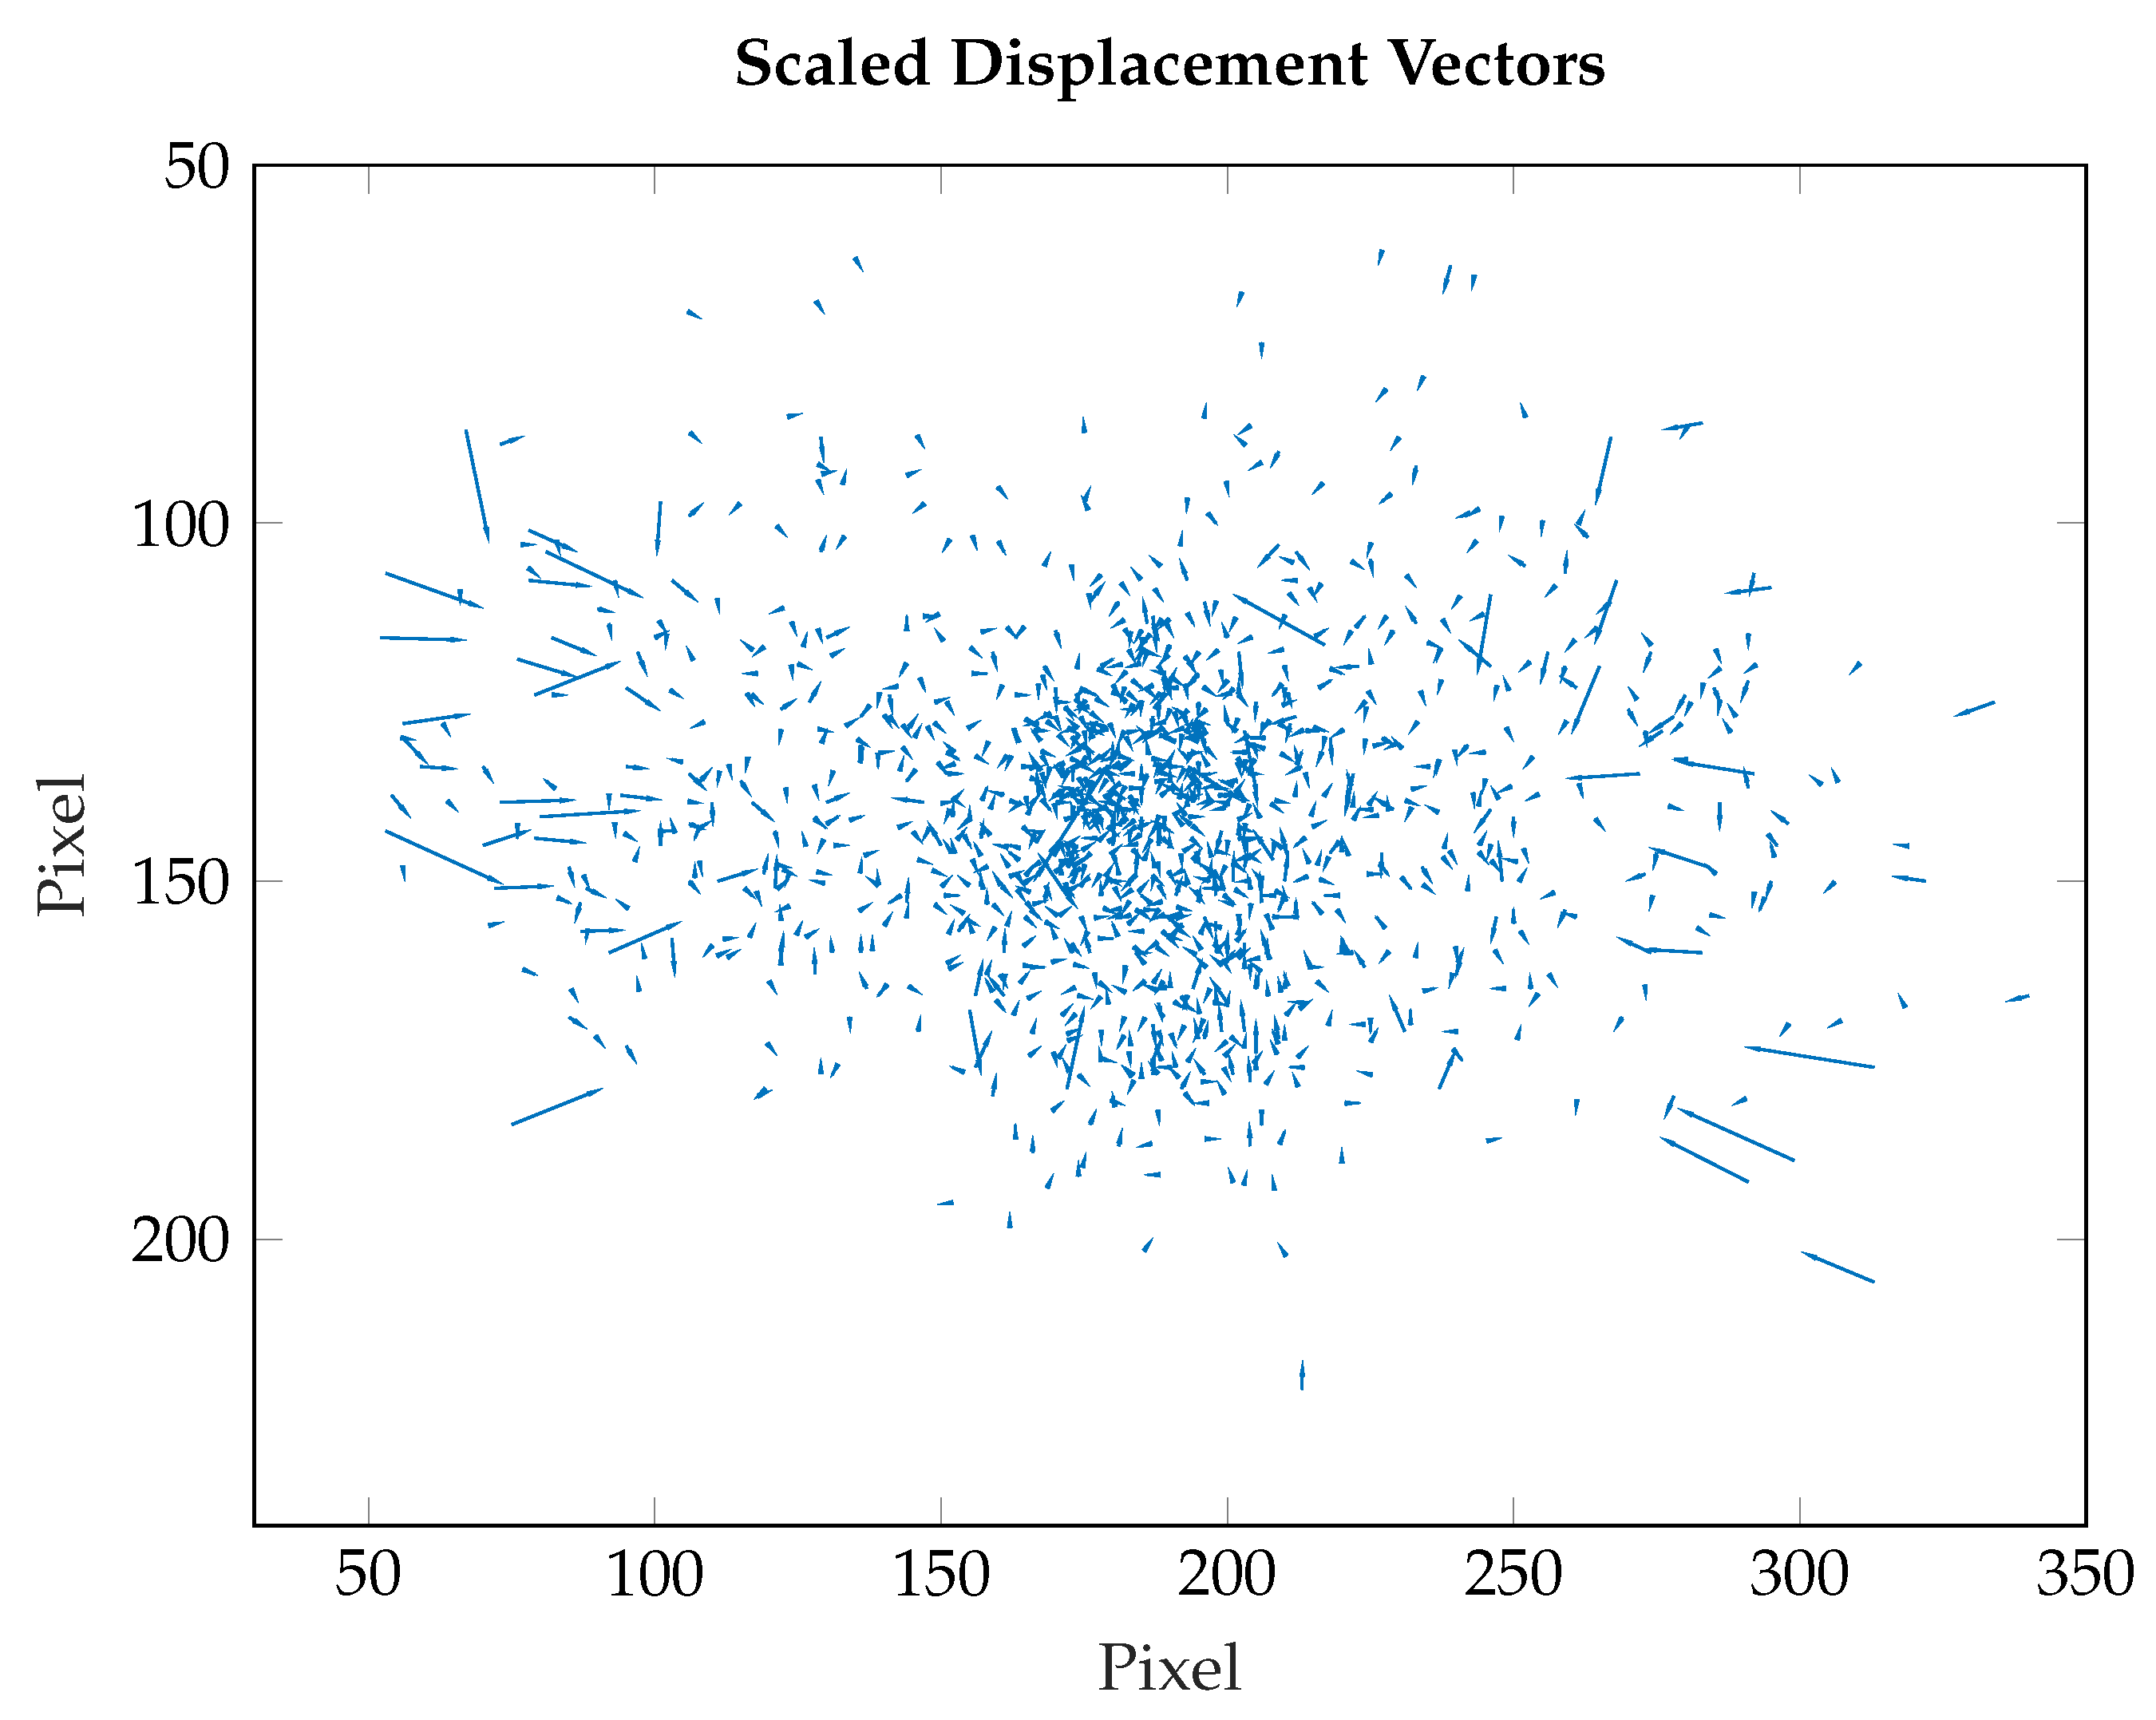
pixel, saying 95% of the detected points are within these limits. For the image size of 382 × 288 pixel the displacement of reference to detection is illustrated in a vector plot in
Figure 7. The vector length is scaled down by 2.5 to increase visibility of the vector field. The outliers described before are visible in two clusters of extended vectors on the left and the right side.
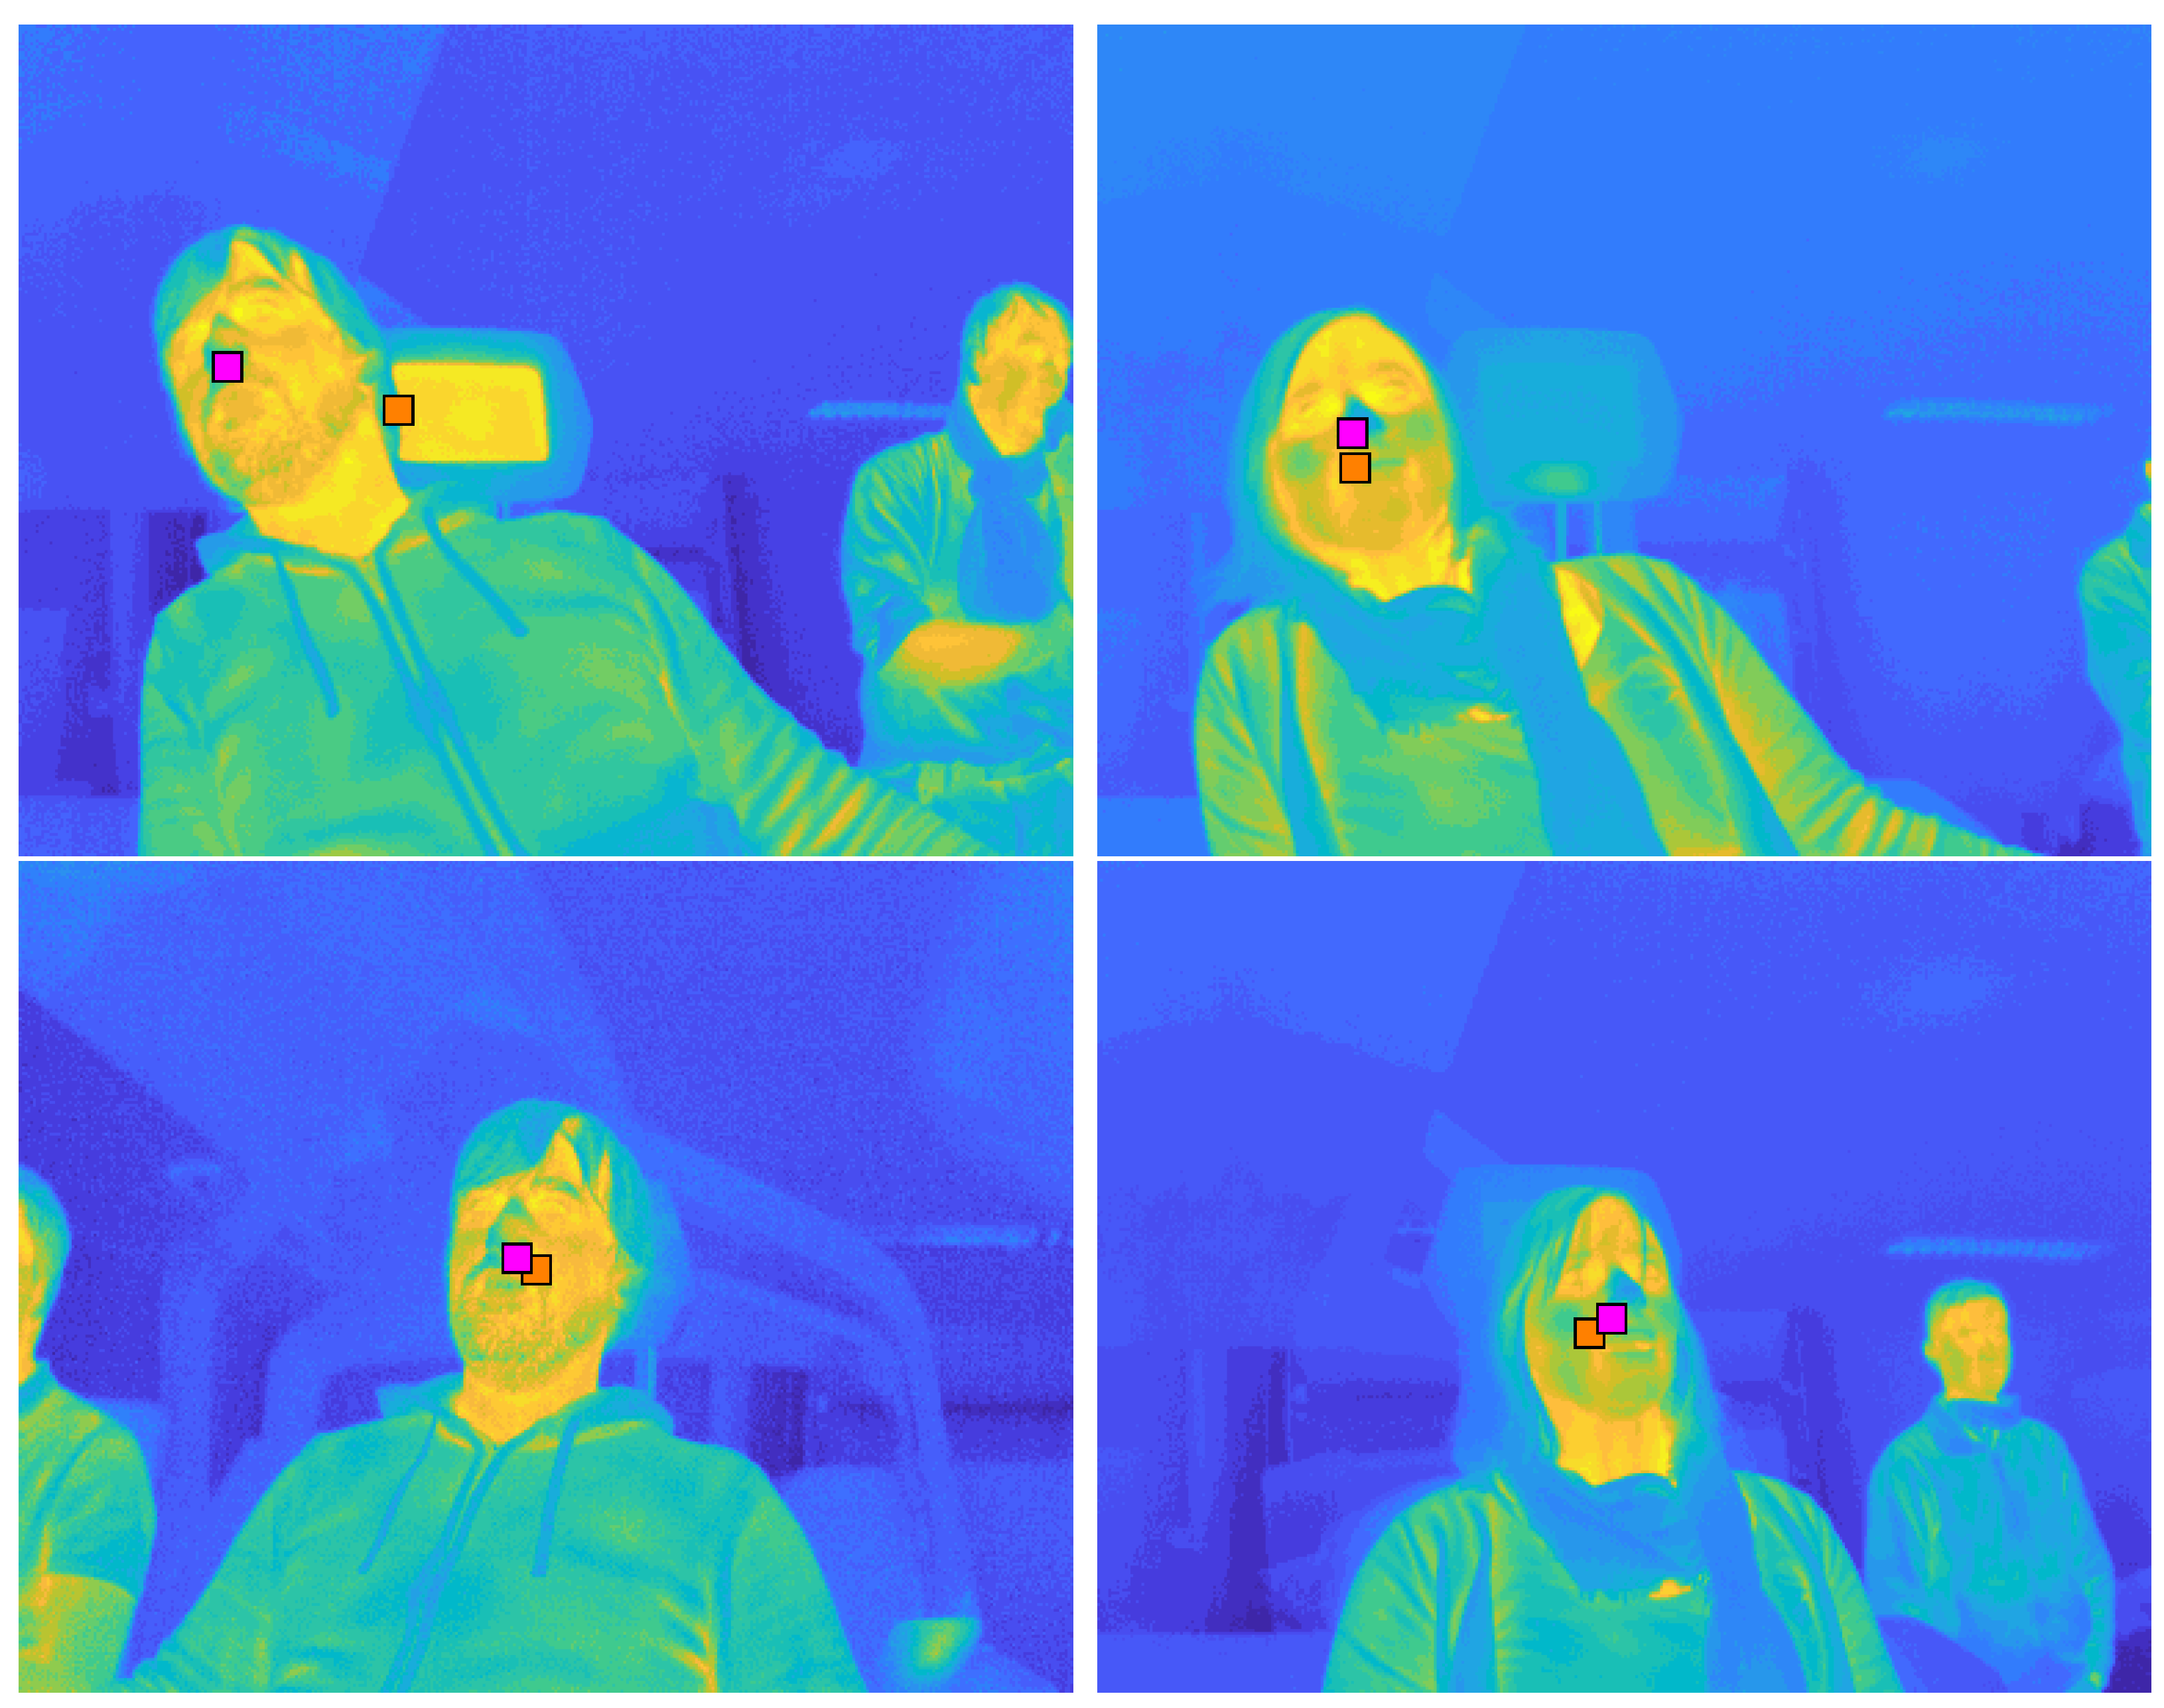
The pictures in
Figure 8 show examples of the reference and detected points, while orange points present detected positions. In the first picture, we can see an example of a large displacement, caused by a heated headrest.
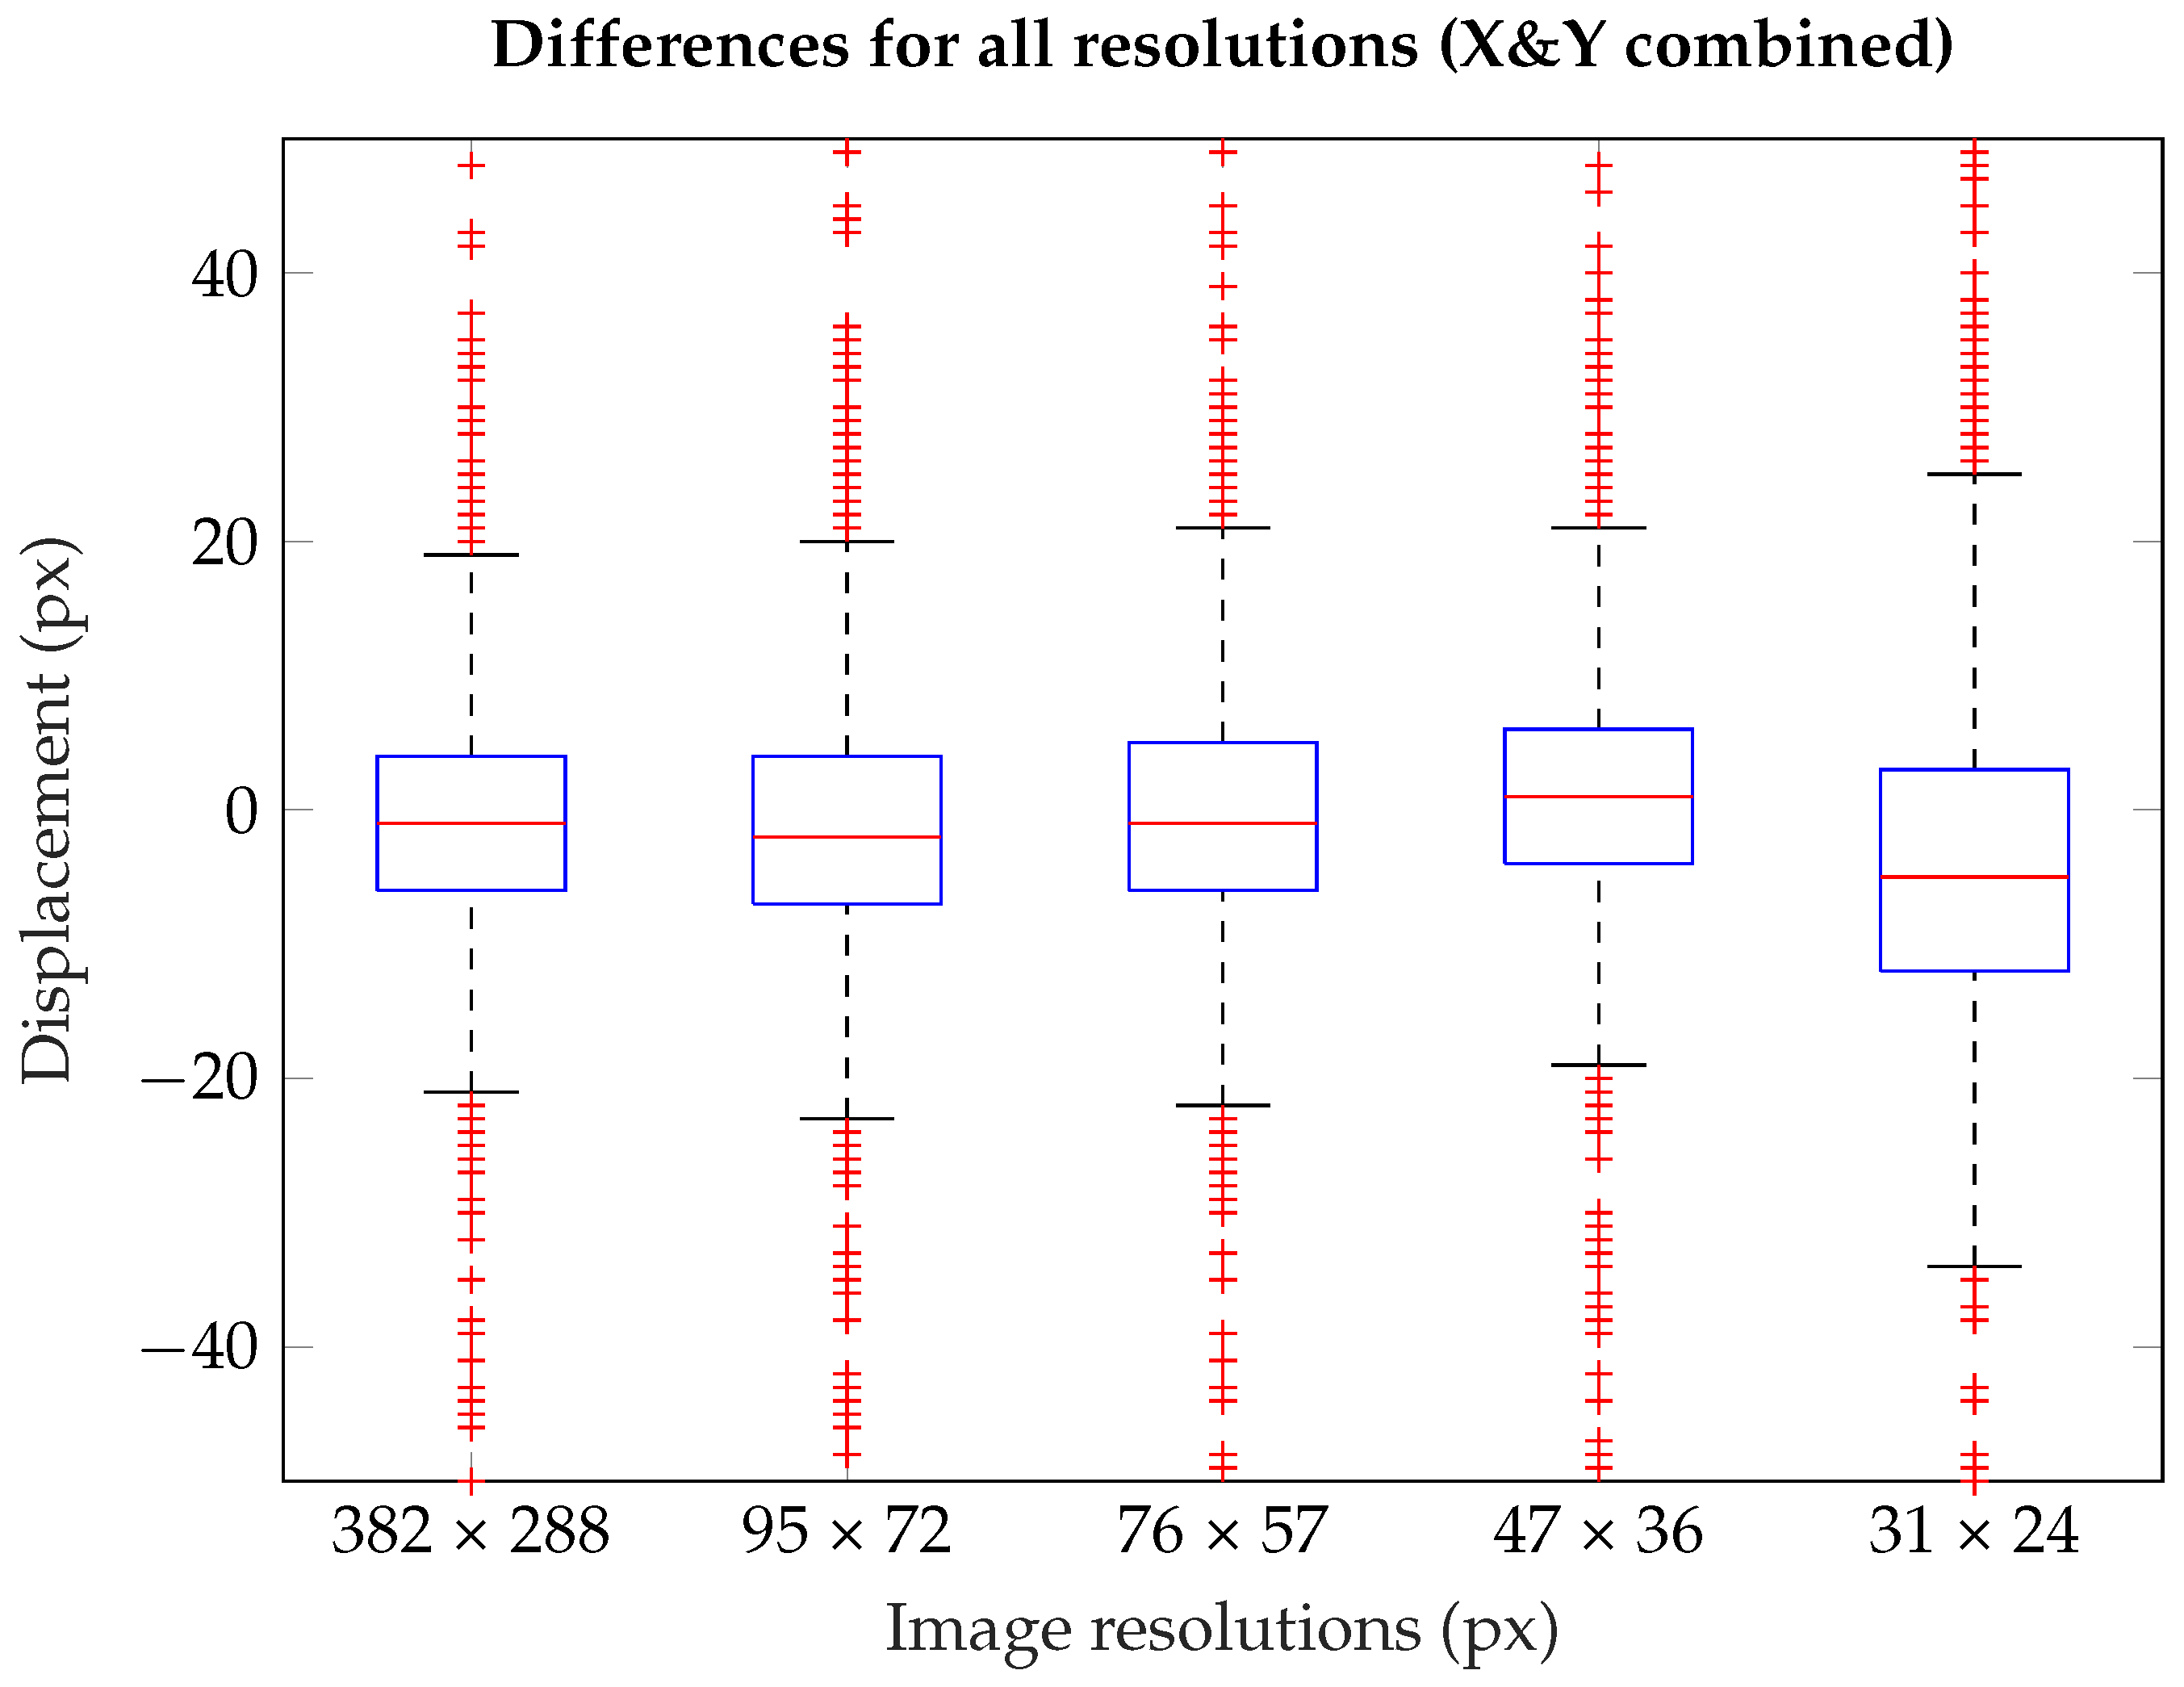
The Bland–Altman and correlation plots for the first three downscaled resolutions (95 × 72, 76 × 57 & 47 × 36 pixel) are omitted here, since they differ only minimally from the plots in
Figure 5. The limits of agreement are around ±25 pixel. With an IFOV of about 2
per pixel, the approximated difference in an image plane is about 5
only considering the error in one coordinate direction, leading to an displacement of around 30% of a common head size, using a standard average head width of 153
[
22]. The similarity is also visible in
Figure 9. For that, we will focus on the upper and lower adjacents. The difference between these values is around 40 pixel for the first four boxplots and for the last it changes significantly to 59.
In
Figure 6 (image size: 31 × 24 pixel), the lines of agreement are moved to
/
pixel clearly visible due to the wider spread deviation. With an displacement of 8
in the virtual image plane, the displacement is already up to 50% of the head size considering still only one axes. Being up to 50% off the reference means for a standard head size, that the detection might still hit the face region, but can be on the edge of the face. The previous plots already show the error in terms of figures.
Looking at
Table 1 we can see the specific numbers for all resolutions in terms of root mean square error (RMSE) and mean absolute error (MAE). As mentioned before, the original and first three downscaled resolutions show a similar error. Assuming an IFOV of 2
per pixel in the image plane, the RMSE is about
and the MAE
for all resolutions except the lowest resolution. When using only 31 × 24 pixel, the error increases. Obviously an increase of error using less information is expected. Interestingly, for this scenario the algorithm performs very similar using less pixel, even only 1.5% of the pixel from original image (at 47 × 36 px). Having only 0.67% of the pixel, meaning a resolution of 31 × 24 pixel, seems to be too little information to work with this algorithm. In this case the common head width in the picture is only about 6 pixels and the shape is not as well-defined as in the pictures of higher resolution, leading to higher displacement to the reference. As shown by the Bland–Altman plots, in all cases the false detection in the X-coordinates are accumulated towards the image border regions. While trying to stretch to the side, most of the subjects tend towards leaning the head to the side as well, leading to a rotated head. The template matcher is not rotation-invariant, which was taken into account while choosing it, since these rotated position are uncommon in our scenario, but tested anyway. Having these occurrences in the video data, the algorithm will most likely hold the position at some point due to a very low correlation value, leading to a large displacement. Setting the least acceptable correlation value to 0.7, the tracker will hold the position if this value is lower than this threshold. Obviously lowering the value is an option to consider, but lowering results in higher false positives rates, because hands or similar shapes might be accepted by the algorithm. The effect of the correlation value can be seen in
Figure 10 for the original resolution of 382 × 288 pixel.
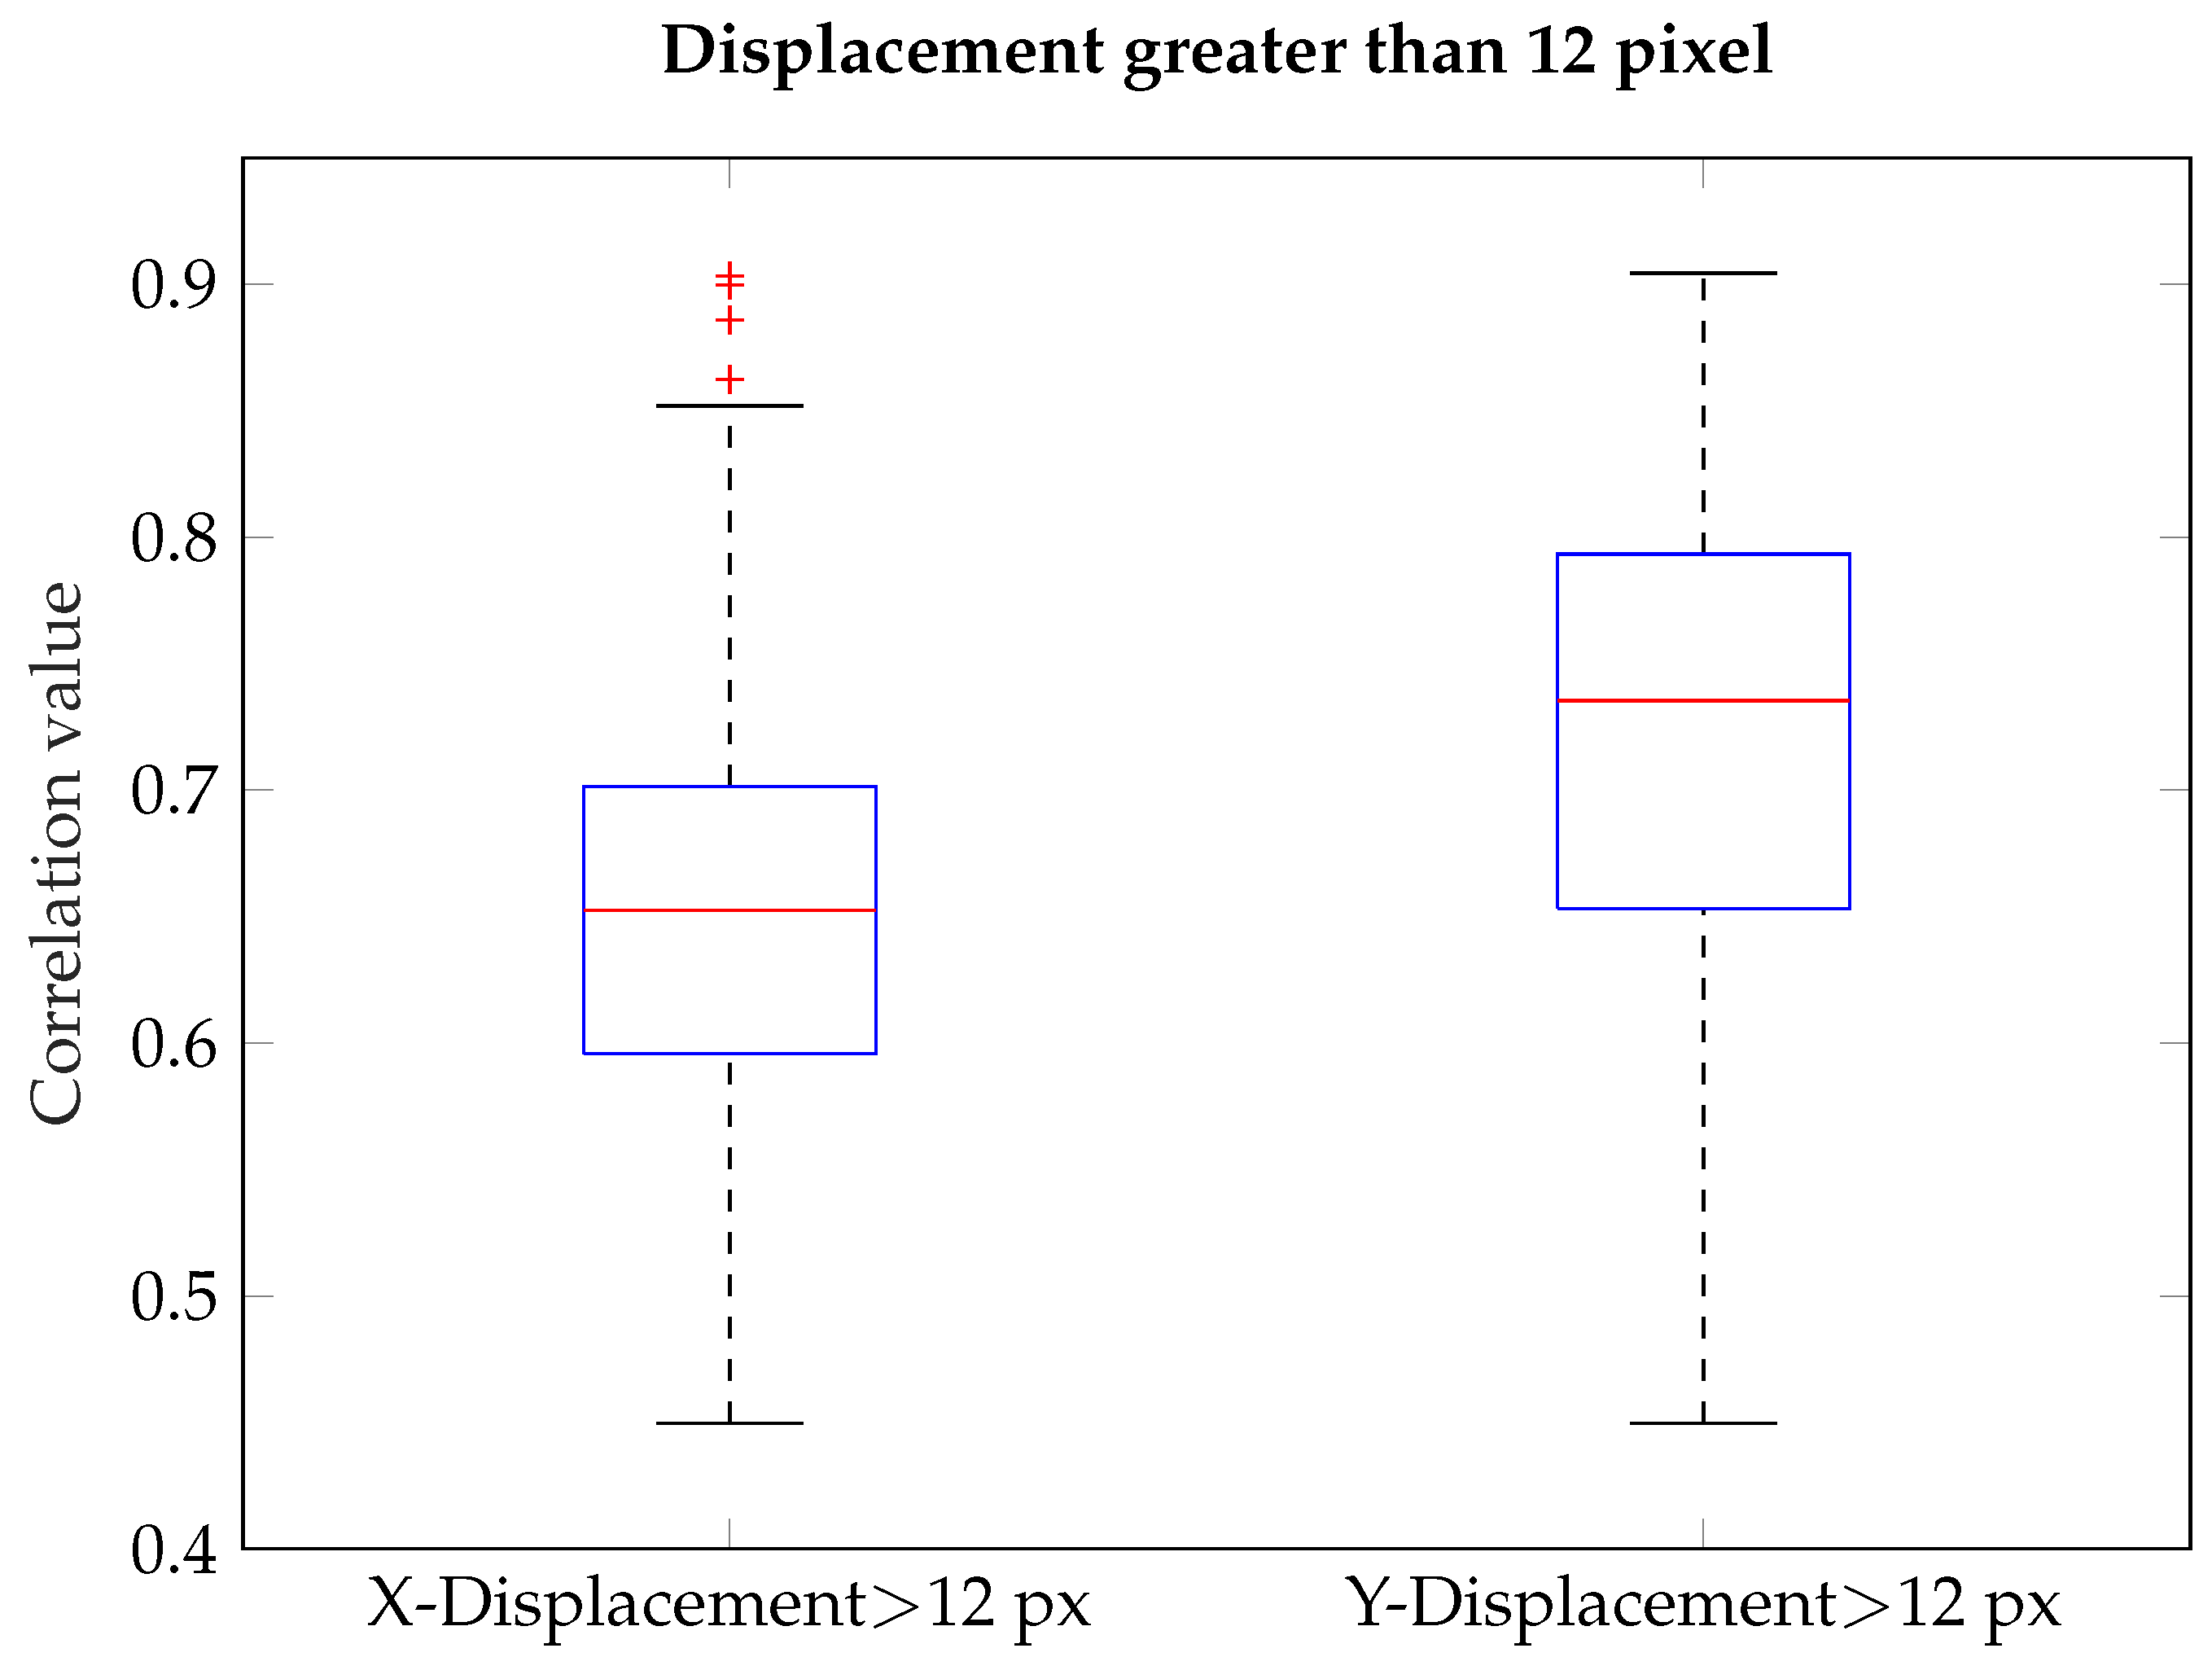
It is visible in the first boxplot—displaying the correlations for the divergence of the X-coordinate greater than 12 pixel (about 15% head size)—that the 75th percentile of the correlation for larger X-coordinate displacements is below the least acceptable value. So a minimum of 75% of those cases suffer from the position holding. The second boxplot displays the same for the Y-coordinate. Since the majority of the values lie above the threshold, here most of the errors are occurring due to false detections. These false detections in the Y-coordinate include the presence of full beard or the case of looking upwards. In those cases, the front neck region can be seen as a huge warm area adjoining the shoulders. This will lead to false positive detection of a head shape below the actual head position. Altogether, the limitation in the system is present if lateral bending of the neck appears, leading to a rotation of the head. Providing additional rotated templates might lead to a better detection performance. Additionally warm areas close to the head temperature and emissivity are leading to misinterpretation of the head shape. Since the pixel information is based on the temperature, this is a common issue in thermal imaging.
For comparison, a Haar–Cascade classifier (HCC) [
23,
24] is applied instead of the NCC method. The Cascade classifier was trained on 6930 images of heads in infrared and 6394 background images not containing any image from the testing frames. In order to detect faces in lower resolutions, the HCC training was performed on multiple image sizes. The resulting displacement error is shown at
Table 2 in comparison to the proposed method. By providing a large set of images, the HCC is able to detect the head but often includes shoulder parts, leading to a higher displacement. Overall the proposed method outperforms the trained HCC.
After analyzing the algorithm, we want to look at the computational efficiency. The algorithm is able to run at 9 fps when the original resolution of 382 × 288 pixel is used. For the lower resolutions the fps are boosted significantly. With the downscaling 87 fps for 1/16th, 112 fps for 1/25th, 357 fps 1/64th and 553 fps for 1/144th of the original resolution are possible running on an Intel i7 7700K processor.


 ,
, 

