Article

The Adoption of Electric Vehicles in Qatar Can Contribute to Net Carbon Emission Reduction but Requires Strong Government Incentives

1
Engineering Management, College of Engineering, Qatar University, Doha 2713, Qatar
2
Mechanical and Industrial Engineering, College of Engineering, Qatar University, Doha 2713, Qatar
3
Qatar Transportation and Traffic Safety Center, College of Engineering, Qatar University, Doha 2713, Qatar
*
Author to whom correspondence should be addressed.
Vehicles 2021, 3(3), 618-635; https://doi.org/10.3390/vehicles3030037
Submission received: 27 August 2021 / Revised: 12 September 2021 / Accepted: 14 September 2021 / Published: 16 September 2021

Abstract

:
Electric mobility is at the forefront of innovation. Cutting down greenhouse gases when low-carbon electricity sources are maintained has answered the concerns of skeptics when switching to electric mobility. This paper presents a life-cycle-based comparative study between the electric and conventional gasoline vehicles with respect to their environmental performance, taking the case of Qatar. A well-to-wheel life cycle assessment is used to understand the carbon footprint associated with the use of alternative mobility when powered by non-renewable energy sources such as natural gas for electricity production. A survey was also conducted to evaluate the economic and practical feasibility of the use of electric vehicles in Qatar. The analysis showed that electric vehicles (EVs) have passed conventional gasoline vehicles with a minimum difference between them of 12,000 gCO2eq/100 km traveled. This difference can roughly accommodate two additional subcompact electric vehicles on the roads of Qatar. Even though Qatar is producing all of its electricity from natural gas, EVs are still producing much less carbon footprint into the atmosphere with the results showing that almost identical alternatives produce triple the amount of GHG emissions. The results of the survey showed that, despite promising results shown in switching to carbon-neutral mobility solutions, a lack of willingness prevails within the State of Qatar to incline towards electric mobility among users. This implies that Qatar has to spend a lot of time and resources to achieve its ambitious goal to decarbonize mobility on roads with 10% electric vehicles by 2030. This research highlights the need for more practical incentives and generous subsidies by the government of Qatar on e-mobility solutions to switch the transportation system into an eco-friendly one.

1. Introduction

1.1. Background

Decarbonization in mobility is currently the most efficient method in sustainably utilizing energy resources for a utopian urban life. Due to the alarming environmental pollution, energy crisis, and gas emissions, many countries are trying to shift towards sustainable progress. The progress is to reduce the extensive use of automobiles, heavy consumption of fossil fuels, and emission of pollutants with the aim of cleaning and ensuring sustainable fuel supply [1]. Even though internal combustion engine vehicles [ICEV] continue to be used worldwide, the number of electric vehicles (EVs) continues to capture the market in most developed countries such as Qatar. Since the first production of EVs, the Nissan Leaf in December 2010, we have seen a steady increase in their interest and sales. EV technologies are termed to be more eco-efficient due to their wonderful potential to minimize the externalities arising from road transportation [2].
EVs are proposed as a long-term solution to the harmful effects of traditional transportation, especially on the environment [3]. In member states such as the European Union (EU), where EV use rose to 3.6 percent in 2019 from 2.5 percent the year before, with approximately 1.8 million total EV registrations to date, electromobility has been a priority [4]. By 2025, leading economies such as the United States and European Union have set targets to reduce CO2 emissions to 95 gCO2/km of capacity [5]. The guidelines set by the states and EU for greenhouse gas (GHG) emission reduction pathways have aided in introducing EVs [5]. EV usage has grown due to manufacturers and consumers’ strong confidence in zero-emission mobility options [6]. The quest for long-term solutions to pressing environmental issues has also paved the way for EV adoption. As well as cutting down carbon emissions, EV adoption could also lead to a possible reduction in impacts on human health, resource depletion, and ecological system damage across the life cycle, thus helping harmonize EV adoption with the sustainable development agenda 2030 [7]. The critical factors that have a significant effect on the climate, according to studies conducted by Sen et al. [8], Aseel et al. [9], Kucukvar et al. [10], Onat et al. [11], and Elhamoud et al. [12], are energy use and the global warming potential (GWP).
By a factor of 2.5, using EV increases the probability of meeting the targets aimed at the use of 10% renewable energy in the transportation sector by 2025 [13]. The United States decided to set a limit of 40 g/m3/year for NO2 and PM10 in 2012 [14]. More than 6% of the population was affected by NO2 annual concentrations that exceeded 40 g in 2010. In general, an EV consumes half as much energy as a conventional vehicle [15]. Although electric vehicle technology has reduced GHG emissions, it is still unclear how each country generates electricity. Qatar is among the countries adopting EV technologies and is targeting 10% electric vehicle sales by 2030 [16]. The Qatar National Vision 2030 aims to achieve economic growth, social prosperity as well as environmental management, which play a big role in sustainability development [16]. Qatar stands as one of the most polluted cities in terms of air quality which poses a big risk to the city residents [17]. Even though Qatar is trying to develop alternative transport methods such as railways, road transport continues to be the most dominant transport method motivating the country to concentrate on the growth of electric vehicle transportation to minimize air pollution [17].
Despite EV technologies being the solution to our transport sector, several challenges are widely experienced during the implementation of the technology. Such challenges include the installation of charging stations, long charging hours, some vehicles are small in size, and cause anxiety due to their limited range. An EV needs to charge for an hour to cover a distance of almost 150 km when fully charged [18]. These challenges could be a hindrance to the commercialization of this technology, but future improvements are expected to enhance electric vehicles [19]. To ensure that the EVs are commercialized, the owners are expected to acquire knowledge on the vehicles; thus, people consider them to be less efficient despite their proven advantages. Countries are trying to supply EVs to public transport such as taxis and buses as they also encourage private usage.
The life cycle environmental assessment impact of EVs has emerged to be a difficult topic with controversy from various sources. This research aims to consider the life cycle assessment of electric vehicles in Qatar. The life cycle assessment [LCA] is a commonly used methodology to evaluate the environmental assessment of vehicle technologies despite the existence of just a few vehicle-LCA review documents [18]. The LCA study considers environmental significance during the life cycle of these vehicles [19]. The literature has defined three different approaches to analyze LCA.

1.2. Research Questions and Objectives

The proposed study applies a feasibility analysis to determine the environmental benefits of switching to EVs instead of ICEV taking the case of Qatar. This will help to understand if Qatar’s vision to achieve carbon neutrality in the transportation sector by 2030 is achievable or not. Therefore, our study intends to cover the feasibility analysis for the use of EVs in Qatar using the life cycle assessment (LCA). Prior to this, the most important process was to discover the questions that suit our study and our topic. Our research questions were identified through the analysis of this relationship with the subject of study. The research questions include:
  • How is life cycle assessment essential to the use of electric vehicles in Qatar?
  • How Qatar responds to the switch from the conventional ICEV to the use of electric vehicles?
  • How efficient are electric vehicles in terms of the emission perspective?
  • How much effort and progress is the Qatar government imputing in electric vehicles?
Based on the research questions raised, research objectives were used to expound on the point of the researcher and what we were planning to achieve in our study subject, given the direction of the study. Our research objectives comprise the following ideas:
  • To evaluate whether it is economically and practically feasible to use electric vehicles in Qatar using life cycle assessment.
  • To understand the efficiency of electric vehicle usage in Qatar.

2. Decarbonization in Mobility: The Tale of Qatar

Qatar is one of the developing nations in the world that intends to enhance technology and environmental sustainability, mainly in the e-transport and mobility sectors. The Qatar National Vision 2030 (QNV 2030) aims to develop its transportation infrastructure to provide an integrated, eco-friendly, reliable, and safe multimodal transportation system in the State of Qatar [20]. As an initiative to support decarbonization in mobility, Qatar has launched Doha Metro while the Lusail light rail transit is almost completed. Furthermore, Qatar’s Ministry of Transport and Communication has planned to introduce electric buses [e-buses] for the public to commute during mega sporting events such as the FIFA World CupTM 2022 [20]. This plan aims to ensure that more than 25% of the public transit bus fleet in Qatar will be e-buses. This plan is aimed to be achieved by 2022 due to the FIFA event which will facilitate the transportation of more than 1.5 million visitors expected in the country for the tournament. QNV 2030 aims to ensure a 100% e-powered public transport system while having a full capacity manufacturing output, that will enable Qatar to be a leading exporter of EVs globally by 2030. The government has ensured the full installation of charging infrastructure guidelines and stations in cooperation with the Qatar General Electricity Authority and other prominent market players.
Currently, the number of EVs in Qatar is limited. However, the country is ambitious in ensuring the growth of the number of electric vehicles soon. The Green Car Initiative is a joint effort by the Qatari government, the Ministry of Transport and, the Ministry of Energy and Industry, intending to replace the existing dominant conventional gasoline vehicles with the EVs and Hybrid EVs [21]. More than 4% of the total number of vehicles in Qatar on road in 2022 are expected to be EVs. The SUVs that dominate Qatar’s roads are expected to reduce since the petrol subsidies are being reduced while the government instills mechanisms and policies to encourage the transition to EVs and HEVs. Several industry stakeholders are joined to support and plan workshops and conferences that will ensure awareness of marketing EVs across countries throughout the world.
There exist various factors that influence individuals to use and adopt EVs despite their current nature and high costs [22]. Social influence reflects on how people copy other peoples’ behaviors and activities which influence them to purchase EVs since their friends or partners are doing so. Furthermore, facilitating conditions such as the availability of charging stations, reduced battery costs, after-sale services, and availability of all factors facilitating the use of EVs encourage people to try and purchase EVs. The anxiety of using an EV is high, since an individual is not sure when or where the power range might end. The cost and availability of EV repairs are expensive and might not be readily available. Environmental concern influences the use of EVs, mainly in regions such as Qatar, where they have the motive to reduce CO2 emissions and reduce global warming rates [23]. The government is making efforts to reduce these emissions and giving incentives to its citizens to adopt an eco-friendlier mode of transport, encouraging the use of EVs.
Qatar faces several challenges in manufacturing EVs due to the presence of a few industries, and the importation of a wide range of EVs is costly. Since EVs are yet to dominate the market, just a few car markets try to import these vehicles. Another factor that is considered to ensure the widening of the electric car market is the installation of charging stations and improving the battery ranges. Since Qatar is a small country and its population is larger in the cities, the distribution of EVs is highly expected in cities. People in Qatar prefer to rent cars than purchase, which indicates that many people are unwilling and unable to install charging stations in their homes. People living in an apartment are also in an unsuitable place to install charging stations which gives the government the burden of ensuring charging stations are widely installed in the cities [24].
The decrease in the cost of batteries has assisted significantly in the growth of electric vehicle technology and use over the years. However, the costs of electric vehicles continue to be relatively higher than those of gasoline-fueled vehicles. Due to technological advancement, electric vehicles are expected to decrease in price, which will promote large-scale production [25]. The cost of installed batteries has relatively declined from 1000 dollars per kWh in 2010 to less than 350 dollars per kWh in 2018 [25]. Due to this reduction, stiff competition is expected from EVs since they are more economical compared to other vehicle technologies. In addition to other relevant infrastructures required to enhance the presence of electric vehicles, EVs are expected to dominate the market before the end of this decade.
Qatar is a leading fossil fuel producer and, depending mainly on gas and oil, poses a very high risk to the ecosystem and environment since it is a harsh climate region. According to the national climate records, the country’s annual temperature has increased by 0.3 °C over the last 40 years [26]. More than 62 million tons of GHGs and more than 90% of CO2 were emitted in 2017. The energy sector emitted more than 52,000 g of CO2 from fugitive emissions and their productions. The danger these emissions pose to the environment and the ecosystem has forced the government to develop plans to reduce the emissions; therefore, they plan to emphasize the development of electric vehicles in the transport sectors. CO2 emissions in electric vehicles is approximately 4.6 times lower than diesel vehicles [27].
Electric vehicles are considered an essential technology advancement tool that is helping to minimize the increasing environmental impacts stemming from the transport sector. Qatar is one of the nations that depend on natural gas for electricity generation at a 100% rate. Electric vehicles are expected to replace internal combustion engine vehicles, which will purely affect the sustainability impacts and the fuel supply chain [28]. Therefore, a plan is needed to ensure that a supply chain-based approach is developed, which will overlook the shift from petroleum to electricity generation sectors. The EVs are expected to save approximately 28% of the life cycle, more than 60% of human health effects, 70% greenhouse gas emissions, and 50% photochemical oxidant formation.
According to Holland et al. [29], sustainable transport and mobility are the major quality of sustainability development. Their study revealed that the economic and environmental impacts of electric vehicles are promising and economical. Their thesis specialized on the vehicle range as well as full battery electric vehicles. In their study, a total of 19 macro-level sustainability indicators were quantified where EVs are charged with solar charging stations as well as power grids without any additional infrastructure. Their analysis covered a full life cycle of all stages. The manufacturing stage is the most influential point towards socio-economic impacts. The operation phase influences the environmental impacts with some socio-economic effects such as economic cost emissions. The EVs have minimal air pollution cost and a positive human health impact in comparison to the commonly used gasoline vehicles [29]. Electric vehicles are termed as having the economic potential to generate income for many low and medium-skilled workers as well as ensure transportation sustainability.
The expected future reduction of crude oil and the expanded energy use for transport have led to energy insecurity and environmental unsustainability. People are considering electric vehicles as a solution to these challenges despite them facing technological and economic barriers. The running cost of electric vehicles is forecasted to reduce by approximately 75% by 2030. This calls for effective and practical public transport systems to enhance both environmental and economic growth. EVs are termed to be economically feasible, offering a solution to carbon emissions when the cars are charged with low carbon systems [30].
As stated by Holland [16], the study presents a life cycle sustainability assessment of support utility EV technologies such as hybrid and plug-in hybrid. Qatar’s sources of energy are purely from natural gas with a unique supply chain. They discovered that EVs have a significant capability to reduce global warming, air pollution, and other emissions. More than 90% of Qatar’s emissions are observed within the region boundaries. The result of their study indicated that the adoption of electric vehicles fails to favor macro-economic indicators. The BEVs seem to be good for life cycle ownership cost while they are worse performers towards the gross domestic product. BEVs have the least land-use as compared to internal combustion vehicles, which have the highest. Furthermore, 95% of these effects are experienced outside the regional boundaries of Qatar. Concerning the social indicators, internal combustion vehicles are more effective in generating employment and taxes, while performing poorly in the human health effects category. They also noted that there are various indicators that influence the collection of best vehicle usage and alternatives.
A transportation option and vehicle production are also considered essential when differentiating between conventional and EVs. A transport life cycle inventory is developed to assess the EVs over their impact ranges [31]. According to the EVs powered by the European electric mix, they offer a range of 10–24% decline in the global warming potentials. To improve the environmental profile of EVs, engagement around minimizing vehicle production supply chain effects and enhancing clean electricity sources is essential.
The adoption of EVs has proven to be a crucial factor while considering the decrease in greenhouse gas emissions. However, people have various hindering circumstances that prevent them from shifting to electric vehicles, posing a challenge to the government enacting the change [32]. Factors such as long charging hours, short driving range, cost, and other hindrances limit the use of electric vehicles in Qatar as well as other nations. According to Khandakar et al. [33], they introduced a public perception that will motivate EV adoption in Qatar. Their study emphasized the different perspectives of EV adoption while engaging in direct questionnaires with electric vehicle stakeholders in the attempt to develop and improve on their requests to solve the various challenges limiting the adoption of EVs. Their study highlighted that to solve the various hindrances, the government is expected to ensure wide-range awareness such as charging stations and incentive policies. These factors will enable the efficient penetration of electric vehicles in the transportation sector to replace the dormant transport vehicles.
As per studies conducted by Rakov et al. [34], the power system of Russia is one of the countries whose electric vehicles are already in use. They have the largest number of e-buses in Europe, mainly in their capital, Moscow. Their transportation strategy is a great shift that encourages environmental-friendly vehicles, and electric vehicles are their transport sector. As electric vehicles are expected to rise, the government is planning the additional installation of a charging station. The conclusion of their work indicated that the widespread shifting of petrol engine vehicles to electric vehicles would not cause an overload of their existing power systems, which is a positive indication of the essence of the adoption of electric vehicles.
According to Cassani and Williamson [35], they discovered that to meet the stringent cost targets for plug-in hybrid electric, hybrid electric, and other electric vehicles, adverse improvement is required in the battery life cycle and their safety. Lithium-ion, lithium-polymer, and lithium iron phosphate are experimented with. These improvements are undertaken to increase the power storage of electric vehicles and reduce the charging hours, which pose a challenge to the adoption of electric vehicles [36]. A parameterized life cycle model was used to analyze the environmental feasibility of re-using EV batteries [37]. The model indicated that the Li-ion EV batteries are advanced for re-purposing to be re-used in the grid storage to enhance utility application. When this progress is undertaken, 56% CO2 emissions reduction is possible when an EV battery is re-purposed as well as enhancing the storage of electricity [38].
The need for optimized power management that can offer quick charging is crucial in the run to encourage the use of EVs [39]. The optimized power management of proposed grid-independent and quick charging stations in Doha is comprised of several energy sources to ensure enough full power sources of electric vehicles without any compromise. The main aim is to ensure a quick charge as low as 50 EVs every day. This plan will prevent the fossil fuel-based power generation expansion, which will enhance the EVs’ rise charging demands and reduce environmental pollution. It will promote the distributed generation, which will prevent malfunctions and failure resulting from overloading transformers and the existing networks.
A study was conducted to discover the macro-level social, environmental, and economic impacts of various vehicle technologies in the USA [40]. Their study covered conventional gasoline, hybrid, and plug-in hybrid technologies with various electric ranges and fully battery EVs. According to their study, 19 macro-level sustainability indicators were enumerated for events where the EVs are charged by the existing USA power grid. The cycle process covers the manufacturing, processing, extraction, and all other operation stages of the EVs and their power storage. The manufacturing stage is influential in terms of socio-economic impacts. EVs are discovered to have reduced air pollution and human health impacts compared to other vehicle technologies. They also have the lowest GHG emissions and the lowest ecological land footprint per unit in energy consumption [41].
An increase in EVs is a sign of the change experience in the transport and energy sector. The advanced technology development of EVs has led to the development of new electricity distribution points. To enhance efficiency in EVs technology development, energy storage needs to be effectively implemented while cutting the load peaks by serving power in peak hours from the existing power storage to the grids. This can be achieved by electric vehicles presented with a vehicle-to-grid instrument [42].
A feasibility study by Coimbra was undertaken to evaluate the possibility of developing a new car-sharing service in Coimbra and its effects. This study considered using electric vehicles and hybrid vehicles sharing fleets. The aim was to reduce automobile traffic, air quality improvement, limit fossil fuel reliance, and amplify the number of trips in a justifiable model [43]. This measure is feasible at a low cost, and it can gain revenues to support the operation and enhance the steady salvage of the investment. Within a short period, the car-sharing system is expected to gain positive and promising impacts over the balance in both operating costs and revenues. Therefore, an electric vehicle sharing fleet is essential in cities that are willing to have an integrated mobility system that will also complement public transport.
A study conducted by Gil-Garcia [44] in the United States showed that the annual operating cost of PEV and PHEV in 2040 would be approximately four times lower than gasoline vehicles without considering the battery replacement costs. The tailpipe emission of California in 2040 will see a reduction in CO2 emission by 40 million metric tons. The power station needed to meet the demand for electric vehicles will have been achieved within this period. According to the study, it was discovered that this shift is not only beneficial to the transport sector but also to the general well-being of individuals. For such a revolution to be achieved, people need to change their views on electric vehicles despite the government’s effort to enhance the transition. Different countries with the vision of adopting electric vehicles have provided incentives to encourage their citizens to accept and use this technology [45]. The United Kingdom offers a 5000 Euro grant for EV users, 200 million Euros are available for the plug-in EV grant, as well as an exemption from London’s congestion charge. In Greece, all EVs and hybrid EVs are registration tax-free. Denmark offers 80% vehicle registration tax exemptions, while other countries adopting the use of electric vehicles offer their incentives and policies to encourage citizens to shift to electric vehicles [45].

3. Materials and Methods

To achieve the research objective, the research team follows a quantitative analysis approach that consists of two sections. Initially, the study aims to conduct a life cycle analysis (LCA) for EVs in Qatar using a well-to-wheel life cycle approach to quantify the total associated emissions by its deployment within the state compared with the conventional gasoline vehicles. This is to understand if, when it comes to mobility innovation, Qatar’s decision to switch to electric mobility will pay off due to its high dependence on fossil fuels and non-renewable energy sources to generate its electricity. The second section aims to measure the social acceptance of the use of EVs in the State of Qatar since EVs are still considered a new concept for Qatar and its residents. In the beginning, a thorough literature study will be conducted to find any similar studies from different nations that have a head-start in electric vehicle transformation. A survey will then be designed based on the knowledge gained from the literature study and the verbal survey conducted in the society. The main goal of the survey is to assess the government’s efforts in the EV transformation and to come up with several recommendations to lay the foundation for a large-scale change such as EV transformation.

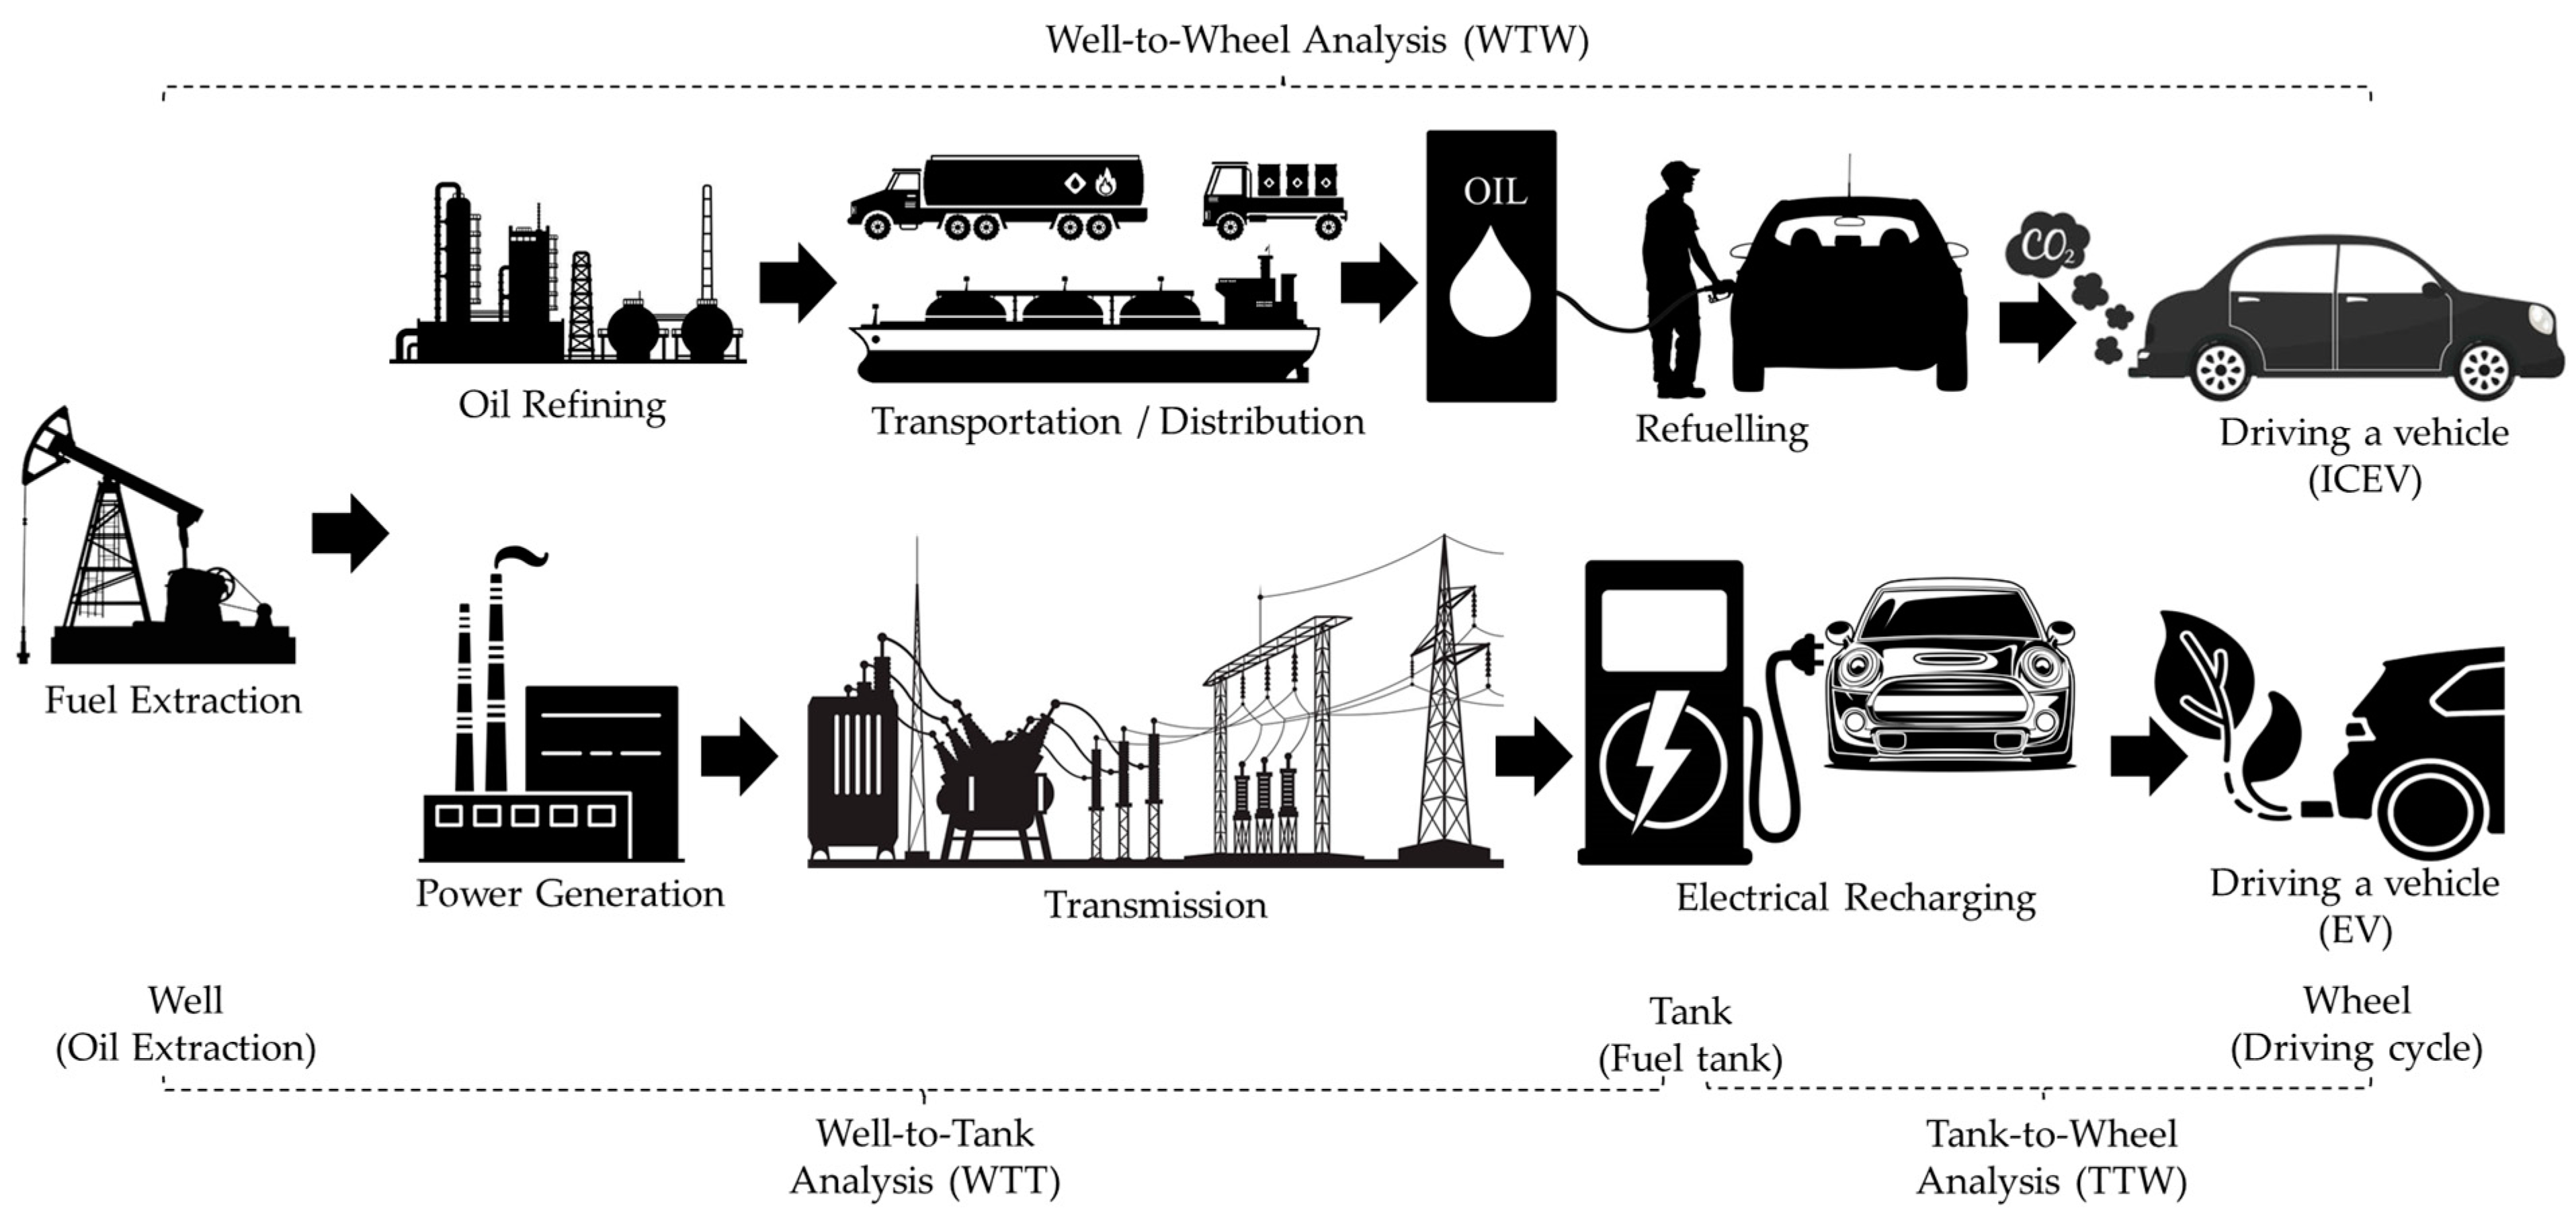
3.1. Life Cycle Assessment
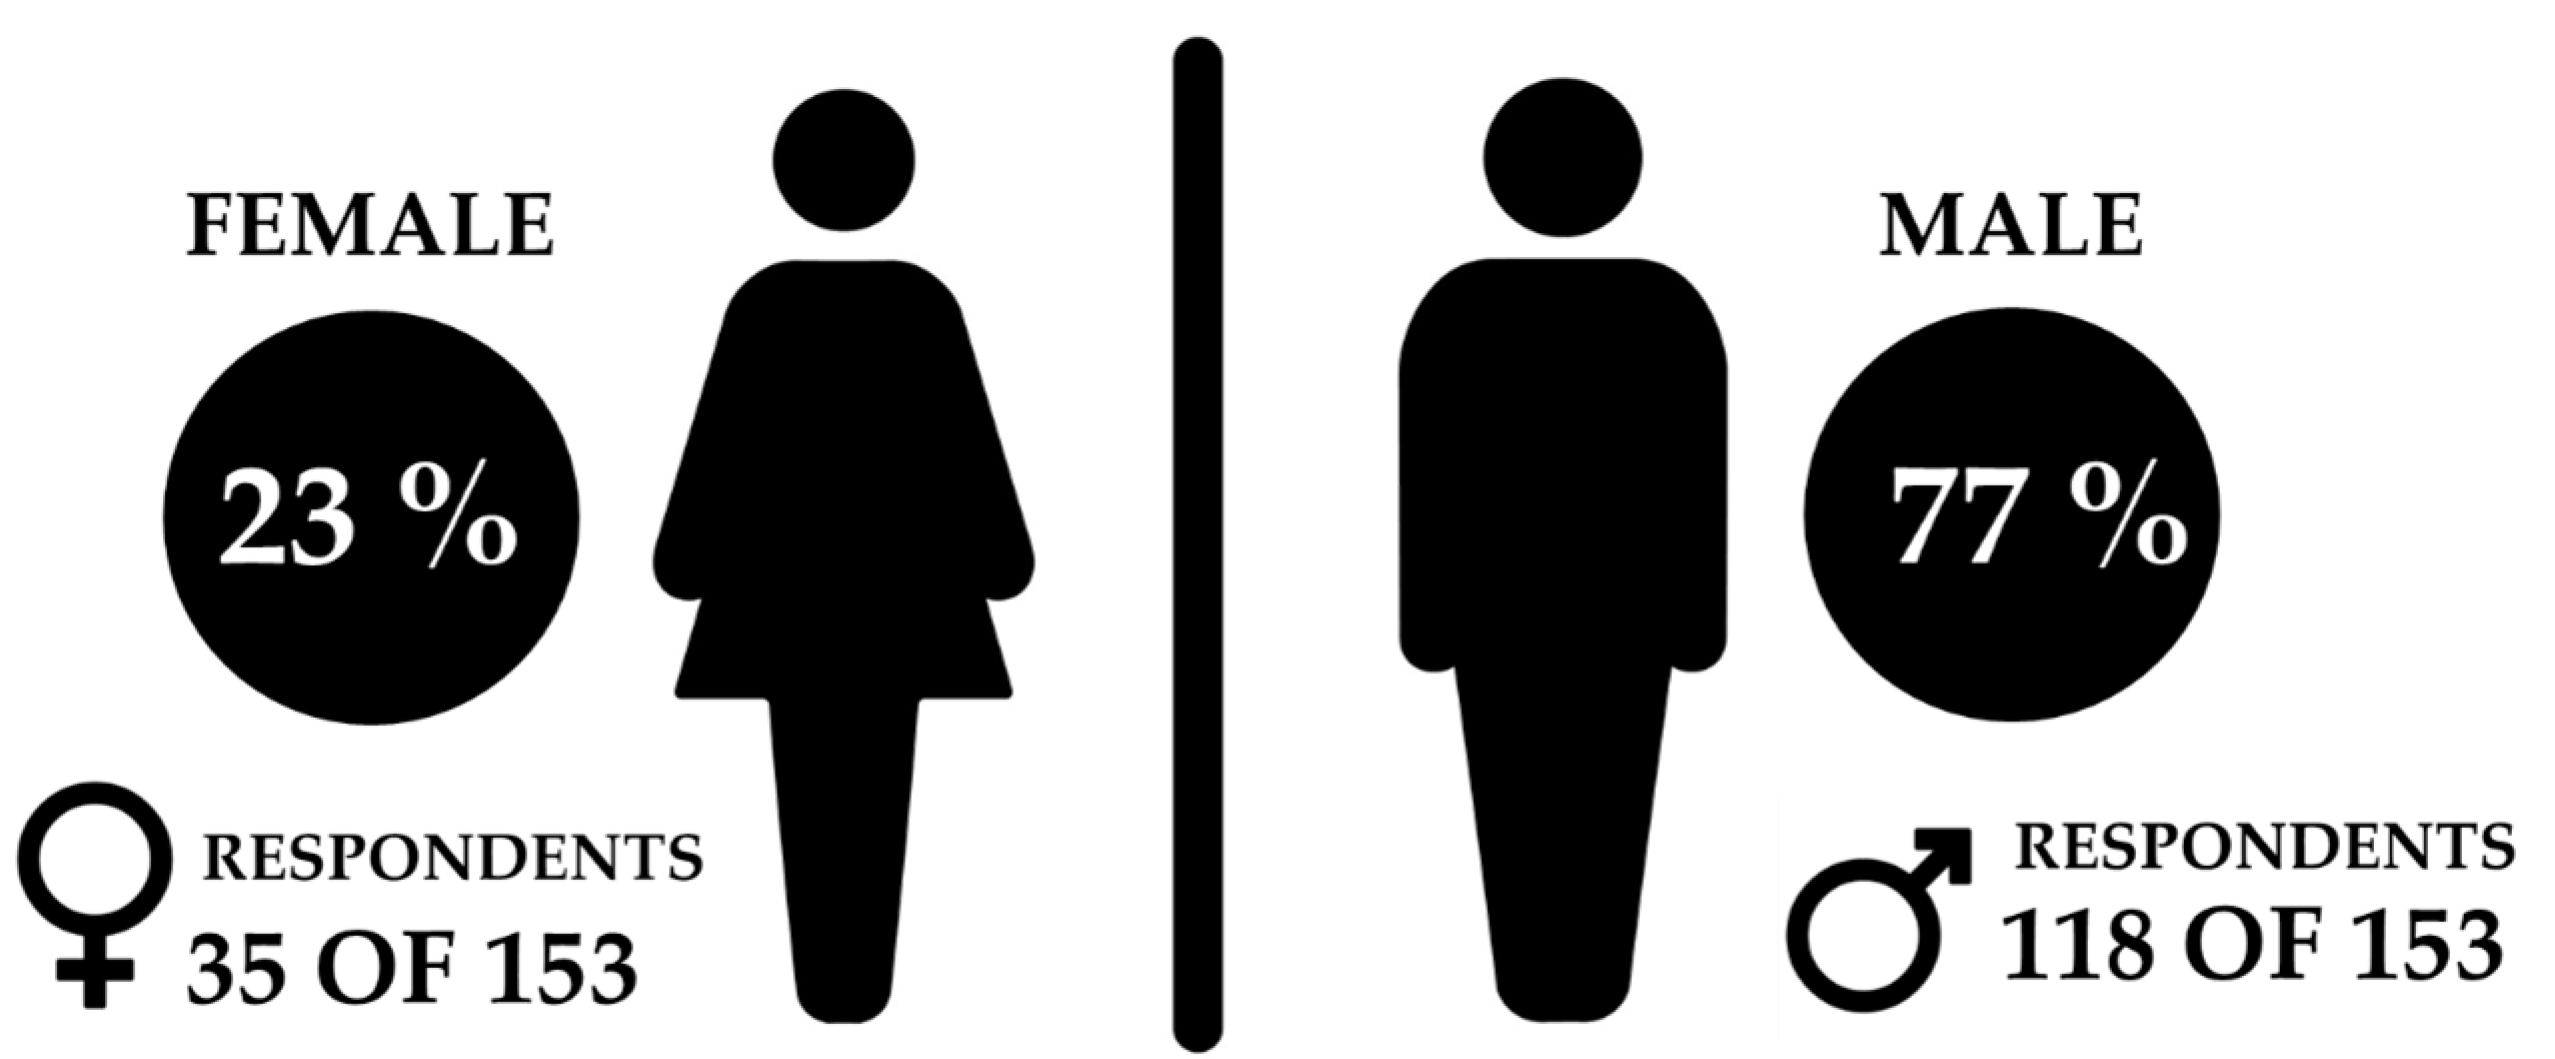
The main purpose of this study is to compare both EV and gasoline vehicles with respect to their environmental performance. The vehicles in this study will represent one category out of the different car categories (micro to family), which are used as a private means of transportation in the urban areas. The assumption is that the emissions from the construction, commissioning, decommissioning, and demolishing of gas turbine power plants are similar to that of gasoline/diesel plants. The scope of the study thus focuses on the operational emissions (CO2 e) for an EV, these are the emissions from the gas turbine power plant supplying electricity, and the operational direct emissions from an internal combustion engine.
This study uses the well-to-wheel (WTW) system boundary on a life-cycle-based approach to understand the overall carbon-related emissions of an electric vehicle (EV) with the conventional Internal Combustion Engine Vehicles (ICEV). The WTW approach refers to the full energy flow starting from the extraction of fossil fuels from the ground until it reaches the wheel of the car. This paper aims to cover the whole value chain for each type’s power source. Figure 1 describes the stages involved from the fuel extraction (well) to the driving of vehicle (wheel) for both the conventional ICEV and EV, with reference fuel as gasoline for ICEVs.
There are two major parts to the well-to-wheel approach of ICEVs. The first one contains the process of extracting the energy source from the ground, transporting the fuel, and it ends by filling the vehicle’s tank with the fuel. This part is called “well to tank”. The second part of the approach contains the process of using the energy that was filled in the tank by transforming the energy into the motion of the vehicle and it is called “tank to wheel”. In order to calculate the full GHG emissions of the ICEVs, the sum of the GHG emission for the two parts need to be added. The WTW GHG emissions for ICEVs can be calculated using Equation (1).
GHG   for   ICEV well - wheel = GHG   Well - tank + GHG   Tank - wheel
The equation above shows the method of calculating the total greenhouse gas emission for ICEVs from the well to the wheels is measured in grams CO2eq/km. Both terms GHGWell to Tank and GHGTank to Wheel are measured in the unit gram CO2eq/L knowing that the fuel efficiency of an ICEV varies depending on the type of vehicle used, and is measured in the unit L/km.
On the other hand, EVs have a different process for the well-to-wheel approach, and it contains two different parts. The first part is focusing on extracting the energy source, processing, and transporting it to the power plant, which is called the “well to power plant”. The second part is the process of transmitting the needed electricity to the vehicle and driving the car using that power and is called “power plant to wheel”. Therefore, the GHG emission for EVs across well to the wheel can be calculated using Equation (2):
GHG   for   EVs Well   to   Wheel = ( GHG Well   to   Power   plant + GHG Power   plant   to   Wheel )   ×   VE
Here, GHG   for   EVs Well   to   Wheel is the total greenhouse gas emission across the well to wheel and is measured in gram CO2eq/km. GHG Well   to   Power   plant and GHG Power   plant   to   Wheel are measured in gram CO2eq/kWh. The electricity efficiency of an electric car which is represented by VE is measured in kWh/km.

3.2. Survey Design

The survey was divided into multiple parts, the first part is about the participants’ backgrounds and personal information to understand the demography and type of sample. The second part aims to collect the participants’ opinions and feedback regarding the use of EVs in the state of Qatar. These parts are the core of the questionnaire where the team will measure the public’s awareness and the effectiveness of the government’s efforts in this movement. Additionally, this part will result in few recommendations on how to improve these efforts and encourage them to move toward using EVs. To accurately obtain the participants’ feedback, the team implemented the use of the Likert satisfaction scale with values ranging from (1–5). The Likert scale was used to improve the result’s accuracy due to its simplicity and ease of understanding compared to the other scales.

4. Results and Analysis

The well-to-wheel (WTW) analysis is divided into two parts namely; (a) well-to-tank (WTT) and (b) tank-to-wheel (TTW). The WTT part consists of oil extraction, oil refining and processing, gasoline transportation, and gasoline filling in the vehicles. The TTW part consists of the transformation of the fuel energy into the driving of the vehicle. According to the report published by the Joint Research Centre of the European Commission (JRC) [46], the WTT factor equals 463.8 g·CO2e/L. The previous number includes the whole process from extracting the fuel from the ground until it reaches the tank of the car. This number will be used to calculate the overall greenhouse emissions using the equations above. The TTW includes the process of burning fuels in a car tank and transforming them into motion for the vehicle. According to JRC [46], the emission factor for the process is 2314.4 g·CO2e/L. It is clearly observed that the TTW emissions take the largest percentage from the whole WTW analysis. The reason behind this big difference in emissions is that TTW has the burning of the fuel itself and it is the part where all the GHGs are emitted into the atmosphere.

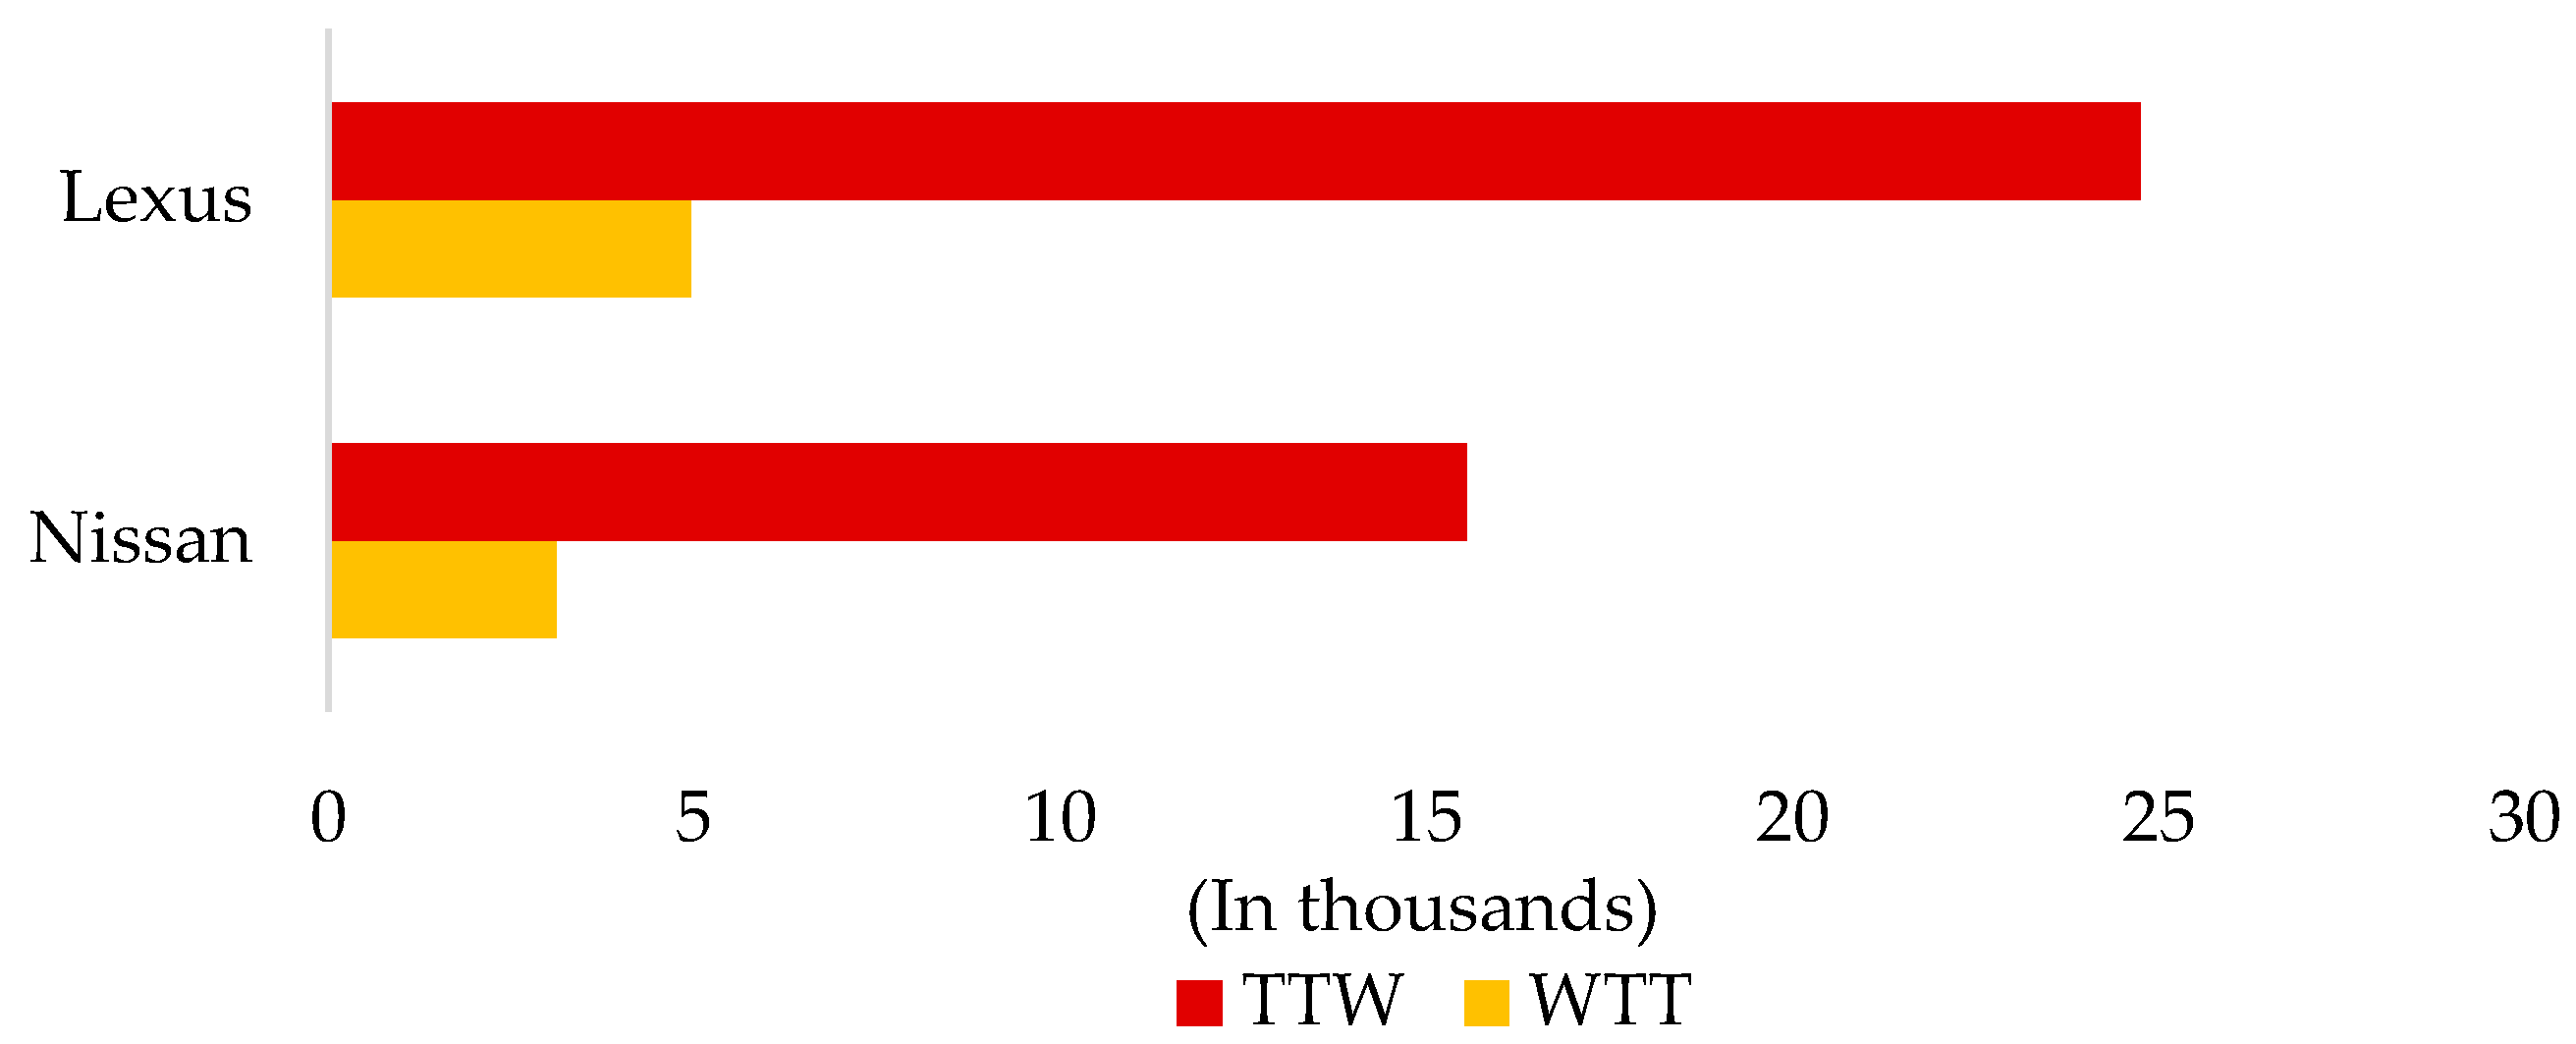
4.1. Conventional ICE Vehicles: WTW Analysis

A WTW analysis was conducted taking two conventional ICE passenger cars. WTW emissions were calculated per 100 km, to compare them with the EV brands of Nissan Leaf and the Tesla Model X. The chosen vehicles were the Nissan Versa with a fuel efficiency of 6.72 L/100 km [47], and the Lexus Rx 350 with an efficiency of 10.69 L/100 km [47]. Figure 2 shows the CO2eq emissions of both the ICE vehicles chosen for study.

4.2. Electric Vehicles: WTW Analysis

4.2.1. Power Generation (BTU/kWh) & (gCO2e/m3)

To calculate the energy required to generate power, i.e., how much gas is required to produce 1 kWh, Umm Alhoul independent water and power project, the newest natural gas-fueled power plant in Qatar was selected. Table 1 presents the data from the Umm Alhoul project [48].
pp e = gc eg = 81 , 074 , 781   MMBTU 9 , 909 , 545   MWH = 8181.5 BTU kWh
where pp e : power plant efficiency (BTU/kWh)
gc : gas consumption (MMBTU)
eg : electricity generation (MWh)
To convert that into cubic meters of natural gas (NG), the Qatar Petroleum conversion table [49] was used:
1   m 3   of   NG = 35 , 700   BTU
Therefore:
pp e = 35 , 700 BTU m 3 × 1   kWh 8181.5   BTU = 4.363   kWh / m 3
The GHG emissions from generating power at Umm Alhoul is:
GHG pp = GHG e eg = 2 , 006 , 858.25   tCO 2 e 9 , 909 , 545   MWH = 202.51 gCO 2 e kWh
where, GHG pp : power plant GHG emissions factor gCO 2 e kWh
GHG e : 2019 scope 1 direct emissions (tCO2e)
eg : electricity generated (MWh)
To convert the above value to emissions per cubic meter of NG:
GHG PP = 436 kWh m 3 ×   202.51 gCO 2 e kWh = 883.55   gCO 2 e m 3
From the above calculations, it is found that for each cubic meter of natural gas burned at Umm Alhoul power plant, 4.36 kWh electricity is generated; similarly, for each cubic meter of natural gas 883.55 gCO2e GHG is emitted.

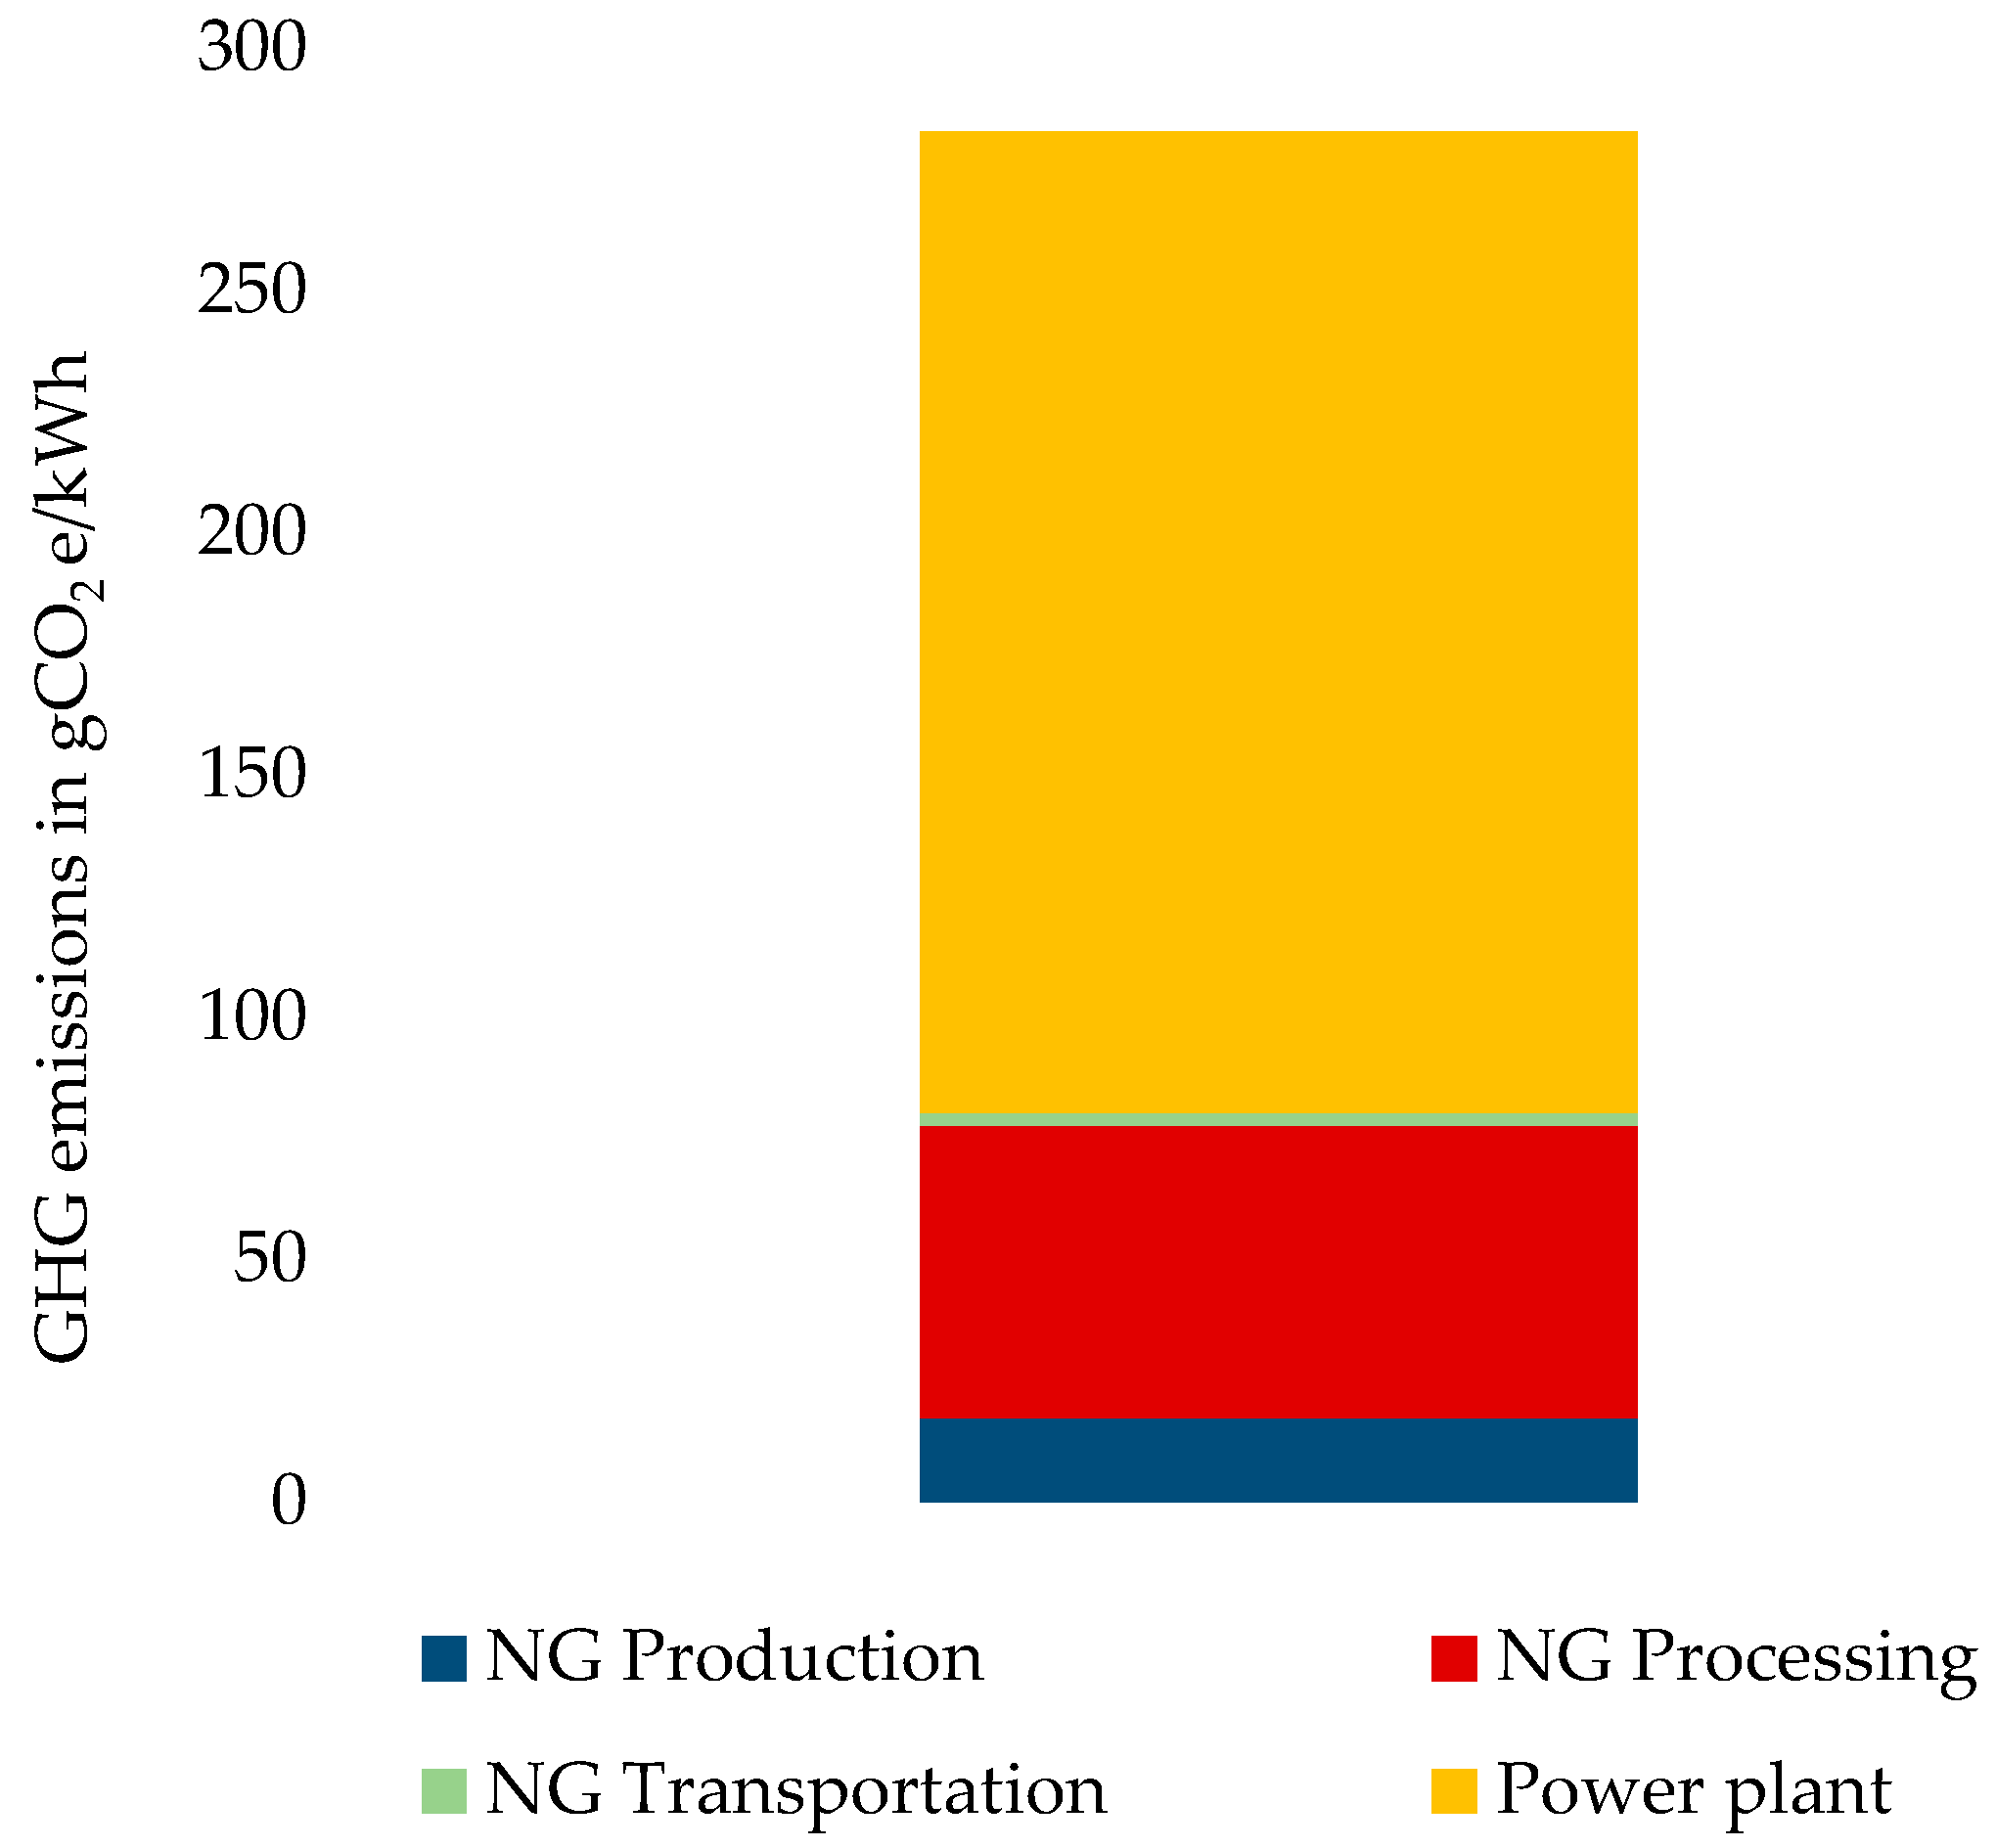
4.2.2. NG Production, Processing, and Transportation (gCO2e/m3)

From ecoinvent v3.7.1, GHG emissions data for the production and processing of 1 m3 of natural gas are presented in Table 2. As the gas in Qatar is sour, which means that it has H2S and CO2, gas sweetening is the selected gas processing.
Now to supply 1 m3 of natural gas to Umm Alhoul powerplant, onshore pipelines from plants at Ras Laffan and Dukhan are considered as the transportation mode. Both Ras Laffan and Dukhan are approximately 100 kms away from the Umm Alhoul project which is in the Umm Said area.
Onshore   pipeline   NG   transportation   GHG   emission = 0.1152 gCO 2 e m 3 · km
Therefore, transportation of 1 m3 NG for 100 km emits approximately 11.52   gCO 2 e .   Table 3 and Figure 3 summarizes the discussed results.
Now, the total GHG emissions per kWh electricity generated is computed as:
GHG kWh = 1233.6   gCO 2 e m 3 × 1 4.363 m 3 kWh = 282.7   gCO 2 e / kWh
The emissions from producing a kWh of natural gas in Qatar equals 282.7 gCO2e. The main contributors form the downstream emissions at the power plant when the natural gas is burned in the gas turbines to drive the electric generators. These contribute to approximately 71.6%. Whereas the upstream processing, sweetening to remove H2S and CO2, accounts for 21.3%. The transportation using onshore pipelines account for less than 1% as the distance between the production facility and the power plant is short. Finally, upstream production is responsible for 6.1% of the GHG emissions. When compared to the industry, this value is low compared to an average of 533 gCO2e/kWh [50].

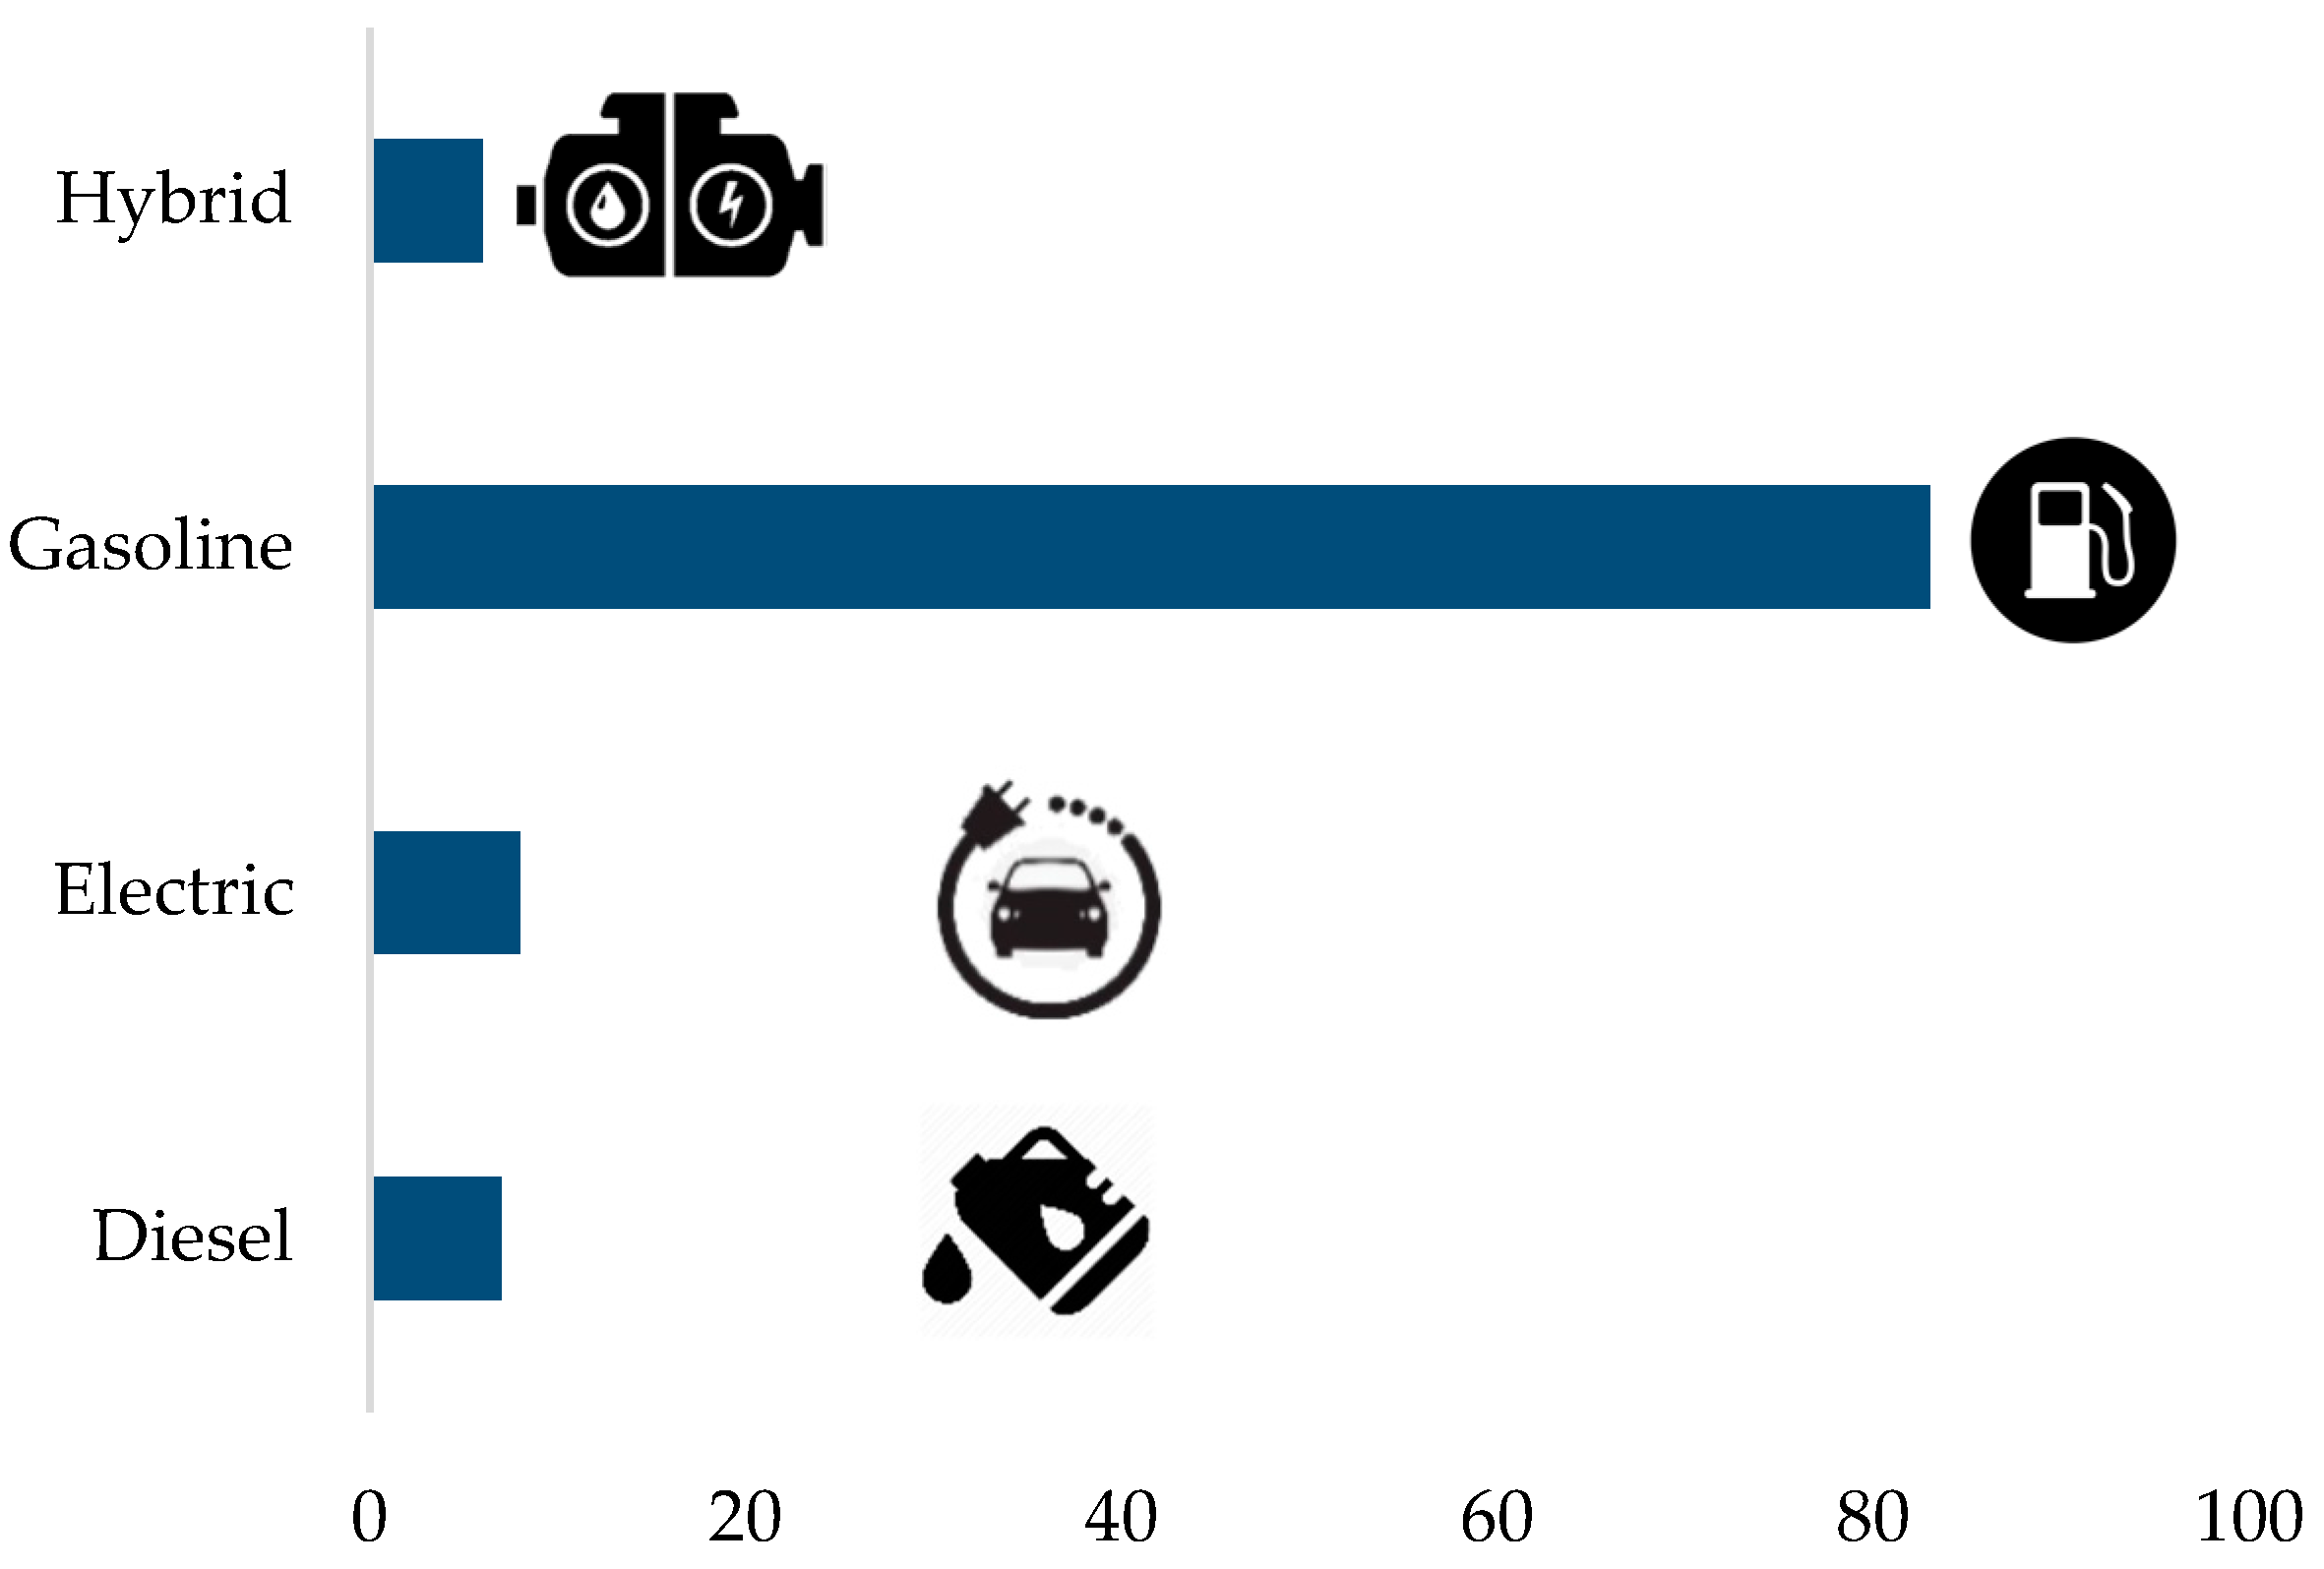
4.2.3. Vehicle Efficiency (gCO2e/100 km)

Two electric vehicles (EVs) are considered for comparison against the ICEV. Equation (3) calculates the emissions per 100 km traveled.
GHG 100 km   =   GHG kWh ×   Eve
where GHG   100 km : GHG emissions per 100 km traveled
EVe : Electric vehicle efficiency kWh/100 km traveled
Table 4 shows the fuel efficiency for the EVs chosen for the comparative study and Figure 4 shows the associated emissions across each stage of the value chain based on the LCA results for the chosen brands of EVs.
As discussed earlier, the GHG emissions are affected by the choice of primary fuel and the associated emissions along the value chain until the electricity is produced. In addition, the EV efficiency depends on the driving pattern, weather, and land geography. For this reason, Tesla states that the GHG emissions for Tesla model X range from 2600 to 13,700 gCO2e/100 km travel [51]. The analysis in this study gives a value of 6389 gCO2e/100 km for the Tesla Model X driven in Qatar, with natural gas as the primary fuel for electricity generation. The results show the value is well within the range provided by Tesla.

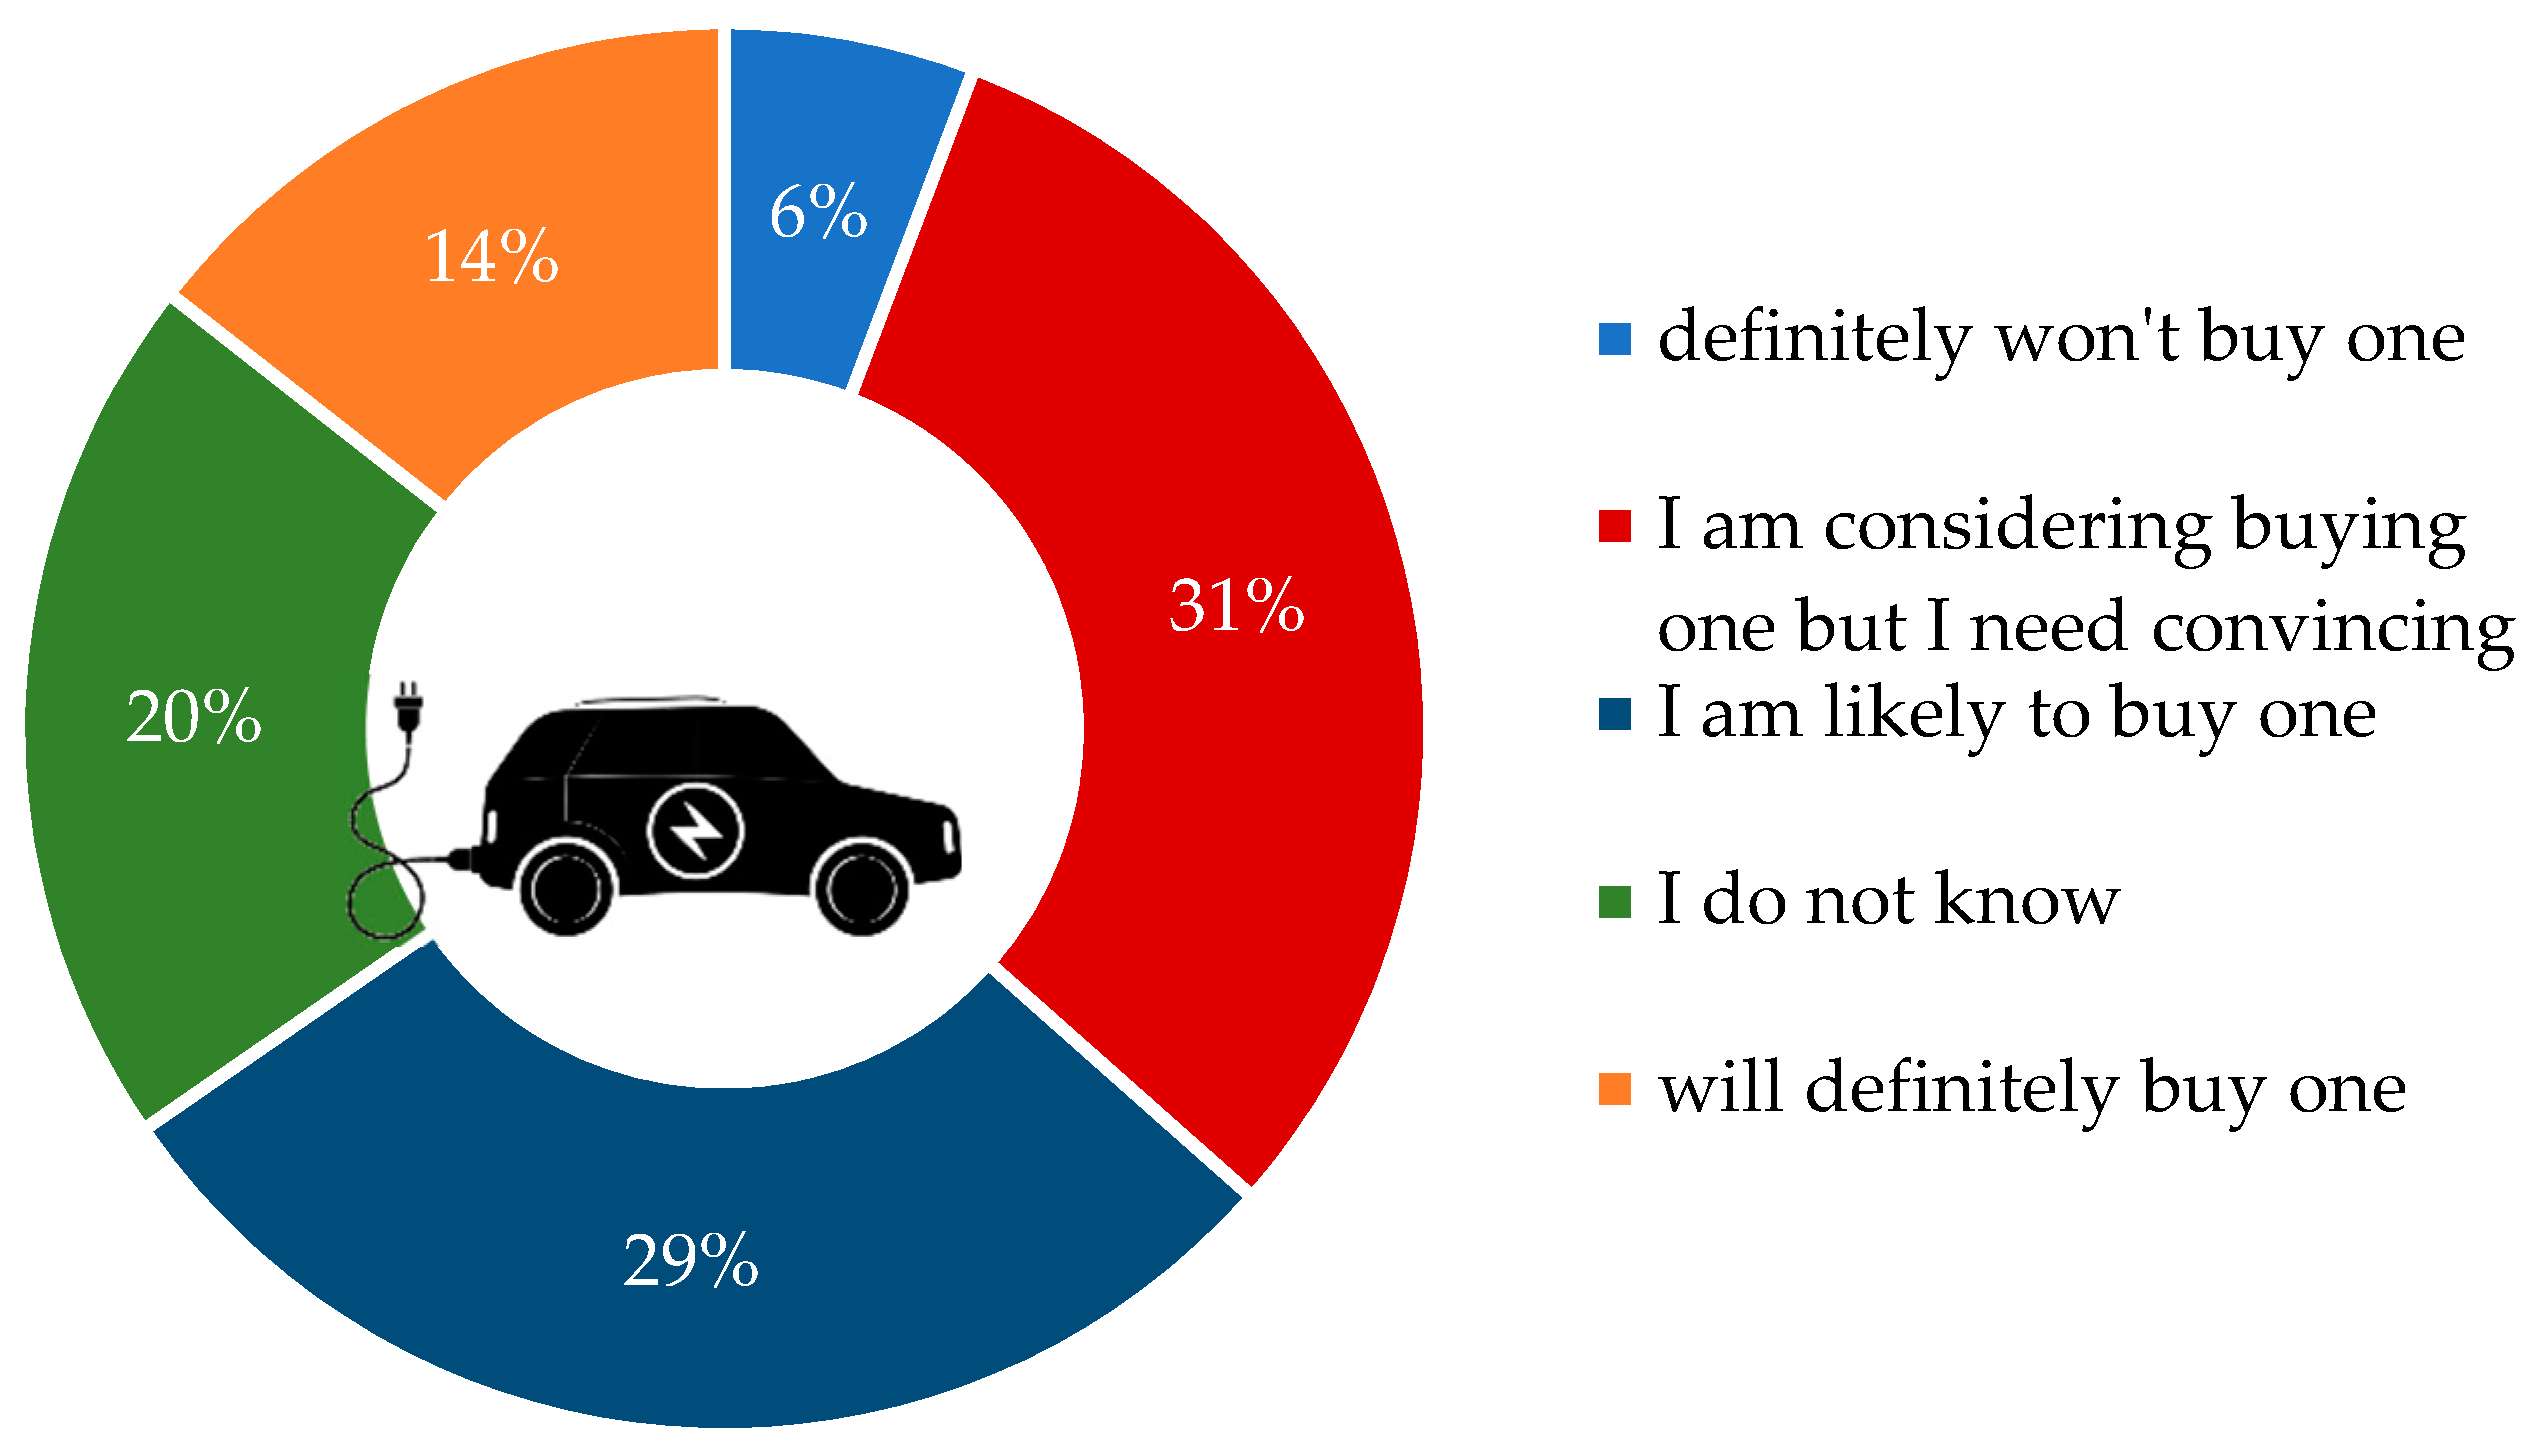
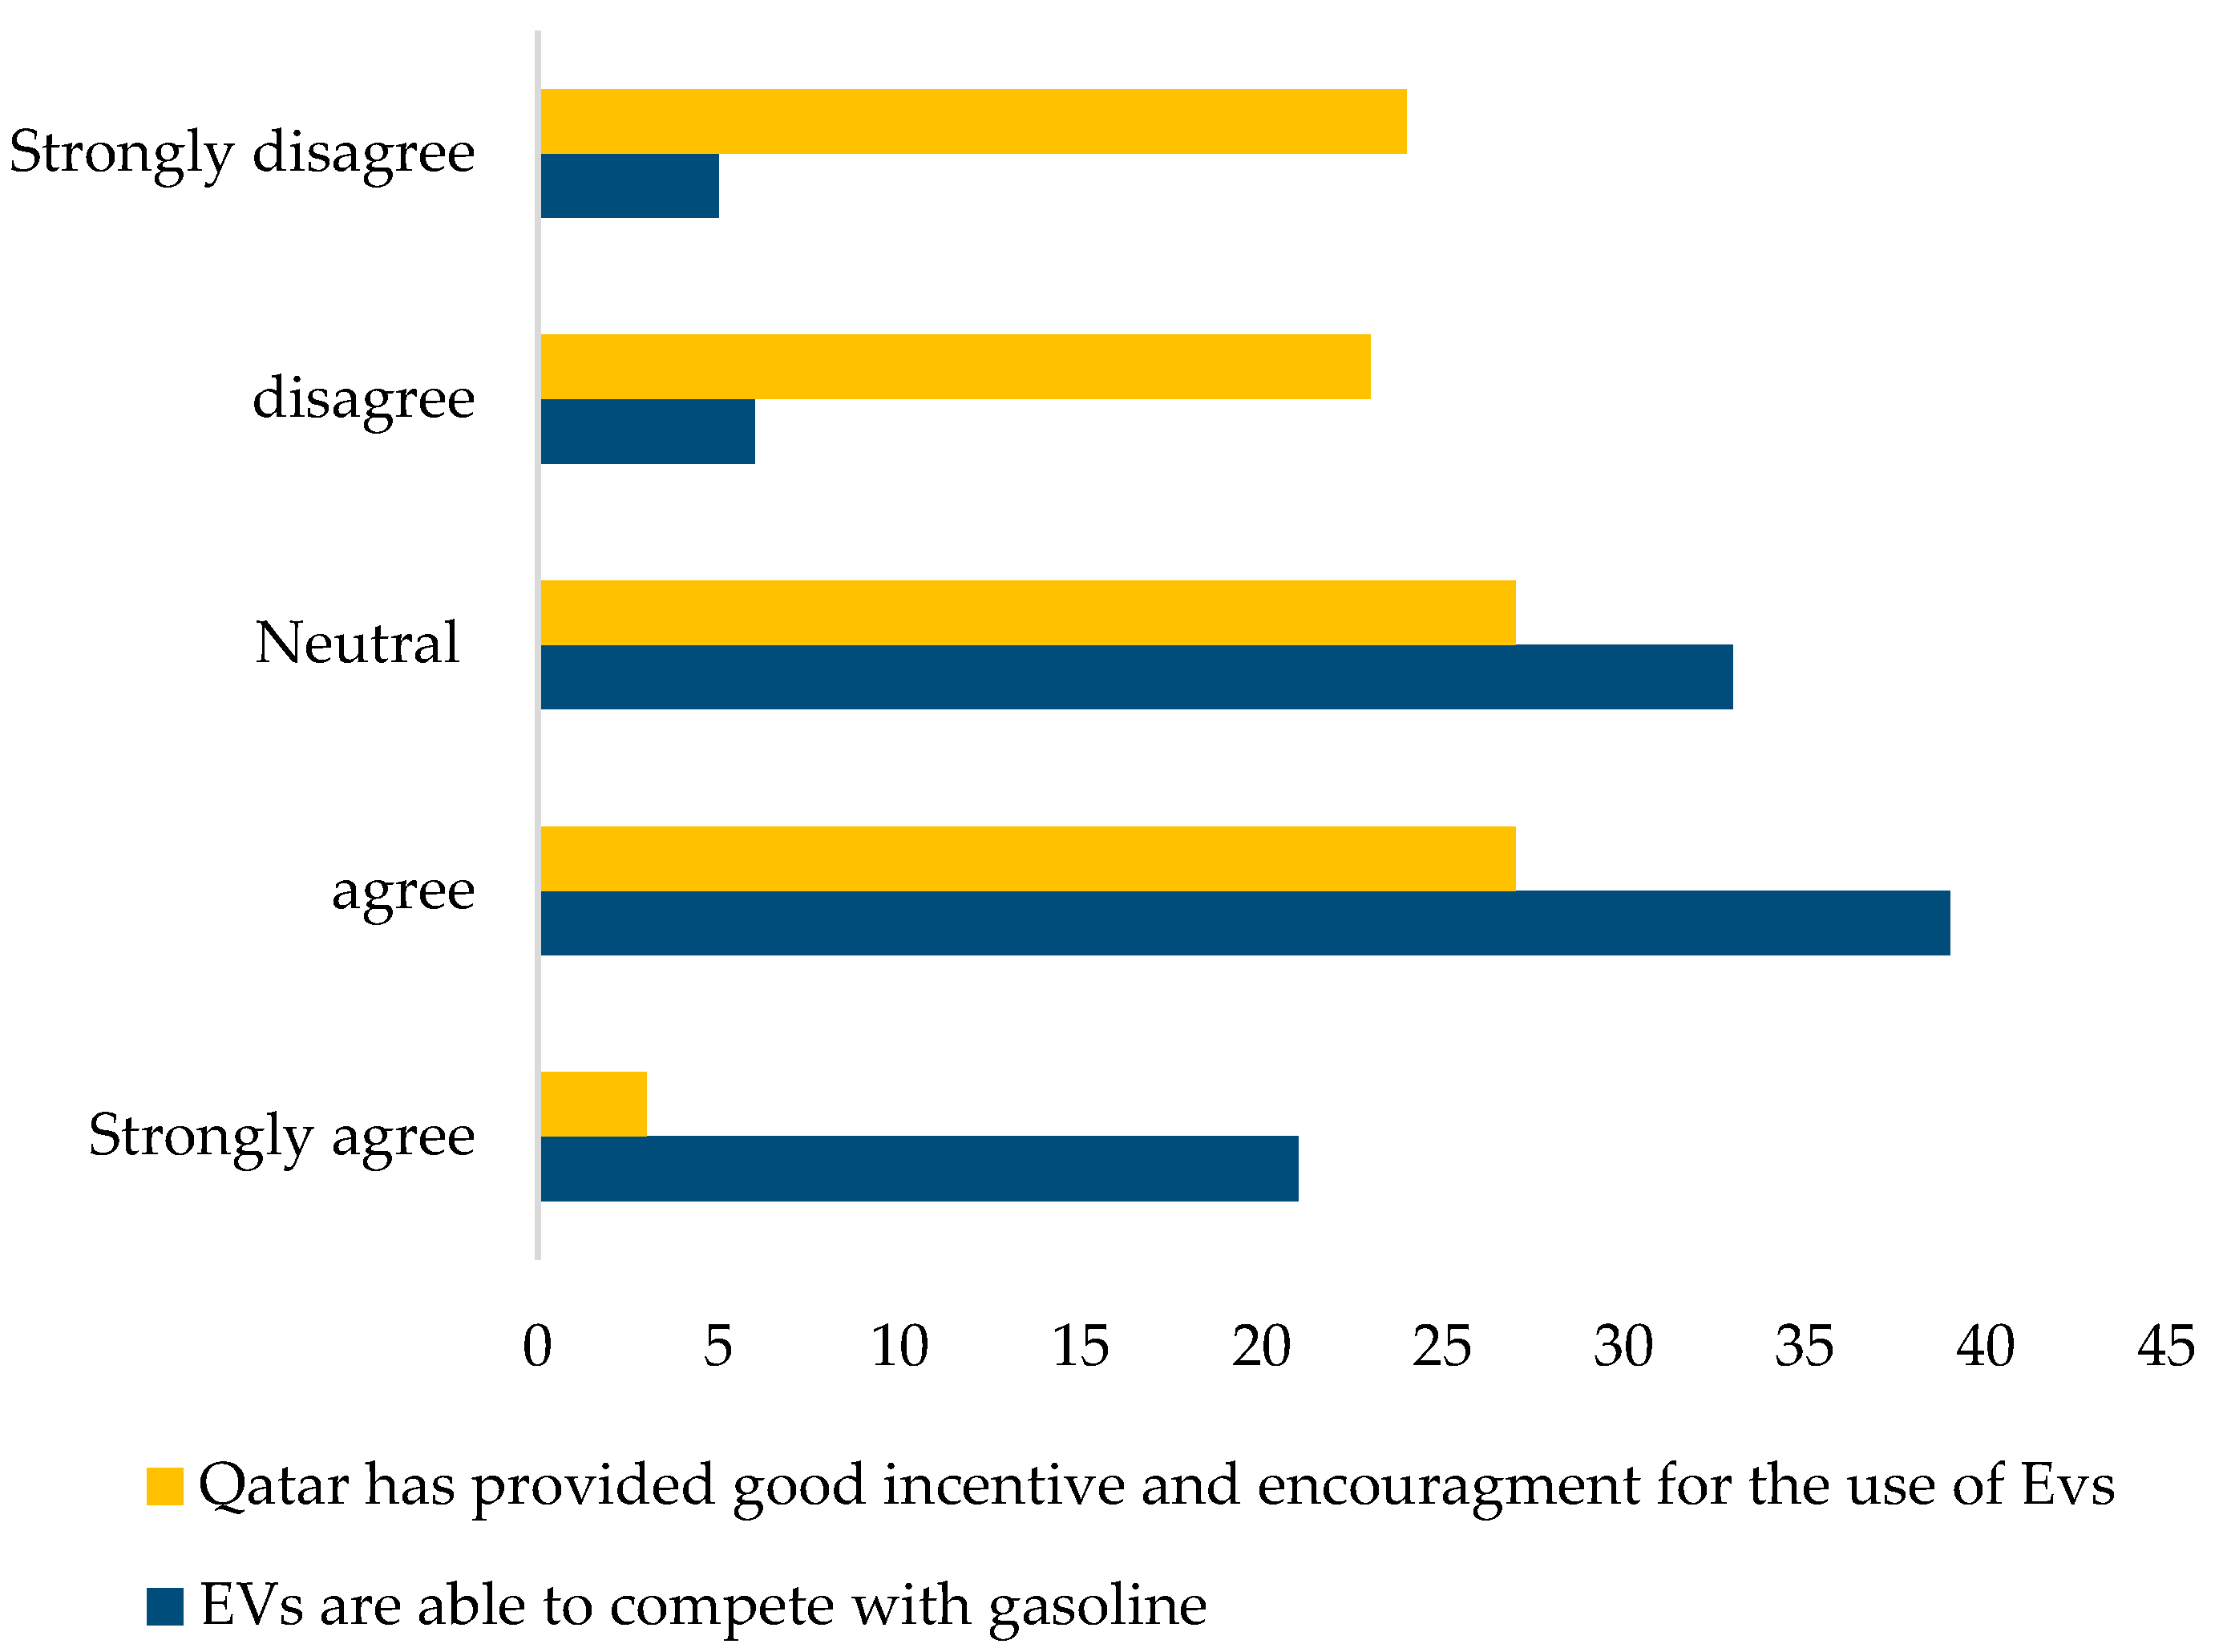
4.3. Social Factors That Influence the EVs Transformation in Qatar

Electromobility has revolutionized the transportation sector, narrowing the gap towards climate resilience [52]. The analysis in this paper proved that EVs have lower environmental impacts compared to gasoline-powered vehicles. This conclusion supports the idea of transforming 10% of the vehicles in Qatar to be EVs by 2030. However, are the people in Qatar willing to transform their cars into electric ones, and how much effort and progress is the Qatar government imputing in EVs? A survey that has been developed and completed by 153 participants from Qatar and contains both genders, aimed to understand some of the social factors that may support or resist the transformation and is used to give a better picture of the societal acceptance of EVs. Figure 5 shows the percentage of the participants based on their gender.
It is seen from Figure 5 that 77% of the participants were males and 23% were female. This result reflects the number of male drivers to females in Qatar which is an important factor in analyzing if the gender difference has any direct connection to the tendency to transform to electric cars. Figure 6 shows the preferences of the participants regarding their preferred vehicle type that he or she are willing to drive:
From Figure 6, it is obvious that gasoline car is choice number one for more than 80% of the participants and that is due to some cultural aspects where the people in Qatar are used to driving gasoline cars, which are abundant in the market. On the other hand, hybrid and electric car options are limited and not satisfying the customer’s needs.
In order to raise awareness in the country and to start the plan of converting 10% of the vehicles to electric vehicles the government of Qatar needs to increase the awareness and the government should study the likelihood of buying electric vehicles within the next five years. Figure 7 shows the statistics of the likelihood to buy an EV by the residents in the State of Qatar.
Figure 7 shows different opinions and preferences of people. There are 31% of participants saying “I am considering buying one, but I need convincing” whereas 20% of the people do not know about electric vehicles and are not aware if they need to change or not. On the other hand, only 6% of participants showed full resistance to the concept of having an electric car in their houses. The results above show that there is a great opportunity for the government to convince the people and the country should do all that it needs from teaching, advertising, and supporting the people who want to know more about this transformation.
Finally, we studied the government’s measures in motivating the residents of Qatar to switch from internal combustion vehicles to better and environmental substitutes. Figure 8 shows the replies to two main questions. The first one is to measure the government incentives and encouragements to use EVs. The second one is to analyze if the EVs could compete with gasoline.
Figure 8 also shows that more than 70% of the participants are not satisfied with the government incentives and they think that it is not good enough to convince them to switch their current gasoline cars just for environmental aspects. Although around 75% of them believe that electric vehicles are the future, and it can compete with gasoline vehicles.

5. Conclusions and Recommendations

This research studied the feasibility of using EVs in the state of Qatar using a well-to-wheel life cycle assessment. The study has taken into consideration the current state of Qatar and the associated sources of power generation in the country. A WTW analysis was also performed for the ICEVs in order to be compared with the EV. It was observed that electric vehicles in economic and luxurious categories have passed the ICEVs with a minimum difference between the Nissan Leaf and Nissan Versa at 12,000 gCO2eq/100 km traveled. This difference can roughly accommodate two additional Nissan Leafs on the road. In other words, the Nissan Versa is emitting GHGs equivalent to three Nissan Leafs.
Additionally, a survey was conducted in order to study the societies acceptance, and it was found that the people in Qatar are aware of the importance of EVs and how beneficial they are to the environment; however, the majority of the participants were not ready to give up their cars and switch to EVs. This implies that Qatar has to spend a lot of time and resources to achieve its goals of 10% EVs by 2030.
A lot of studies have talked about electric vehicles and their benefits, and they have shown that electric vehicles have much fewer emissions compared to any other type; however, there are very few studies that have focused on the social aspect and the importance of studying the feasibility of using these cars in a country. In this research, it is obviously seen that cultural aspects and the people’s acceptance of change play a major role in shaping the transformation of the country and reaching the desired goals. Although they believe in the concept and idea of electric vehicles, the population in Qatar thinks that there are no serious and enough incentives that would lead them to change into EVs especially with the uncertain destiny of their current cars and with the lack of appropriate EV infrastructure in the country. Similar to the cases mentioned in the literature review, Qatar should follow in the footsteps of Germany, Greece, and the United Kingdom in providing incentives and attracting their residents to own EVs. These countries have lowered the registration fees or provided a grant to the people who are willing to buy electric vehicles. The state of Qatar has to do more work in the motivation side of the process such as giving financial incentives to accelerate the cycle of transformation to EVs until it reaches upfront with respect to cost, style, and readiness level of infrastructure with respect to ICEVs. Other ideas like free parking, free charging in public areas and malls, lower registration fees, and more incentives may lead to convincing the people to make the first step toward clean and environmental cars.
The research used the well-to-wheel LCA approach to quantify the associated emissions for both the conventional ICEV and EVs in the State of Qatar. However, a more complete evaluation is required in the future to arrive at conclusions on the emissions associated not only with the use of these EVs, but also its manufacturing process and to the so-called “end of life” (vehicle dismantling and material recycling). For future research, the authors recommend conducting a cradle-to-cradle LCA to better understand the carbon footprint of EV deployment in oil-rich nations such as Qatar, focusing on associated scope-based emissions. Similar studies can be seen in the manufacturing and construction industries employing scope-based analysis like in [53,54,55]. This helps in understanding the feasibility when planning to switch completely to e-mobility by 2030. The energy intensity and CO2 emissions associated with the production of batteries and, the underlying scope to re-use battery elements such as Lithium, Cobalt, and Nickel as an alternative to recycling batteries can form a basis for further research. Transforming waste biomass into clean fuel or capturing CO2 emissions and transforming these into synthetic methane and combining them within highly efficient dedicated natural gas engines can support decarbonizing the transport system in natural gas-rich nations such as Qatar [56,57]. A life cycle cost analysis in support to these alternatives is essential to understand if electromobility can grant a completely sustainable solution or not. A systemic approach to thinking about what effective alternative solutions can bring in terms of cost and use is essential and best advised [58,59].

Author Contributions

Conceptualization, A.A.-B. and M.K.; methodology, M.F.; software, N.C.O.; validation, N.C.O., A.A.K. and M.K.; data curation, S.A.-M.; writing—original draft preparation, A.A.-B., S.A.-M., M.F.; writing—review and editing, A.A.K.; visualization, A.A.K.; supervision, M.K. All authors have read and agreed to the published version of the manuscript.

Funding

This research received no external funding.

Institutional Review Board Statement

Not applicable.

Informed Consent Statement

Not applicable.

Data Availability Statement

The data that support the findings of this study are available on request from the corresponding author, Murat Kucukvar.

Conflicts of Interest

The authors declare no conflict of interest.

References

  1. Larminie, J.; Lowry, J. Electric Vehicle Technology Explained; John Wiley & Sons, Ltd.: Chichester, UK, 2003; ISBN 0470851635. [Google Scholar]
  2. Emadi, A. Advanced Electric Drive Vehicles; CRC Press, Taylor & Francis Group: Abingdon, UK, 2014; ISBN 9781138072855. [Google Scholar]
  3. Onat, N.C.; Kucukvar, M.; Afshar, S. Eco-efficiency of electric vehicles in the United States: A life cycle assessment based principal component analysis. J. Clean. Prod. 2019, 212, 515–526. [Google Scholar] [CrossRef]
  4. Onat, N.C.; Kucukvar, M.; Tatari, O.; Egilmez, G. Integration of system dynamics approach toward deepening and broadening the life cycle sustainability assessment framework: A case for electric vehicles. Inter. J. Life Cycle Assess. 2016, 21, 1009–1034. [Google Scholar] [CrossRef]
  5. Onat, N.C.; Aboushaqrah, N.N.; Kucukvar, M.; Tarlochan, F.; Hamouda, A.M. From sustainability assessment to sustainability management for policy development: The case for electric vehicles. Energy Convers. Manag. 2020, 216, 112937. [Google Scholar] [CrossRef]
  6. Shaikh, M.A.; Kucukvar, M.; Onat, N.C.; Kirkil, G. A framework for water and carbon footprint analysis of national electricity production scenarios. Energy 2017, 139, 406–421. [Google Scholar] [CrossRef]
  7. Zhao, Y.; Onat, N.C.; Kucukvar, M.; Tatari, O. Carbon and energy footprints of electric delivery trucks: A hybrid multi-regional input-output life cycle assessment. Trans. Res. Part D Tran. Environ. 2016, 47, 195–207. [Google Scholar] [CrossRef]
  8. Sen, B.; Onat, N.C.; Kucukvar, M.; Tatari, O. Material footprint of electric vehicles: A multiregional life cycle assessment. J. Clean. Prod. 2019, 209, 1033–1043. [Google Scholar] [CrossRef]
  9. Aseel, S.; Al-Yafei, H.; Kucukvar, M.; Onat, N.C.; Turkay, M.; Kazancoglu, Y.; Al-Sulaiti, A.; Al-Hajri, A. A model for estimating the carbon footprint of maritime transportation of Liquefied Natural Gas under uncertainty. Sustain. Prod. Cons. 2021, 27, 1602–1613. [Google Scholar] [CrossRef]
  10. Kucukvar, M.; Samadi, H. Linking national food production to global supply chain impacts for the energy-climate challenge: The cases of the EU-27 and Turkey. J. Clean. Prod. 2015, 108, 395–408. [Google Scholar] [CrossRef]
  11. Onat, N.C.; Kucukvar, M.; Tatari, O. Conventional, hybrid, plug-in hybrid or electric vehicles? State-based comparative carbon and energy footprint analysis in the United States. Appl. Energy 2015, 150, 36–49. [Google Scholar] [CrossRef]
  12. Elhmoud, E.R.; Kutty, A.A.; Abdalla, G.M.; Kucukvar, M.; Bulak, M.E.; Elkharaz, J.M. Eco-Efficiency Performance of Airlines in Eastern Asia: A Principal Component Analysis Based Sustainability Assessment. In Proceedings of the 11th Annual International Conference on Industrial Engineering and Operations Management, Singapore, 7–11 March 2021. [Google Scholar]
  13. Onat, N.C.; Noori, M.; Kucukvar, M.; Zhao, Y.; Tatari, O.; Chester, M. Exploring the suitability of electric vehicles in the United States. Energy 2017, 121, 631–642. [Google Scholar] [CrossRef]
  14. Onat, N.C.; Kucukvar, M.; Tatari, O.; Zheng, Q.P. Combined application of multi-criteria optimization and life-cycle sustainability assessment for optimal distribution of alternative passenger cars in US. J. Clean. Prod. 2016, 112, 291–307. [Google Scholar] [CrossRef]
  15. Onat, N.C.; Kucukvar, M.; Tatari, O. Well-to-wheel water footprints of conventional versus electric vehicles in the United States: A state-based comparative analysis. J. Clean. Prod. 2018, 204, 788–802. [Google Scholar] [CrossRef]
  16. Mesa, H.W. Energy Alternatives for the Transport Sector: The US and the EU Move in Different Directions (ARI). Elcano Newsl. 2011, 81, 1–7. [Google Scholar]
  17. Onat, N.C.; Kucukvar, M.; Aboushaqrah, N.N.M.; Jabbar, R. How sustainable is electric mobility? A comprehensive sustainability assessment approach for the case of Qatar. Appl. Energy 2019, 250, 461–477. [Google Scholar] [CrossRef]
  18. Egede, P.; Dettmer, T.; Herrmann, C.; Kara, S. Life Cycle Assessment of Electric Vehicles—A Framework to Consider Influencing Factors. Procedia CIRP 2015, 29, 233–238. [Google Scholar] [CrossRef]
  19. Kumar, R.; Padmanaban, S. Electric vehicles for India: Overview and challenges. IEEE India Inform. 2019, 14, 139–142. [Google Scholar]
  20. Ahmed, A.; Iqbal, A.; Khan, I.; Al-Wahedi, A.; Mehrjerdi, H.; Rahman, S. Impact of EV charging Station Penetration on Harmonic Distortion Level in Utility Distribution Network: A Case Study of Qatar. In Proceedings of the 2021 IEEE Texas Power and Energy Conference (TPEC), College Station, TX, USA, 2–5 February 2021; IEEE: Philadelphia, PA, USA; pp. 1–6. [Google Scholar] [CrossRef]
  21. Sahin, E.S.; Bayram, I.S.; Koc, M. Demand side management opportunities, framework, and implications for sustainable development in resource-rich countries: Case study Qatar. J. Clean. Prod. 2019, 241, 118332. [Google Scholar] [CrossRef]
  22. Khazaei, H.; Ali, K. Electric Vehicles and Factors That Influencing Their Adoption Moderating Effects of Driving Experience and Voluntariness of Use (Conceptual Framework). J. Bus. Manag. 2016, 18, 60–65. [Google Scholar]
  23. Razak, M.I.M.; Yusof, A.M.; Mashahadi, F.; Alias, Z.; Othman, M.Z. Intention to purchase hybrid cars in Malaysia an overview. Int. J. Econ. Commer. Manag. 2014, 2, 1–13. [Google Scholar]
  24. Yan, Q.; Qian, C.; Zhang, B.; Kezunovic, M. Statistical analysis and modeling of plug-in electric vehicle charging demand in distribution systems. In Proceedings of the 2017 19th International Conference on Intelligent System Application to Power Systems (ISAP), San Antonio, TX, USA, 17–20 September 2017; IEEE: Philadelphia, PA, USA; pp. 1–6. [Google Scholar] [CrossRef]
  25. Burd, J.T.J.; Moore, E.A.; Ezzat, H.; Kirchain, R.; Roth, R. Improvements in electric vehicle battery technology influence vehicle lightweighting and material substitution decisions. Appl. Energy 2021, 283, 116269. [Google Scholar] [CrossRef]
  26. Meltzer, J.; Hultman, N.E.; Langley, C. Low-Carbon Energy Transitions in Qatar and the Gulf Cooperation Council Region; Global Economy and Development; Brookings Institution: Washington, DC, USA, 2014. [Google Scholar]
  27. Falcão, E.A.M.; Teixeira, A.C.R.; Sodré, J.R. Analysis of CO2 emissions and techno-economic feasibility of an electric commercial vehicle. Appl. Energy 2017, 193, 297–307. [Google Scholar] [CrossRef]
  28. Shafique, M.; Azam, A.; Rafiq, M.; Luo, X. Life cycle assessment of electric vehicles and internal combustion engine vehicles: A case study of Hong Kong. Res. Transp. Econ. 2021, 101112. [Google Scholar] [CrossRef]
  29. Holland, S.P.; Mansur, E.T.; Muller, N.Z.; Yates, A.J. Are There Environmental Benefits from Driving Electric Vehicles? The Importance of Local Factors. Am. Econ. Rev. 2016, 106, 3700–3729. [Google Scholar] [CrossRef] [Green Version]
  30. Baek, S.; Kim, H.; Chang, H. A Feasibility Test on Adopting Electric Vehicles to Serve as Taxis in Daejeon Metropolitan City of South Korea. Sustainability 2016, 8, 964. [Google Scholar] [CrossRef] [Green Version]
  31. Hawkins, T.R.; Singh, B.; Majeau-Bettez, G.; Strømman, A.H. Comparative Environmental Life Cycle Assessment of Conventional and Electric Vehicles. J. Ind. Ecol. 2013, 17, 53–64. [Google Scholar] [CrossRef]
  32. Egbue, O.; Long, S. Barriers to widespread adoption of electric vehicles: An analysis of consumer attitudes and perceptions. Energy Policy 2012, 48, 717–729. [Google Scholar] [CrossRef]
  33. Khandakar, A.; Rizqullah, A.; Ashraf Abdou Berbar, A.; Rafi Ahmed, M.; Iqbal, A.; Chowdhury, M.E.H.; Uz Zaman, S.M.A. A Case Study to Identify the Hindrances to Widespread Adoption of Electric Vehicles in Qatar. Energies 2020, 13, 3994. [Google Scholar] [CrossRef]
  34. Rakov, V.; Pikalev, O.; Akhmetov, T.; Budavina, T.; Smirnov, P. Assessment of feasibility of using the existing electric power infrastructure for charging electric and hybrid vehicles. E3S Web Conf. 2020, 178, 01056. [Google Scholar] [CrossRef]
  35. Cassani, P.A.; Williamson, S.S. Feasibility Analysis of a Novel Cell Equalizer Topology for Plug-In Hybrid Electric Vehicle Energy-Storage Systems. IEEE Trans. Veh. Technol. 2009, 58, 3938–3946. [Google Scholar] [CrossRef]
  36. Safak Bayram, I. A Stochastic Simulation Model to Assess the Impacts of Electric Vehicle Charging on Power Generation: A Case Study for Qatar. In Proceedings of the 2019 IEEE Transportation Electrification Conference and Expo (ITEC), Detroit, MI, USA, 19–21 June 2019. [Google Scholar] [CrossRef]
  37. Ahmadi, L.; Young, S.B.; Fowler, M.; Fraser, R.A.; Achachlouei, M.A. A cascaded life cycle: Reuse of electric vehicle lithium-ion battery packs in energy storage systems. Int. J. Life Cycle Assess. 2017, 22, 111–124. [Google Scholar] [CrossRef]
  38. Young, K.; Wang, C.; Wang, L.Y.; Strunz, K. Electric Vehicle Battery Technologies. In Electric Vehicle Integration into Modern Power Networks; Springer: New York, NY, USA, 2013; pp. 15–56. [Google Scholar]
  39. Al Wahedi, A.; Bicer, Y. Development of an off-grid electrical vehicle charging station hybridized with renewables including battery cooling system and multiple energy storage units. Energy Rep. 2020, 6, 2006–2021. [Google Scholar] [CrossRef]
  40. Onat, N.C.; Kucukvar, M.; Tatari, O. Towards Life Cycle Sustainability Assessment of Alternative Passenger Vehicles. Sustainability 2014, 6, 9305–9342. [Google Scholar] [CrossRef] [Green Version]
  41. Rezvani, Z.; Jansson, J.; Bodin, J. Advances in consumer electric vehicle adoption research: A review and research agenda. Transp. Res. Part D Transp. Environ 2015, 34, 122–136. [Google Scholar] [CrossRef] [Green Version]
  42. Lassila, J.; Haakana, J.; Tikka, V.; Partanen, J. Methodology to Analyze the Economic Effects of Electric Cars as Energy Storages. IEEE Trans. Smart Grid 2012, 3, 506–516. [Google Scholar] [CrossRef]
  43. Luna, T.F.; Uriona-Maldonado, M.; Silva, M.E.; Vaz, C.R. The influence of e-carsharing schemes on electric vehicle adoption and carbon emissions: An emerging economy study. Transp. Res. Part D Transp. Environ. 2020, 79, 102226. [Google Scholar] [CrossRef]
  44. Gil-García, I.C.; García-Cascales, M.; Dagher, H.; Molina-García, A. Electric vehicle and renewable energy sources: Motor fusion in the energy transition from a multi-indicator perspective. Sustainability 2021, 13, 3430. [Google Scholar] [CrossRef]
  45. Kumar, R.R.; Alok, K. Adoption of electric vehicle: A literature review and prospects for sustainability. J. Clean. Prod. 2020, 253, 119911. [Google Scholar] [CrossRef]
  46. The Joint Research Centre of European Commission. JEC Well-To-Tank Report v5; Publications Office of the European Union: Luxembourg, 2020. [Google Scholar] [CrossRef]
  47. U.S. Department of Energy. Available online: https://www.fueleconomy.gov/feg/Find.do?action=sbs&id=41796 (accessed on 29 April 2021).
  48. Umm Al Houl Power. Environmental Development. Available online: https://ummalhoul.net/health-safety?k=Environmental-Development (accessed on 6 July 2021).
  49. Qatar Petroleum. Conversion Factors. Available online: https://qp.com.qa/en/Pages/ConversionFactor (accessed on 5 June 2021).
  50. Woo, J.R.; Choi, H.; Ahn, J. Well-to-wheel analysis of greenhouse gas emissions for electric vehicles based on electricity generation mix: A global perspective. Transp. Res. Part D Transp. Environ. 2017, 51, 340–350. [Google Scholar] [CrossRef]
  51. Tesla. European Union Energy Label. Available online: https://www.tesla.com/en_EU/support/european-union-energy-label?redirect=no (accessed on 29 July 2021).
  52. Onat, N.C.; Abdella, G.M.; Kucukvar, M.; Kutty, A.A.; Al-Nuaimi, M.; Kumbaroğlu, G.; Bulu, M. How eco-efficient are electric vehicles across Europe? A regionalized life cycle assessment-based eco-efficiency analysis. Sustain. Dev. 2020. [Google Scholar] [CrossRef]
  53. Onat, N.C.; Kucukvar, M. Carbon footprint of construction industry: A global review and supply chain analysis. Renew. Sustain. Energy Rev. 2020, 124, 109783. [Google Scholar] [CrossRef]
  54. Onat, N.C.; Kucukvar, M.; Tatari, O. Scope-based carbon footprint analysis of US residential and commercial buildings: An input–output hybrid life cycle assessment approach. Buil. Environ. 2014, 72, 53–62. [Google Scholar] [CrossRef]
  55. Kucukvar, M.; Egilmez, G.; Onat, N.C.; Samadi, H. A global, scope-based carbon footprint modeling for effective carbon reduction policies: Lessons from the Turkish manufacturing. Sustain. Prod. Cons. 2015, 1, 47–66. [Google Scholar] [CrossRef]
  56. Elhmoud, E.R.; Kutty, A.A. Sustainability Assessment in Aviation Industry: A Mini-Review on the Tools, Models and Methods of Assessment. In Proceedings of the 2nd African International Conference on Industrial Engineering and Operations Management, Harare, Zimbabwe, 7–10 December 2021. [Google Scholar]
  57. Kutty, A.A.; Al-Jurf, N.; Naser, A.F.; Kucukvar, M.; Ayad, H.; Al-Obadi, M.; Abdella, G.M.; Bulak, M.E.; Elkharaz, J.M. Optimizing University Campus Shuttle Bus Congestion Focusing on System Effectiveness and Reliability: A Combined Modeling Based-Routing Approach. In Proceedings of the International Conference on Industrial Engineering and Operations Management, Sao Paulo, Brazil, 5–8 April 2021. [Google Scholar]
  58. Onat, N.C.; Kucukvar, M.; Halog, A.; Cloutier, S. Systems thinking for life cycle sustainability assessment: A review of recent developments, applications, and future perspectives. Sustainability 2017, 9, 706. [Google Scholar] [CrossRef] [Green Version]
  59. Kutty, A.A.; Abdella, G.M.; Kucukvar, M.; Onat, N.C.; Bulu, M. A system thinking approach for harmonizing smart and sustainable city initiatives with United Nations sustainable development goals. Sustain. Dev. 2020, 28, 1347–1365. [Google Scholar] [CrossRef]
Figure 1. Life cycle system boundary for the well-to-wheel analysis of ICEV and EV.
Vehicles 03 00037 g001
Figure 2. CO2 eq emissions associated with the use of Nissan Versa and Lexus Rx 350 across the stages of well-to-wheel LCA.
Vehicles 03 00037 g002
Figure 3. GHG emissions per kWH electricity generated across the respective stages of the value chain, based on the EV WTW LCA results.
Vehicles 03 00037 g003
Figure 4. GHG emissions per kWH electricity generated by EV type across the respective stages of the value chain, based on the LCA results.
Vehicles 03 00037 g004
Figure 5. Gender of survey participants.
Vehicles 03 00037 g005
Figure 6. Participants choice on the type of vehicle preferred to commute.
Vehicles 03 00037 g006
Figure 7. Survey outcomes on the likelihood of purchasing an EV within 5 years.
Vehicles 03 00037 g007
Figure 8. Participant response statistics to government incentives for EV adoption in Qatar.
Vehicles 03 00037 g008
Table 1. Umm Alhoul Power Plant 2019 data.
MeasureUnitValue
Power capacityMW2520
Electricity generationMWh9,909,545
Gas consumptionsMMBTU81,074,781
Scope-1 emissionstCO2e2,006,858.25
Table 2. Natural gas production and processing GHG emissions (ecoinvent).
Stage GHG   Emissions   ( gCO 2 e / m 3 )
NG Production75.43
NG sweetening263.1
Table 3. LCA of natural gas value chain under the well-to-wheel scenario.
StageEmissions
(gCO2e/m3)
Emissions
(gCO2e/kWh)
ContributionSource
NG production75.4317.36.1%Ecoinvent v3.7.1
NG processing (sweetening)263.160.321.3%Ecoinvent V3.7.1
NG onshore pipeline 100 km transportation 11.522.60.9%Ecoinvent V3.7.1
Umm Alhoul combined cycle power plant 883.55202.571.6%Calculated based on real data
Total emissions 1233.6282.7100%
Table 4. Efficiency per brand and classification of EVs.
BrandPrototypeClassificationEVe
(kWh/100 km)
Emissions
(gCO2e/100 km)
Nissan leaf Vehicles 03 00037 i001Compact hatchback16.62693
Tesla Model X Vehicles 03 00037 i002Sedan22.66389
Publisher’s Note: MDPI stays neutral with regard to jurisdictional claims in published maps and institutional affiliations.

