Article

Scheduling of a Microgrid with High Penetration of Electric Vehicles Considering Congestion and Operations Costs

Electrical and Electronics Engineering Deparment, Universidad Nacional de Colombia, Bogotá 11011, Colombia
*
Author to whom correspondence should be addressed.
Vehicles 2021, 3(3), 578-594; https://doi.org/10.3390/vehicles3030035
Submission received: 29 July 2021 / Revised: 18 August 2021 / Accepted: 19 August 2021 / Published: 1 September 2021
(This article belongs to the Special Issue Electrified Intelligent Transportation Systems)

Abstract

:
This paper reviews the impact that can be presented by the immersion of generation sources and electric vehicles into the distribution network, with a technical, operational and commercial approach, given by the energy transactions between customer and operator. This requires a mathematical arrangement to identify the balance between congestion and the operating cost of a microgrid when the operation scheduling of the system a day ahead of horizon time it is required. Thus, this research is directed to the solution, using heuristic algorithms, since they allow the non-convex constraints of the proposed mathematical problem. The optimization algorithm proposed for the analysis is given by the Multi-Object Particle Swarm Optimization (MOPSO) method, which provides a set of solutions that are known as Optimal Pareto. This algorithm is presented in an IEEE 141-bus system, which consists of a radial distribution network that considers 141 buses used by Matpower; this system was modified and included a series of renewable generation injections, systems that coordinate electric vehicles and battery storage, and the slack node was maintained and assumed to have (traditional generation). In the end it can be shown that the algorithm can provide solutions for network operation planning, test system robustness and verify some contingencies comparatively, always optimizing the balance between congestion and cost.

1. Introduction

In recent years, energy demand has increased significantly at the industrial and residential levels; this has led network operators (NOs) to increase their investments in terms of infrastructure and firm power. This means that the infrastructure should grow according to the needs of the demand. This is restrictive because the electric distribution network was designed based on a projected maximum demand and focused on a radial unidirectional flow, i.e., the energy supplied comes from a source to a load. In summary, this unidirectionality of demand leads the NO to frequently carry out studies to plan the network in order to ensure the continuous supply of energy.
At present, the low costs of the elements used in alternative energies, such as batteries, panels, and others, will make the unidirectionality of demand in the network unnecessary. This change is and will be caused by the installation of small energy sources by the customers in order to meet their energy needs. Given the variations in energy demand over time, there will be times when customers will have surplus energy and it will be profitable for them to sell it to the NO; consequently, energy supply will no longer depend on a single source but on several sources, either in close proximity or from the same customer or load. This immersion of more energy sources in the network is currently known as distributed generation (DG), which permits efficiently managing investments for the NO, meeting energy needs, and also a more active participation of customers by means of incentives at the regulatory, technical, and commercial level. On the technical side, it is important to mention that network connection generates some restrictions due to the technology (wind, solar, storage, etc.), impacts on infrastructure, electrical protections, and network congestion.
The immersion of these generation sources poses various challenges to the NO due to the change in the directionality of current flow, which should consider network congestion caused by voltage variations, overloads, increased reactive power generation, and problems in the delivery of efficient active power [1]. The immersion also manifests itself in the overload of lines and network transformers; this causes high current flows and heating in the distribution network conductors, the impact of which will result in equipment failures or sudden increased load or demand and in an undesired disconnection of service [2].
For congestion in the network, NOs are implementing technologies to better predict energy flow, and there is also more flexible equipment according to the needs of demand [3]. Congestion in a power system occurs because generation is trapped in the network, causing unscheduled load shedding and cascading failures. This is because networks are sometimes obliged to operate above their limits, due to the different restrictions that occur in the dispatch of energy [4].
In order to quantify the congestion in an electrical system, the following references were identified: [5,6,7,8,9,10,11,12,13,14,15,16,17,18]; these studies implemented a congestion index to quantify the congestion in the systems analyzed. The following studies used costs to see the behavior of congestion in the system and the cost necessary to minimize the impact: [19,20,21,22,23,24].
In real-time operation, some practical methods have also been implemented, such as generation rescheduling, load shedding, load elimination, flexible alternating current transmission system (FACTS), and connection of storage systems. These methods involve large additional costs, as incentives should be created among generation and distribution companies to modify their preconceived schedules.
In order to optimize the operation and planning of distribution networks, it is necessary to carry out theoretical and forecast analyses aimed at making the best decisions, as well as to meet the real time operation, so that the network can be reliable and harmonized [2,5,6]. Approaches should lead the NO and the customer to optimal dispatch so as to minimize network congestion. For example, the different strategies for network congestion control defined by the actors include optimal power flow, nodal pricing, and structuring of contracts between the NO and the customer [2].
Optimal dispatch resulting from the analysis of several theoretical approaches includes genetic algorithms, numerical simulations, and heuristic optimization, among others. For any approach it is important to mention that there is a common and natural constraint: most radial-topology distribution networks have a high R/X ratio that affects the analysis of power flows due to their nonlinearity in the equations.
The results obtained from each formulation proposed lead to a more efficient way to decongest the network, to boost the electricity market, to increase the reliability of the network, to make investments, and other advantages.
To address the issue of network congestion is of great importance, since it is an essential factor to make the operation more effective and to measure the impact on the operation with the implementation of these new generation agents.
The proposal of this article aims to provide a clearer vision to NOs regarding the immersion of renewable sources and their effect on the network when congestion and operation costs are considered. The terms for this proposal arise from the current energy matrices of countries and the new changes in the operation of the NOs.

2. Problem Formulation

The main objective of this study is to propose a methodology for programming the operation of a test microgrid composed of renewable energies, energy storage, and electric vehicles. This study includes the minimization of congestion and operation costs by using heuristic optimization and by taking into account the own restrictions of the system.

2.1. Objective 1: Minimize Congestion

Based on the references presented in the introduction, the mathematical formulation that can represent this index is as follows:
C I j = ( S i S i m a x ) 2 / S i m a x ,     C I = j = 1 24 C I j 24 ,   w h e n   S i > S i m a x
where
S i is the MVA flow on line i in hour j
S i m a x is the MVA capacity of line i in hour j
The mathematical formulation described in Equation (1), and used in [7,10,14,16], was selected to carry out this study because it is not very complex, but is efficient and fast to implement and provides reliable results that will be discussed later. In addition, its congestion results are similar to those of the indicators analyzed in other studies. This is the first objective function selected to determine the level of congestion in the proposed problem.

2.2. Operation Costs of a Microgrid (Objective Function 2 of the Problem to Be Solved)

This section is based on the formulation developed in the study in [25]. When modeling a microgrid, the associated costs defined by the equipment (or sources) interacting with the system should be considered, in addition to the technical aspects. This article seeks to optimize the costs associated with the integration of alternative sources, such as solar panels, batteries, and vehicles, among others. The cost associated with each type of source varies according to its technology, and this generates a cost function. As can be seen, cost optimization will result in a more efficient operation of the system.
The costs or cost function that define the operation of the microgrid (CO) will be structured by the following generations costs: traditional generation F 1 ( x ) , through electric mobility F 2 ( x ) , battery storage F 3 ( x ) , and uncertainty F 4 ( x ) ; these are represented in (2).
C O = F 1 ( x ) + F 2 ( x ) + F 3 ( x ) + F 4 ( x )

2.2.1. Cost of Conventional Energy F1(x)

The inclusion of energy generation in the microgrid through fossil sources, such as diesel or gasoline, is a backup instrument when there are energy deficiencies in the network or demand from other sources such as the traditional one or renewable sources. To define the cost associated with this type of source, the generalized function in [26,27,28] is used, shown in Equation (3).
C i ( P s , i ) = α i + β i P s , i + γ P s , i 2

2.2.2. Cost of the Electric Vehicles F2(x)

In this section, plug-in electric vehicles (PEVs) are considered as part of the microgrid and have a parking aggregator (parking decks). Based on this consideration, vehicles are grouped so the dispatch occurs at the best time, defined by a cost-benefit analysis [29,30,31]. The main objective is to plan the charge of vehicles at the time of the day when the cost is lowest or optimal. If the PEV has not consumed all the energy stored, this excess can be returned to the batteries in the highest cost time slot [29].
The equation describing the planning, loading, operation, and transfer is based on [29,30,32]. The first step is defined through the aggregators when they calculate the maximum energy dispatch for each vehicle (PEV); the batteries are assumed to have charged all day. The start of charge is defined as S O C n i D , a and represented in Equation (4):
S O C n i D , a = min ( S O C n i D , S O C n i A + ( H n i · ρ · P m a x · t B n i ) ,   n i   N i ,   i     I
PEVs have both upper and lower limits defined as [ t k , t k + H i 1 ] and the Equations (5) and (6). This group of equations helps define the expressions that denote the limits and the minimum energy that it can have in the period [k + j]. In the range, energy should be at least ρ · P m a x · t and lower than the following interval [k + j + 1]. As it is a charging process, the energy obtained is incremental [29,32].
e n i m a x ( t k + j ) = e n i m i n ( t k + j ) = S O C n i D , a B n i ,   j = H n i ,     , H i ,   n i   N i ,   i     I
e n i m i n ( t k + j ) = max ( e n i m i n ( t k + j + 1 ) ρ · P m a x · t ,   S O C n i A · B n i ) ,     j = 0 , , H n i 1 , n i   N i ,        i     I
e n i m a x ( t k ) = S O C n i A · B n i ,     n i   N i ,     i     I
e n i m a x ( t k + j ) = min ( e n i m i n ( t k + j 1 ) ρ · P m a x · t ,   S O C n i D , a · B n i ) ,     j = 0 , , H n i 1 ,   n i   N i ,           i     I
Vehicles (PEVs) have energy and power limits, determined by Equations (7) and (8). Naturally, the batteries have a limit in connection and load, described by Equations (9) and (10).
P n i max ( t k + j ) = P m a x ,     j = 0 , , H n i 1 ,   n i       N i ,   i   I
P n i max ( t k + j ) = 0 ,     j = H n i , , H i 1 ,   ( W h e n   H n i < H i ) ,   n i       N i ,   i   I
These equations define the energy and power limits for vehicles, in addition to Equations (11) and (12). Equation (13) defines the power limits of PEVs.
E i min ( t k + j ) = n i   N i e n i min ( t k + j ) ,   j = 0 , , H i ,   i   I
E i max ( t k + j ) = n i   N i e n i max ( t k + j ) ,   j = 0 , , H i ,   i   I  
P i max ( t k + j ) = min ( n i     N i P n i max ( t k + j ) ,   A i ξ i ( t k + j ) λ ) ,   j = 0 , , H i 1 ,   i
The cost associated with the use of PEVs is determined through a function F 2 ( x ) defined in Equation (14). Equations (15)–(18) determine the restrictions.
min j ( t k ) = F 2 ( x ) = i I j = 0 H 1 c ( t k + j ) · P i p r e f ( t k + j ) · t + μ j = 0 H 1 θ ( t )   k j = 0 H 1 ( H j ) P i p r e f ( t k + j )
s . t   P i p r e f ( t k + j ) P i m a x ( t k + j ) ,   j = 0 , , H i 1   ,   i I
P i p r e f ( t k + j ) = 0 ,   j = H i , ,   H   ( S i   a p l i c a ) ,   i   I
E i m i n ( t k + j ) τ = 0 J 1 ρ · P i p r e f ( t k + τ ) · t + E i m a x ( t k ) E i m a x ( t k + j ) ,   J = 1 , , H i ,   i   I
i I P i p r e f ( t k + j ) A T ( t k + j ) L b ( t k + j ) + θ ( t k + j ) ,   j = 0 , , H 1  

2.2.3. Cost of Operation for Storage F3(x)

A cost equal to that generated by renewable generation equipment C b l is assumed in order to determine the storage cost (batteries) for this study [32,33,34,35,36,37]. Equation (19) determines this cost:
F 3 ( x ) = C b l = L l o s s · C i n i t b a t
where L l o s s refers to the useful life of the battery and C i n i t b a t refers to the investment cost for the acquisition of batteries. The base case consists of the power being negative when the battery is charging and being positive when the battery is delivering power [32].
Due to the nature of batteries, there is a loss of useful life, represented as L l o s s . Equation (20) determines the cost associated with this loss; A c is the cumulative performance with each unit [Ah] effective in an interval of time and A t o t a l   is the cumulative performance with [Ah] effective in the life cycle [36].
L l o s s = A c A t o t a l
The variables that make up A c are the state of charge (SOC) and the actual performance Ah. Real Ac is represented in Equation (21):
A c = λ S O C A c
The parameter λ S O C is an effective weighted factor determined by Equation (22):
λ S O C = k * S O C + d
The total cost will have the constraints established by the minimum and maximum state of charge of the batteries determined by (23). Equation (24) refers to the maximum power transfers at maximum discharge.
S O C m i n S O C S O C m a x
P C a r g a m a x S O C S O C D e s c a r g a m a x

2.2.4. Cost of Operation Photovoltaic Generator and Wind Power Generator F4(x)

To establish the total cost of solar power generation ( C P V ) in kW, two functions are used, as shown in Equation (25): the first function refers to the cost when the generator C P V , u , i is underestimated, and the second function, defined as C P V , o , i , refers to the opposite effect, i.e., when it is overestimated. The behavior of the two functions depends on both the power programmed in the photovoltaic power station ( W P V , s , i ) and the defined available power ( W P V , i ) .
C P V = i = 1 N P V C P V , u , i ( W P V , s , i , W P V , i ) + i = 1 N P V C P V , o , i ( W P V , s , i , W P V , i )
The costs underestimating the generator refer to the value that the microgrid does not receive when those kW are not sold as a traditional energy source [32,38]. The availability of solar energy power generates a variation in the cost with a probabilistic behavior due to the nature of the source itself, i.e., due to the variation of radiation [25,32,38].
Overestimation occurs when the photovoltaic generator cannot meet the expected power value and has to incur an additional cost as it has to resort to another generator [32,38].
The power obtained through wind energy also has probabilistic variability and causes overestimation or underestimation as occurs with solar energy [26,32,38]. Based on these two concepts, the total cost for this source can be estimated, as shown in (26).
C w = i = 1 N w C w , u , i ( W w , s , i , W w , i ) + i = 1 N w C w , u , i ( W w , s , i , W w , i )
Wind sources have the same underestimated behavior mentioned in the section on solar source: the microgrid operator does not need to incur a cost thanks to the dispatch of energy from a wind generator, while the overestimated cost refers to the operator’s need to resort to other generators to meet the agreed demand.
Finally, the associated costs in F 4 ( x ) are denoted as the uncertainty probability cost of renewable agents; this is expressed by (25).
F 4 ( x ) = C P V + C w

3. Optimization Methodology

A multi-objective problem is described as a vector of decision variables that meets constraints and optimizes a vector function whose elements represent the objective functions. These functions form a mathematical description of performance criteria that are often in conflict with each other. Therefore, the term “optimize” involves finding a solution that gives the values of all acceptable objective functions to the decision maker [39]. This type of problem can also maximize or minimize n functions or perform a combination of both together with a set of constraints of either equality or inequality.
Based on the previous definition taken from [40], a multi-objective problem is considered to have a set of solutions and not a single answer. This set of solutions is verified through Pareto optimal, which will be defined below.
Generally, most problems in engineering today involve the evaluation of several conflicting objectives, and feasible and optimal solutions are necessary to solve the proposed objectives.
Heuristic, metaheuristic, and genetic algorithms are widely used to develop multi-objective problems by using a good convergence speed to obtain the answer of all the possible spaces for the solution.

Multi-Objective Particle Optimization Algorithm

The Multi-Objective Particle Optimization Algorithm (MOPSO) was implemented by J. Moore and R. Chapman. It is a multi-objective optimization algorithm that belongs to evolutionary algorithms, and known to be competitive and efficient thanks to its convergence speed.
Its principle is based on the behavior of birds and a multidimensional search headed in the position taken by each individual. Therefore, each individual will always be affected by the individual with the best behavior, i.e., local or global individuals [41].
Its main parameters include the population to be evaluated and the unique memory used by the individuals to be considered, which is called “repository” [42]. The aim is to obtain a global repository in which each analyzed particle will store their flight experiences in each evaluated cycle [42]. In this way, the algorithm seeks to select the best positions by using a grid.
The grid method is used to establish a coordinate system and also check how many individuals are stored in the repository; the objective functions to be considered are established as the maximum and minimum fitness values of these individuals [41].
Equations (28) and (29) determine the grid limits (maximum and minimum fitness values).
I s u p = f 1 m a x + 0 , 1 * [ f 1 m a x f 1 m i n ] ,   f 2 m a x   + 0 , 1 * [ f 2 m a x f 2 m i n ]
I i n f = f 1 m i n + 0 , 1 * [ f 1 m a x f 1 m i n ] ,   f 2 m i n   + 0 , 1 * [ f 2 m a x f 2 m i n ]
The limits help define the neighborhoods to be considered in the multi-objective problem, which are known as grid index in the development of the problem.
In MOPSO, the identification of the set of solutions obtained in Pareto optimal is relevant to choose the best global particle (gbest). In multi-objective problems, this term may be different and have drawbacks for the selection of this one, so there is not a single solution but a set of solutions that make the solution of the problem possible.
In this algorithm optimal solutions are obtained through a defined search space; in each iteration new positions are found through the following equations [41,42]:
V E L = W . V E L + c 1 * r a n d ( N p ,   n V a r ) . * ( P b e s t i d P O S ) + c 2 * r a n d ( N p ,   n V a r ) . * ( g b e s t i d P O S )
P O S = P O S + V E L
In MOPSO, it is very important to choose the gbest, i.e., the best global particle from the set of non-dominated solutions obtained in Pareto optimal [43].
According to the above, in most cases multi-objective problems are addressed as a single-objective problem, considering the evaluation of solutions one by one (or objective by objective). When using these methods, it is evident that different simulations should be considered in order to solve certain problems. Consequently, addressing these multi-objective problems through genetic algorithms helps consider diverse solutions that are generated in Pareto optimal in a single algorithm: in most cases one solution improves one objective and in parallel worsens the next one.

4. Results

This study was based on the selection of a test system chosen for the validation of the proposed congestion method, which corresponds to a radial distribution system. The case consisting of 141 nodes of Khodr, Olsina, De Jesus, and Yusta from the IEE was selected, corresponding to a portion of the system of the metropolitan area of Caracas (Venezuela); the data associated can be found in [44] (Table 1, Table 2, Table 3 and Table 4). This radial network comprises 141 voltage nodes, 84 load nodes, 1 generator, 3 controlled voltage nodes, and 140 distribution elements (lines).
The base case of the IEEE 141 system was chosen. Some of its parameters were modified, such as the capacities of the lines. Two new generators were also considered, which were located in nodes 109 and 110 with powers of 50 and 10 MW, respectively; these nodes are supposed to have more solar and wind resources. These values were subsequently modified by joining them in the functions used in the algorithm. The application of distributed generators was also considered with the help of the MOPSO algorithm. Changes in some nodes were expected in the real and reactive power demands, given the different types of energies from electric vehicles and battery storage, to verify the proposed method of congestion.
There was generation only in some bars according to the modification made. This was modified to verify the impact of the inclusion of renewable agents on the chosen test network. Some characteristics of the case study are shown below.
Based on the study in [25], the base case was chosen to check the congestion index of the system so as to weaken the original network, which is originally very robust.
The MOPSO optimization algorithm was adjusted and applied to the formulation of the problem, whose parameters are shown below:
With respect to the values obtained shown in Figure 1, the optimal solution can be discarded when the congestion value is 8.28%, since it means that the lines of the test system will be overloaded. This leads to its possible exclusion, in spite of its cheaper operation cost, which may cause instability, generate load shedding, and result in economic and social damage.
Figure 1 shows that, despite the advantageous solution to congestion (0.6570), it is not necessarily so in the case of network operation cost (12.887 × 10⁴).
Consequently, the set of optimal solutions ensuring the system’s safe operation should range between 0.65% and 1.03% of congestion. This prevents any failure from leading the study system to a blackout, in order to avoid any damage. In this case, the operator will consider the scenarios with a minimal congestion index to ensure a robust system (Figure 2):
Figure 2 shows that maintaining a low congestion level involves a significant increase in the operation cost. The study therefore aims to optimize the operation cost corresponding to the decrease of network congestion, as described below.

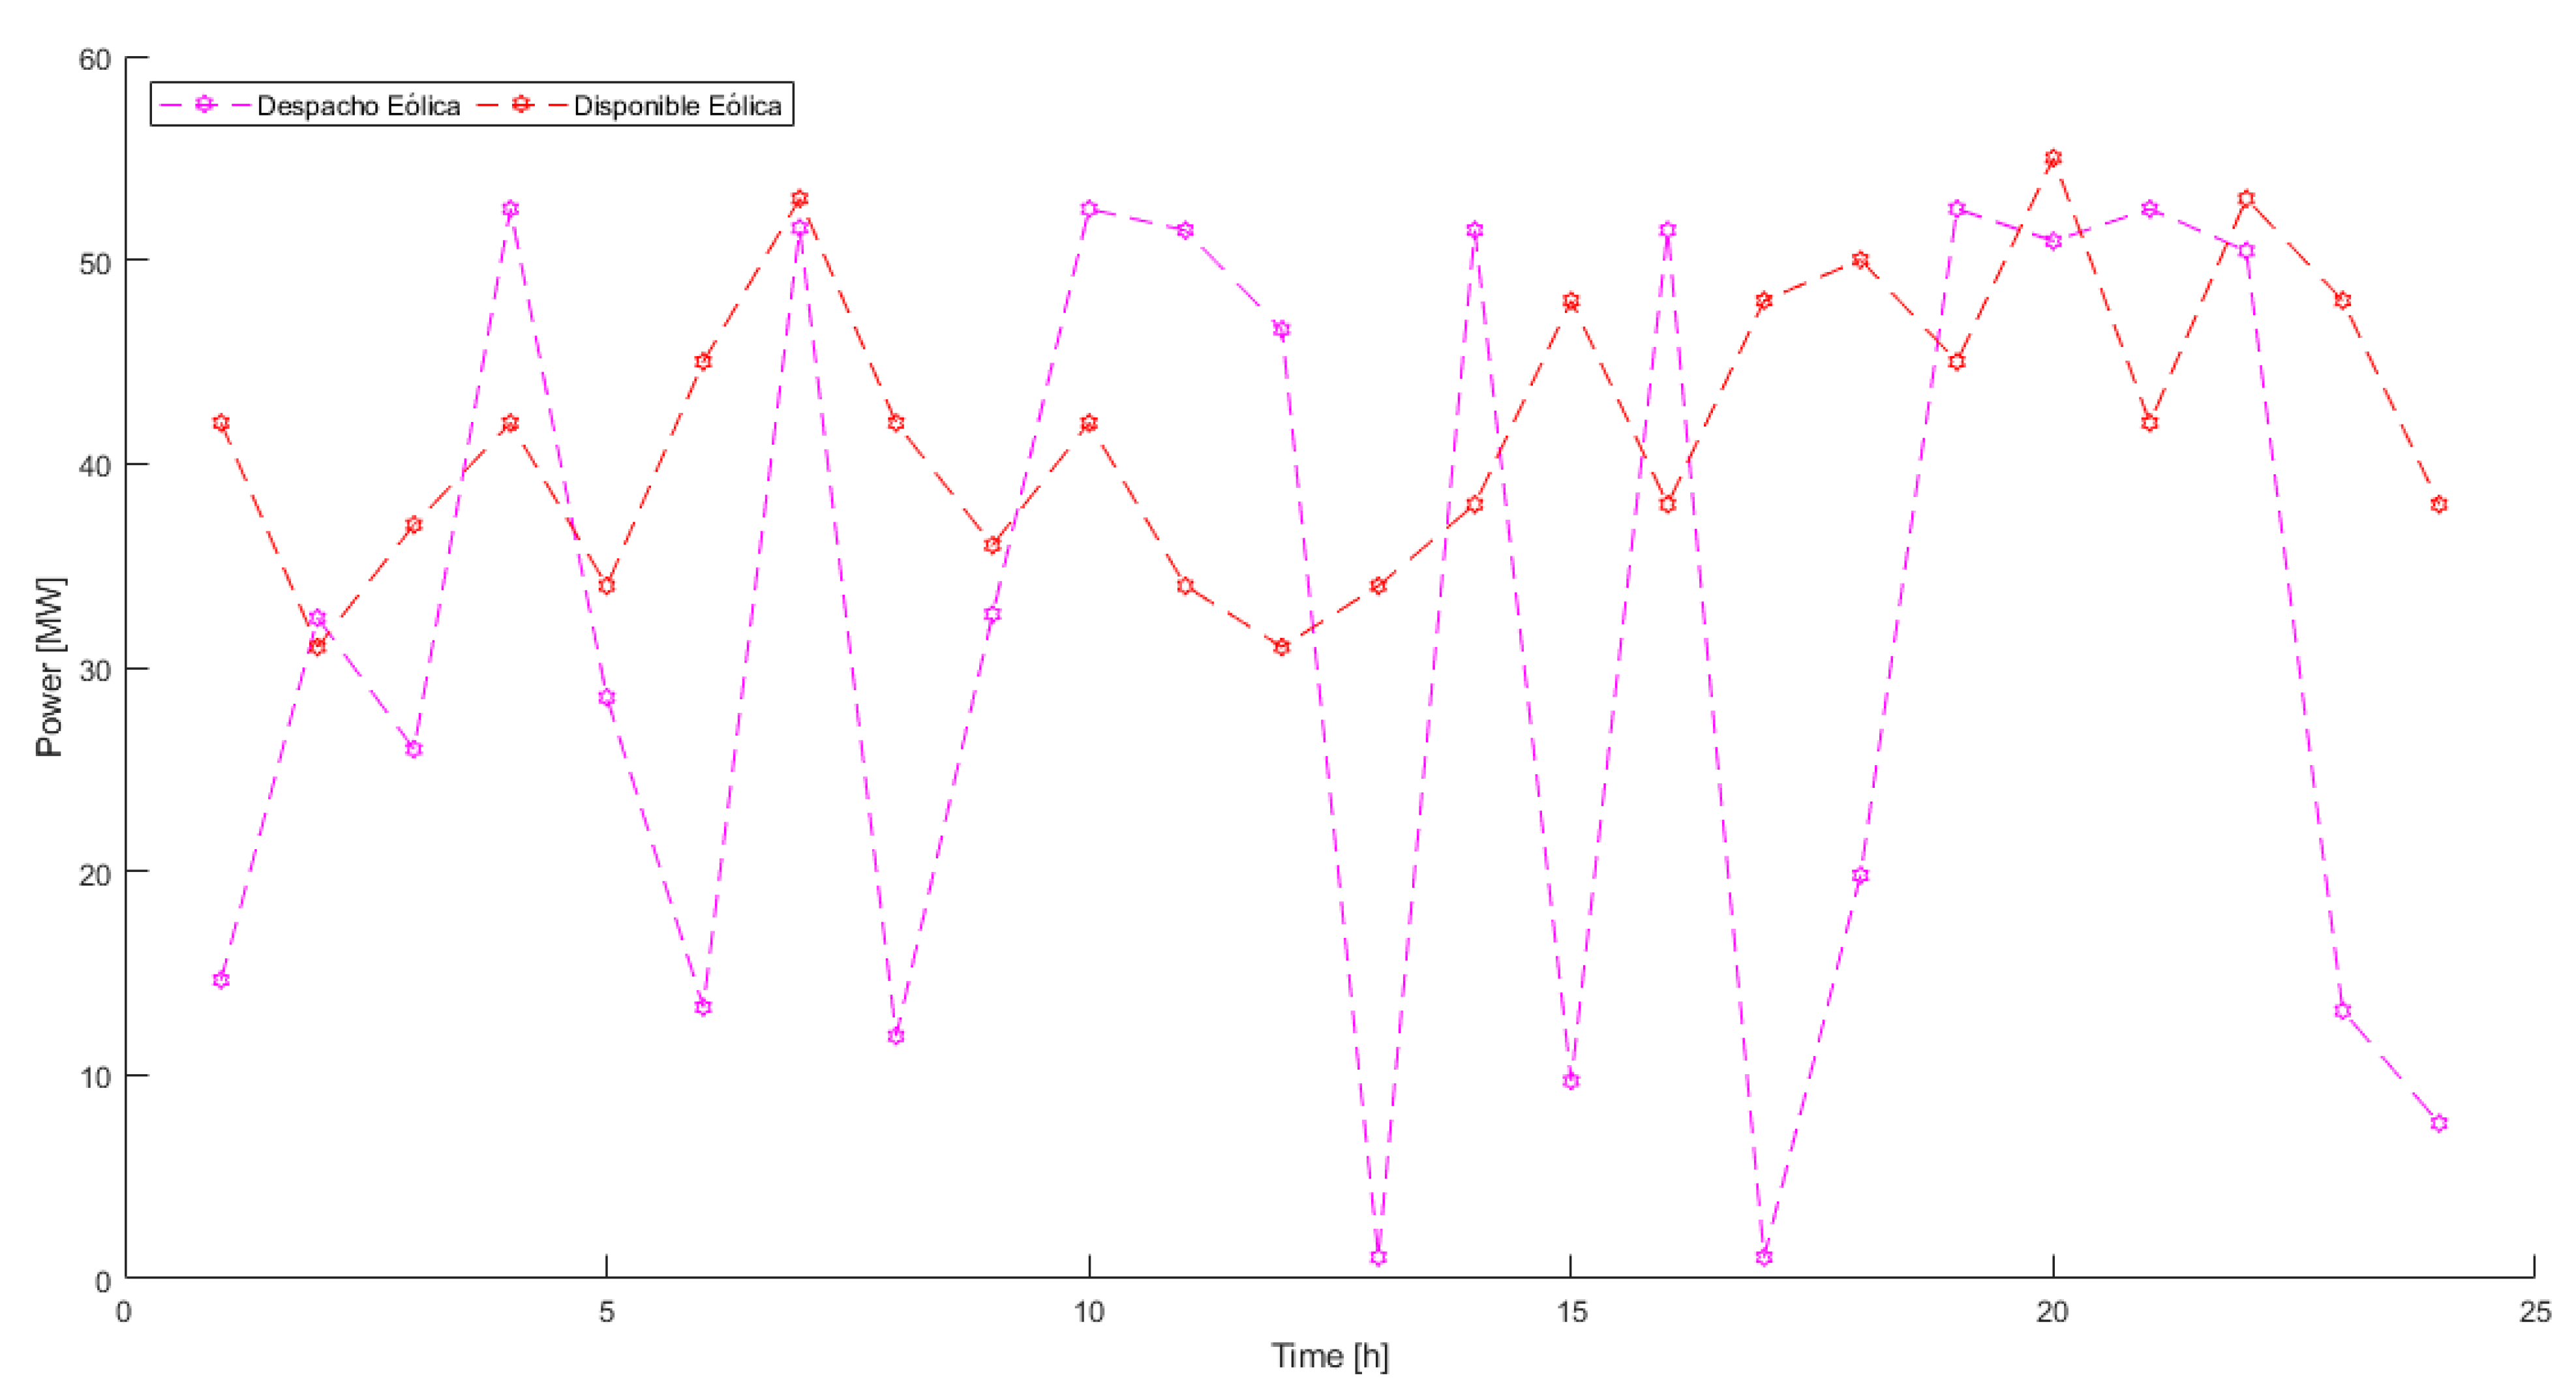
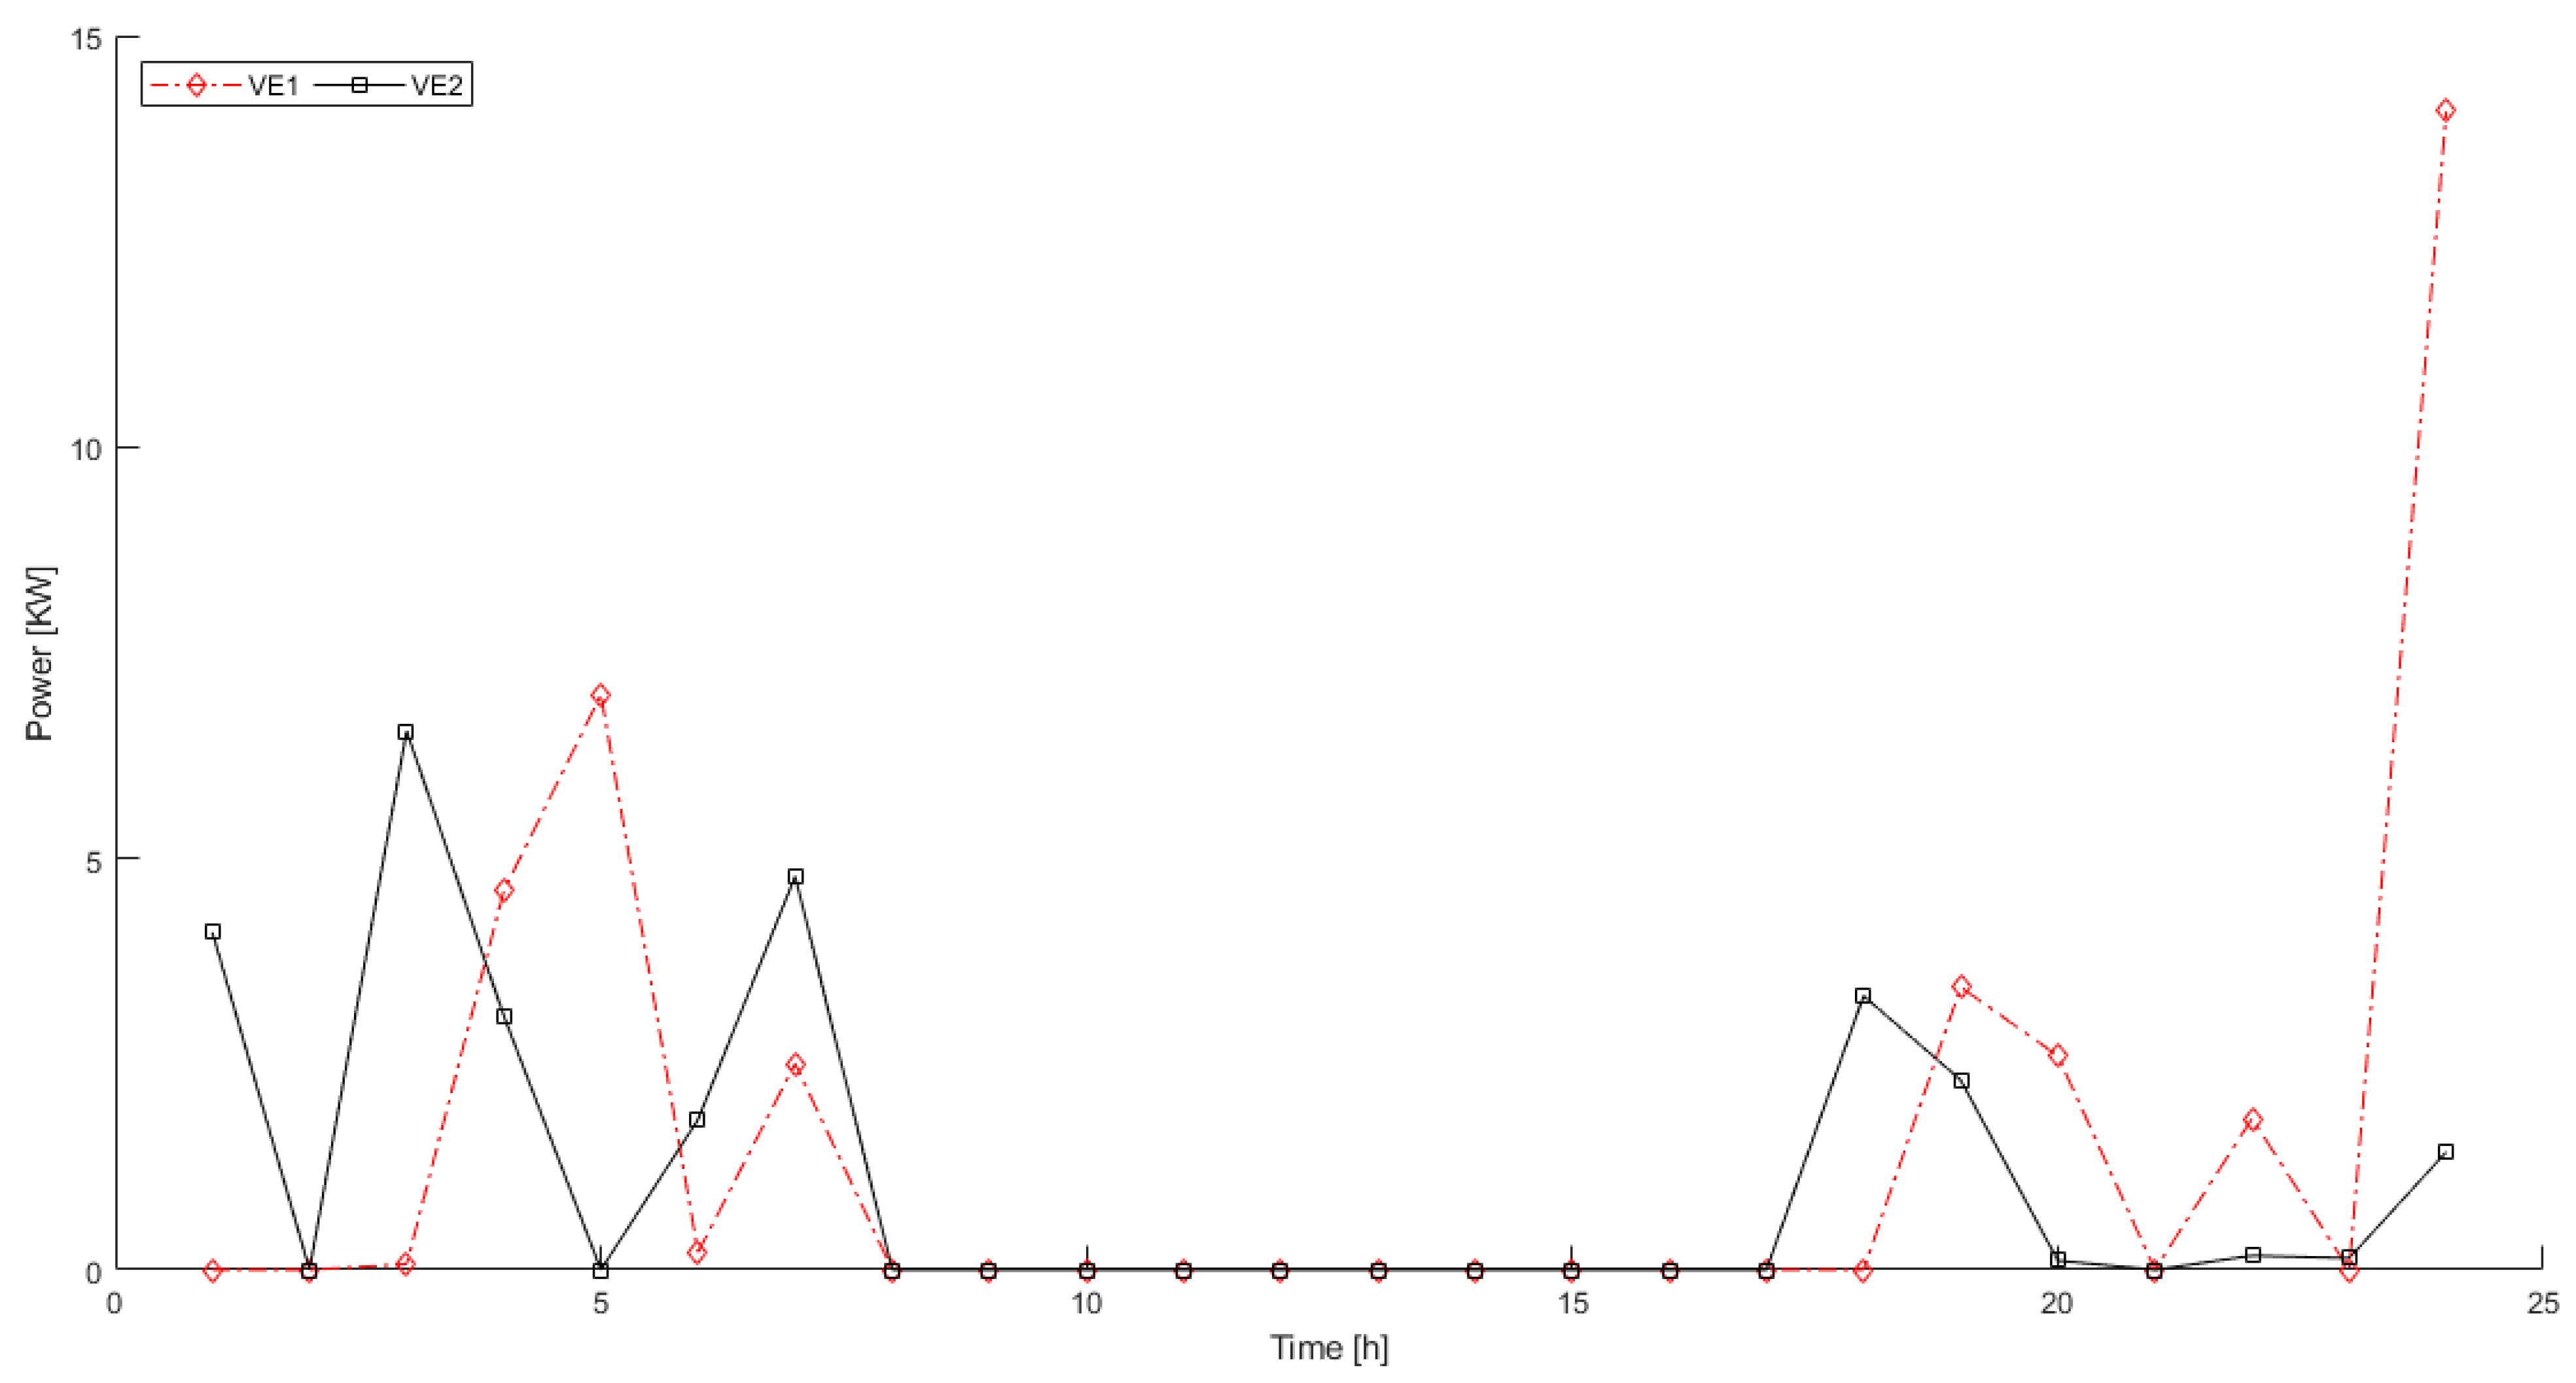
4.1. Variation of the Decision Variables at the Pareto Optimal Points

Based on the results obtained, Figure 3 shows the dispatch required to reach the minimal operation cost with this type of resource, in which the storage system has three charging cycles. During the storage system’s charging times through materials, the traditional electric generation dispatches energy to the load and allows the storage system to recharge (Figure 4).
The dispatch of solar energy takes place only during daylight hours: this energy source is neither available before dawn nor after dusk. Consequently, Figure 4 shows that the energy dispatch is lower between 11:00 a.m. and 3:00 p.m. than the available energy; likewise, from 12:00 to 2:00 p.m., a portion of energy is stored. In doing so, it is possible to supply more energy than that available when necessary or to dispatch it in the evening when the operation cost is more profitable.
Similarly, Figure 5 shows that the energy dispatch surpassed the energy available in an 8 h period, and in the remaining 16 h of the day that amount of energy remained stored to be dispatched at convenient times, based on the costs of underestimation and overestimation. The actual dispatch performed during the daytime comprises a significant increase regarding the wind resource, given the operation costs involved when this sort of energy is dispatched to the grid.
Finally, Figure 6 shows that the highest power occurs during early morning hours; aggregator 2 presents a high power peak at around midnight.

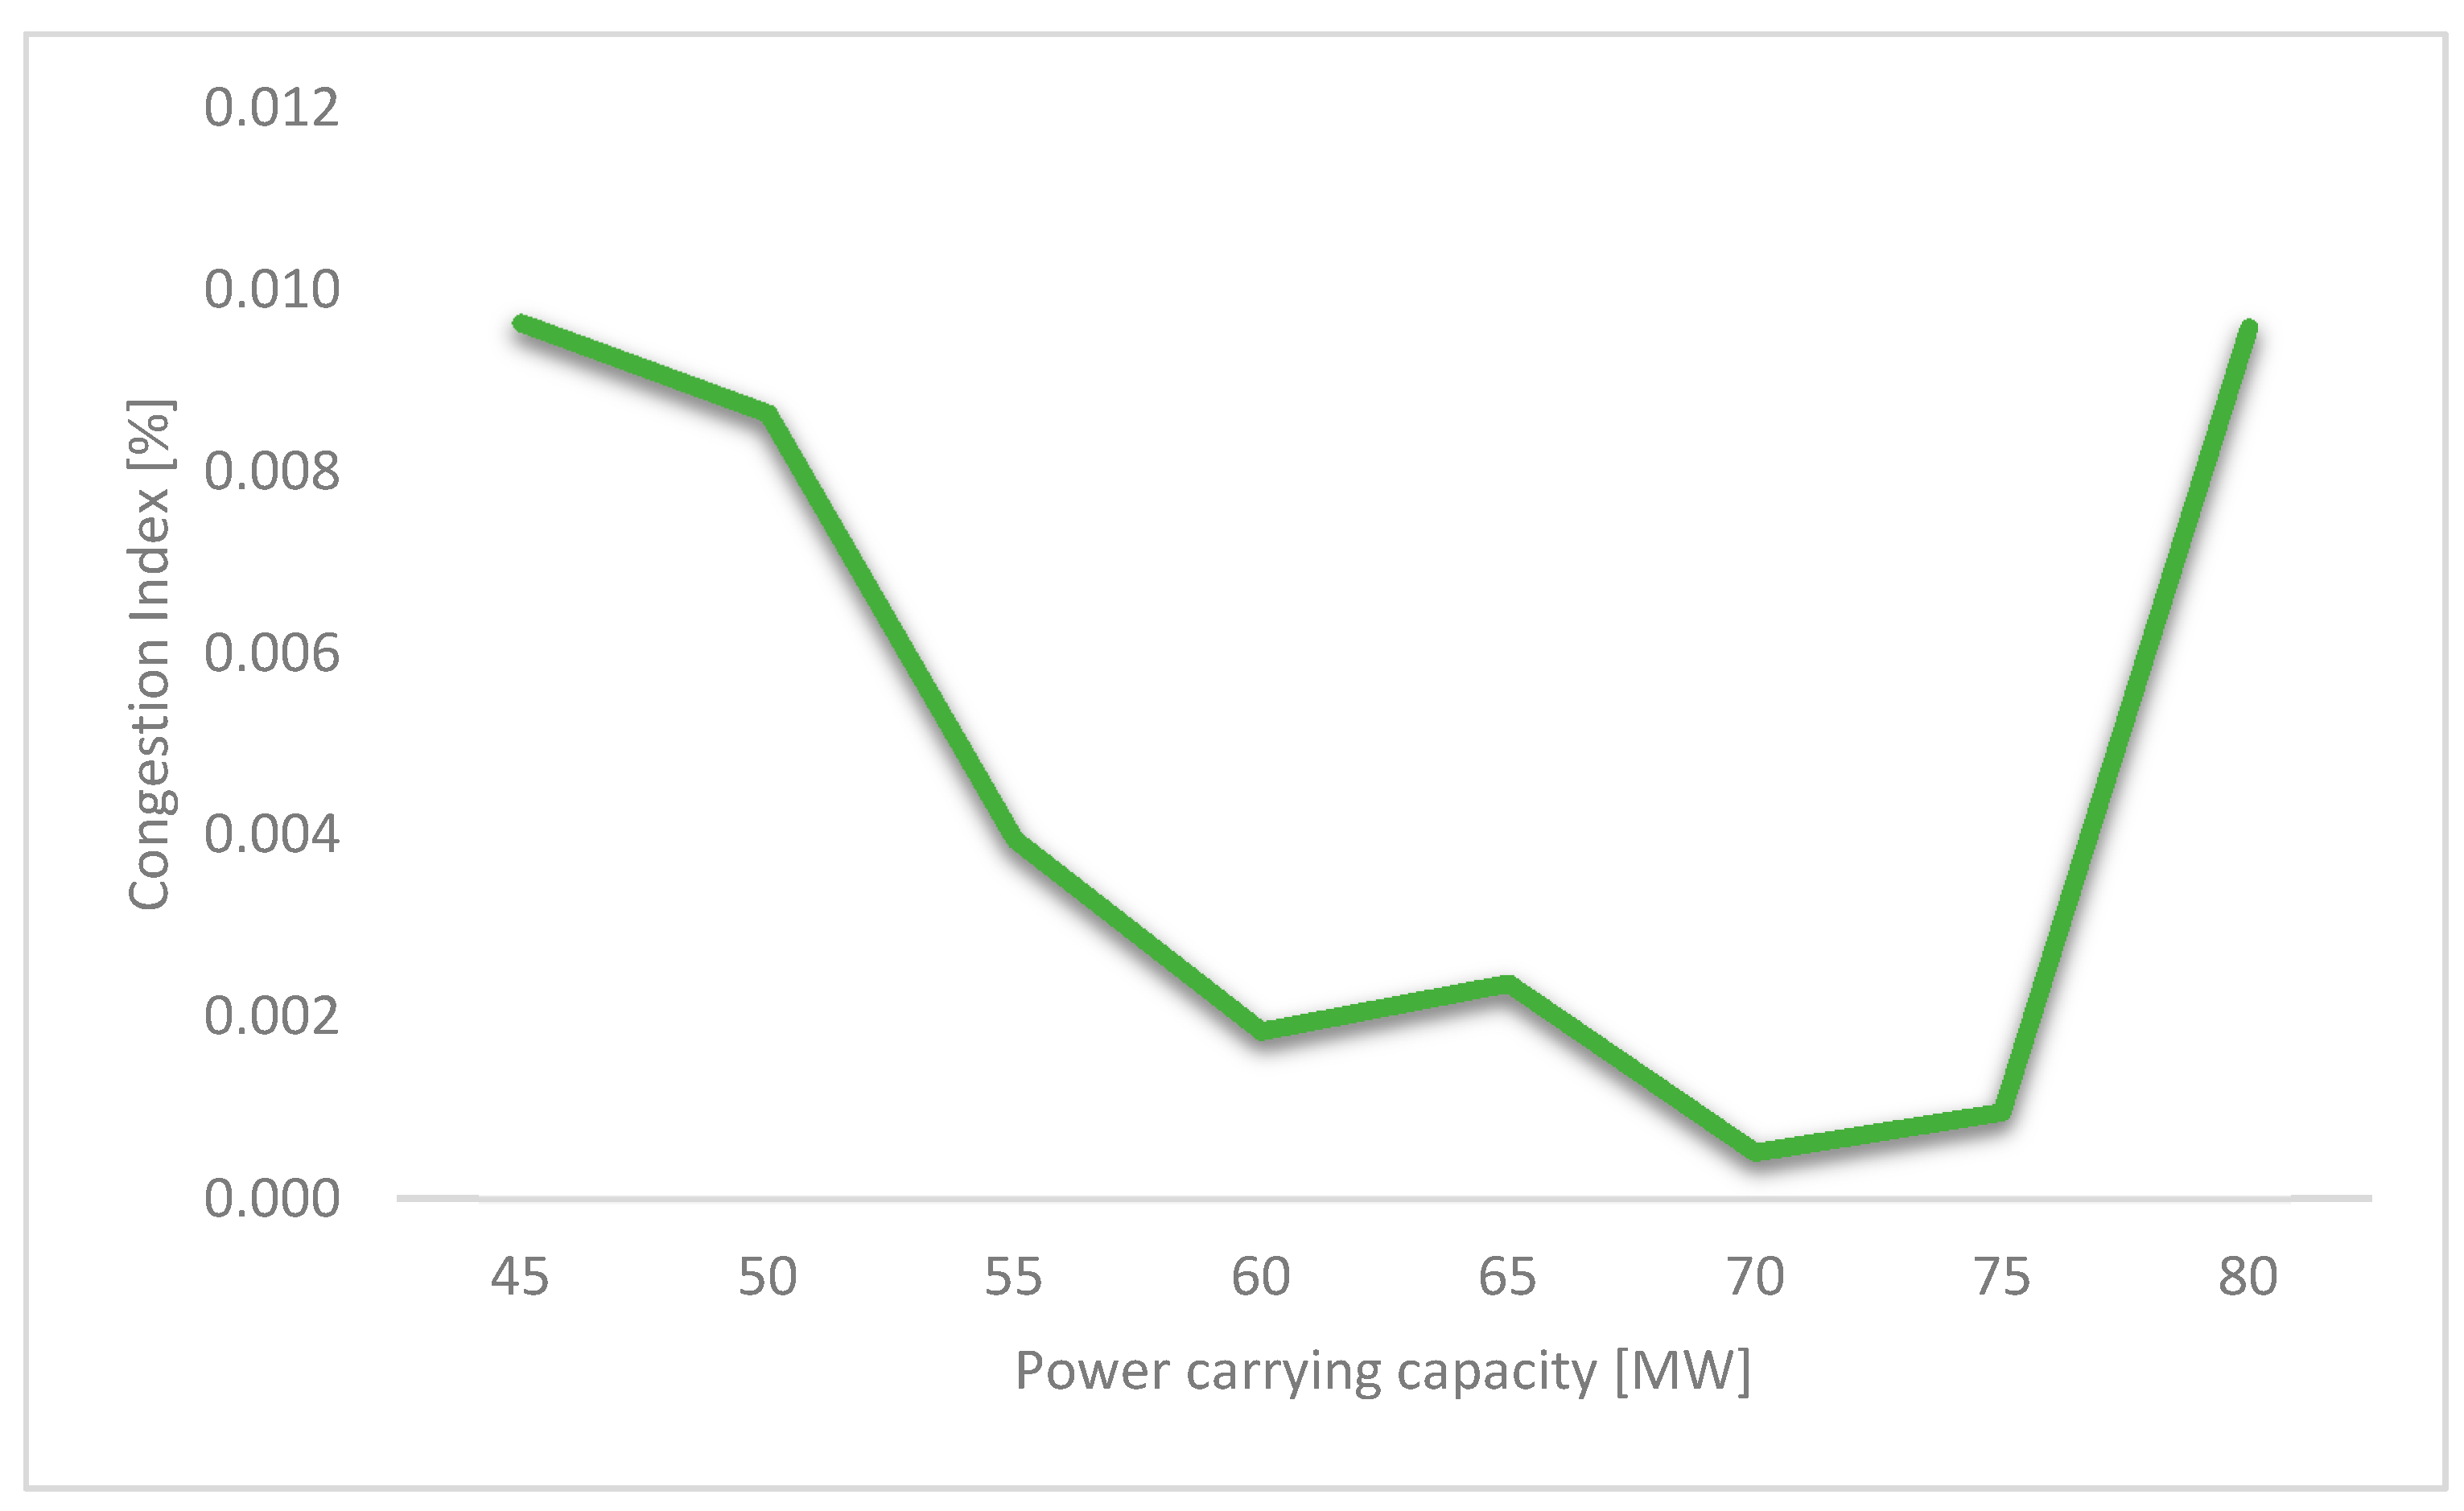
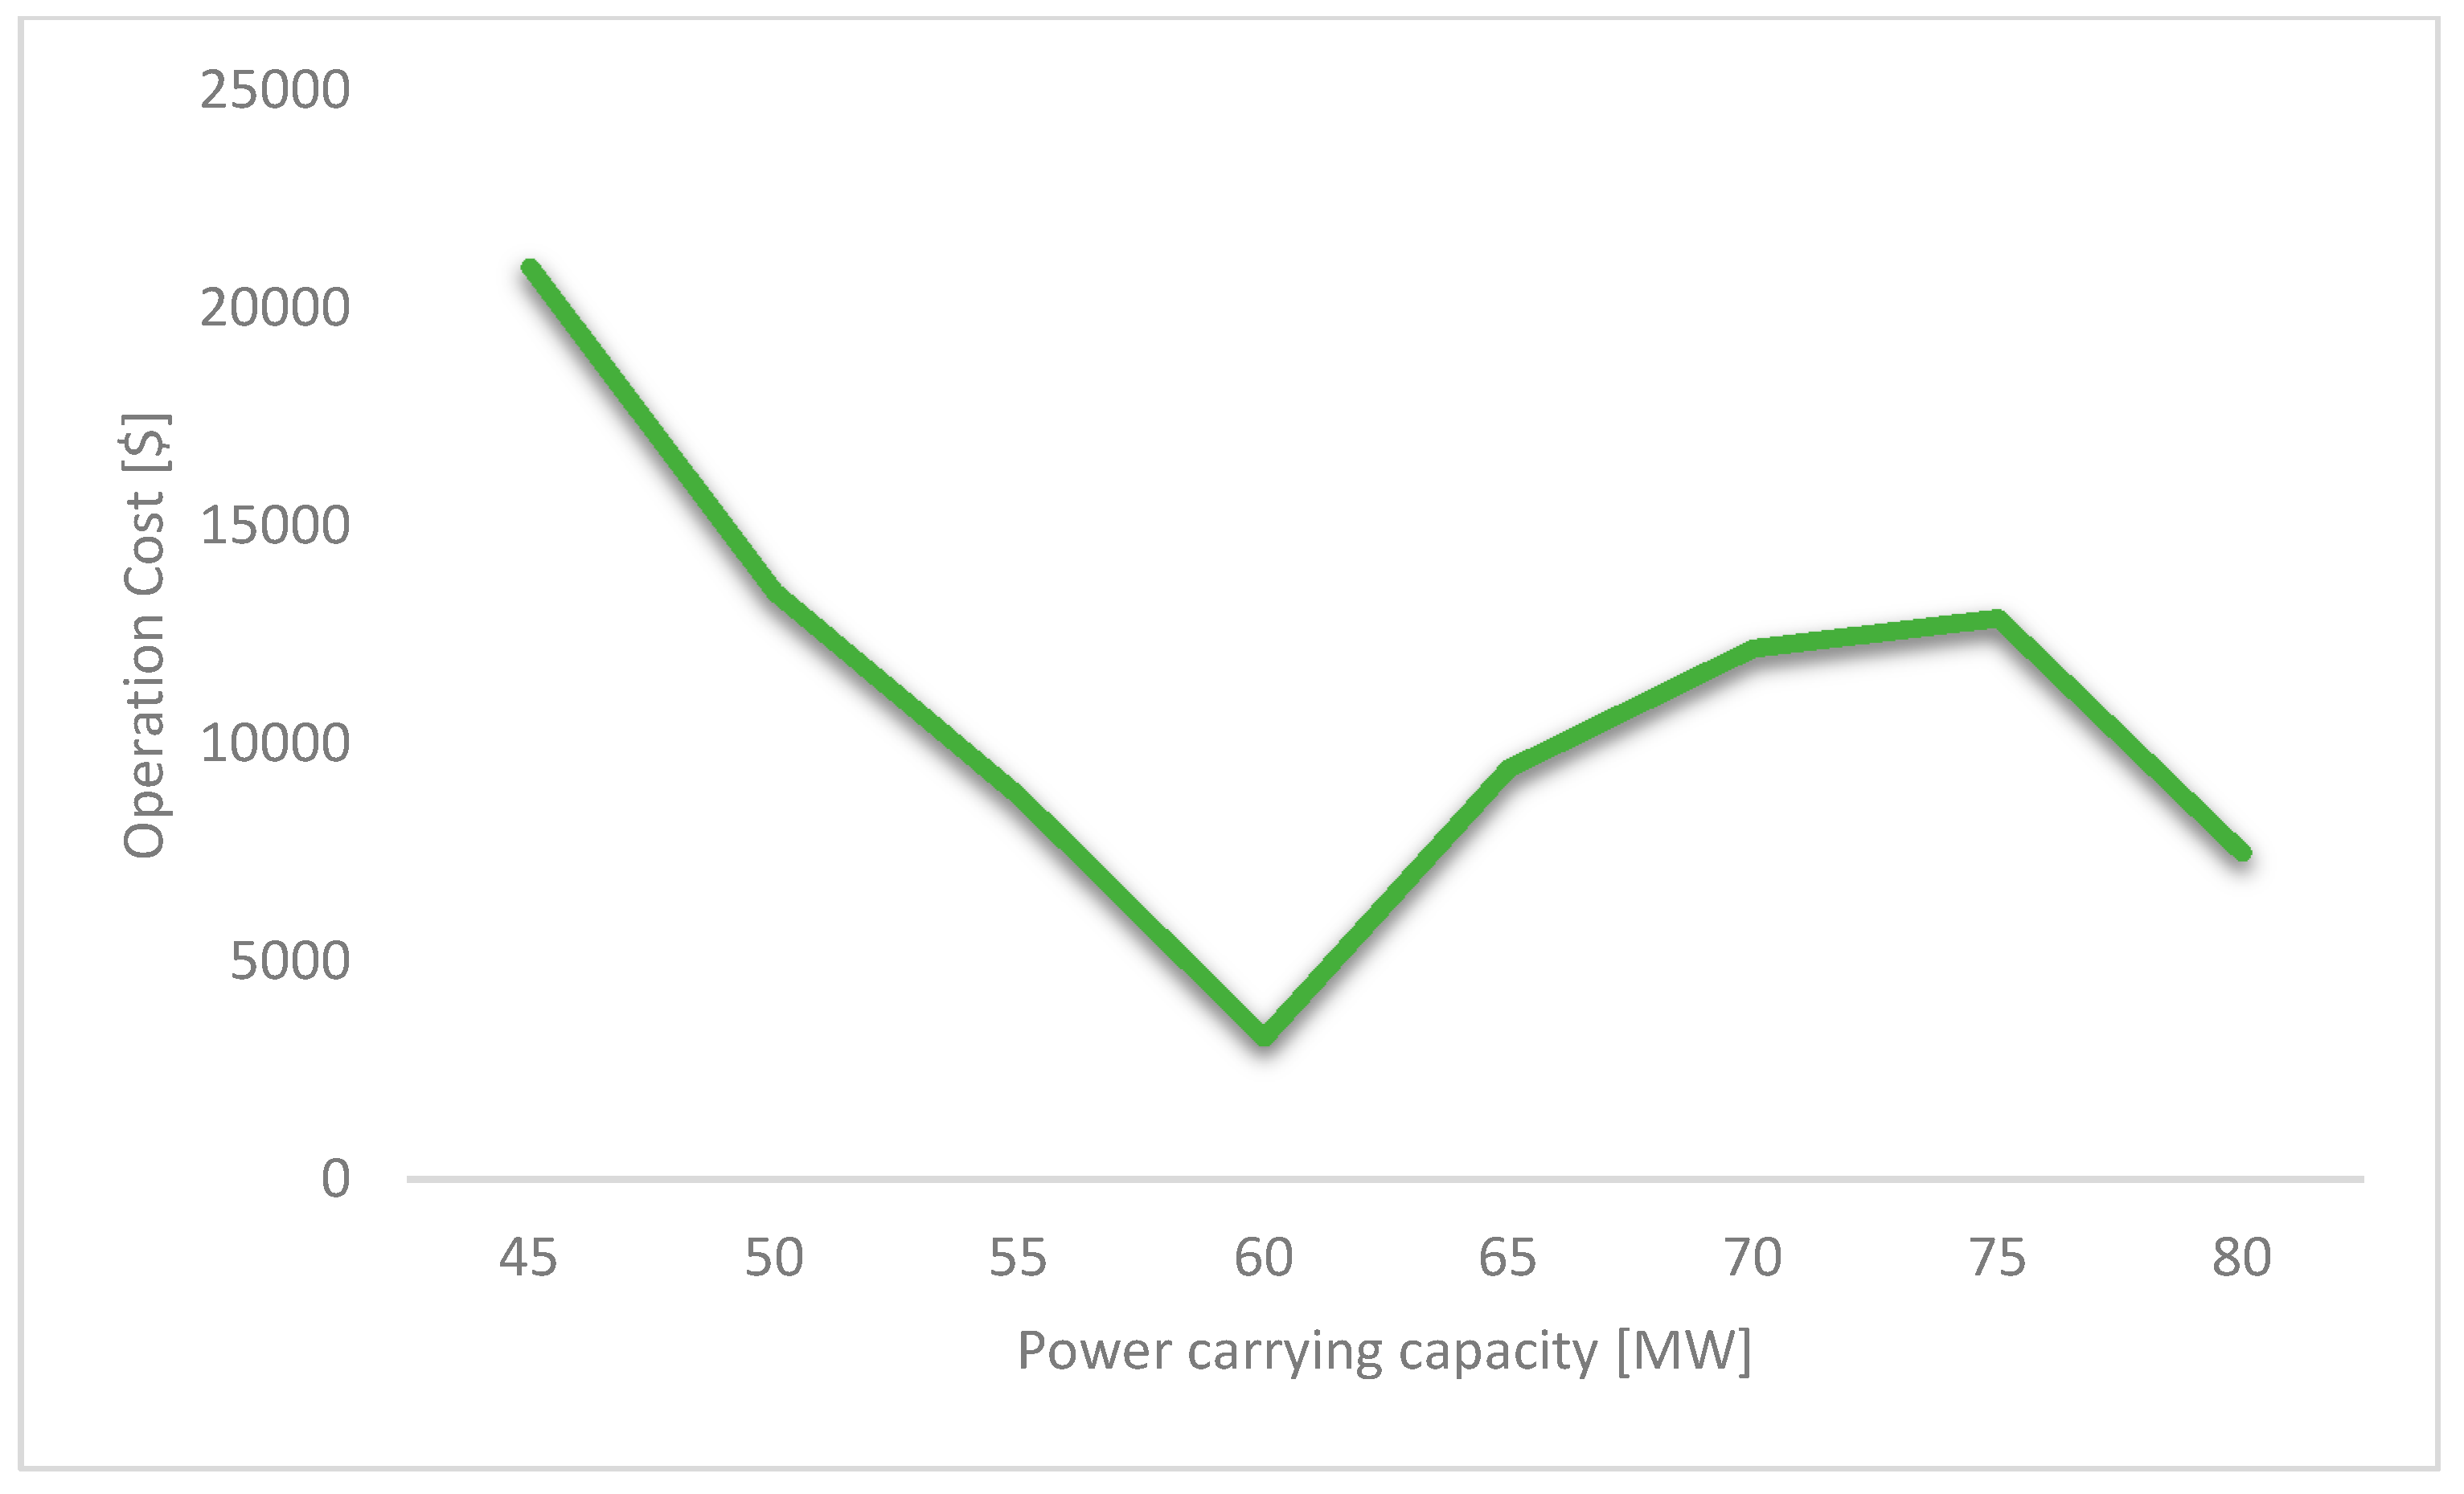
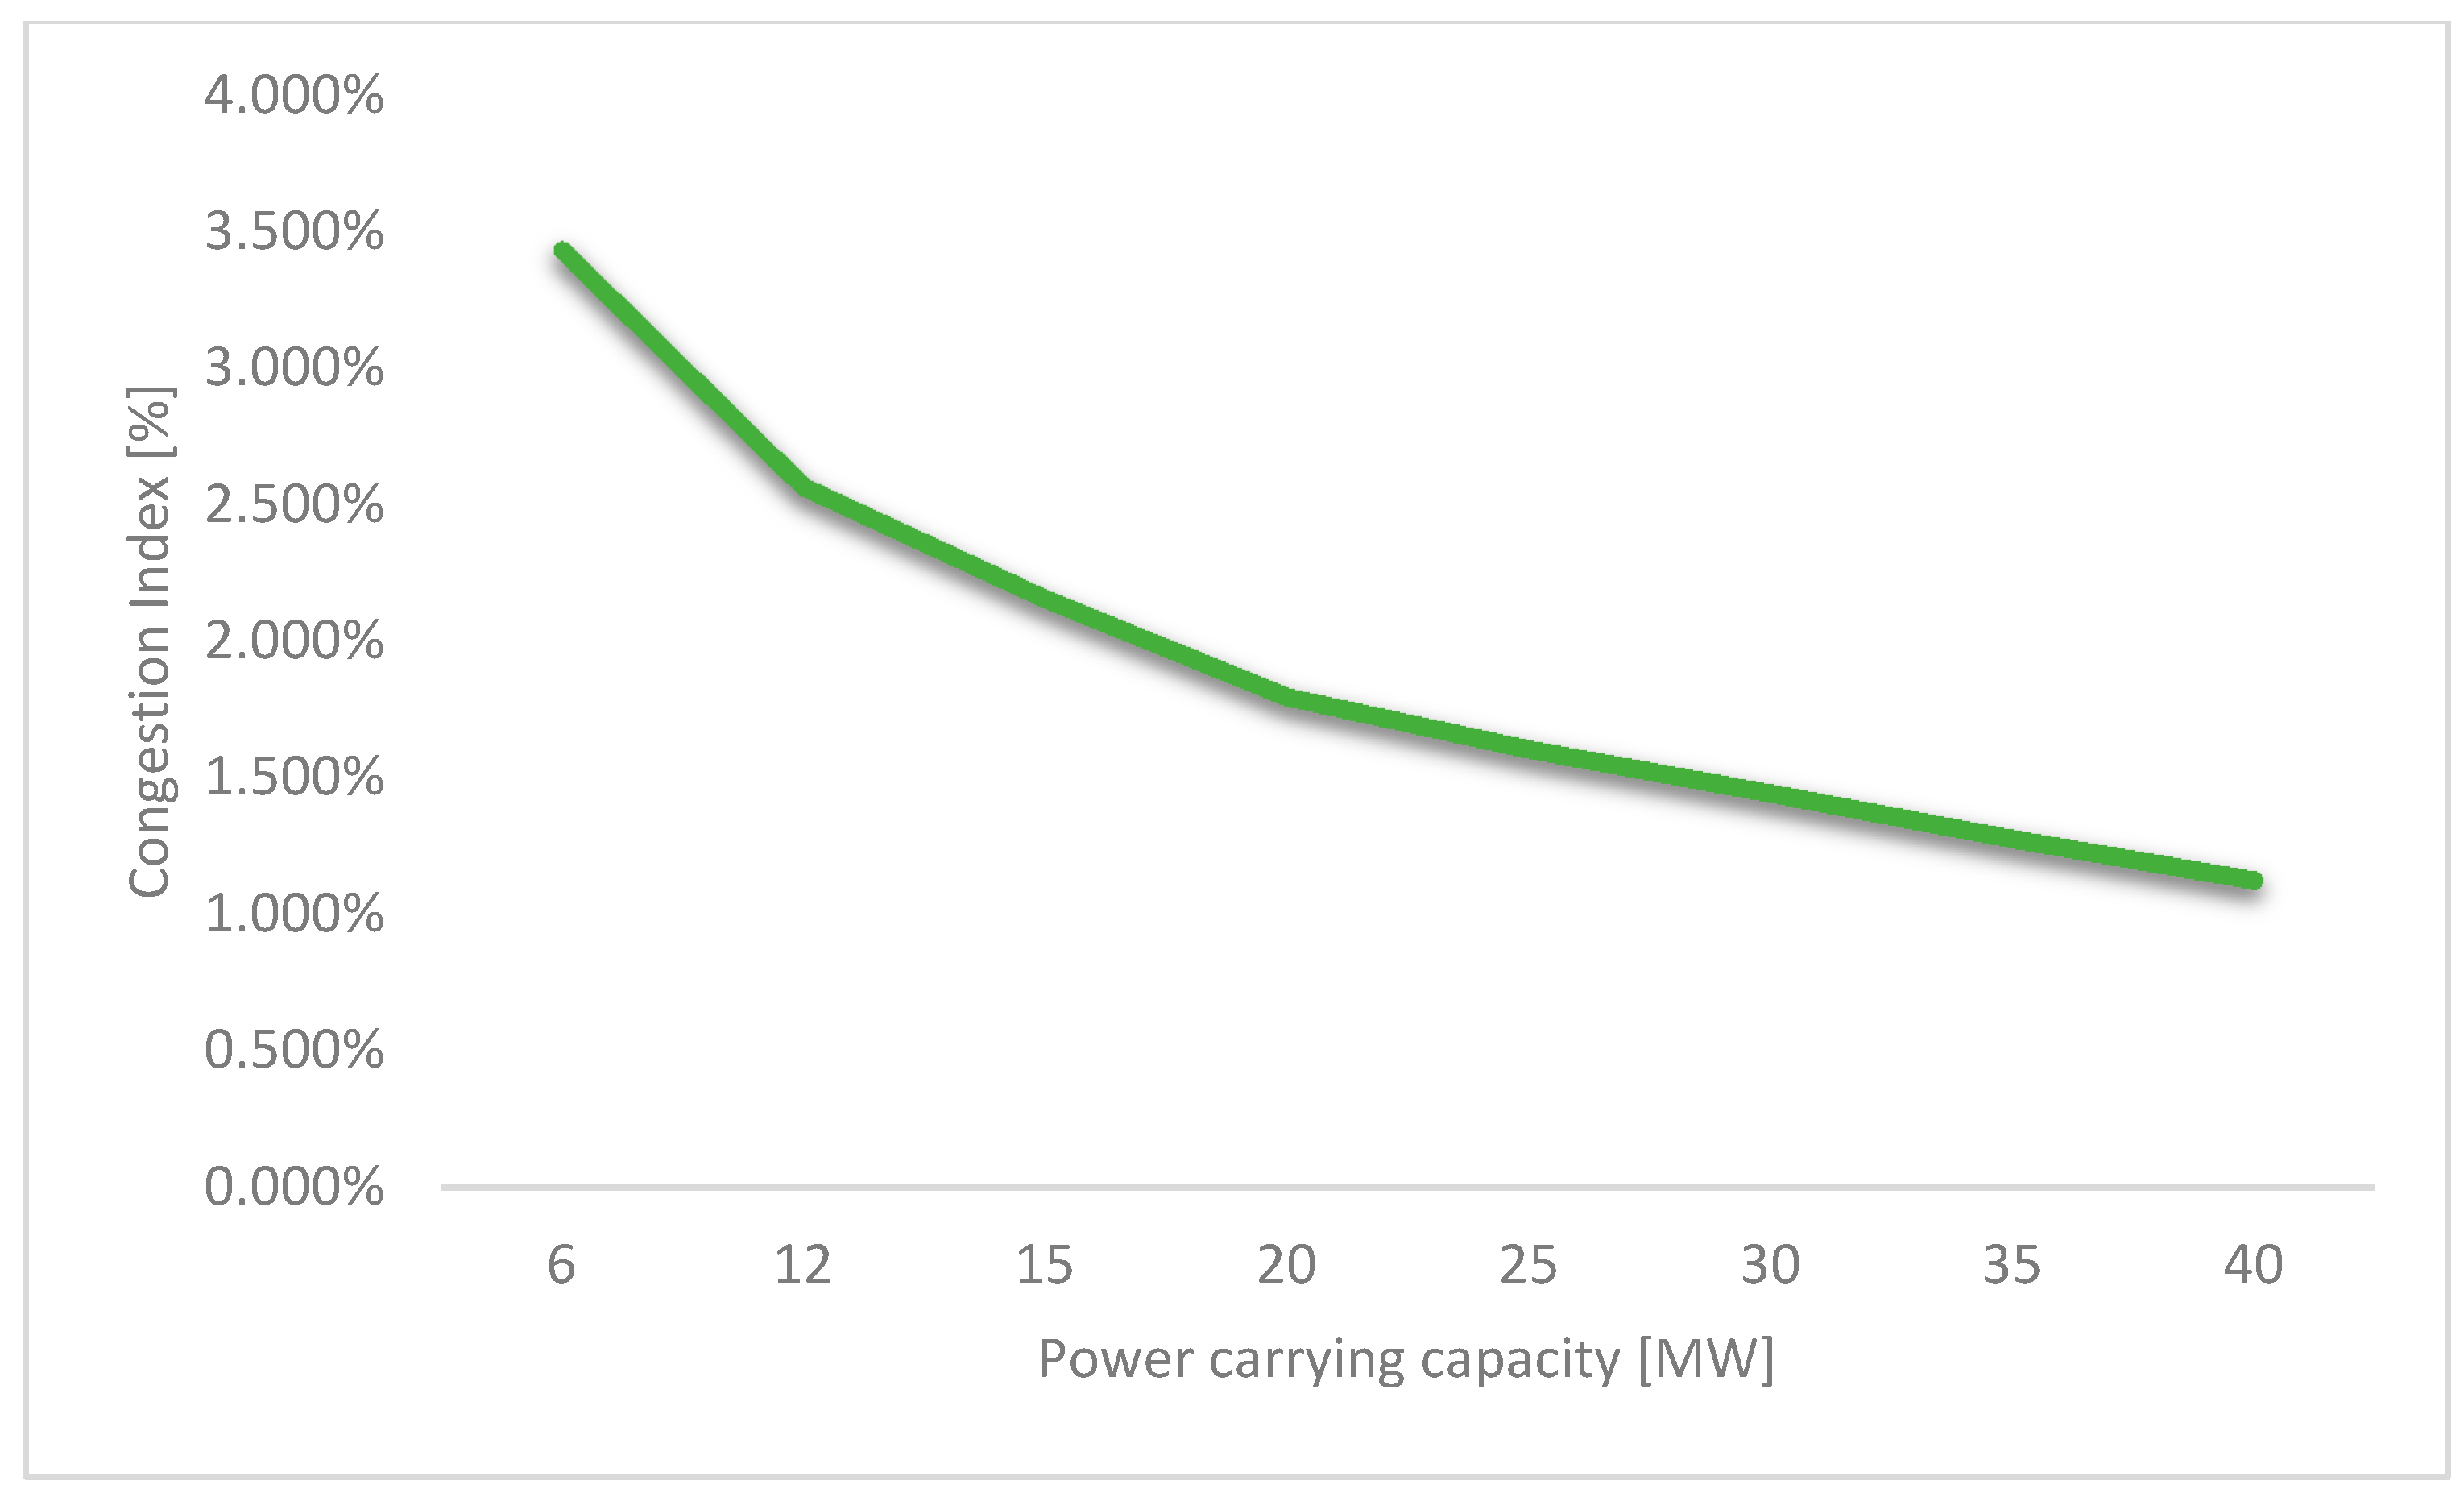
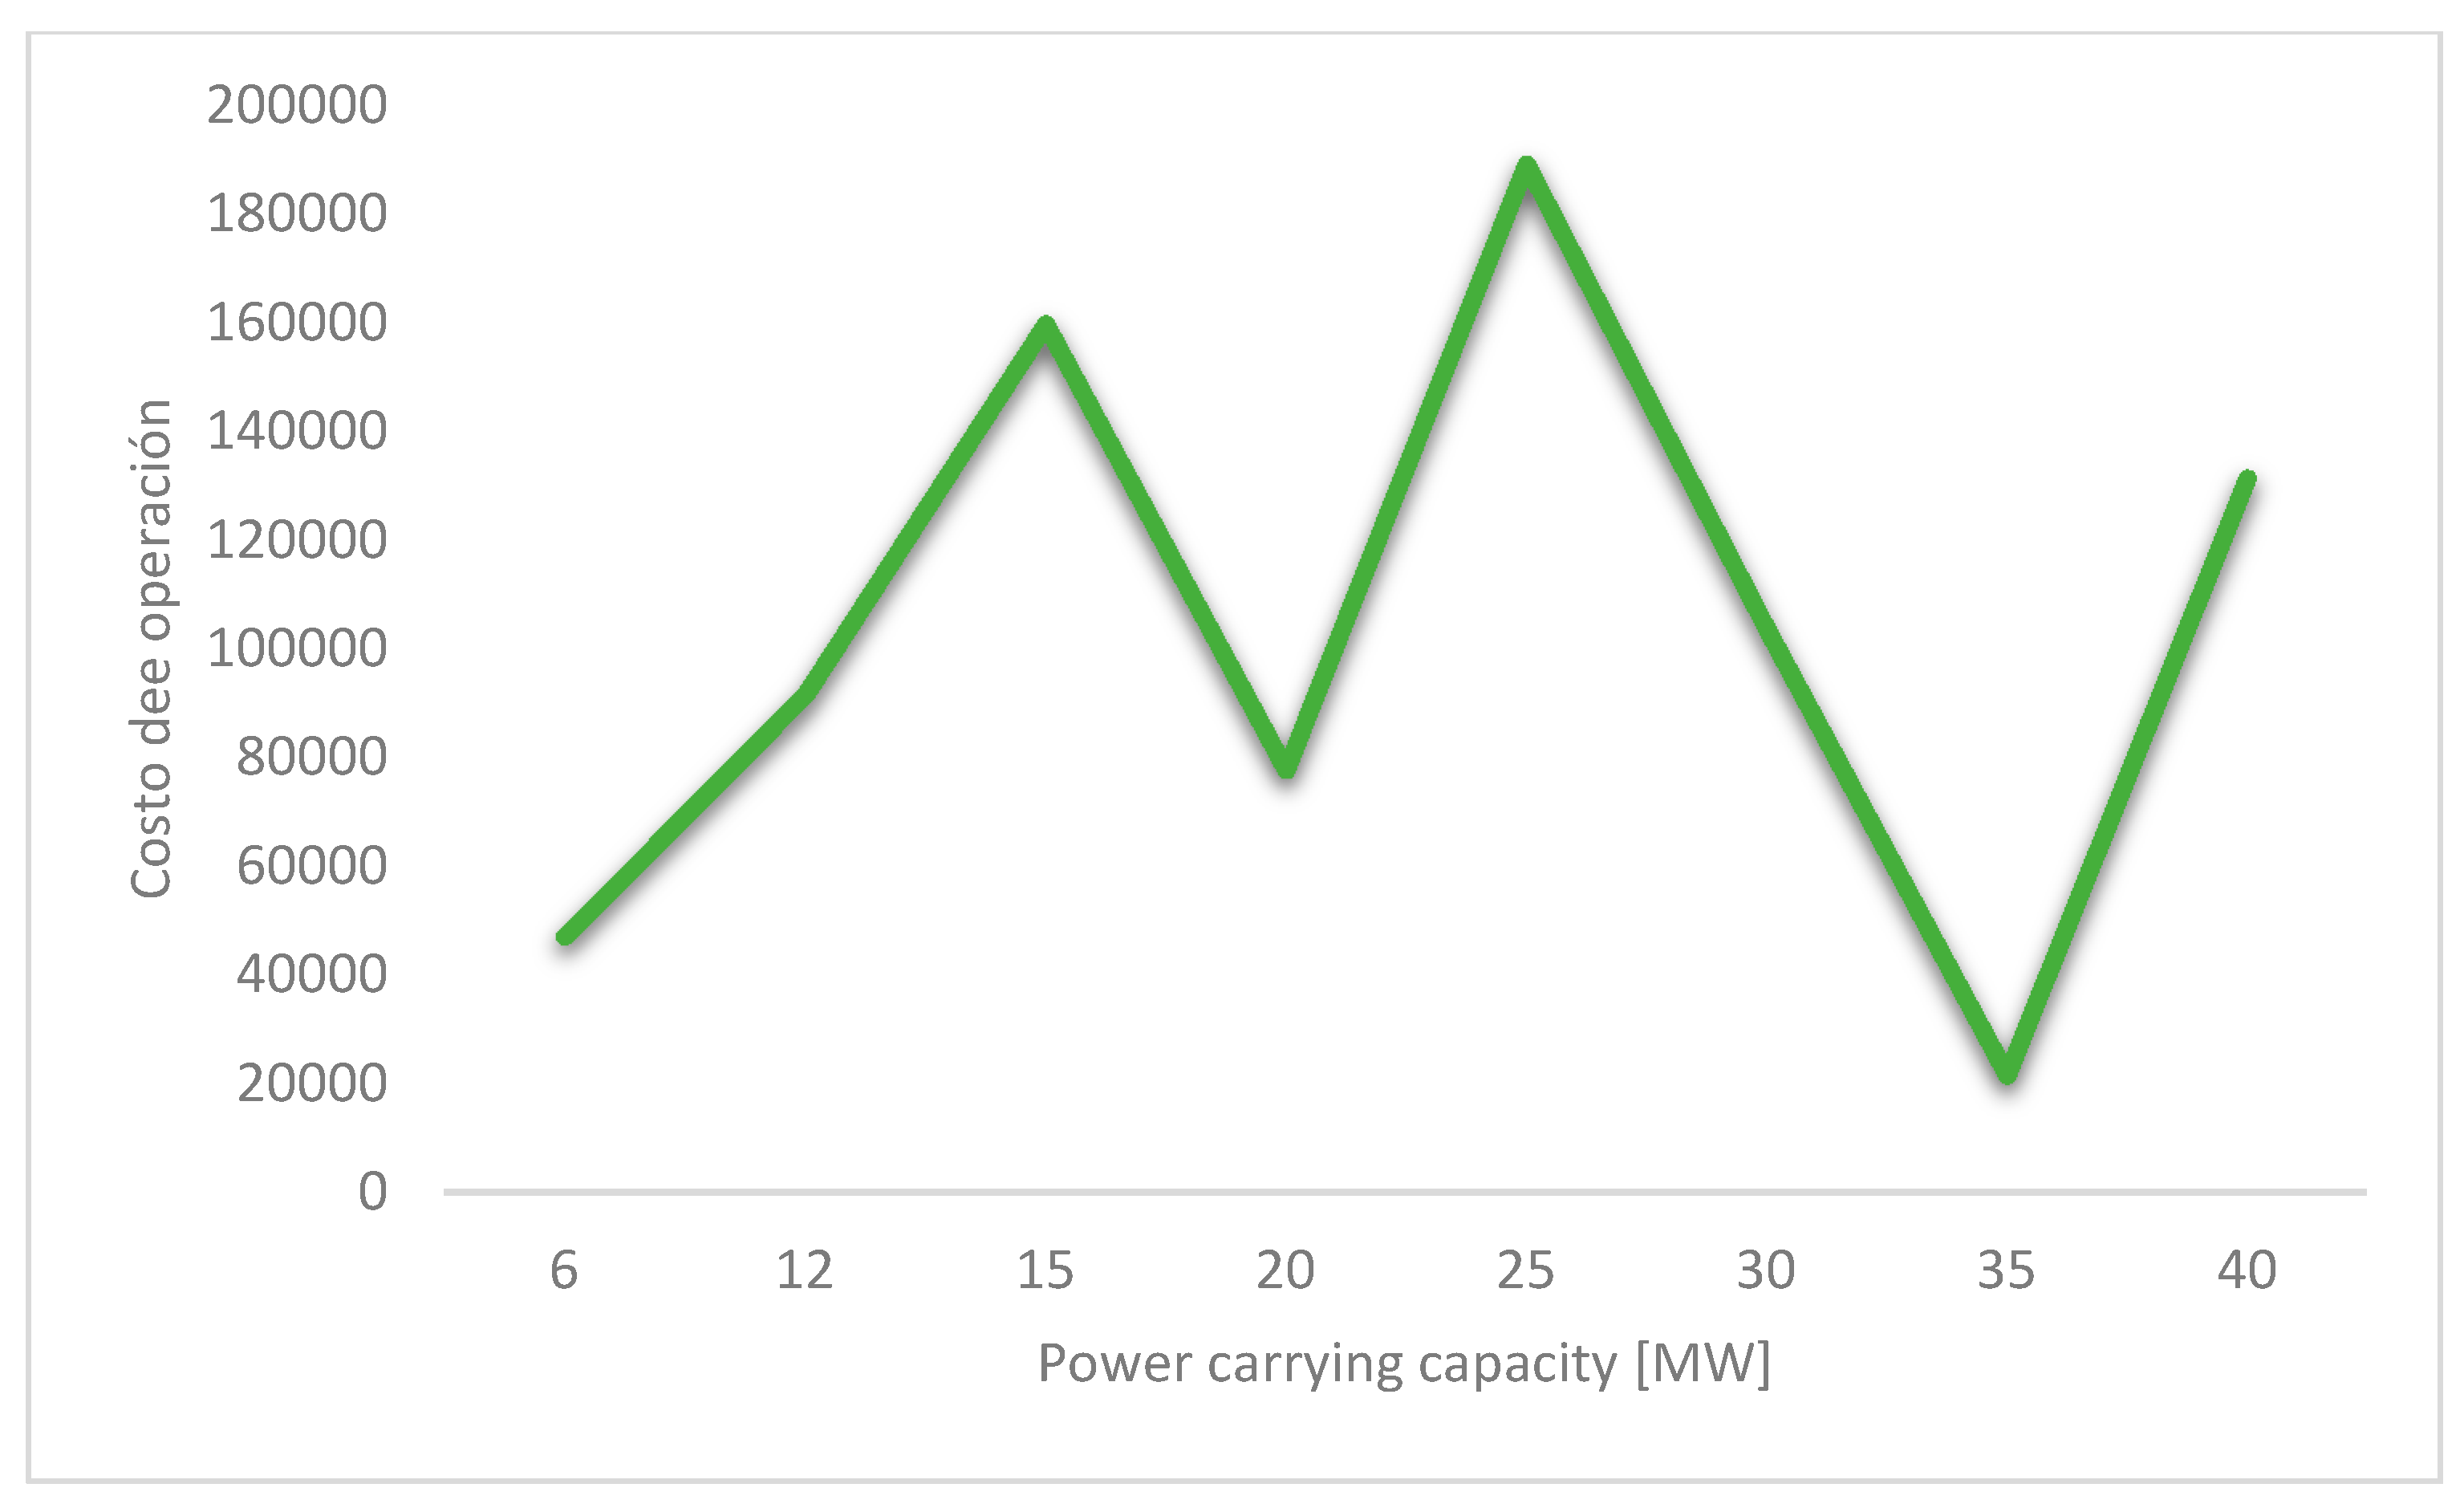
4.2. Sensibility Analysis of Line Capacity in the Modified IEEE Case No. 141

This section describes the simulations run for the IEEE case study No. 141, which used the MOPSO genetic algorithm to verify the variation of the maximum power limit in the lines of the analyzed system. Based on this, the system underwent a number of modifications intended to determine the impact of congestion and operation costs, based on the assumption that the power capacity limit might change within five years.
This limit was modified for values above and below 45 MW, since the system had a better performance in that range (Figure 7).
According to Figure 8, the congestion index corresponding to a minimal operation cost is not directly correlated to the system’s power carrying capacity.
Figure 9 shows that the network does not become congested based on the operation cost structure depicted in Figure 10. The analysis was focused on carrying capacities of more than 50 MW.
Figure 11 indicates that the system always presents congestion at a capacity lower than 45 MW.
As demonstrated in Figure 11, however much the operation cost increases, it is not possible to decongest the network for the test system; a capacity lower than 45 MW is not optimal.

5. Discussion and Conclusions

The multi-objective solution made it possible to evaluate the congestion resulting from the immersion by means of different energy sources in a test microgrid. The study found a very significant relation between improvement and decrease in grid operation, based on operation costs and the congestion index of the system subject to its own restrictions.
The MOPSO algorithm, being a population-based optimization model, does not converge at the same optimal point, but does provide a suboptimal solution quite close to that point. The execution of the optimization model provided a set of Pareto optimal solutions for any congestion index; this allowed the system operator to choose from several options to make better operational and commercial decisions.
Evidence shows that there are solutions that oppose each other, i.e., obtaining a minimal congestion index involves a higher operation cost. In other words, the improvement of one objective—or n objectives—leads to a decrease in the other ones. The load curve used presented most congestion problems in the test system considered.
A system with ample carrying capacity helps reduce congestion in the network. This study aimed at optimizing the congestion index of the microgrid analyzed, since it is an objective of the NOs; ensuring that the final user’s demand will be met; providing continuity of service; and obtaining greater system reliability.
This study provides a tool to run simulations that may contribute to network planning and to ensure strategies for sufficient generation and carrying capacity. The equivalent model makes it possible to approach the system’s initial state in a close and simplified way. The analysis of the incursion of generation projects soon to be installed will offer an idea of the system variables and their behavior to define the strategies to be chosen, such as the repowering of congested lines.
The evaluation of the decision variables at each Pareto point shows that, when dispatching the system, it is sometimes more favorable for energy to be stored when there is exceeding solar and wind energy. It was also found that diesel-based generation is always used because the dispatch involves a lower cost at given hours and the supply is necessary at more critical times.
The modeled system helps propose several congestion index optimization strategies, such as the optimal location of renewable energy injection or controllable loads taking into account the generation capacity necessary to obtain a minimal congestion index and a lower operation cost.
The verification of possible implications on the congestion index and on the decision variables evaluated can be performed through a sensibility analysis of load curves in the studied system. This study is a tool that can be modeled in the distribution systems of NOs to optimize congestion and potential costs derived from a widespread distributed generation.

Author Contributions

Conceptualization, A.N. and S.R.; methodology, J.M. and S.R.; software, A.N.; validation, A.N., J.M. and S.R.; writing—original draft preparation, A.N.; writing—review and editing, S.R.; visualization, J.M.; supervision, S.R. All authors have read and agreed to the published version of the manuscript.

Funding

This research received no external funding.

Conflicts of Interest

The authors declare no conflict of interest.

References

  1. Huang, S.; Wu, Q.; Liu, Z.; Nielsen, A.H. Review of congestion management methods for distribution networks with high penetration of distributed energy resources. In Proceedings of the IEEE PES Innovative Smart Grid Technologies Conference Europe, Istanbul, Turkey, 12–15 October 2014. [Google Scholar] [CrossRef] [Green Version]
  2. Abdolahi, A.; Salehi, J.; Gazijahani, F.S.; Safari, A. Probabilistic multi-objective arbitrage of dispersed energy storage systems for optimal congestion management of active distribution networks including solar/wind/CHP hybrid energy system. J. Renew. Sustain. Energy 2018, 10, 045502. [Google Scholar] [CrossRef]
  3. Spiliotis, K.; Claeys, S.; Gutierrez, A.R.; Driesen, J. Utilizing local energy storage for congestion management and investment deferral in distribution networks. In Proceedings of the 13th International Conference on the European Energy Market (EEM), Porto, Portugal, 6–9 June 2016. [Google Scholar]
  4. Lopez Lezama, J.M. Propuestas Alternativas para Manejo de Congestión en el Mercado de Energía Eléctrica Colombiano. Ph.D. Thesis, Universidad Nacional de Colombia, Manizales, Colombia, 2006. [Google Scholar]
  5. Gope, S.; Dawn, S.; Mitra, R.; Goswami, A.K.; Tiwari, P.K. Transmission congestion relief with integration of photovoltaic power using lion optimization algorithm. Adv. Intell. Syst. Comput. 2019, 816, 327–338. [Google Scholar] [CrossRef]
  6. Reihani, E.; Siano, P.; Genova, M. A new method for peer-to-peer energy exchange in distribution grids. Energies 2020, 13, 799. [Google Scholar] [CrossRef] [Green Version]
  7. Vijayakumar, K. Multiobjective optimization methods for congestion management in deregulated power systems. J. Electr. Comput. Eng. 2012, 2012, 1. [Google Scholar] [CrossRef] [Green Version]
  8. Lopez Lezama, J.M. Propuestas Alternativas Para Manejo De Congestión En El Mercado De Energía Eléctrica Colombiano; Universidad Nacional de Colombia Sede Manizales Departamento de Ingeniería Eléctrica, Electrónica y Computación: Manizalez, Columbia, 2006. [Google Scholar]
  9. Institute of Electrical and Electronics Engineers, IEEE Dielectrics and Electrical Insulation Society. Kolkata Chapter, IEEE Power & Energy Society. Kolkata Chapter, Institute of Electrical and Electronics Engineers. Kolkata section, and North Eastern Regional Institute of Science and Technology. In Proceedings of the 2012 1st International Conference on Power and Energy in NERIST (lCPEN), Nirjuli, India, 28–29 December 2012. [Google Scholar]
  10. Hazra, J.; Sinha, A.K. Congestion management using multiobjective particle swarm optimization. IEEE Trans. Power Syst. 2007, 22, 1726–1734. [Google Scholar] [CrossRef]
  11. Kalogeropoulos, I.; Sarimveis, H. Predictive control algorithms for congestion management in electric power distribution grids. Appl. Math. Model. 2019, 77, 635–651. [Google Scholar] [CrossRef]
  12. Liu, W.; Wu, Q.; Wen, F.; Østergaard, J. Day-ahead congestion management in distribution systems through household demand response and distribution congestion prices. IEEE Trans. Smart Grid 2014, 5, 2739–2747. [Google Scholar] [CrossRef] [Green Version]
  13. Kashyap, M.; Kansal, S. Hybrid approach for congestion management using optimal placement of distributed generator. Int. J. Ambient. Energy 2017, 39, 132–142. [Google Scholar] [CrossRef]
  14. Li, J.; Li, F. A congestion index considering the characteristics of generators & networks. In Proceedings of the 47th International Universities Power Engineering Conference (UPEC), Uxbridge, UK, 4–7 September 2012. [Google Scholar] [CrossRef]
  15. Biswas, P.; Pal, B.B. A fuzzy goal programming method to solve congestion management problem using genetic algorithm. Decis. Mak. Appl. Manag. Eng. 2019, 2, 36–53. [Google Scholar] [CrossRef]
  16. Patil, S.; Asati, N. Congestion management using genetic algorithm. Int. Res. J. Eng. Appl. Sci. 2019, 7, 19–23. Available online: https://www.irjeas.org/wp-content/uploads/admin/volume7/V7I2/IRJEAS04V7I204190619000005.pdf (accessed on 11 August 2021).
  17. Khani, H.; Zadeh, M.R.D.; Hajimiragha, A.H. Transmission congestion relief using privately owned large-scale energy storage systems in a competitive electricity market. IEEE Trans. Power Syst. 2015, 31, 1449–1458. [Google Scholar] [CrossRef]
  18. Furusawa, K.; Sugihara, H.; Tsuji, K.; Mitani, Y. A study on power flow congestion relief by using customer-side energy storage system. IEEJ Trans. Power Energy 2005, 125, 293–301. [Google Scholar] [CrossRef]
  19. D’Agostino, F.; Massucco, S.; Pongiglione, P.; Saviozzi, M.; Silvestro, F. Optimal DER regulation and storage allocation in distribution networks: Volt/Var optimization and congestion relief. In Proceedings of the 2019 IEEE Milan PowerTech, Milan, Italy, 23–27 June 2019. [Google Scholar] [CrossRef]
  20. Hazra, J.; Padmanaban, M.; Zaini, F.; De Silva, L.C. Congestion relief using grid scale batteries. In Proceedings of the 2015 IEEE Power and Energy Society Innovative Smart Grid Technologies Conference, Washington, DC, USA, 18–20 February 2015. [Google Scholar] [CrossRef]
  21. Haque, A.; Nguyen, P.; Kling, W.; Bliek, F. Congestion management in smart distribution network. In Proceedings of the 49th International Universities Power Engineering Conference (UPEC), Cluj-Napoca, Romania, 2–5 September 2014. [Google Scholar] [CrossRef]
  22. Elliott, R.T.; Fernandez-Blanco, R.; Kozdras, K.; Kaplan, J.; Lockyear, B.; Zyskowski, J.; Kirschen, D.S. Sharing energy storage between transmission and distribution. IEEE Trans. Power Syst. 2018, 34, 152–162. [Google Scholar] [CrossRef] [Green Version]
  23. Koeppel, G.; Geidl, M.; Andersson, G.; Koeppel, G.; Geidl, M.; Andersson, G. Value of storage devices in congestion constrained distribution networks’ value of storage devices in congestion constrained distribution networks. In Proceedings of the International Conference on Power System Technology, PowerCon 2004, Singapore, 21–24 November 2004. [Google Scholar]
  24. Sarkar, B.K.; DE, A.; Chakrabarti, A. Impact of distributed generation for congestion relief in power networks. In Proceedings of the 1st International Conference on Power and Energy in NERIST, ICPEN 2012, Nirjuli, India, 28–29 December 2012. [Google Scholar] [CrossRef]
  25. Zhang, K.; Troitzsch, S.; Hanif, S.; Hamacher, T. Coordinated market design for peer-to-peer energy trade and ancillary services in distribution grids. IEEE Trans. Smart Grid 2020, 11, 2929–2941. Available online: https://www.researchgate.net/publication/338501038 (accessed on 8 June 2021). [CrossRef]
  26. Hu, J.; Yang, G.; Ziras, C.; Kok, K. Aggregator Operation in the balancing market through network-constrained transactive energy. IEEE Trans. Power Syst. 2018, 34, 4071–4080. [Google Scholar] [CrossRef] [Green Version]
  27. Zhao, J.; Wang, Y.; Song, G.; Li, P.; Wang, C.; Wu, J. Congestion management method of low-voltage active distribution networks based on distribution locational marginal price. IEEE Access 2019, 7, 32240–32255. [Google Scholar] [CrossRef]
  28. Barón Moreno, C.E. Programación de la Operación Horaria de una Microred Minimizando el Costo de Operación Usando el Algoritmo Heurístico DEEPSO. Ph.D. Thesis, Universidad Nacional de Colombia, Bogota, Colombia, 2019. [Google Scholar]
  29. Arévalo, J.; Santos, F.; Rivera, S. Aplicación de costos de incertidumbre analíticos de energía solar, eólica y vehículos eléctricos en el despacho óptimo de potencia. Ingeniería 2017, 22, 324–346. [Google Scholar] [CrossRef] [Green Version]
  30. Wibowo, R.S.; Utama, F.F.; Putra, D.F.U.; Aryani, N.K. Unit commitment with non-smooth generation cost function using binary particle swarm optimization. In Proceedings of the International Seminar on Intelligent Technology and Its Application, ISITIA 2016: Recent Trends in Intelligent Computational Technologies for Sustainable Energy, Lombok, Indonesia, 28–30 July 2016; pp. 571–576. [Google Scholar] [CrossRef]
  31. Zhang, Q.; Ren, Z.; Ma, R.; Tang, M.; He, Z. Research on Double-Layer Optimized Configuration of Multi-Energy Storage in Regional Integrated Energy System with Connected Distributed Wind Power. Energies 2019, 12, 3964. [Google Scholar] [CrossRef] [Green Version]
  32. Baron, C.; Rivera, S. Mono-objective minimization of operation cost for a microgrid with renewable power generation, energy storage and electric vehicles. Rev. Int. Métodos Numéricos Cálculo Diseño Ing. 2019, 35, 34. [Google Scholar] [CrossRef]
  33. Arevalo, J.C.; Santos, F.; Rivera, S. Uncertainty cost functions for solar photovoltaic generation, wind energy generation, and plug-in electric vehicles: Mathematical expected value and verification by Monte Carlo simulation. Int. J. Power Energy Convers. 2019, 10, 171–207. [Google Scholar] [CrossRef]
  34. Xu, Z.; Hu, Z.; Song, Y.; Zhao, W.; Zhang, Y. Coordination of PEVs charging across multiple aggregators. Appl. Energy 2014, 136, 582–589. [Google Scholar] [CrossRef]
  35. Serpi, A.; Porru, M. Modelling and design of real-time energy management systems for fuel cell/battery electric vehicles. Energies 2019, 12, 4260. [Google Scholar] [CrossRef] [Green Version]
  36. Hussain, A.; Bui, V.-H.; Baek, J.-W.; Kim, H.-M. Stationary energy storage system for fast EV charging stations: Simultaneous sizing of battery and converter. Energies 2019, 12, 4516. [Google Scholar] [CrossRef] [Green Version]
  37. Dufo-López, R.; Agustín, J.L.B. Multi-objective design of PV-wind-diesel-hydrogen-battery systems. Renew. Energy 2008, 33, 2559–2572. [Google Scholar] [CrossRef]
  38. Berglund, F.; Zaferanlouei, S.; Korpås, M.; Uhlen, K. Optimal operation of battery storage for a subscribed capacity-based power tariff prosumer—A norwegian case study. Energies 2019, 12, 4450. [Google Scholar] [CrossRef] [Green Version]
  39. Jankowiak, C.; Zacharopoulos, A.; Brandoni, C.; Keatley, P.; MacArtain, P.; Hewitt, N. The role of domestic integrated battery energy storage systems for electricity network performance enhancement. Energies 2019, 12, 3954. [Google Scholar] [CrossRef] [Green Version]
  40. Zhao, B.; Zhang, X.; Chen, J.; Wang, C.; Guo, L. Operation optimization of standalone microgrids considering lifetime characteristics of battery energy storage system. IEEE Trans. Sustain. Energy 2013, 4, 934–943. [Google Scholar] [CrossRef]
  41. Sikorski, T.; Jasiński, M.; Ropuszyńska-Surma, E.; Węglarz, M.; Kaczorowska, D.; Kostyła, P.; Leonowicz, Z.; Lis, R.; Rezmer, J.; Rojewski, W.; et al. A case study on distributed energy resources and energy-storage systems in a virtual power plant concept: Economic aspects. Energies 2019, 12, 4447. [Google Scholar] [CrossRef] [Green Version]
  42. Coello, C.A.C.; Lamont, G.B.; Van Veldhuizen, D.A. Evolutionary Algorithms for Solving Multi-Objective Problems; Springer: New York, NY, USA, 2007. [Google Scholar]
  43. Gallego Rendon, R.A.; Escobar Zuluaga, A.H.; Toro Ocampo, E.M.; Lazaro, R.A.R. Tecnicas Heuristicas y Metaheuristicas de Optimizacion, 2nd ed.; Universidad Tecnologica de Pereira: Pereira, Colombia, 2008. [Google Scholar]
  44. Vélez Gallego, M.C.; Montoya, J.A. Metaheurísticos: Una alternativa para la solución de problemas combinatorios en administración de operaciones. Revista EIA Esc. Ing. Antioq. 2007, 8, 99–115. Available online: http://www.scielo.org.co/scielo.php?script=sci_arttext&pid=S1794-12372007000200009&lng=en&nrm=iso (accessed on 7 June 2021). [CrossRef]
Figure 1. Pareto front of solutions obtained to minimize F1 and F2.
Vehicles 03 00035 g001
Figure 2. Operation Cost and Congestion Index.
Vehicles 03 00035 g002
Figure 3. Availability and dispatch of the microgrid with minimal congestion index.
Vehicles 03 00035 g003
Figure 4. Availability and dispatch of the microgrid solar power system with minimal congestion index.
Vehicles 03 00035 g004
Figure 5. Availability and dispatch of the microgrid wind energy system with minimal congestion index.
Vehicles 03 00035 g005
Figure 6. Amount of power from electric vehicle aggregators in 24 h a day.
Vehicles 03 00035 g006
Figure 7. Congestion index and Power carrying capacity.
Vehicles 03 00035 g007
Figure 8. Congestion index and Power carrying capacity.
Vehicles 03 00035 g008
Figure 9. Operation cost and Power carrying capacity.
Vehicles 03 00035 g009
Figure 10. Congestion index and Power carrying capacity.
Vehicles 03 00035 g010
Figure 11. Operation cost and Power carrying capacity.
Vehicles 03 00035 g011
Table 1. Characteristics of the electrical elements (Case 141 IEEE).
Buses141
Generators3
Loads84
Fixed84
Dispatchable0
Shunts0
Branches140
Transformers0
0
Areas1
Table 2. Characteristics of the system.
Total Generation CapacityP (MW)Q (MVAr)
Total generation capacity2997.0−2997.0 to 2997.0
Current generation89.159.9
Load59.536.9
Fixed59.536.9
Dispatchable−0.0 of −0.0−0.0
Shunt (inj)29.640.0
Losses (I2 * Z)29.6423.04
Branch load (ing)89.10.0
Total flow between links00.0
Table 3. Characteristics of MOPSO algorithm.
ParametersValueDescription
params.Np10Population size
params.Nr10Repository size
params.maxgen50Maximum number of generations
params.W0.4Inertia weight
params.C12Individual confidence factor
params.C22Swarm confidence factor
params.ngrid20Number of grids in each dimension
params.maxvel5Maximum vel in percentage
params.u_mut0.5Uniform mutation percentage
Table 4. Costs (for F1(x), F2(x), F3(x) and F4(x) calculation).
NotationValueDescription and Units
Costdiesel0.8Taken from the Energy Information Administration of the U.S. Department of Energy (DOE)-(USD/KWh)
CUbat180Battery cost (USD/KWh) (from reference [27])
Ctransbat1.05Cost overrun due to the transportation of the batteries
CinitCbat × Ubat × CtransbatInitial cost of the batteries, in dollars.
CostSolar0.0803Solar energy cost (USD/kWh) (from reference [28])
CostWind0.130Cost of wind energy (USD/kWh [28])
Publisher’s Note: MDPI stays neutral with regard to jurisdictional claims in published maps and institutional affiliations.

