1. Introduction
Animal products reflect the history of our landscape, foodscapes and agricultural systems manifested though soil and plant chemistry, and thereby our health and that of the planet
(Gregorini et al., 2017)
Consumers and producers of animal products are increasingly aware of the intricate connections between the health of the land, animals, and humans, as well as of our collective responsibilities to sustain and enhance the environment for future generations [
1]. Consequently, land users, policymakers and wider society are calling for alternative approaches to pastoral systems; there has been a call for functionally diversified adaptive, and integrative, agro-ecological and food pastoral systems that simultaneously operate across multiple scales and ‘scapes’ [
1])—from landscapes and foodscapes to healthscapes.
Recent research has reported that grazing phytochemically diverse swards improves animal welfare and environmental health [
2]. More specifically, the evidence indicated that plants with particular secondary chemical compounds (e.g., tannins, terpenoids, phenols, carotenoids and antioxidants, with known anti-inflammatory, anti-cancer, and heart-health-promoting effects) reduce oxidative and physiological stress in grazing ruminants, increase animal performance and feed conversion efficiency [
3,
4] and enhance hedonic and eudemonic well-being.
Chronic diseases such as obesity, diabetes, cardiovascular disease, and cancer, as well as metabolic syndrome, have been associated with red meat and dairy product consumption [
5,
6], although more recent evidence indicates neutral or beneficial health associations with overall dairy intake [
7,
8]. These real or perceived associations explain why some societies or consumers, in pursuit of health, increasingly demand foodscapes that are absent from animal products. The question arises as to whether there are ecological connections between phytochemically diverse swards and the subsequent health of animals, humans and soil. If so, this expanded pool of nutrients, medicines and prophylactics known as plant secondary chemical compounds must be considered to understand the effects of animal product consumption on human health, as they have been reported to be concentrated in the meat and milk of livestock consuming those plants [
3].
Enhanced eudemonic and hedonic well-being coupled with better health suggest that phytochemically functional dietary diversity will not only improve animal welfare but also the well-being (mental state and health) of both the production animals themselves and that of the humans that consume them or their products. Consequently, animal products sourced from phytochemically rich grazing environments not only foster positive environmental, soil and livestock outcomes but also, and most importantly, human health. Furthermore, the incorporation of biochemical diversity in the grazing environment presents an opportunity to transform pastoral agriculture of livestock and counteract the current negative connotation of animal products for consumers. This transformation would lead to a change in the eating experience and thus hedonics (i.e., healthy pleasure) of the consumer knowing that such a product is not only in tune with the land and animal but is integrally healthier for us and the land we all inhabit. “Ultimately, we are what we eat, eats!” [
4].
The objective of this work was to explore, for the very first time, the effect of taxonomically and phytochemically rich functional swards, as opposed to ‘status quo’ monoculture of ryegrass and white clover swards, on animals and milk, by assessing the metabolomic profile of plant and milk samples. In other words, we have started to provide an answer to the following question: are there ecological connections between phytochemically diverse and functional swards and the health of animals and subsequently humans.
2. Materials and Methods
All animal manipulations were conducted with the approval of the Lincoln University Animal Ethics committee (AEC 2022–37).
2.1. Research Site, Pasture, and Animals
The study was conducted at Lincoln University’s Ashley Dene Research and Development Station in Canterbury, New Zealand (−43.65° N, 172.33° E), over 20 days between October and November 2022. The experiment used of 18 multiparous Holstein Friesian × Jersey cows (F12 × J4) during peak lactation. Experimental animals were grouped into triplicates by age (4.8 ± 1.4 years), DIM (74 ± 2 days), average 7-day body weight (476 ± 45 kg), average 7-day milk yield (17.9 ± 2.6 kg) and milk solids performance from a herd test performed on the 12 October 2022 (2.34 ± 0.18 kg MS/days). One cow from each triplicate was randomly assigned to one of three dietary forage treatments (i.e., 6 cows per treatment) consisting of either a control perennial ryegrass (PRG: Lolium perenne) and white clover (WC: Trifolium repens) pasture; a complex multispecies mixture (CMS, n = 24 forage species) including grasses (PRG: Lolium perenne, Italian ryegrass: Lolium multiflorum, Tall fescue: Festuca arundinacea, Meadow fescue: Festuca pratensis, Prairie grass, Bromus wildenowii, Timothy Phleum partense, and Cocksfoot: Dactylis glomerata), legumes (White clover: Trifolium repens, Red clover: Trifolium pratense, Lucerne: Medicago sativa, Lotus: Lotus pedunculatus, Lupins: Lupinus and Vetch: Vicia sativa as well as Crimson: Trifolium incartum, Balansa: Trifolium michelianum, Persian: Trifolium resupinatum and Strawberry clovers: Trifolium fragiferum), in addition to brassicas (Rape: Brassica napus and Radish: Raphanus sativus) and herbs (Chicory: Chicorium intybus and Plantain: Plantago lanceolata).; and adjacent monoculture strips of lucerne, ryegrass, red clover, plantain, and chicory, which were sown in equal areas longitudinally, to be grazed horizontally (strip grazed).
One 2.5 ha paddock was allocated to each treatment. The PRG treatment consisted of an existing PRG and WC dominant paddock established within the last 5 years. The CMS and AMS pastures were established in the Spring of 2021 (November). Briefly, the areas were sprayed to remove the existing perennial ryegrass pasture (Touchdown 3 L/ha, and Satur8 200 mL/ha) and a single application of diammonium phosphate (DAP, 250 kg/ha) was applied. The CMS pasture was direct drilled on the 23rd of November with a sowing rate of 47 kg/ha. The adjacent monoculture strips of ryegrass (CV Legion AR1), plantain (CV Ecotain), lucerne (CV Titan 5), red clover (CV Relish), and chicory (CV choice) were individually direct drilled at rates of 25, 12, 14, 12, and 10 kg/ha, respectively, on the 23rd of November 2021. An additional application of urea was applied across all experimental sites prior to commencement of the adaptation phase (40 kg/ha Urea).
2.2. Animal Management
Cows were milked twice daily (~0600 and 1530) and grazed their treatment forages for a total of 20 days, including a 14 d adaptation period, and a 6-day sample collection period. Milk production and animal liveweight were measured at each milking during adaptation and sampling (Waikato milk systems, Hamilton, New Zealand). Herbage allocations of DM were maintained across all diets and the target allocation was calculated as 4% of body weight (470 kg body weight = 19 kg DM/cow). All paddocks were strip-grazed using temporary electric fencing materials. Herbage breaks were allocated daily following the morning milking, the target post grazing residual was 1600 kg DM/ha. Pre- and post-grazing herbage mass was estimated daily using a rising plate meter (Jenquip, Feilding, New Zealand). The rising plate meter was calibrated by collecting 0.2 m2 quadrates prior to the experiment and every second day during the sampling phase. Briefly, the quadrat was placed randomly, and the compressed sward height measured by plate meter prior to cutting the herbage mass to ground level. Following collection, quadrats were dried in an oven at 60 °C over 72 h. Within the AMS treatment two pre-grazing and two post-grazing quadrats were collected from each adjacent monoculture at each sample collection. The difference between pre- and post-grazing herbage mass divided by the number of animals and days in the strip being the estimated daily herbage DMI.
2.3. Herbage Sampling
Botanical and chemical composition, DM percentage and the metabolomic profile of each diet were evaluated using hand-grab herbage samples. On three occasions, during the sample collection phase, duplicate herbage samples were collected from each treatment and forage within the AMS treatment by randomly selecting 10–20 handfuls of herbage and cutting to grazing height (~4 cm above ground). After collection, pasture samples were mixed thoroughly and sub-sampled. One sub-sample was weighed and oven dried (60 °C for 48 h) to determine DM%, one was used to determine botanical components, and two were stored at −20 °C until freeze dried and ground through a 1 mm mill (ZM200 Retsch’ Haan, Germany) to analyse metabolomic profiles and chemical components (water-soluble carbohydrate, organic matter, dry matter, dry organic matter digestibility, and crude protein (WSC, OM, DM, DOMD and CP, respectively) by near-infrared spectrophotometry (NIRS, Model: FOSS NIR Systems 5000, FOSS, Silver Spring, MD, USA; calibration > 90%).
2.4. Animal Sampling
Cows were sampled for milk, and blood at the afternoon milking of the day prior to the experiment start and again following the morning milking before cows are allocated to their first pasture break. Samples of milk were collected by an in-line meter from two continuous milkings (PM and following AM) on 3 days during the sample collection phase. Blood samples were collected via the coocygeal vein during the afternoon samplings. The samples of milk were immediately sub-sampled into a 50 mL container and the remaining sample was stored overnight and composited by cow following the morning milking. Milk samples from each milking session were analysed for urea, protein, fat, and lactose concentrations and somatic cell count (Milk Test New Zealand, Hamilton, New Zealand), using a Combi Foss machine (Foss Electric, Hillerod, Denmark). The composited milk samples were sub sampled into 1.5 mL Eppendorf tubes and stored at −20 °C, until analysed for metabolomic profiles. In addition, the metabolomic profiles from the Lincoln study were compared with bulk milk samples collected from suppliers of two processing plants of differing locations (Hokitika, New Zealand), and (Glenavy South Canterbury, New Zealand). Milk samples were collected between 1st and 8th November 2022 from suppliers (WL) and bulk milk samples were also collected (Hokitika and Glenavy South milk). These dates coincided with the sample collection dates from the Lincoln University study.
Blood samples were collected by coccygeal vein into two 10 mL vacutainers (one with a lithium heparin coagulant and one with EDTA) at the beginning of the experiment (Day 0) as well as 16, 18, and 20 days, following the afternoon milking session. Following blood sample collection, blood samples were immediately stored on ice until transported to a laboratory and plasma was separated by centrifuging the samples at 3000× g for 12 min at 4 °C. The plasma was pipetted into 1.5 mL Eppendorf containers and stored at −20 °C until analysed. Plasma collected from Li Heparin coated vacutainers were analysed for total oxidative status (TAS: Cat No. NX2332), while those collected from EDTA coated vacutainers were analysed for non-esterified fatty acids (NEFA: Cat No. FA115) using a Randox RX Daytona clinical analyser (Randox Laboratories Ltd., Crumlin, UK) following their respective kit instructions.
2.5. Sample Extraction
2.5.1. Lipidomics
Samples were extracted for lipidomics based on the method of [
9] Huynh et al. (2019). Solvents were Optima LCMS grade from ThermoFisher (Auckland, New Zealand).
Milk
Ten µL of milk was pipetted into a 2 mL microcentrifuge tube, and 5 µL of internal standard mix (Splash Mix, Avanti Polar Lipids, Alabaster, AL, USA) and 95 µL of butanol/methanol (1:1 v/v) with 5 mM ammonium formate, added. The sample was shaken for 5 min at 30 Hz in a bead shaker (TissueLyser II, Qiagen, Venlo, The Netherlands). The samples were then sonicated for 60 min at 20 °C before centrifugation (14,000× g for 10 min at 20 °C, Heraeus Megafuge 8R, Thermo Fisher). 80 µL of supernatant was aliquoted into an amber chromatography vial with 250 µL flat bottom insert, and 20 µL supernatant transferred to a tube for making a pooled quality control sample.
Pasture
Pasture samples were freeze dried, and ground using a bead mill (TissueLyser II, Qiagen) and a metal bead, shaking for 5 min at 30 Hz. 10 mg of powdered pasture was weighed into a 2 mL microcentrifuge tube, and 10 µL of internal standard mix (Splash Mix, Avanti Polar Lipids, Alabaster, AL, USA) and 190 µL of butanol/methanol (1:1 v/v) with 5 mM ammonium formate, added. A metal bead was added to the microcentrifuge tube and the sample shaken for 5 min at 30 Hz in a bead shaker (TissueLyser II, Qiagen, Venlo, The Netherlands). The samples were then sonicated for 60 min at 20 °C before centrifugation (14,000× g for 10 min at 20 °C, Heraeus Megafuge 8R, Thermo Fisher). 150 µL of supernatant was aliquoted into an amber chromatography vial with 250 µL flat bottom insert, and 20 µL supernatant transferred to a tube for making a pooled quality control sample.
2.5.2. Semi-Polar Metabolomics
Milk
One hundred µL of milk was pipetted into a 2 mL microcentrifuge tube and 890 µL of methanol/water (9:1 v/v), and 20 µL of an in-house stable isotope internal standard mix. Milk was extracted in a bead shaker (5 min, 30 Hz, TissueLyser II, Qiagen, Venlo, The Netherlands) and tubes transferred to a −20 °C freezer for 30 min. The extracts were centrifuged for 10 min at 14,000× g at 4 °C (Heraeus Megafuge 8R, Thermo Fisher, Cincinnati, OH, USA). 180 µL of the supernatant was transferred to an amber chromatography vial with tapered insert for GC-MS/MS analysis, 180 µL transferred to an amber chromatography vial with flat bottomed insert for semi-polar metabolomics analysis, and 180 µL transferred to a 15 mL Falcon tube for a pooled QC sample.
Samples for GC-MS/MS were dried in a vacuum centrifuge concentrator (Christ RVC 2–18 CD plus, Martin Christ) and derivatised by methoxymation and silylation.
Pasture
Pasture samples were freeze dried and ground as for lipidomics. 50 mg of powdered pasture was weighed into a 2 mL microcentrifuge tube and 980 µL of methanol/water (9:1 v/v), 20 µL of an in-house stable isotope internal standard mix, and a metal bead were added. The pasture was extracted in a bead shaker (5 min, 30 Hz, TissueLyser II, Qiagen, Venlo, The Netherlands) and tubes transferred to a −20 °C freezer for 30 min. The extracts were centrifuged for 10 min at 14,000× g at 4 °C (Heraeus Megafuge 8R, Thermo Fisher, Cincinnati, OH, USA). 180 µL of the supernatant was transferred to an amber chromatography vial with tapered insert for GC-MS/MS analysis, 180 µL transferred to an amber chromatography vial with flat bottomed insert for semi-polar metabolomics analysis, and 180 µL transferred to a 15 mL Falcon tube for a pooled QC sample.
Samples for GC-MS/MS were dried in a vacuum centrifuge concentrator (Christ RVC 2–18 CD plus, Martin Christ) and derivatised by methoxymation and silylation.
2.5.3. Metabolomics Analyses
Lipidomics
Lipidomics analyses were carried out using LC-qToF-MS (LCMS 9030, Shimadzu, Kyoto, Japan) in data independent analysis mode. Samples (2 µL) were injected onto a C18 column (Acquity CSH-C18, 100 × 2.1 mm, 1.7 µm). The gradient programme was as follows: starting, 10% B, 2.7 min, 45% B; 2.8 min, 53% B; 9 min, 65% B; 9.1 min, 89% B; 11 min, 92% B; 11.1 min, 100% B; 13.9 min, 100% B; 14 min, 10% B; 17 min, 10% B. The flow rate was 0.4 mL/min. The column oven was set to 60 °C and autosampler set to 20 °C. The mass spectrometer was run in data independent analysis mode with an electrospray ionisation source. This was set up as follows: scanning data between m/z 250 and 1300 in ToF mode with an event time of 0.03 s, and 41 windows of m/z 20 from m/z 300 to 1100, in MZ/MS mode with a collision energy of 23 and a collision energy spread of 6, and event time of 0.02 s. Analyses were carried out in positive ionisation mode.
GC-MS/MS
GC-MS/MS analyses were carried out on a GCMS TQ8040 instrument (Shimadzu, Kyoto, Japan) using the SmartMetabolites MRM method. In brief, this targeted metabolomics method includes 450 multiple reaction monitoring transitions, covering approximately 400 individual metabolites (several metabolites have two chromatographic peaks). Analysis conditions were injector temperature 250 °C, interface temperature 280 °C, and MS source temperature 200 °C. The chromatography was carried out on a BPX5 column (30 m × 0.25 mm, 0.25 µm film thickness) with the following temperature gradient: start 60 °C, 2 min 60 °C, 20 min 330 °C, 23 min 330 °C. Two µL of derivatised sample was injected in split injection mode with a ratio of 1:30, and carrier gas linear velocity was held constant at 40 cm/second. Peaks were identified based on ratio of quantifier and qualifier ion and retention index.
Note, the of internal standards use in this study’s metabolomics analysis were the following: Citric acid d4, Fumaric acid d4, Succinic acid d6, Glucose 13C6, L-Dopa d3, Benzoic acid d5, Stearic acid d35, Lauric acid d23, Cholic acid d5, Choline d9 and Cholesterol d7. They were added at 6.67 µg per sample. All stable isotopes were purchased from Cambridge Isotope Laboratories Inc., Tewksbury, MA, USA.
Data Processing
LC-MS data were processed using MS DIAL2, including peak deconvolution, database-based identification, and retention time and mass alignment. Data were normalised using LOWESS normalisation based on a quality control sample between every ten sample injections.
Lipidomics identifications were refined based on modelling likely retention times based on lipid standards. Lipid identifications that fell outside a ±10% retention time range were considered to be incorrectly identified.
LC-MS metabolomics data was manually searched against an in-house library based on accurate mass, retention time and isotopic score using LabSolutions Insight Explore (Shimadzu).
2.6. Statistical Analysis
Cow performance (milk yield, MS yield and body weight), apparent DMI, plant chemical and botanical composition, herbage mass, and blood parameters (TAS, NEFA) were tested for normality and analysed by either linear-mixed models or generalised-linear mixed-models using the lme4 package in R studio. Models were fitted by evaluating treatment, sampling date (milk yield and milk constituents, body weight, DMI, TAS, and NEFA), and their interactions as fixed effects and using the individual animal as the experimental unit. Baseline blood metabolite profile of individuals was used as a covariate.
Two types of statistical analyses were conducted on metabolomics: (1) significance tests and (2) classification analysis. Bioactivities and potential health effects of annotated metabolites from the metabolomes were explored using in house metabolite library of AgResearch (Lincoln, New Zealand). Statistical analyses were performed in R (
https://cran.r-project.org/, accessed on 18 April 2025) and Metaboanalyst 5.0. Plant and milk metabolomic and lipidomic data were assessed using a one-way ANOVA approach. Due to the explorative characteristics of this study, differences in raw
p-values were considered significant if
p < 0.1, while the probability of FDR was considered as acceptable if <0.1. The FDR indicates the probability of a false discovery or a Type I error (the null hypothesis is excluded when in fact it is true) of multivariate testing. Due to the explorative nature of this study, we have also presented the FDR in cases where raw
p-values were >0.1 to ensure potentially meaningful results were not excluded and denoting them as ‘possible’ or ‘conjecture’ [
10,
11].
3. Results
Botanical components of each diet are displayed in
Table 1. The PRG diet consisted primarily of ryegrass (75% DM) only 4.5% of clover (predominantly white clover) and the remaining portions consisted of small amounts of forbs, weeds, and dead material. Within the CMS diet, grasses made up 43.7% of the total biomass, while legumes (white, red, and annual clovers and lucerne) forbs, brassicas, and dead material + weeds contributed 8, 39, 3.7, and 5.4% of the biomass. Botanical composition of the AMS diet reflects average DM portions across all five adjacent monocultures. The AMS diet contained 20% ryegrass, 12.7% clover (red clover), 7% lucerne, 14% chicory, 37% plantain and 6% weeds and dead material (
Table 1).
3.1. Dietary Composition
The DM content of the PRG diet was greater than that of CMS and the average DM content of all forages in AMS (
p < 0.05;
Table 2). While the OM content of individual plants was significantly different (
p < 0.05;
Table 2), the average OM content of the three diets were similar ranging 90.8–91.8% DM. The CP content of individual forages such as chicory was less than lucerne, plantain and red clover but was similar to ryegrass in both the AMS strips and within the PRG pasture. Dietary CP content tended (
p = 0.08) to decline in the CMS diet compared with the PRG and AMS diets. The content of NDF and ADF declined in the AMS diet compared with PRG and CMS tended (
p = 0.1) to be intermediary (
Table 2) although, the difference was minimal numerically. The AMS diet contained 9 and 6% less WSC (respectively;
p < 0.01) compared with PRG and CMS. The content of DOMD increased with PRG compared with CMS and AMS, although DOMD of chicory and ryegrass monocultures were comparable to PRG. The ME content also declined in the AMS and CMS diets compared to PRG (11.5, 11.7 and 12.2 ME, respectively,
p < 0.001;
Table 2).
3.2. Apparent DMI and Performance
Pre-grazing herbage masses were different between treatments (p < 0.001). On average the PRG herbage mass was less than CMS and AMS herbages, which were similar (3318, 3870 ad 3940 ± 120 kg DM/ha; p < 0.001). Post-grazing herbage mass was not different across treatments, averaging 1695, 1629 and 1631 ± 43.2 kg DM/ha for PRG × WC, CMS and AMS, respectively (p = 0.22). The daily area allocated was reduced in the CMS and AMS treatments compared to PRG. Daily herbage disappearance per cow was not different between treatments averaging 16.6, 17.6 and 17.7 ± 0.51 kg DM/cow for PRG × WC, CMS and AMS, respectively, (p = 0.11). Actual daily herbage DM allocation was the same across treatments (18.7 kg DM/ha/cow ± 0.44, p = 0.99). Based on the estimated herbage DM disappearance in each forage strip of the AMS diet, the cows consumed approximately 25, 18.5, 19.6, 16.8 and 20.1% of their daily DMI as chicory, red clover, lucerne, plantain, and ryegrass.
Dietary treatment did not alter daily milk solids (kg MS) production, MS%, somatic cell count, yield of milk fat (kg), protein (kg), or daily total yield (kg) (
p > 0.05;
Table 3). However, lactose yield increased 11% in cows fed the AMS diet compared with those fed a CMS diet, while those fed PRG were intermediate (
Table 3,
p = 0.02). Cows fed the AMS diet produced more milk protein than those fed PRG on day 17 of the trial (
Table 3;
p = 0.05). However, average milk protein yield was not altered when averaged across the entire sampling period (
p > 0.05). Compared with cows fed PRG, milk urea concentration declined 42% and 41% when cows were fed AMS and CMS, respectively, (
p < 0.01). Plasma concentration of NEFA and TAS are presented in
Table 3. There was no effect of treatment on circulating concentration of TAS (
p > 0.1). Plasma concentration of NEFA tended (
p = 0.1) to increase in cows of the CMS treatment compared to AMS (
Table 3).
3.3. Untargeted C18 Metabolomics
In total, 4547 features were identified from untargeted C18 metabolomics when run in negative ionisation mode, of which 950 metabolites were found to differ by treatment (raw
p < 0.02, and FDR < 0.1). Many of the features were tentatively classified as amino acids and amino acid derivatives, fatty acids and linoleic acid derivatives, flavonoids, phenolic acids (coumaric acids) and derivatives, stilbenes, and isoflavones. Of the 950 features identified, only 50 (5.2%) were positively matched to those in the AgResearch metabolite library. There were 21 features found to differ based on their relative intensity and fold ratio (
Table 4). The fold change in phenolic acids such as 2,6 dihydroxy-benzoic acid, salicylic,
p-coumaric, hydroxybenzaldehyde, and caffeic acid was greater in AMS, intermediary in CMS, and lowest in PRG herbage. The AMS diet increased the isoflavonoid biochanin A by 19-fold when compared with PRG and 0.37-fold compared with CMS, while other isoflavones genistein and apigenin also increased along with flavonoids such as fisetin, luteolin, and naringenin that were not detected in PRG herbage (
Table 4). The vitamin 5 analogue, pantothenate, increased marginally in AMS pasture (0.05-fold) compared with milk produced from CMS but was 2.3-fold greater than relative intensity of PRG herbage. Furthermore, saccharides D-sedoheptulose, and glycerate were also elevated in the AMS herbage compared with CMS and PRG. The CMS diet increased flavanol diosmin 46 by 1.5-fold compared with PRG and AMS milk, respectively. Diosmetin a flavone was also elevated by CMS intermediary in AMS and reduced in PRG herbage. The PRG diet produced greater content of chlorogenic acid (a PA) by 2.3-fold compared with CMS and 3.1-fold compared with AMS.
When the C-18 column was run in positive ionisation mode 548 features were detected, of which 341 were found to differ between treatments (raw
p < 0.1), 309 of these met the FDR criteria (FDR < 0.1), and the remaining 32 features were found to have FDR > 0.1 and <0.17. While identification of many of these features were not possible, tentative identification of their classes included purine and purine derivatives, flavonoids and flavonoid glycosides, phenolic acids, fatty acids, and monosaccharides. Of the 548 features identified, 69 were positively matched to the AgResearch metabolite library, 41 of which maintained a raw
p-value < 0.09 and the FDR < 0.1 except for one feature, trigonelline, which was elevated in herbage produced CMS and AMS compared with PRG (
Table 5). The AMS diet increased proline betaine, an amino acid derivative, by 32-fold and 8-fold compared with the PRG or CMS diets, respectively. Mangiferin increased 17.8-fold in the AMS diet compared with PRG, it was also 6-fold greater than the CMS diet. The RA of baicalin was 7-fold greater in AMS than PRG and 1.3-fold greater in AMS compared to CMS. Mannitol and sorbitol were both 11-fold greater in CMS and AMS compared to PRG, respectively. The RA of the flavone luteolin, was 1.9-fold greater in AMS herbage compared to PRG and 3.9-fold greater in CMS compared to PRG. Genistein was 3.6-fold greater in AMS and 2.6-fold greater in CMS than PRG and daidzein also increased in AMS and CMS compared to PRG herbage (
Table 5). 3-Hydroxymethylgluterate (3HMG) increased in CMS, was intermediary in PRG, and was lowest in the AMS diet. The RA of beta-carotene, beta-cryptoxanthin, and zeaxanthin were both slightly greater in PRG and CMS diets than AMS (
Table 5).
3.4. GCMS/MS
From GCMS analysis 166 features were identified, 51 of these were found to differ by treatment based on raw
p-values < 0.1, of which 24 were below FDR < 0.1, an additional 24 were <0.2 and the remaining were 3 features had FDR < 0.3 (
Figure 1). These compounds were predominantly dicarboxylic acids, sugar acids, phenylacetic acids, tricarboxylate acids (TCA) and amino acids. Other metabolites of interest were gamma tocopherol, which increased with AMS compared with PRG or CM and 4-Hydroxy phenyl acetic acid increased in AMS compared with PRG by 10-fold and CMS by 2-fold. The AMS and CMS forages contained 0.77-fold less putrescene than PRG. Expression of lactitol was elevated in the AMS diet by 8-fold and 2-fold compared with PRG or CMS, respectively. Tartaric acid was also increased by AMS compared with PRG and CMS (6.8-fold and 2.8-fold greater, respectively).
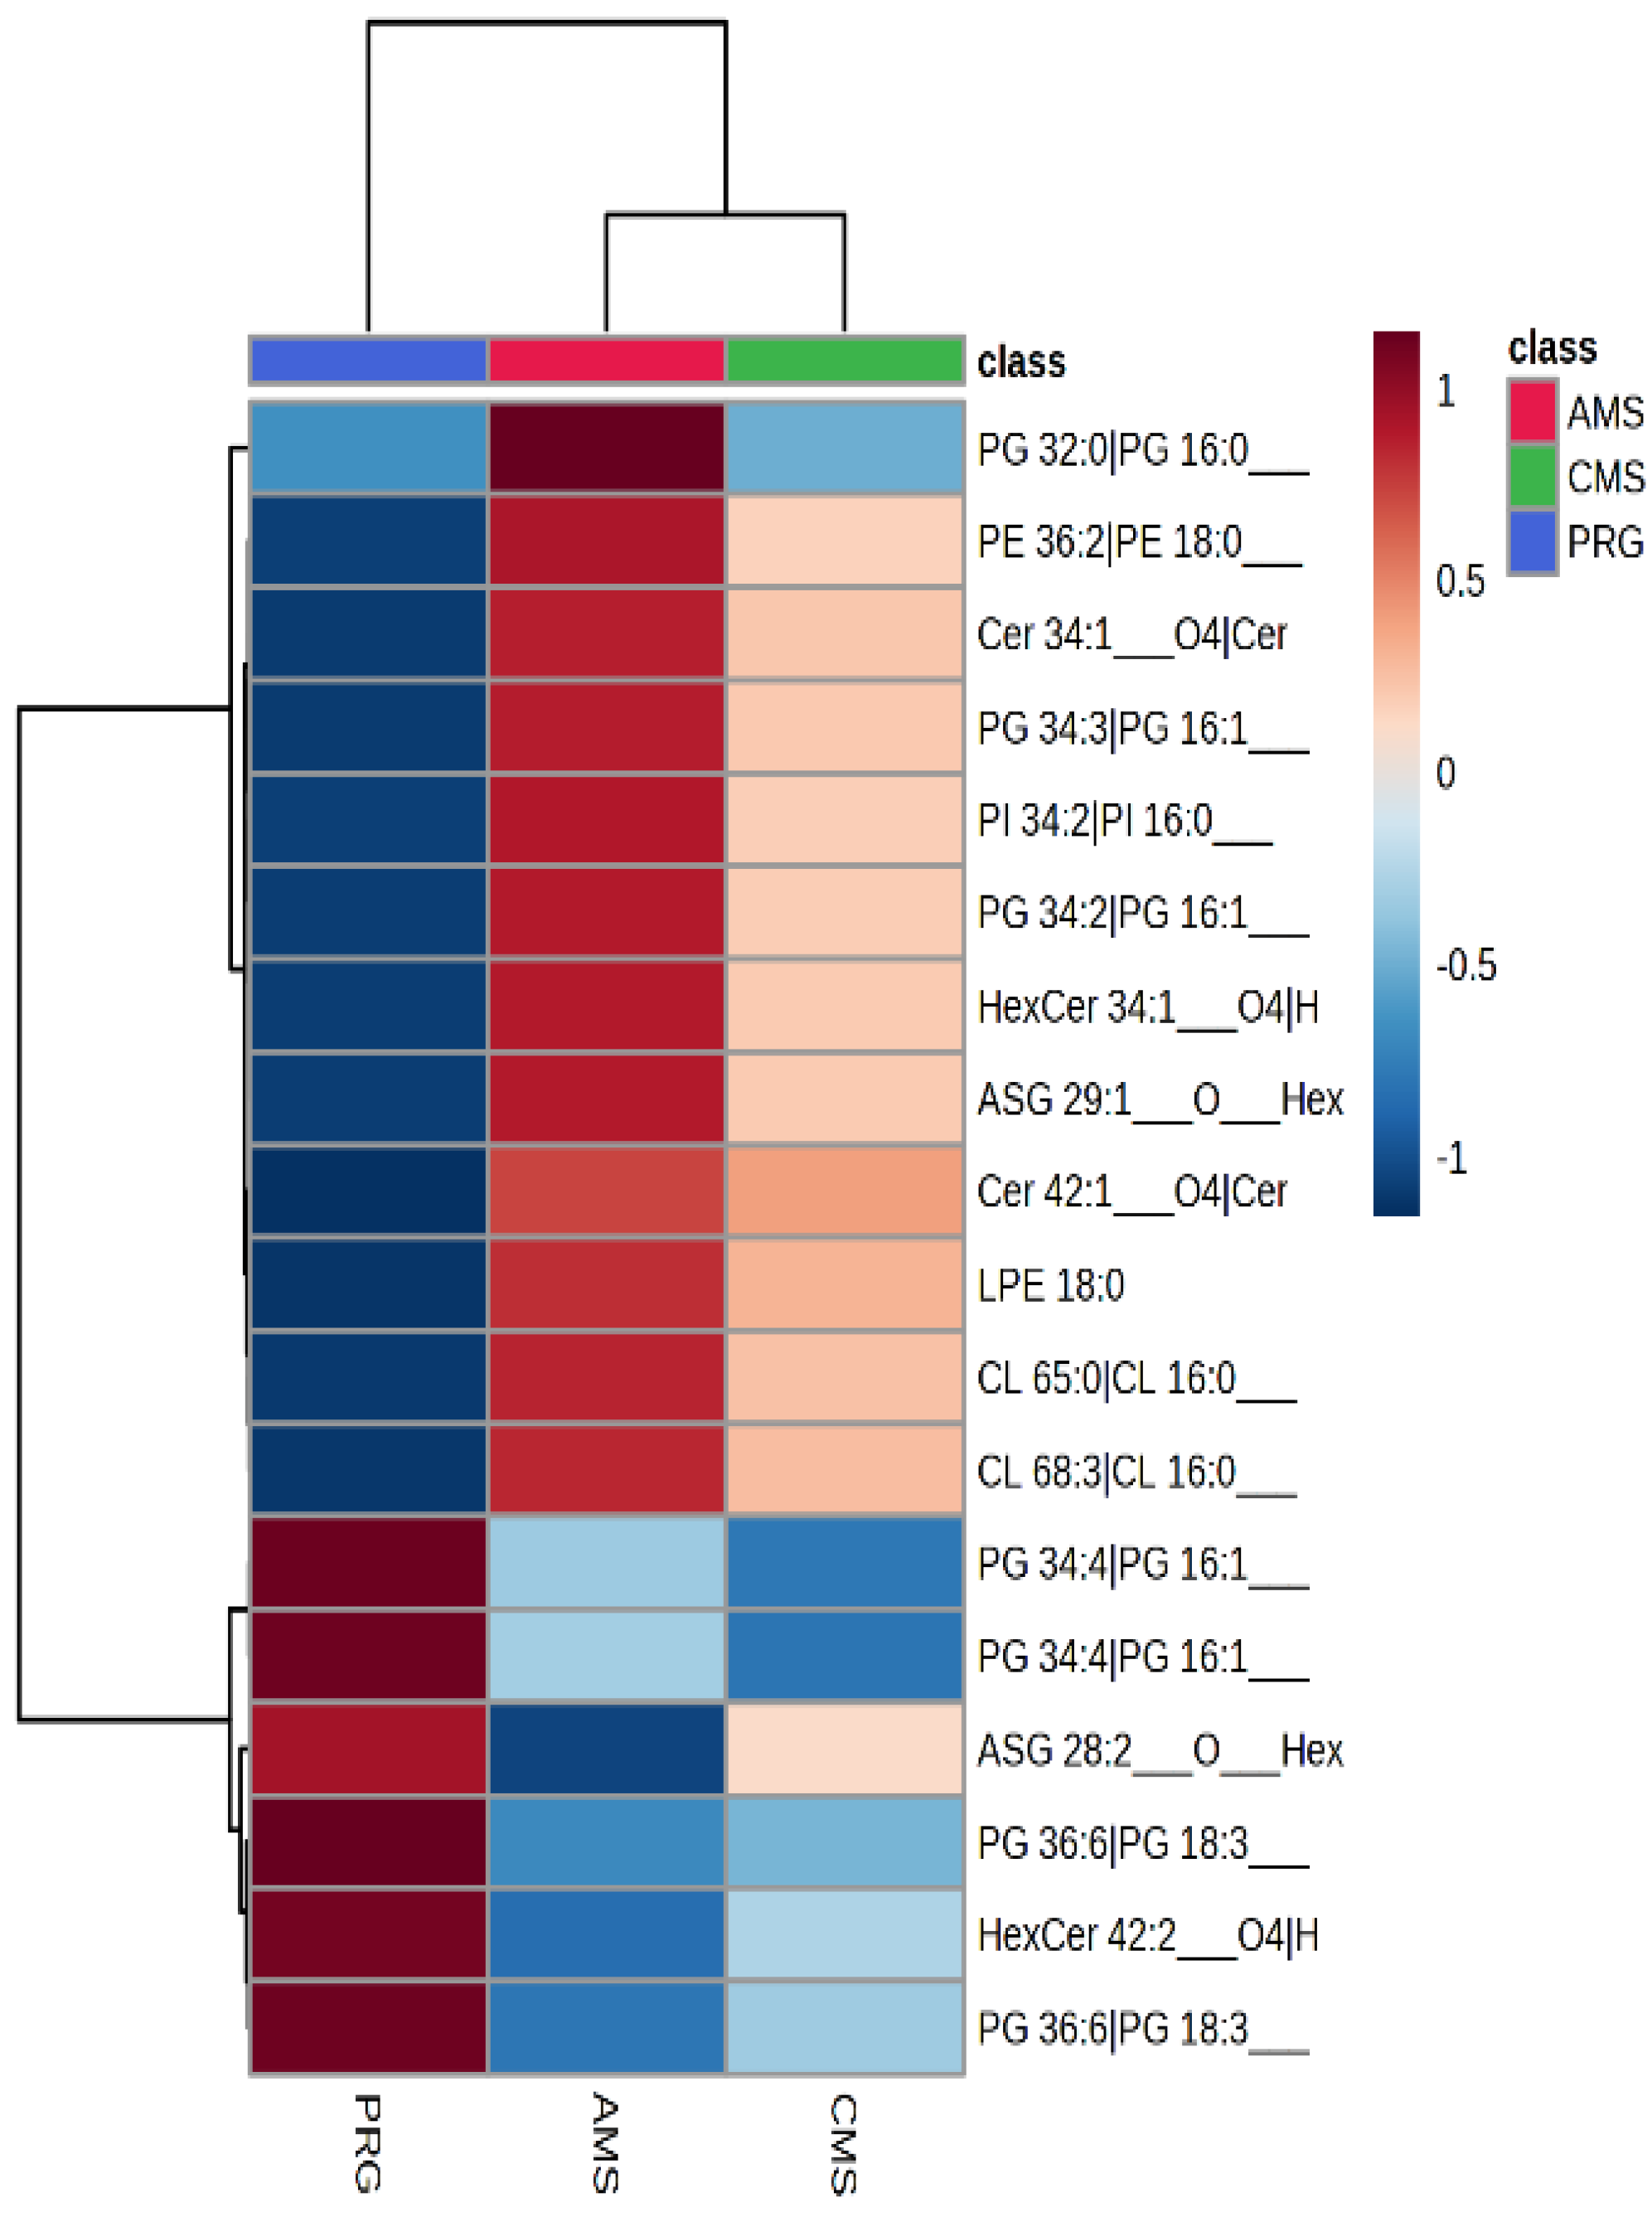
3.5. Lipidomics
From lipidomics run in negative ionisation, 1651 features were identified, and of those, 930 features were found to differ between the three forage treatments (raw
p < 0.1). From the 1.651 features found, only 43 were able to be positively matched and identified to the AgResearch library. Many were neutral glycosphingolipids, ceramides, and glycerophospholipids. All, except one ceramide, increased in AMS and CMS plant material compared to PRG. Of the 43 features that were able to be identified, 15 differed between treatment (raw
p < 0.1 and FDR < 0.1), an additional 3 features were found to differ by treatment (raw
p < 0.1), but FDR were >0.1, but <0.18. Lipids that differed included phosphatidylglycerols, glycosphingolipids, acylhexosyl brassicasterols (sterol lipids), ceramides, cardiolipins, lysophosphatidylethylamines and phosphatidylethanolamines. Many of these features were elevated in the AMS and CMS diets compared with PRG (
Figure 2). One hundred and eighty-six features were identified by lipidomics in positive mode. Of these, 65 were found to differ with treatment (
p < 0.1), and the FDR of 5 of these metabolites were less than the 10% threshold, while the FDR of the remaining metabolites < 0.28. Of those found to differ by raw
p values, all were increased in the AMS and CMS swards compared with PRG (Table 7). Some of these were sterols, triacyl- and diacyl-glycerides, and glycerolphosphacholines.
3.6. Metabolomics-Milk
Metabolomic analysis was also carried out on the milk produced from cows grazing AMS, CMS and PRG × WC as well from milk collected as representative from Hokitika and Glenavy South milk. The results indicate that there are significant differences between the milks depending on the herbage treatment.
3.7. Lipidomic Analyses
When lipidomic analyses were run in positive ionisation mode 1441 lipids were detected in milk samples, of which 165 were identifiable by their mass, fragmentation, retention time and fatty acid probability. Of the total lipids yielded (matched and unmatched), 940 differed by treatment (raw
p < 0.05, FDR < 0.08). Of these, 154 differed between experimental diets (
p < 0.05, FDR < 0.1) and an additional 541 were still within raw
p < 0.1 although FDR > 0.1 but < 0.21. Of the 165 lipids able to be identified from positive ionisation, 107 were found to differ between treatment (
p < 0.05, FDR < 0.08). An additional 23 features also tended (
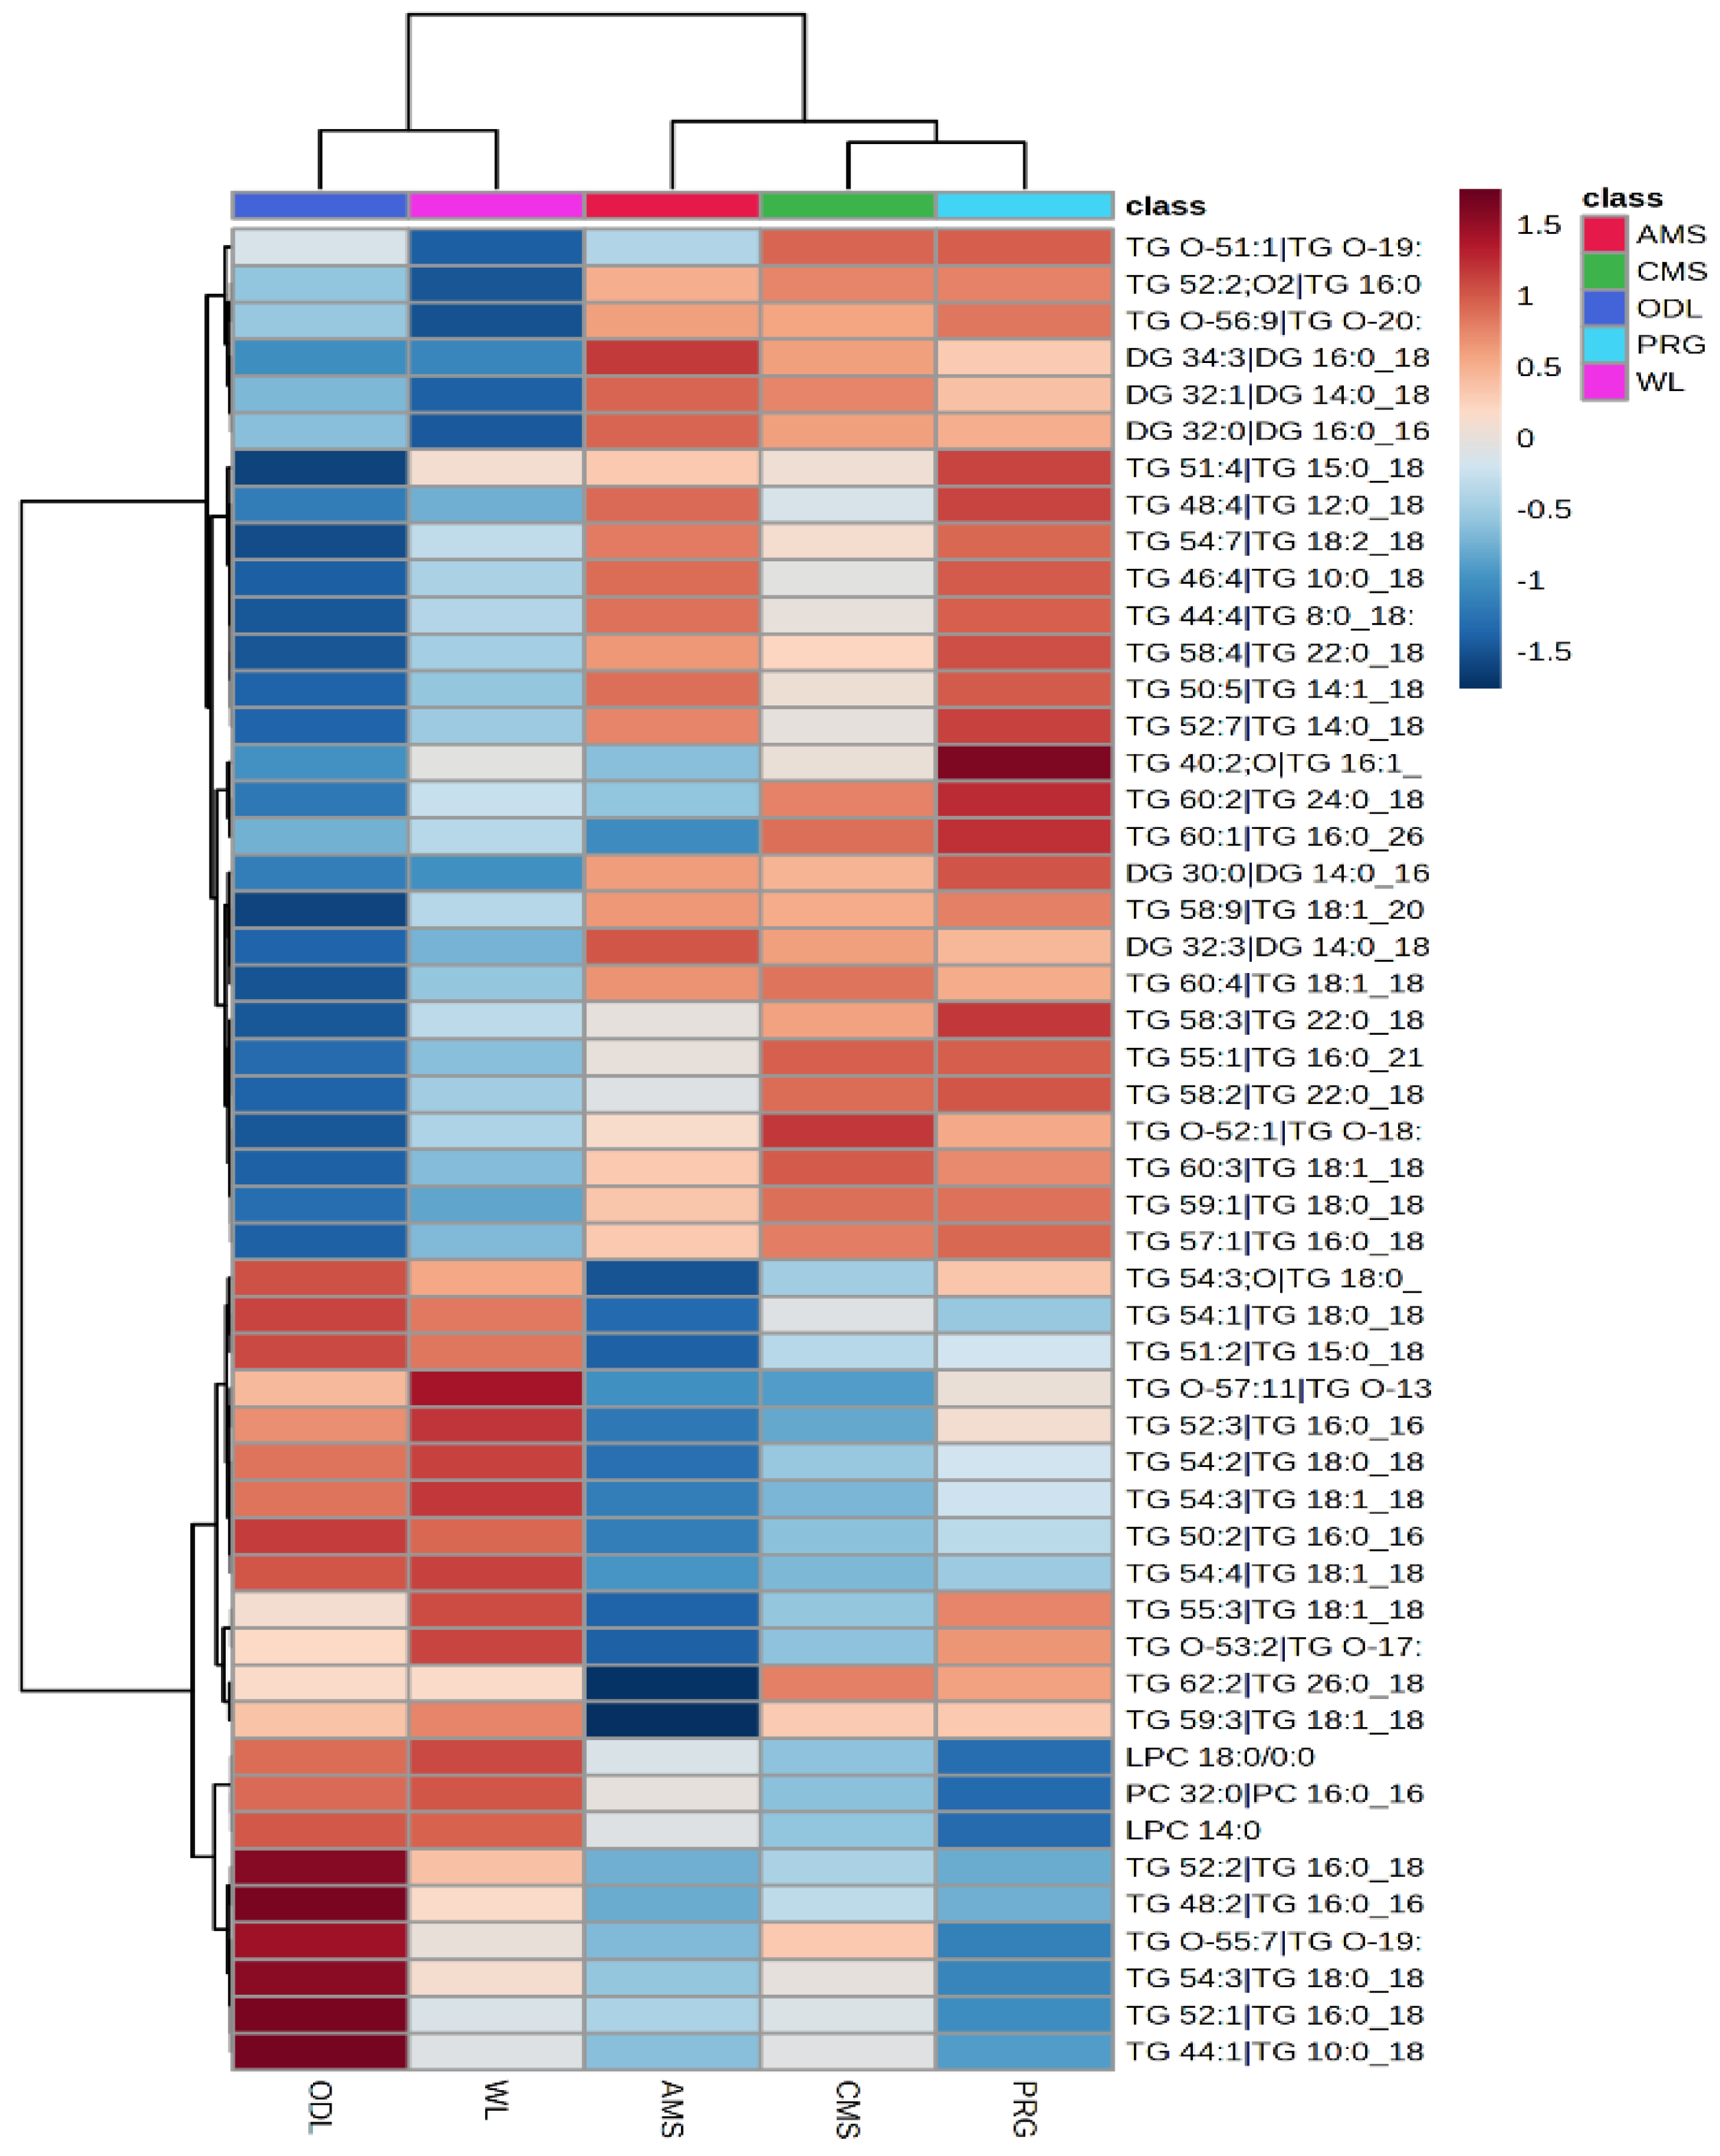
p < 0.1 > 0.05) to be different but slightly exceeded the FDR threshold by 2% (FDR = 0.12). Hierarchical clustering revealed similarities existed between the samples collected from the Lincoln trial particularly between CMS and PRG samples, while similarities also existed between Hokitika and Glenavy South milk samples (
Figure 3). However, comparison of all milk samples from the Lincoln study and those collected from Hokitika and Glenavy South milk revealed clear differences between sample sites and dietary treatments (
Figure 3). Analysis of the changes between Hokitika and Glenavy South milk samples revealed 43 TG features differed. In most instances, TG appeared slightly elevated in WL samples compared with Glenavy South milk, except for 5 features that were elevated in Hokitika samples (Bottom of
Figure 3). Between the Lincoln trial samples, 51 features differed between AMS and PRG, 20 between AMS and CMS, and 60 between CMS and PRG. A triacylglycerol (TG 62:2|TG 26:0 18:1 18:1) was reduced in the AMS milk compared with all other treatments and sites (
Figure 3,
p < 0.001, FDR = 0.01). In addition, a diacylglycerol (DG 32:3|DG14:0 18:3) was elevated by the AMS diet compared with PRG and CMS with little presence identified in both Hokitika and Glenavy South milk (
Figure 3,
p < 0.001, FDR = 0.001).
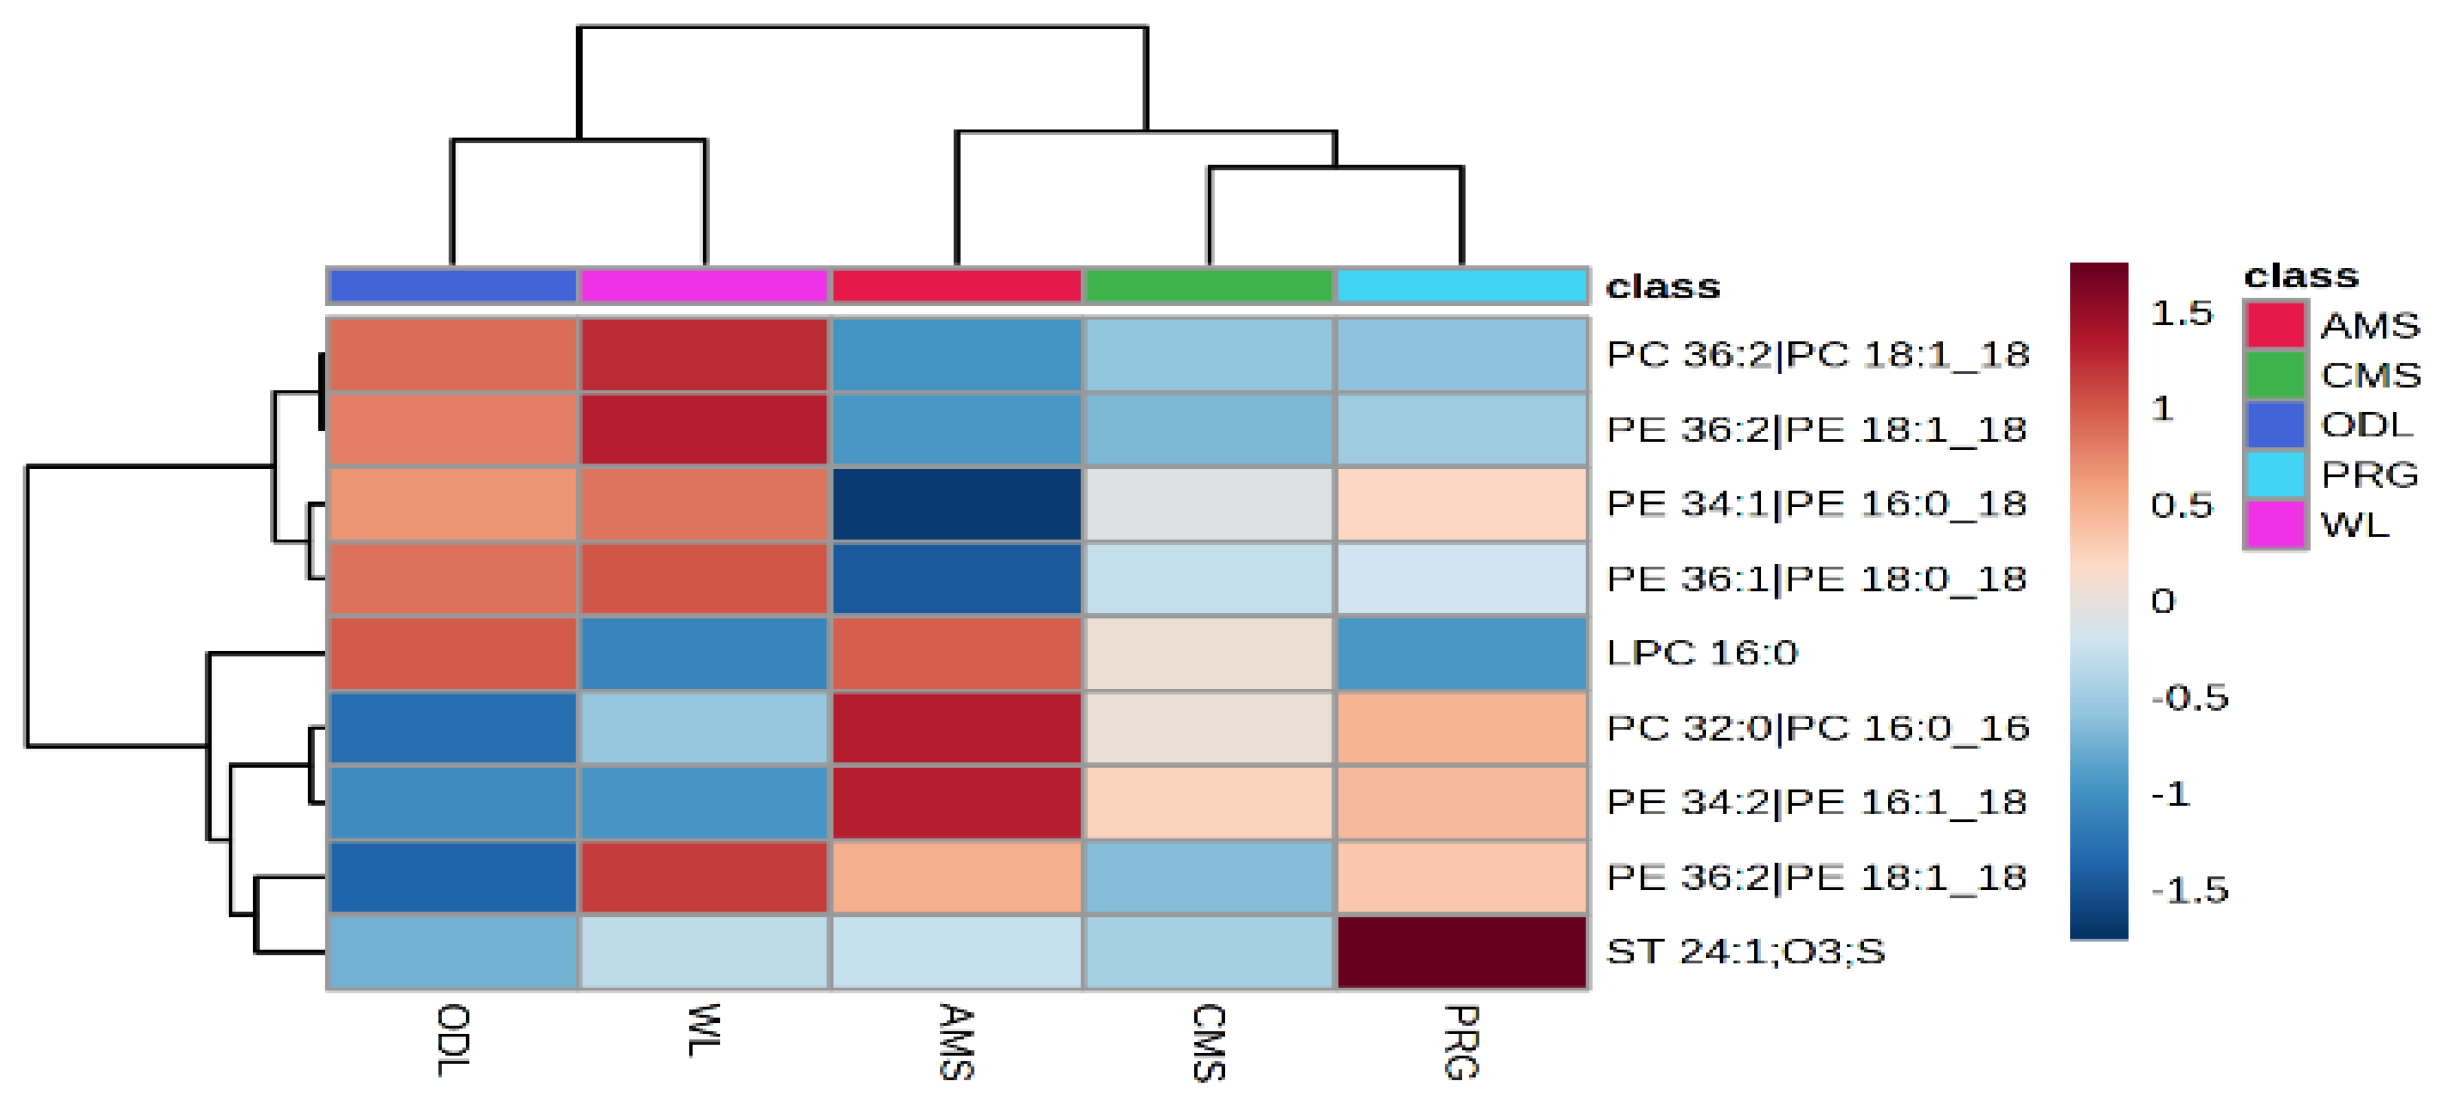
Running the column in negative mode resulted in 415 lipids, of which only 9 could be tentatively identified. Across the 415 lipids found, 207 features differed amongst treatments (
p < 0.05, FDR < 0.1), a further 25 features tended to be altered and could be of further interest (
p < 0.1 > 0.05, FDR < 0.17 > 0.1). Of the 9 features identified, 6 were found to differ by treatment and location (
p < 0.01, FDR < 0.1,
Figure 3) and the remaining three features were not different
p > 0.1. FDR < 0.16. A phosphatidylcholine metabolite (PC 36:2, PC 18:1), and three phenylethanolamine metabolites increased in both Hokitika and Glenavy South milk samples compared with the Lincoln samples (
p < 0.001 and FDR < 0.001). Alternatively, other phosphatidyl choline metabolites were elevated in the Lincoln samples compared with the other locations (Hokitika, New Zealand), and (Glenavy South Canterbury, NZ). (
p < 0.1 and FDR < 0.1,
Figure 3). Lysophosphatidylcholine (LPC 16:0), phenylethanolamine and a phosphatidylcholine metabolite increased in AMS milk compared with PRG and CMS milk.
3.8. C18 Metabolomics
A total of 66 metabolite features were identified by the C18 untargeted metabolomics when run with positive ionisation, and 18 were detected with negative ionisation. A total of 33 metabolites run in positive ionisation were found to differ by treatment (
p < 0.1, FDR < 0.1). Of the 66 features found using positive ionisation, 24 were able to be positively matched to the library database and 16 of these features differed by treatment (
p < 0.1, and FDR < 0.03). Pantothenate and phosphorylcholine all increased in AMS milk compared with all other samples (
p < 0.1,
Table 6). In addition, alpha-tocopherol increased, and trimethylamine-N-oxide tended to decline in AMS milk compared with other milk samples (
Figure 4,
p < 0.1, FDR < 0.17). The Hokitika and Glenavy South milk samples contained elevated levels of hippurate compared with Lincoln samples (
p < 0.001, FDR < 0.01). The milk from Hokitika contained lower content of carotenoid then all other milk samples (
p = 0.02, FDR = 0.03).
Of the 18 metabolites found when the column was run in negative ionisation mode, 8 were found to differ by treatment (
p < 0.1). Three features were found with FDR < 0.1 and the remaining five features had FDR < 0.16. These metabolites were glycosyl compounds, branched chain fatty acids and amino acid derivatives. Consideration of hierarchical clustering suggested that milk from PRG was similar to AMS but closer similarities between all Lincoln treatments were apparent when compared to Hokitika and Glenavy South milk, which also shared some similar feature patterns (
Figure 4). Glucose and lactose were elevated in Hokitika, intermediary in PRG and AMS and declined in WL, and CMS milk (
p = 0.08, FDR = 0.1). The metabolite 3-hydroxymethylgluterate was elevated in PRG and AMS intermediary in WL and reduced in CMS and Glenavy South milk (
Figure 4). Glucose-6-Phosphate increased in PRG and AMS compared with CMS > Glenavy South > Hokitika (
p < 0.003, FDR < 0.01). Urate was upregulated in PRG and AMS milk compared with CMS and Hokitika, while it appeared to be downregulated in WL milk (
p = 0.03, FDR = 0.07,
Figure 4).
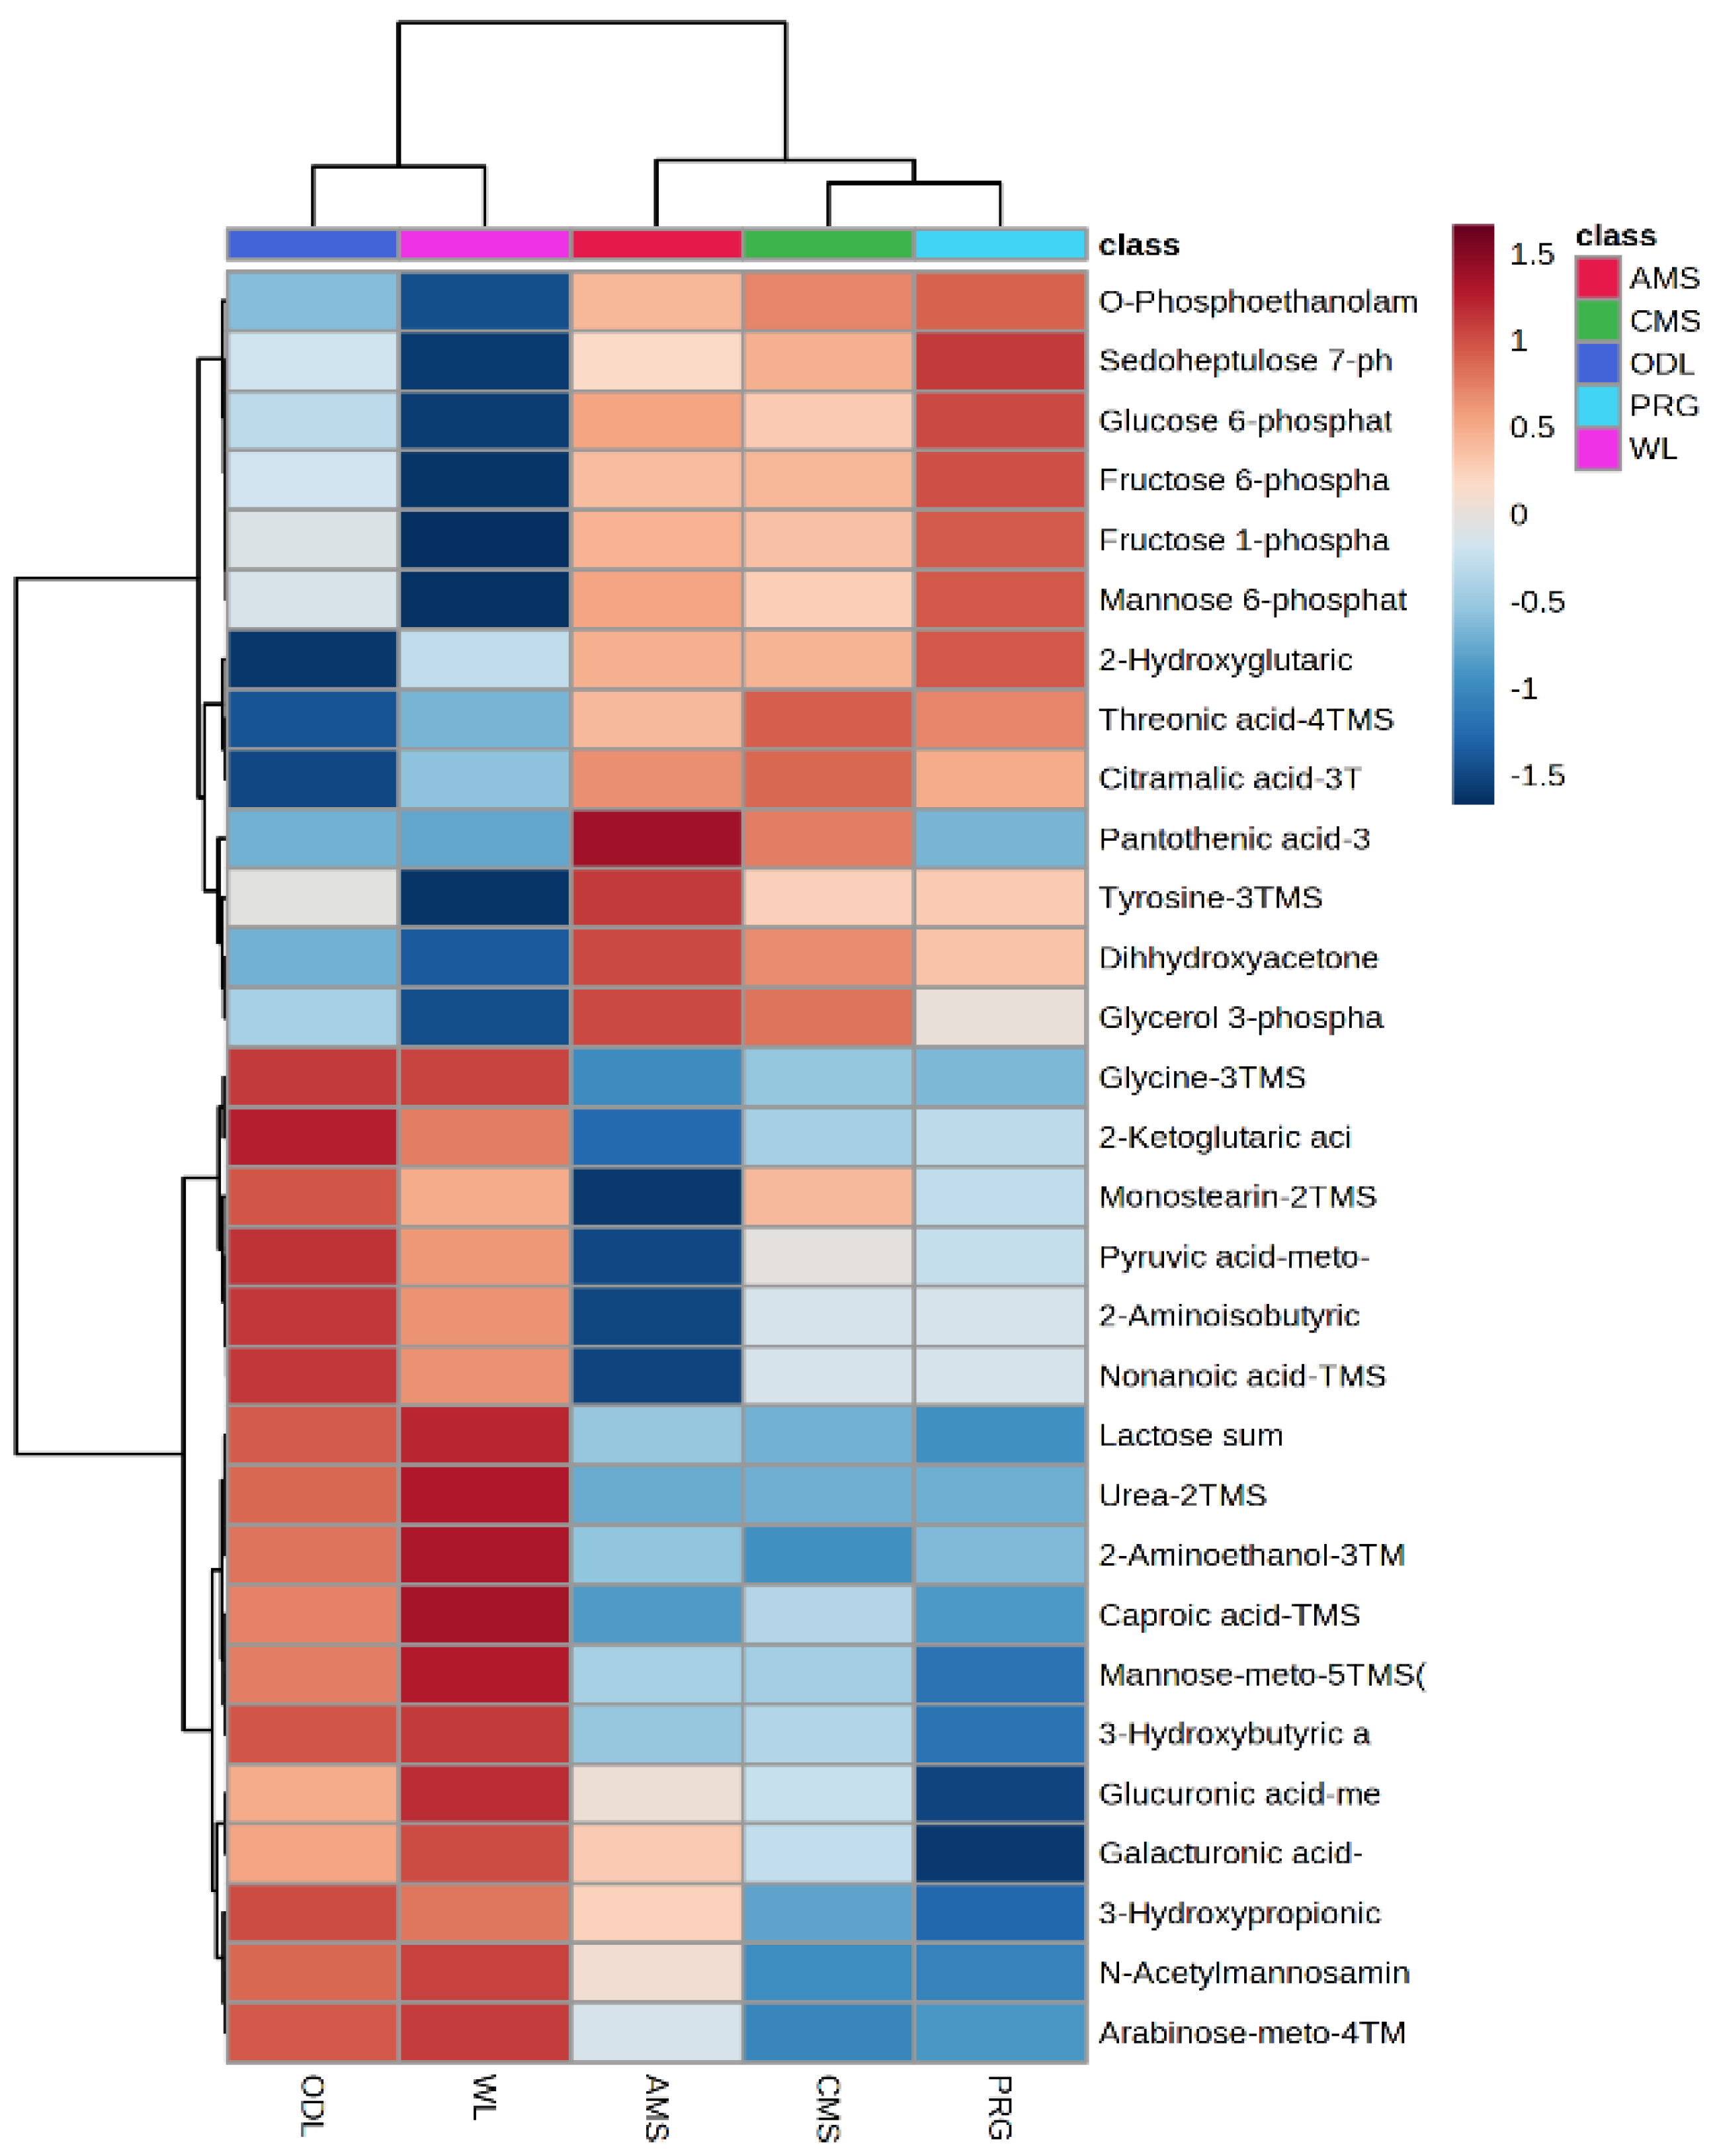
3.9. GCMS and Pathway Analysis
GCMS/MS analysis identified 53 metabolites which were predominantly associated with pathways of central metabolism. The raw
p-value indicated significant treatment differences in 31 metabolites and the FDR remained < 0.1. Hierarchical clustering suggested that CMS and PRG milk shared more similarities than AMS—although similarities between all Lincoln samples were detected when compared with Glenavy South and Hokitika milk samples which were also similar (
Figure 4). Theronic acid increased in milk produced from CMS, compared with all other treatments (
Figure 4). Pantothenic acid increased in milk produced from AMS compared with all other treatments (
p < 0.001, FDR < 0.01). Pyruvic acid declined in the AMS milk compared with CMS and PRG, while pyruvic acid increased in Glenavy South and Hokitika (
p = 0.01, FDR = 0.03). Glucuronic acid declined in PRG compared with all other treatments but was also elevated in WL milk (
Figure 4,
p < 0.001, FDR < 0.001). Sedoheptulose was elevated in milk produced from PRG compared with AMS, Glenavy South and Hokitika (
p < 0.001, FDR < 0.002), but was similar to milk produced from CMS. Monostearin declined in AMS milk compared with all other samples (
p = 0.02, FDR = 0.05). 3-Hydroxypropionic acid was elevated in AMS, Glenavy South and Hokitika milk samples compared with PRG and CMS (
p = 0.04, FDR = 0.08).
Pathway analysis of GCMS output was used to evaluate all matched pathways according to
p-values from pathway enrichment analysis and pathway impact from the pathway topography analysis. Comparison of pathway analysis between Glenavy South and Hokitika samples revealed limited variation. Variations in metabolite expression of D-Gluconolactone, sedoheptulose-7-phosphate, and D-glycerate, indicate the pentose phosphate pathway was altered although impact was low 0.02 (
p <0.001, FDR = 0.06). Pathway analyses revealed no significant differences in pathway regulation of GCMS peak intensities between AMS, CMS or PRG diets. Comparison of the variation between geographical location and milk supplier revealed 44 features that were regulated differentially between Glenavy South, Hokitika and the Lincoln University PRG treatment (LU). The RA of features that were positively matched to the Agresearch metabolite library from GCMS and semi-polar metabolomics analyses are presented (
Table 7).
Table 7.
Metabolomic pathway analysis of GCMS data of milk produced from Lincoln University trials compared with milk produced from Oceania or Westland dairies. Data presents the total compounds found in the pathway of interest; the number of hits shows the number of metabolites from a pathway that were matched in the analysis the raw p value, false discovery rate and the pathway impact value calculated from the pathway topological analysis. Pathway impact > 0.1 are considered biologically meaningful.
| Pathway | Total Compound | Hits | Raw p | FDR | Impact |
|---|
| Purine metabolism | 66 | 1 | 0.00 | 0.00 | 0.00 |
| Arginine biosynthesis | 14 | 3 | 0.00 | 0.00 | 0.06 |
| Sphingolipid metabolism | 21 | 1 | 0.00 | 0.00 | 0.01 |
| Glycerophospholipid metabolism | 36 | 3 | 0.00 | 0.00 | 0.12 |
| Butanoate metabolism | 15 | 2 | 0.00 | 0.00 | 0.00 |
| Synthesis and degradation of ketone bodies | 5 | 1 | 0.00 | 0.00 | 0.00 |
| Primary bile acid biosynthesis | 46 | 2 | 0.00 | 0.00 | 0.06 |
| Porphyrin and chlorophyll metabolism | 30 | 1 | 0.00 | 0.00 | 0.00 |
| Pentose and glucuronate interconversions | 18 | 3 | 0.00 | 0.00 | 0.38 |
| Amino sugar and nucleotide sugar metabolism | 37 | 4 | 0.00 | 0.00 | 0.16 |
| Aminoacyl-tRNA biosynthesis | 48 | 3 | 0.00 | 0.00 | 0.00 |
| Inositol phosphate metabolism | 30 | 3 | 0.00 | 0.00 | 0.13 |
| Glycine, serine and threonine metabolism | 34 | 4 | 0.00 | 0.00 | 0.29 |
| D-Glutamine and D-glutamate metabolism | 5 | 1 | 0.00 | 0.00 | 0.00 |
| Glycerolipid metabolism | 16 | 3 | 0.00 | 0.00 | 0.14 |
| Ascorbate and aldarate metabolism | 10 | 2 | 0.00 | 0.00 | 0.25 |
| Glutathione metabolism | 28 | 4 | 0.00 | 0.00 | 0.10 |
| Glyoxylate and dicarboxylate metabolism | 32 | 5 | 0.00 | 0.00 | 0.49 |
| Pentose phosphate pathway | 22 | 3 | 0.00 | 0.00 | 0.03 |
| Starch and sucrose metabolism | 18 | 2 | 0.00 | 0.01 | 0.16 |
| Tyrosine metabolism | 42 | 2 | 0.00 | 0.01 | 0.14 |
| Neomycin, kanamycin and gentamicin biosynthesis | 2 | 1 | 0.00 | 0.01 | 0.00 |
| beta-Alanine metabolism | 21 | 2 | 0.00 | 0.01 | 0.40 |
| Propanoate metabolism | 23 | 2 | 0.00 | 0.01 | 0.00 |
| Pyruvate metabolism | 22 | 1 | 0.01 | 0.01 | 0.21 |
| Glycolysis/Gluconeogenesis | 26 | 1 | 0.01 | 0.01 | 0.10 |
| Cysteine and methionine metabolism | 33 | 1 | 0.01 | 0.01 | 0.00 |
| Citrate cycle (TCA cycle) | 20 | 3 | 0.01 | 0.01 | 0.20 |
| Alanine, aspartate and glutamate metabolism | 28 | 3 | 0.01 | 0.01 | 0.05 |
| Fructose and mannose metabolism | 20 | 2 | 0.01 | 0.01 | 0.19 |
| Pantothenate and CoA biosynthesis | 19 | 2 | 0.01 | 0.01 | 0.03 |
| Phenylalanine, tyrosine and tryptophan biosynthesis | 4 | 1 | 0.01 | 0.01 | 0.50 |
| Ubiquinone and other terpenoid-quinone biosynthesis | 9 | 1 | 0.01 | 0.01 | 0.00 |
| Phenylalanine metabolism | 12 | 1 | 0.01 | 0.01 | 0.00 |
| Steroid biosynthesis | 42 | 1 | 0.03 | 0.04 | 0.03 |
| Steroid hormone biosynthesis | 75 | 1 | 0.03 | 0.04 | 0.01 |
| Pyrimidine metabolism | 38 | 1 | 0.03 | 0.04 | 0.00 |
| Arginine and proline metabolism | 38 | 4 | 0.03 | 0.04 | 0.22 |
| Galactose metabolism | 27 | 2 | 0.08 | 0.09 | 0.05 |
| Phosphatidylinositol signalling system | 28 | 1 | 0.12 | 0.13 | 0.04 |
| Lysine degradation | 25 | 1 | 0.72 | 0.72 | 0.00 |
| Biotin metabolism | 10 | 1 | 0.72 | 0.72 | 0.00 |
3.10. Milk from the Other Locations (Hokitika, New Zealand), and (Glenavy South Canterbury, NZ)
The milk from the other locations (Hokitika, New Zealand), and (Glenavy South Canterbury, NZ) contained elevated levels of urea, 3-hydroxybutyric acid, N-acetyl mannose, mannose, glycine, glucosamine, galacturonic acid, 2-ketoglutaric acid, pyruvic acid, O-acetyl carnitine, and oroate compared to the milk produced from the PRG treatment at the LU site. In contrast Hokitika and Glenavy South milk samples contained lower levels of caproic acid (a C:6 FA), glucuronic acid, dihydroxyacetone, pantothenic acid, glycerol 3-phosphate, mannose 6-phosphate, 2-hydroxyglutaric acid, fructose 1-phosphate, citramalic acid, 3-hydroxypropionic acid, arabinose, b-ionone, phosphorylcholine, glycochenodeoxycholate, carnitine, carotenoid and urate (
Table 6;
p < 0.1, FDR < 0.15). Evaluation of the impact of site location on pathway mapping between LU and Glenavy South + Hokitika milk suggests the expression of 38 metabolic pathways were altered (
Table 7,
p < 0.08, FDR < 0.09). Glyoxylate and carboxylate metabolism appeared to be particularly altered as impact values were high (0.49) due to elevated expression of citrate, pyruvate, glyoxylate, glycine, and D-glycerate in the milk collected from Glenavy South + Hokitika milk milk. In addition, the tricarboxylic acid (TCA) cycle was altered by increased pyruvate and ketoglutaric acid in milk produced from Hokitika and Glenavy South milk compared to LU. The TCA or citric acid cycle is a key pathway in cellular respiration as it is the primary pathway that acetyl-CoA which is derived from fats, carbohydrates, and protein, is oxidised to generate adenosine triphosphate (ATP). The increase in pyruvate in milk from Glenavy South + Hokitika milk compared to LU, may indicate that ruminal fermentation patterns favoured propionic acid formation as it is the primary substrate for gluconeogenesis in ruminants, of which, glucose is an intermediary to pyruvate and through metabolism by the TCA cycle will produce 32 ATP molecules compared to 12 ATP molecules produced from acetate. Elevated pyruvate and fermentation patterns that favour propionate indicate the diet quality of Glenavy South + Hokitika milk may have been greater than the high quality (12 MJ ME/kg DM) perennial ryegrass pasture fed to the LU cows.
Hippurate—a N metabolite was also found in greater levels in milk produced from Glenavy South and Hokitika milk systems compared to LU. Hippurate has been identified as a metabolite that differentiates milk and meat produced from pasture instead of a total-mixed-ration diet. The formation of hippurate occurs from fermentation of phenolic acids in the rumen, and it is also associated with high CP and low lignin diets as phenolic acids which are formed in the cell wall are more soluble [
12]. The elevated levels of hippurate in milk produced from Glenavy South + Hokitika milk further indicate that these suppliers are producing milk from a ‘highly digestible pasture’. Further investigation of this metabolite is needed to evaluate its’ role as a potential biomarker of pastoral grazing systems. Elevated Hippurate and metabolites associated with the TCA cycle are evidence that cows are functioning at a high metabolic rate or a high level of performance.
Glucosamine was also elevated in Hokitika and Glenavy South milk compared to the PRG treatment from LU. Glucosamine plays important functions in joint health and has been found to improve the range of motion of knee joints [
13,
14]. Glucosamine is also used to treat and prevent osteoarthritis through chondroprotective and anti-inflammatory actions [
13]. Joint health and function are becoming increasingly important to maintaining mobility of an ageing population. The impairment of the musculoskeletal system (including muscles, nerves, joints and bones) is responsible for 20% of factors that lead to elderly individuals requiring assistance for everyday activities [
15]. The protection of the musculoskeletal system may also help to increase the healthy-life expectancy (period during which an individual can perform daily living activities free from health problems) of the ageing population [
15]. Glucosamine-enhanced milk may provide a nutraceutical benefit to musculoskeletal health as it also contains milk fat globule membrane (MFGM), a structural membrane covering the triglycerides in milk which contains a complex mixture of proteins, carbohydrates, phospholipids, and sphingolipids [
16]. Research suggests that the combination of glucosamine with MFGM can improve joint function and physical performance [
15]. Milk, which naturally contains MFGM and has enhanced levels of glucosamine may provide a market opportunity for improving mobility and joint health and subsequently the healthy-life expectancy of elderly or ageing individuals. However, quantification of glucosamine concentrations of Hokitika and Glenavy South milk and the factors contributing to the elevated levels observed currently require further evaluation.
4. Discussion
The main objective of the research was to investigate the metabolomic profiles of three pasture diets and evaluate metabolomic changes in the milk of grazing dairy cows. A second objective was to compare the metabolomic profiles of milk from the short-term grazing study with milk from two processing plants and their supplying farms. Metabolomic profiles indicate clear differentiation in untargeted lipidomic and C-18 spectra. While most metabolites that differed with dietary treatment were unable to be positively matched—they still support the hypothesis that not only do diverse swards alter metabolism of grazing livestock, but that grazing management can be used to manipulate livestock metabolism to improve the nutraceutical profile of milk.
Lipidomic profiles showed the greatest differentiation between Hokitika and Glenavy South milk and dietary treatment. A total of 1215 metabolites changed across the experimental treatments—which was 65% of the total number of lipid metabolites identified. Milk lipids are a highly diverse chemical class containing hundreds of thousands of species, although structural identification of milk lipids is still in the early stages and many of these species are yet to be recognised [
17]. The lipids positively matched DG and TG species with variations in FA attachments. Clear patterns differentiated Hokitika and Glenavy South milk from the Lincoln studies. Except for a group of TG which were present at greater relative intensity in Hokitika compared to Glenavy South milk. These species contain saturated myristic, palmitic, and stearic FA chains. Saturated FAs are generally considered to have negative impacts on consumer health in some limited studies, and the consumer perception of saturated FAs are negative—although they may not be a reflection of the free fatty acid composition of milk.
Several lipid species such as lysophosphatidylethanolamine 16:0 (LPE) was elevated in the AMS sward. LPE is a phospholipid found in cell membranes that functions as a signalling molecule for plant immunity and is applied to crops as a natural ripening agent, although it also prevents senescence potentially by inducing the synthesis of salicylic acid—a potent antioxidant [
18]. Phospholipids such as LPE 16:0 consist of a hydrophilic head group and one hydrophobic fatty acid tail. They play several roles involved in maintaining structural integrity of cellular membranes and organelles, in addition to brain function—as the brain is a lipid rich organ [
19]. While investigation of the biological function of structurally different lipids (such as LPE 16:0 and LPE 18:2) is novel, preliminary data suggests that LPE 16:0, stimulated neuronal outgrowth—important for regeneration of neuronal networks following brain trauma or disease, following the exposure of pertussis toxin [
19]. However, ref. [
20] reported that increased LPE 16:0 also delayed the neuronal growth of mouse cerebral cortex cells recovering from transient middle cerebral artery occlusion by promoting intracellular calcium influx. Further evaluation of the significance of lipid and FA composition and quantification is needed to elucidate the relevance of the change in lipid patterns that were observed across dietary treatments.
The relative intensity of pantothenate increased in plant material of the AMS treatment and this directly increased the relative intensity of pantothenate in AMS milk, compared to PRG. Pantothenate is a B-vitamin (vitamin B5) synthesised from pantonic acid and β-alanine and is converted into acetyl CoA and acyl carrier proteins, which are vital to several metabolic pathways such as the TCA cycle and the metabolism of fatty acids [
21,
22]. Pantothenate has been studied as a cholesterol reducing agent– due to its’ role in beta oxidation and fatty acid metabolism. Chen et al. [
21] reported circulating TG concentration in patients with minor dyslipidaemia declined 17% when pantothenate was administered, while administration of beta-alanine reduced TG concentration by 26%. It has also been reported as an antioxidant used to reduce low-grade inflammation associated with the early stages of heart disease [
23]. This result provides evidence that certain metabolites of nutraceutical interest can be metabolised by ruminants and produced in milk.
Glycerate, which increased in the plant material of AMS, plays several roles as an energy source in central metabolism. Glycerol can be used to produce 3-Hydroxypropionic acid [
24], which was observed to be increased in AMS milk. This reaction has found to be catalysed by bacteria and involves two steps where glycerol is converted by coenzyme B
12-dependant glycerol dehydratase into 3-hydroxypropionaldehyde, which is then converted to 3HP by an aldehyde dehydrogenase [
25]. A second pathway of bacterial metabolism of glycerol is initially being oxidised to dihydroxyacetone and then phosphorylated to glycerol-3-phosphate by glycerol-3-dehydrogenase (G3DH), which were also both increased in the AMS milk. Previous studies have indicated that elements of the glycolytic pathway, particularly G3DH, is a prominent protein in the rumen proteome. Bacterial phyla that contribute to this process include Firmicutes, Ruminococcaeae and Lachnospiracaea as well as Bacteriodetes, Proteobacteria, Spirochetes and Fibrobacteres [
26]. Therefore, rumen bacterial metabolism likely also influences the metabolomic profiles of milk and the observed increased conversion into downstream products in the present study, indicates that there may be altered microbial activity within the rumen. This potential impact on the rumen microflora, requires further exploration which could involve coupling metabolomics with microbiome studies.
The AMS diet reduced Trimethylamine-N-oxide (TMAO) levels in milk compared with CMS and PRG. The milk from Hokitika also contained lower content of TMAO compared with other milk samples. Trimethylamine-N-oxide is an amino oxide derived from choline, carnitine, and phosphatidylcholine by microflora in the human gut [
27]. Circulatory TMAO is positively related to increased risk of major cardiovascular events and reflects altered cholesterol, bile acid metabolism, inflammatory pathway activation, and promotion of foam cell formation [
28]. The consumption of TMAO is also reported to increase incidence in metabolic dysfunction associated fatty liver disease [
27]. It is reported to reduce cholesterol absorption leading to atherosclerosis, reduced CV and kidney health, risk of type II diabetes, and reduced bile acid production. In the current study, metabolic pathway analyses indicated that bile acid metabolism alterations could explain the difference observed between Lincoln and Hokitika and Glenavy South samples. It should be noted that while metabolic pathway analysis did not reveal any direct differences between AMS and PRG samples, this may be due to the limited sample size and should not be ruled out until a larger study confirms the same result.
Carnitine and betaine were also reduced across all three treatments in the Lincoln trial milk compared with the other sites. Microbial metabolism of L-carnitine and betaine (a product of choline oxidation) yields the trimethylamine used to produce TMAO, and is a metabolite associated with poor consumer health outcomes from red meat and milk [
29,
30]. Therefore, the decline in carnitine and betaine in milk samples of cows grazing AMS may be in-part, explained by the altered metabolism of L-Carnitine and betaine compared with other dietary treatments. However, additional factors may also have altered metabolism of TMAO such as ruminal and microbiome function and these require further investigation. Microbiome analysis of populations associated with TMAO production suggests the primary populations include:
Bacteroidetes (
Prevotella 7,
Prevotella 2, an uncultured
Prevotellaceae); five
Firmicutes [
Mitsuokella,
Ruminococcaceae NK4A214 group (
Ruminococcus) torques group, (
Bacteroides)
pectinophilus group,
Eisenbergiella]; three
Proteobacteria (
Bilophila,
Desulfovibrio, uncultured
Rhodospirillales); and one
Fusobacterium [
27]. Milk, meat, and eggs are generally high in precursory TMAO metabolites such as L-carnitine [
31]. Therefore, the potential ability to reduce these products in milk or meat through grazing management represents an exciting opportunity to further enhance consumer health outcomes from meat and milk.
The botanical composition showed that the AMS diet did not reach the target allocation (20%) of all monocultures, and difficult conditions during establishment led to reduced allocation of forages such as red clover and lucerne being offered. Although, total apparent DMI were similar across dietary treatments and milk production was also not altered by treatment. The CP content tended to be greater in the AMS and PRG diets compared with the CMS pasture. Despite the similar content of CP in the AMS and PRG diet, the milk urea content of AMS and CMS milk declined 40% compared with cows fed PRG. Furthermore, a significant treatment by day interaction was observed, which reflected an increase in kg milk protein produced by cows fed AMS compared with those fed PRG. While the dietary CP content of the AMS diet appeared to be similar to CMS and PRG, the cows which grazed the AMS were observed to graze the forage strips selectively and showed a partial preference for chicory, red clover and lucerne compared with the ryegrass and plantain strips. However, there was limited availability of red clover lucerne; therefore, these high protein plant species represented less than 10% of DM available. Previous research has shown that forage mixtures including chicory, plantain, high-sugar ryegrass, lotus and white clover reduced urinary N excretion by 19%. It is expected that the low CP content of chicory will have reduced the intake of CP but the total intake of chicory only represented 27% of daily estimated DMI, which does not explain why milk urea nitrogen (MUN) declined 40% in the AMS diet. Furthermore, the CMS sward contained all species of the AMS sward, but did not reduce the MUN to the same extent. While bioactive monoterpenes in plantain have been highlighted as agents that reduce urinary N excretion (through partitioning urinary N into faecal N), plantain only represented 14% of DMI estimates in AMS cows and would not be expected to reduce UN to the observed levels.
Despite the low MUN levels, cows fed the AMS diet maintained their milk solid and milk protein production throughout the experimental period, suggesting they may have experienced altered ruminal fermentation and microbial protein synthesis. Urea N is synthesised in the liver from NH
3 produced in the rumen when there is an imbalance between degradation of dietary N and the microbial uptake of N results in an excess of NH
3. Urea N equilibrates across all bodily fluids and a reduction in milk urea reflects urinary urea N concentrations, which could have environmental benefits by reducing N leaching in waterways and volatilisation into N
2O [
12]. The reduction in dietary N intake is reported to improve N-utilisation efficiency as 81–91% of urea is recycled into the GIT through the portal circulation—which may explain why the apparently low CP diets did not impact milk protein or milk production [
32]. Further investigation of ruminal fermentation patterns and with a larger sample number are needed to better understand the impact of AMS and CMS swards on milk production and urea N concentrations for their potential environmental benefits.
Metabolites such as mangiferin and several phenolic compounds were increased particularly in the AMS herbage. While we were unable to identify how changes in the intake of these metabolites may have influenced cow metabolism (through milk metabolomics), continued analysis of the current data set may yield additional results. Mangiferin (commonly found in bark and leaves of the Mango tree) is a polyphenolic compound that is reported as a metabolite that can reduce the onset of metabolic diseases in animal studies [
33]. It has several antioxidants, antimicrobial, antidiabetic, antiallergic, anti-cancer, hypocholesterolemic, and immunomodulatory benefits [
34]. Therefore, plant, rumen and livestock metabolism and consumer health implications should be explored.


