
Estimation of Individual Glucose Reserves in High-Yielding Dairy Cows


Abstract
:
1. Introduction
2. Materials and Methods
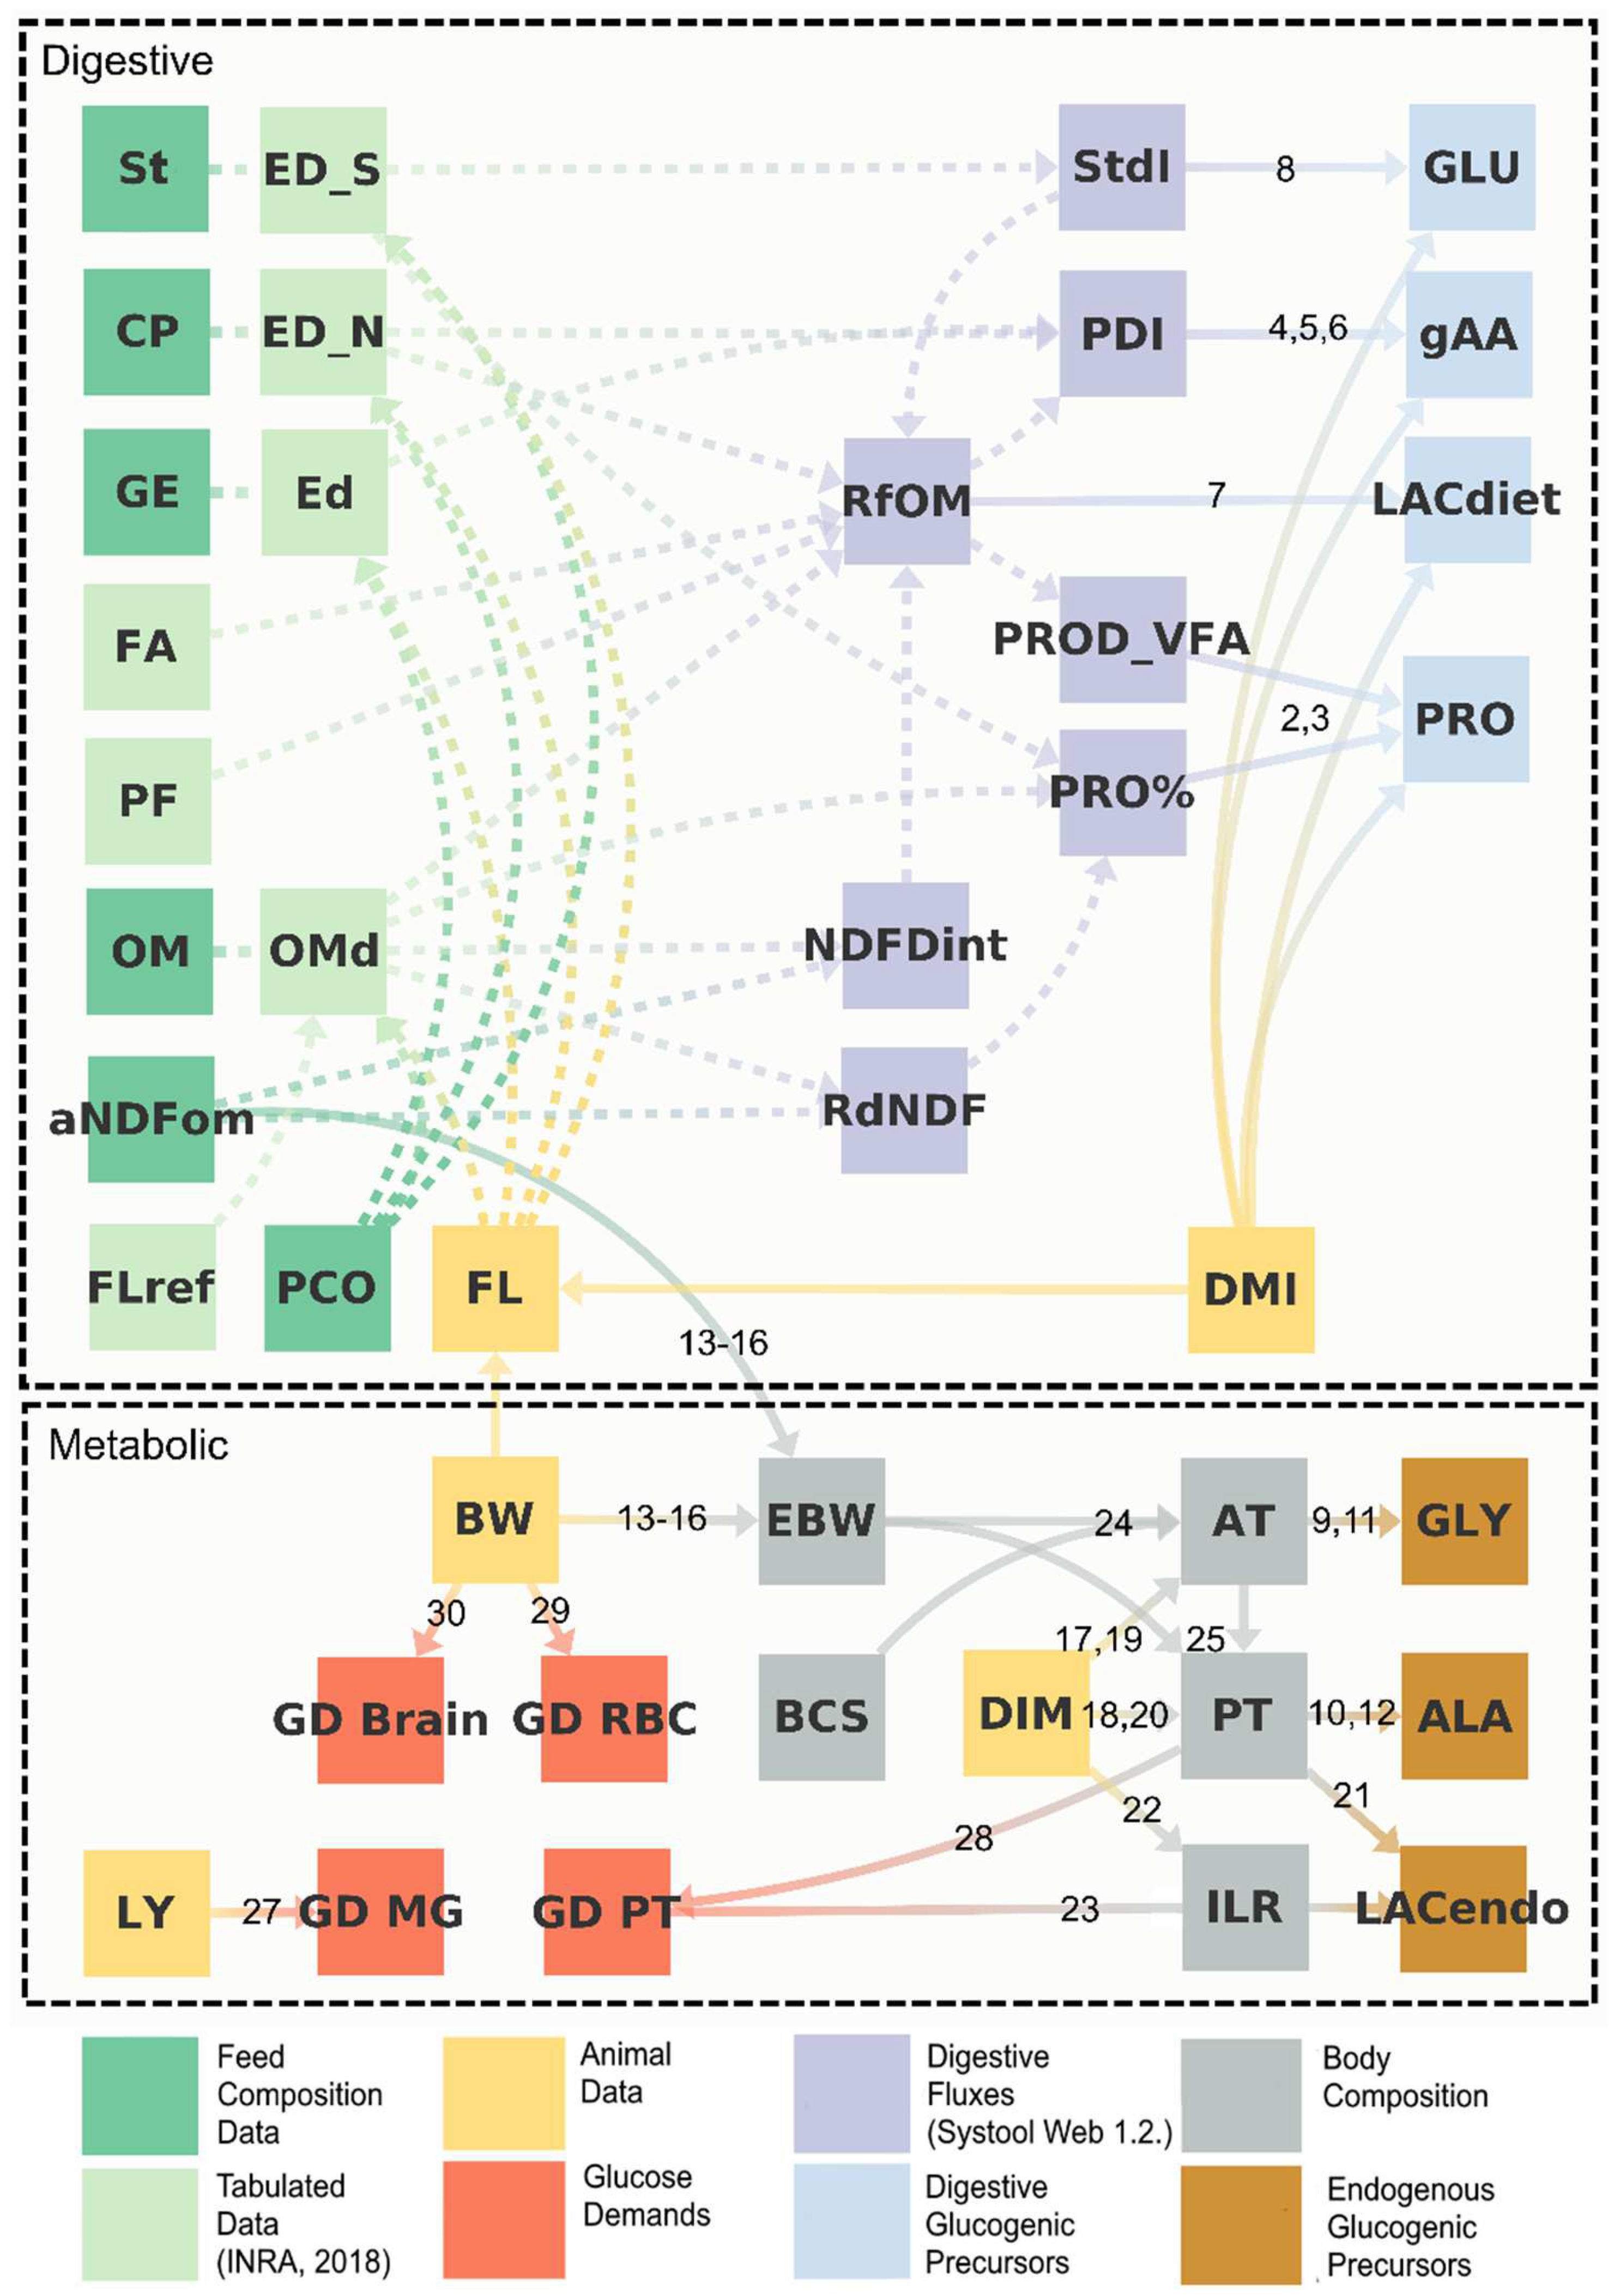
2.1. Model
2.1.1. General/Overview
2.1.2. Digestive and Portal Flows of Glucogenic Nutrients

| No | Variable | Equation | Reference |
|---|---|---|---|
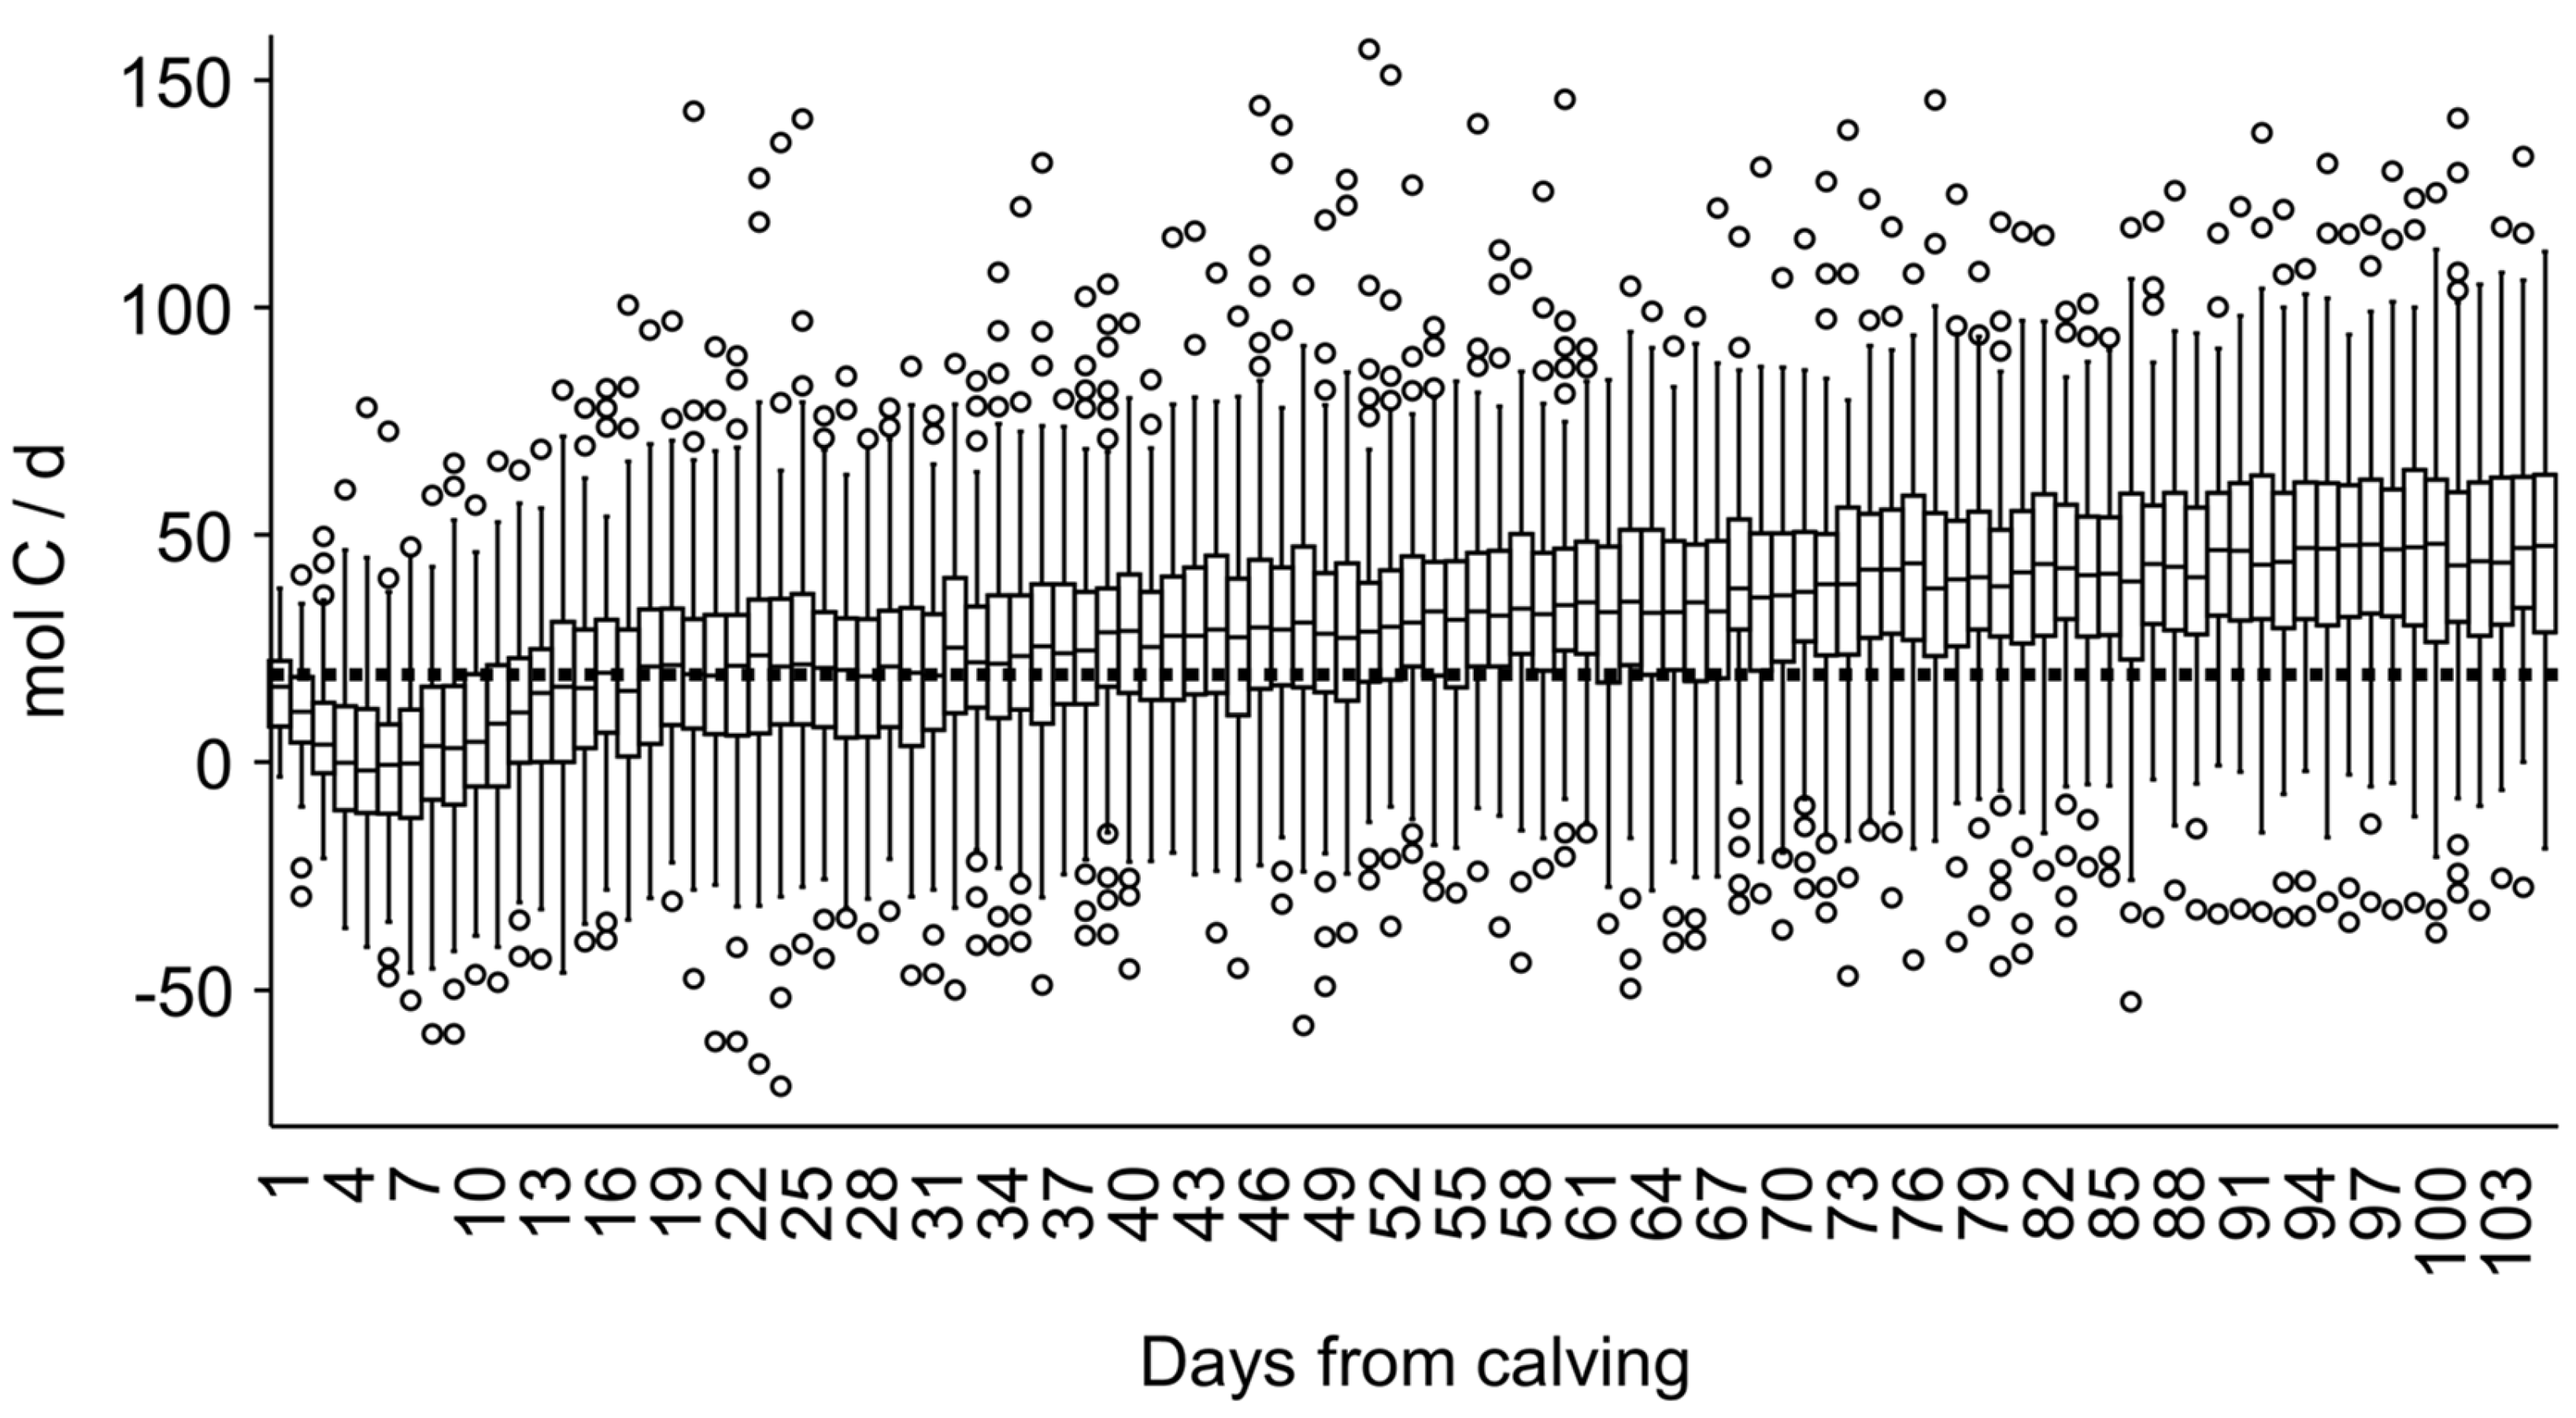
| (1) | Glucose balance (GB; mol C) | GS–GD | |
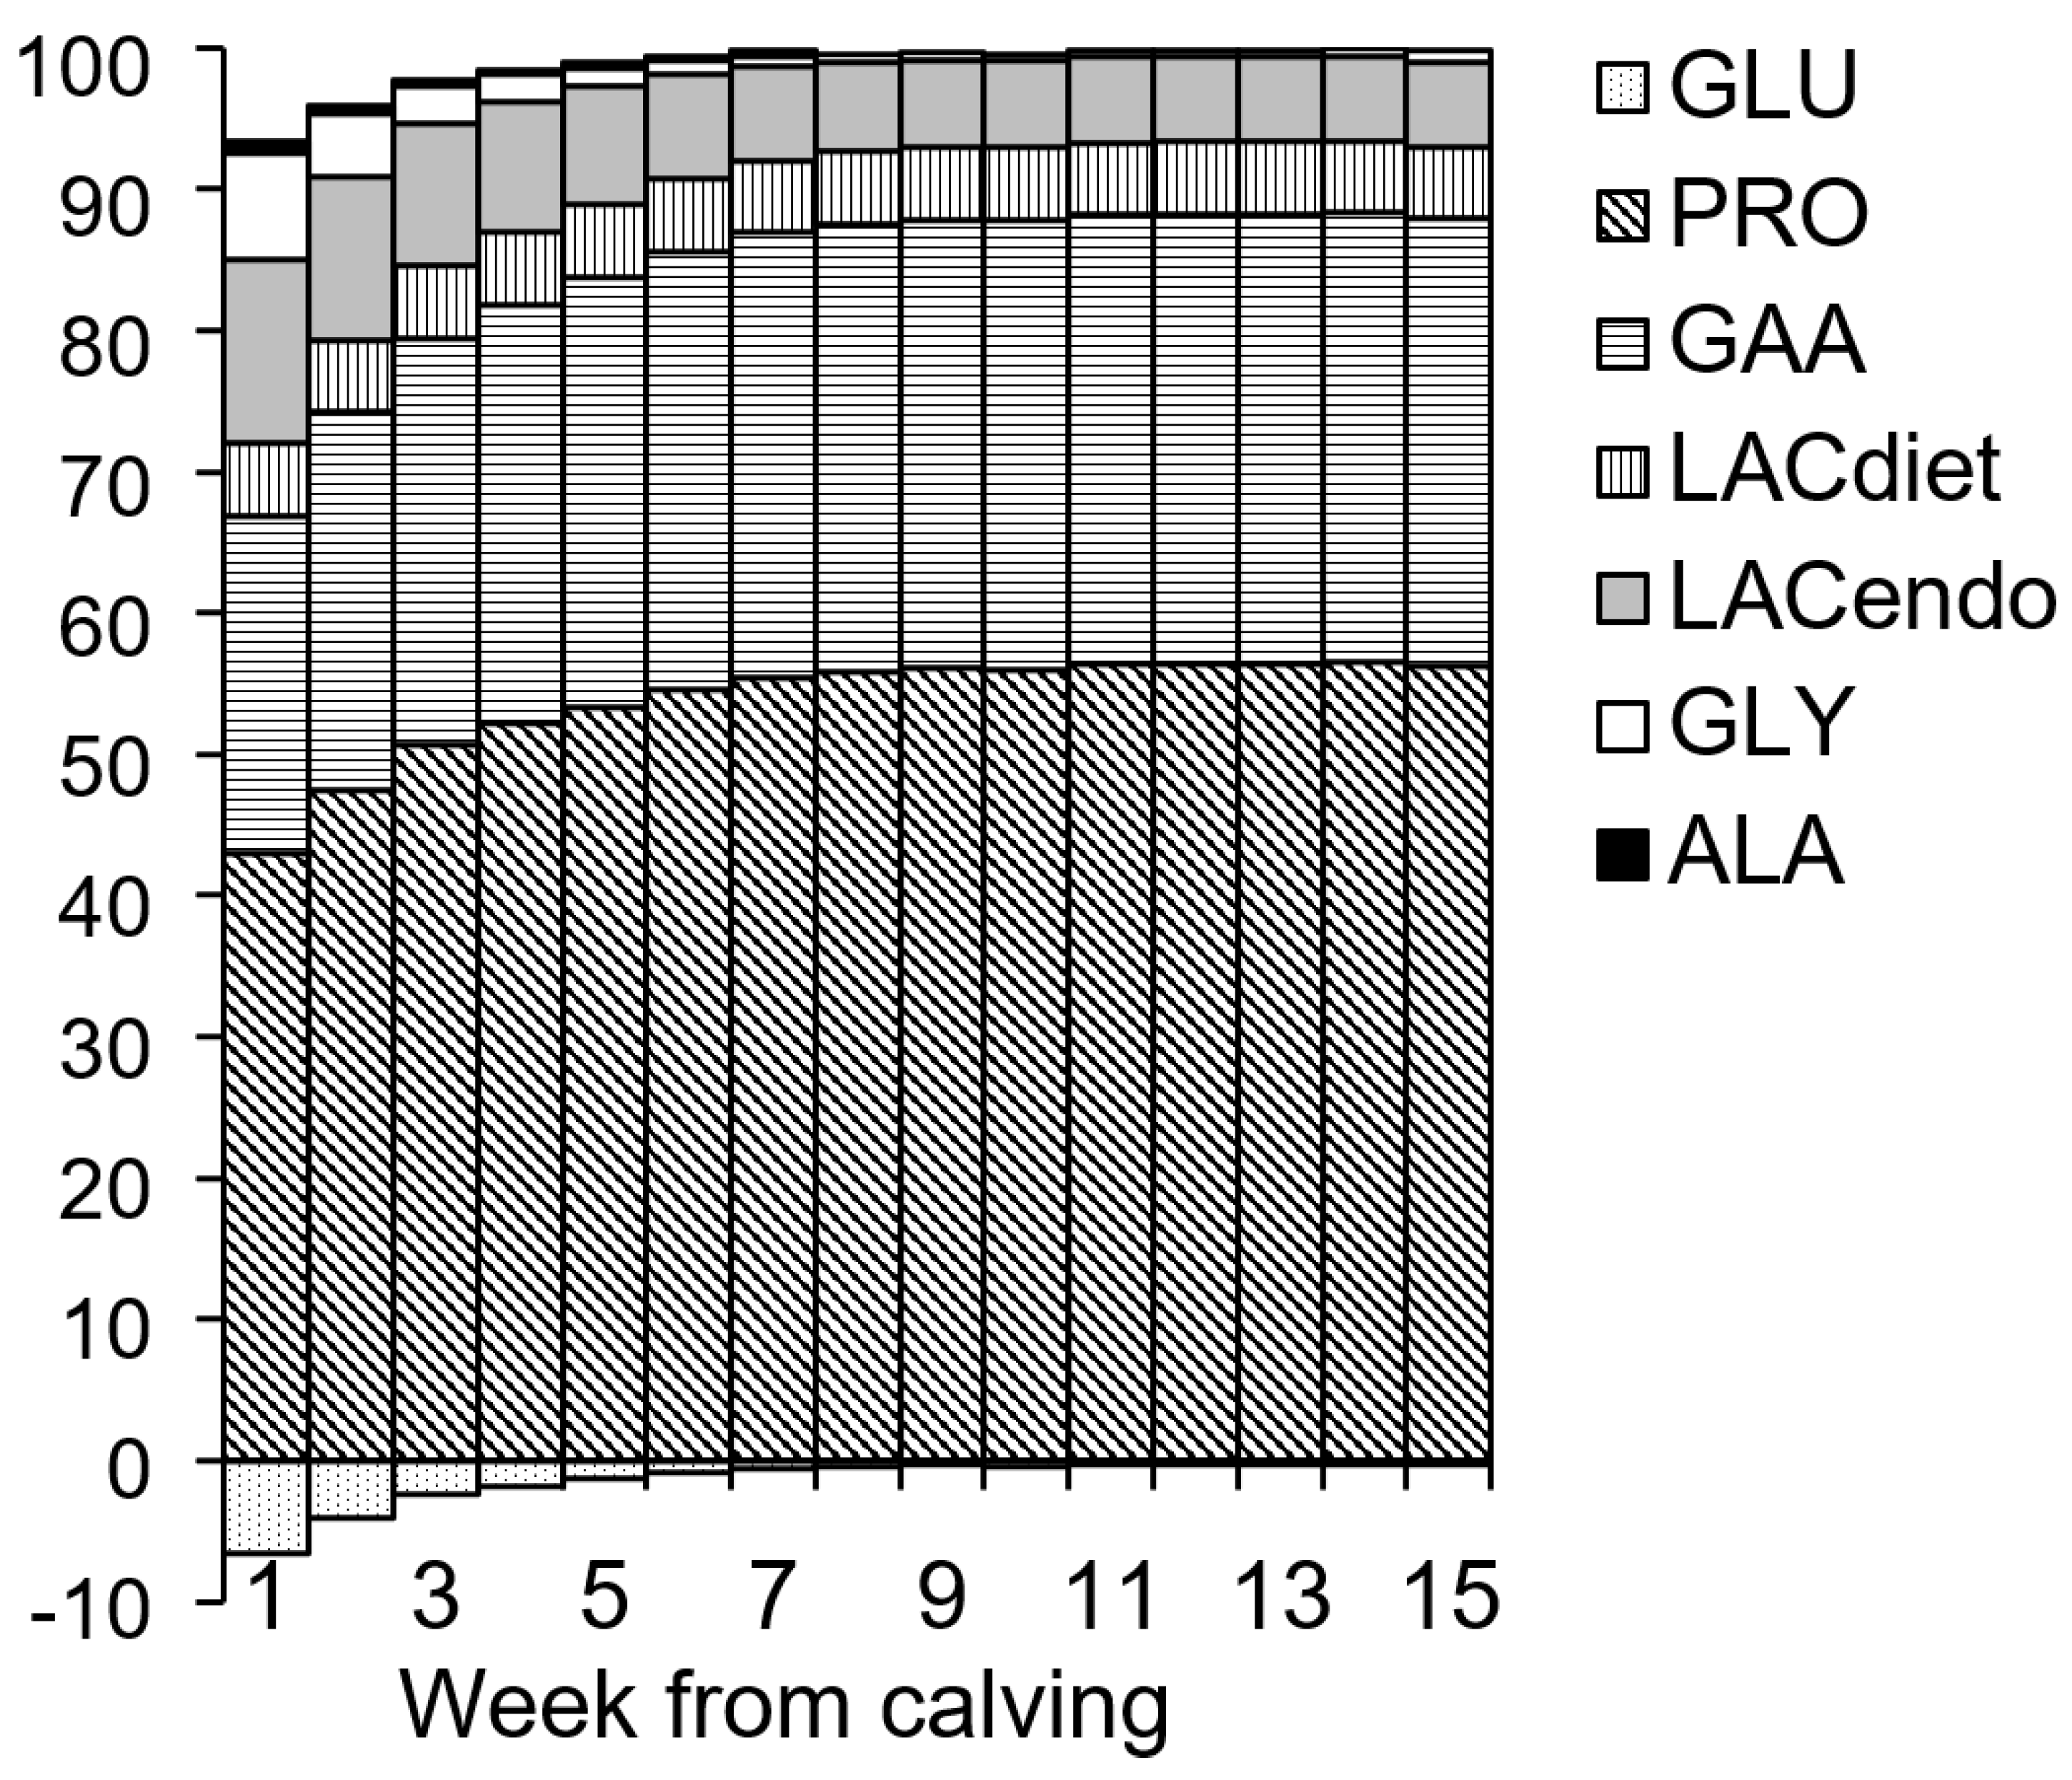
| (2) | Supply of glucogenic carbon (GS; mol C/d) | (PRO/1000 × 3) + (GLU/1000 × 24 × 6) + (LACdiet/89.1 × 3) + (gAA/1000 × 14.01 × 4) + (GLY/92.1 × 3) + (ALA/89.1 × 3) + LACendo | |
| (3) | NPA of propionate (PRO, mmol/d/kgBW) | 3.8 + 0.72 × RU_Pro; Sy.x = 1.6 | [45] |
| (4) | Propionate in the rumen (RU_Pro, mmol/d/kgBW) | PROD_VFA (mol/kg DM) × DMI × Pro %/BW × 1000 | |
| (5) | NPA of glucogenic amino acids (gAA, mgN/d/kgBW) | NPA_tAA × 0.45 | [47] |
| (6) | NPA of α-amino-N (NPA_αAA, mgN/d/kgBW) | 63 + 0.74 × PDI (mgN/d/kgBW); RMSE = 60 | [28] |
| (7) | NPA of total amino acids (NPA_tAA, mgN/d/kgBW) | NPA_ αAA × 1.3958 | [48] |
| (8) | NPA of L-lactate (LACdiet, g/d/kgBW) | = 0.098 + 0.0098 × RfOM (g/d/kgBW) RMSE = 0.022 | [21] |
| (9) | NPA of glucose (GLU, mmol/h/kgBW) | −0.103 + 0.0913 × StdI (g/d/kgBW); RMSE = 0.035 | [21] |
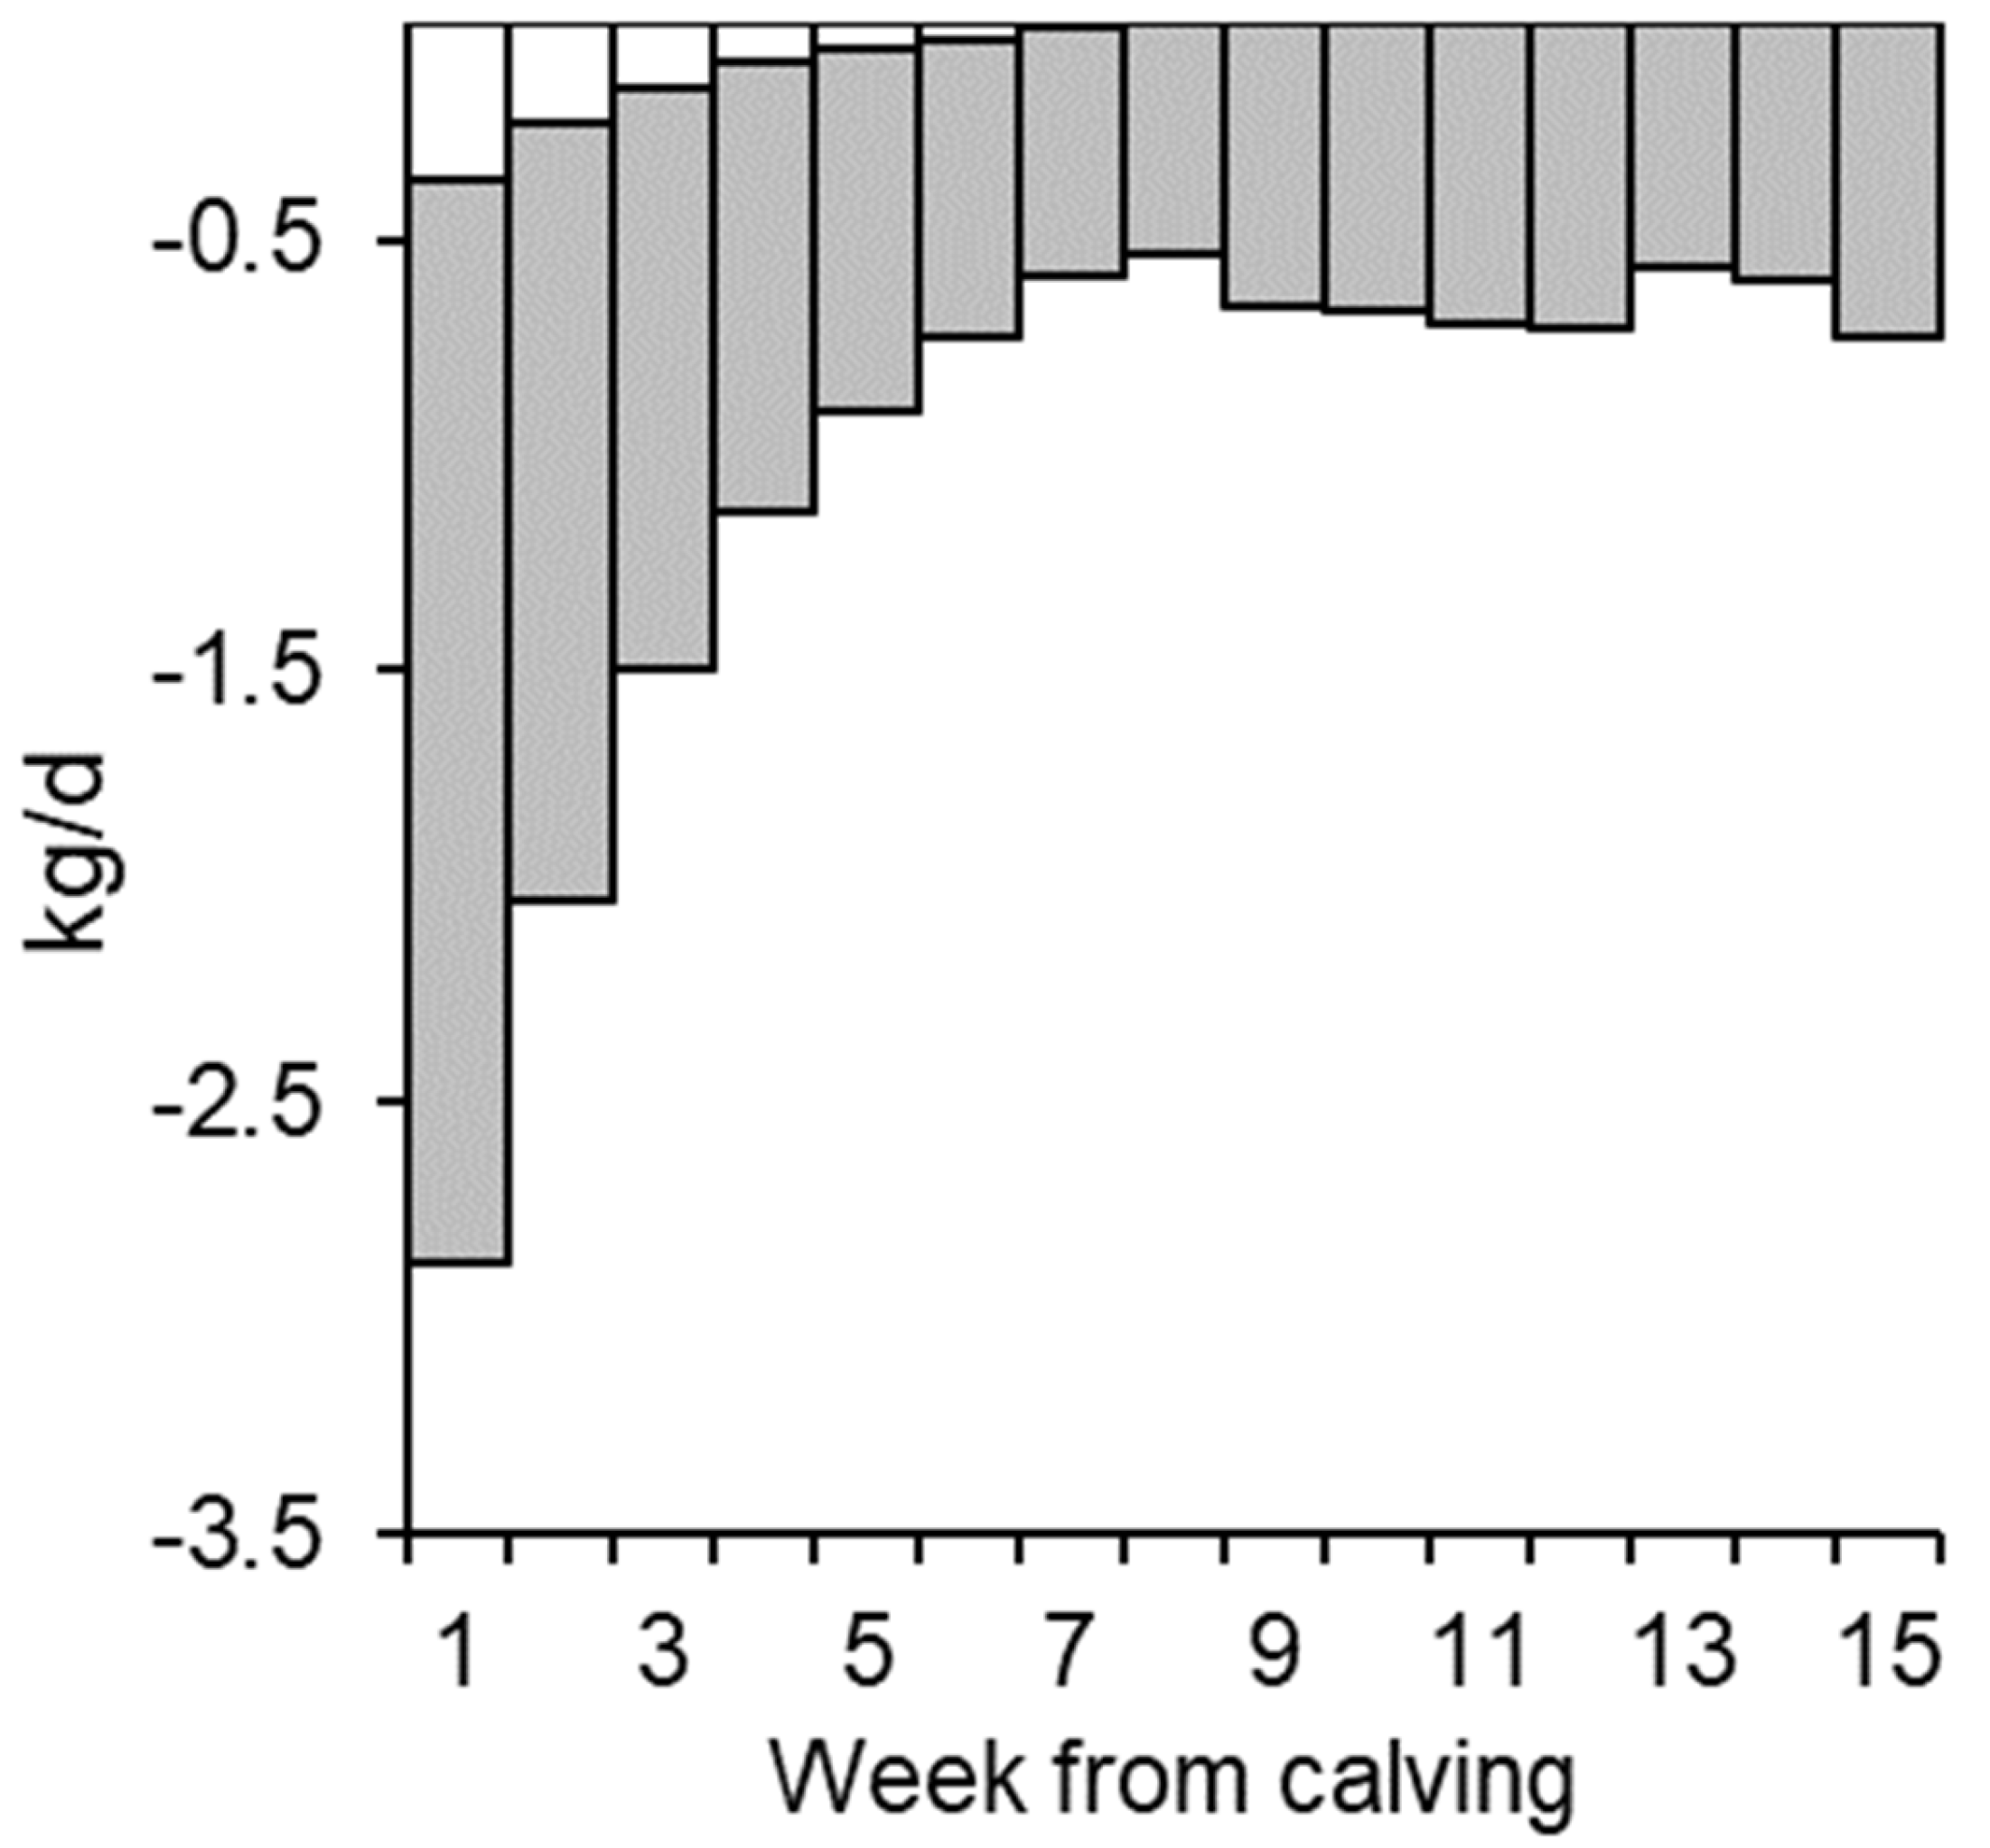
| (10) | Mobilized glycerol (GLY; mol/d) | ΔLIP × 0.105 × 1000 | [24] |
| (11) | Mobilized alanine (ALA; mol/d) | ΔPROT × 0.044 × 1000 | [29] |
| (12) | Adipose tissue mobilized (ΔLIP; kg/d) | d_L × ΔEBW (kg) × −1 | |
| (13) | Protein tissue mobilized (ΔPROT; kg/d) | d_P × ΔEBW (kg) × −1 | |
| (14) | Empty body weight (EBW; kg) | BW (kg) − TDC | [20] |
| (15) | Total digestive contents (TDC, kg) | TRC/0.7 | [20] |
| (16) | Total rumen contents (TRC, kg) | RL × 1.15 | [20] |
| (17) | Rumen liquid (RL; kg) | 3.78 × (NDF %BW − 1) + 12)/100) × BW (kg) | [20] |
| (18) | Reference level of adipose tissue mobilization (ΔLIPref; kg) | −1315 × exp(−0.0329 × DIM) + 0.124 × exp(0.0015 × DIM) | [20,49] |
| (19) | Reference level of protein tissue mobilization (ΔPROTref; kg) | −0.413 + exp(−0.0488 × DIM) + 0.0268 × exp(0.00047 × DIM) | [20,49] |
| (20) | Ratio of adipose tissue mobilized (d_L) | ΔLIPref/(ΔLIPref + ΔPROTref) | |
| (21) | Ratio of protein tissue mobilized (d_P) | ΔPROTref/(ΔLIPref + ΔPROTref) | |
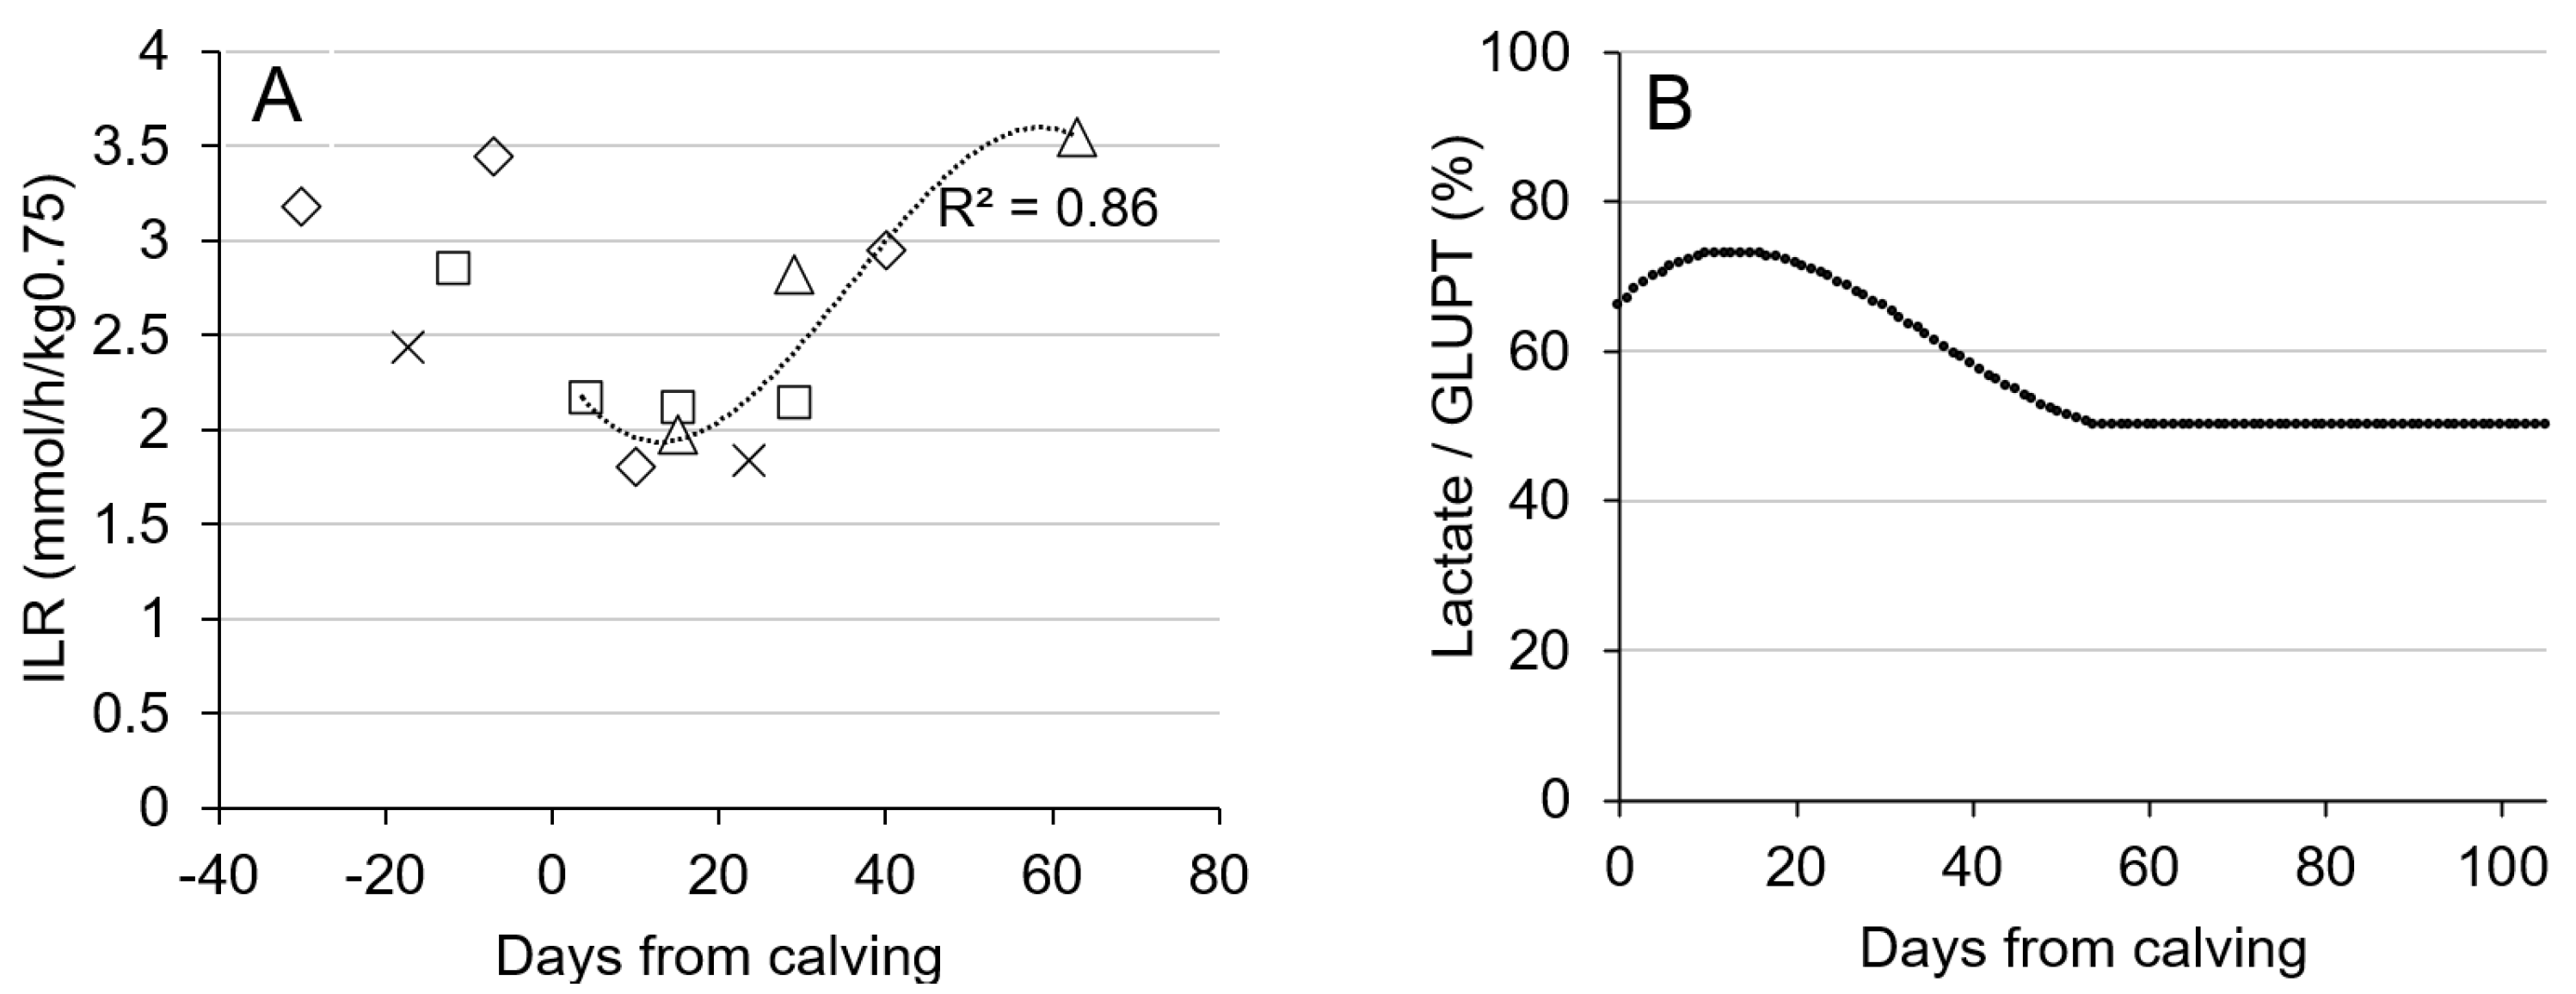
| (22) | Endogenous L-lactate (LAC; mol C/d) | Lac % × GDPT | [19] |
| (23) | Lac % | 1 − 0.5 × (ILR/ILRref) | |
| (24) | Irreversible loss rate of glucose in peripheral tissue (ILR; mmol/h/kg0.75) | −0.35720 × 10⁻⁴ × DIM3 + 0.00386 × DIM2 − 0.08329 × DIM + 2.42587 | derived from [2] |
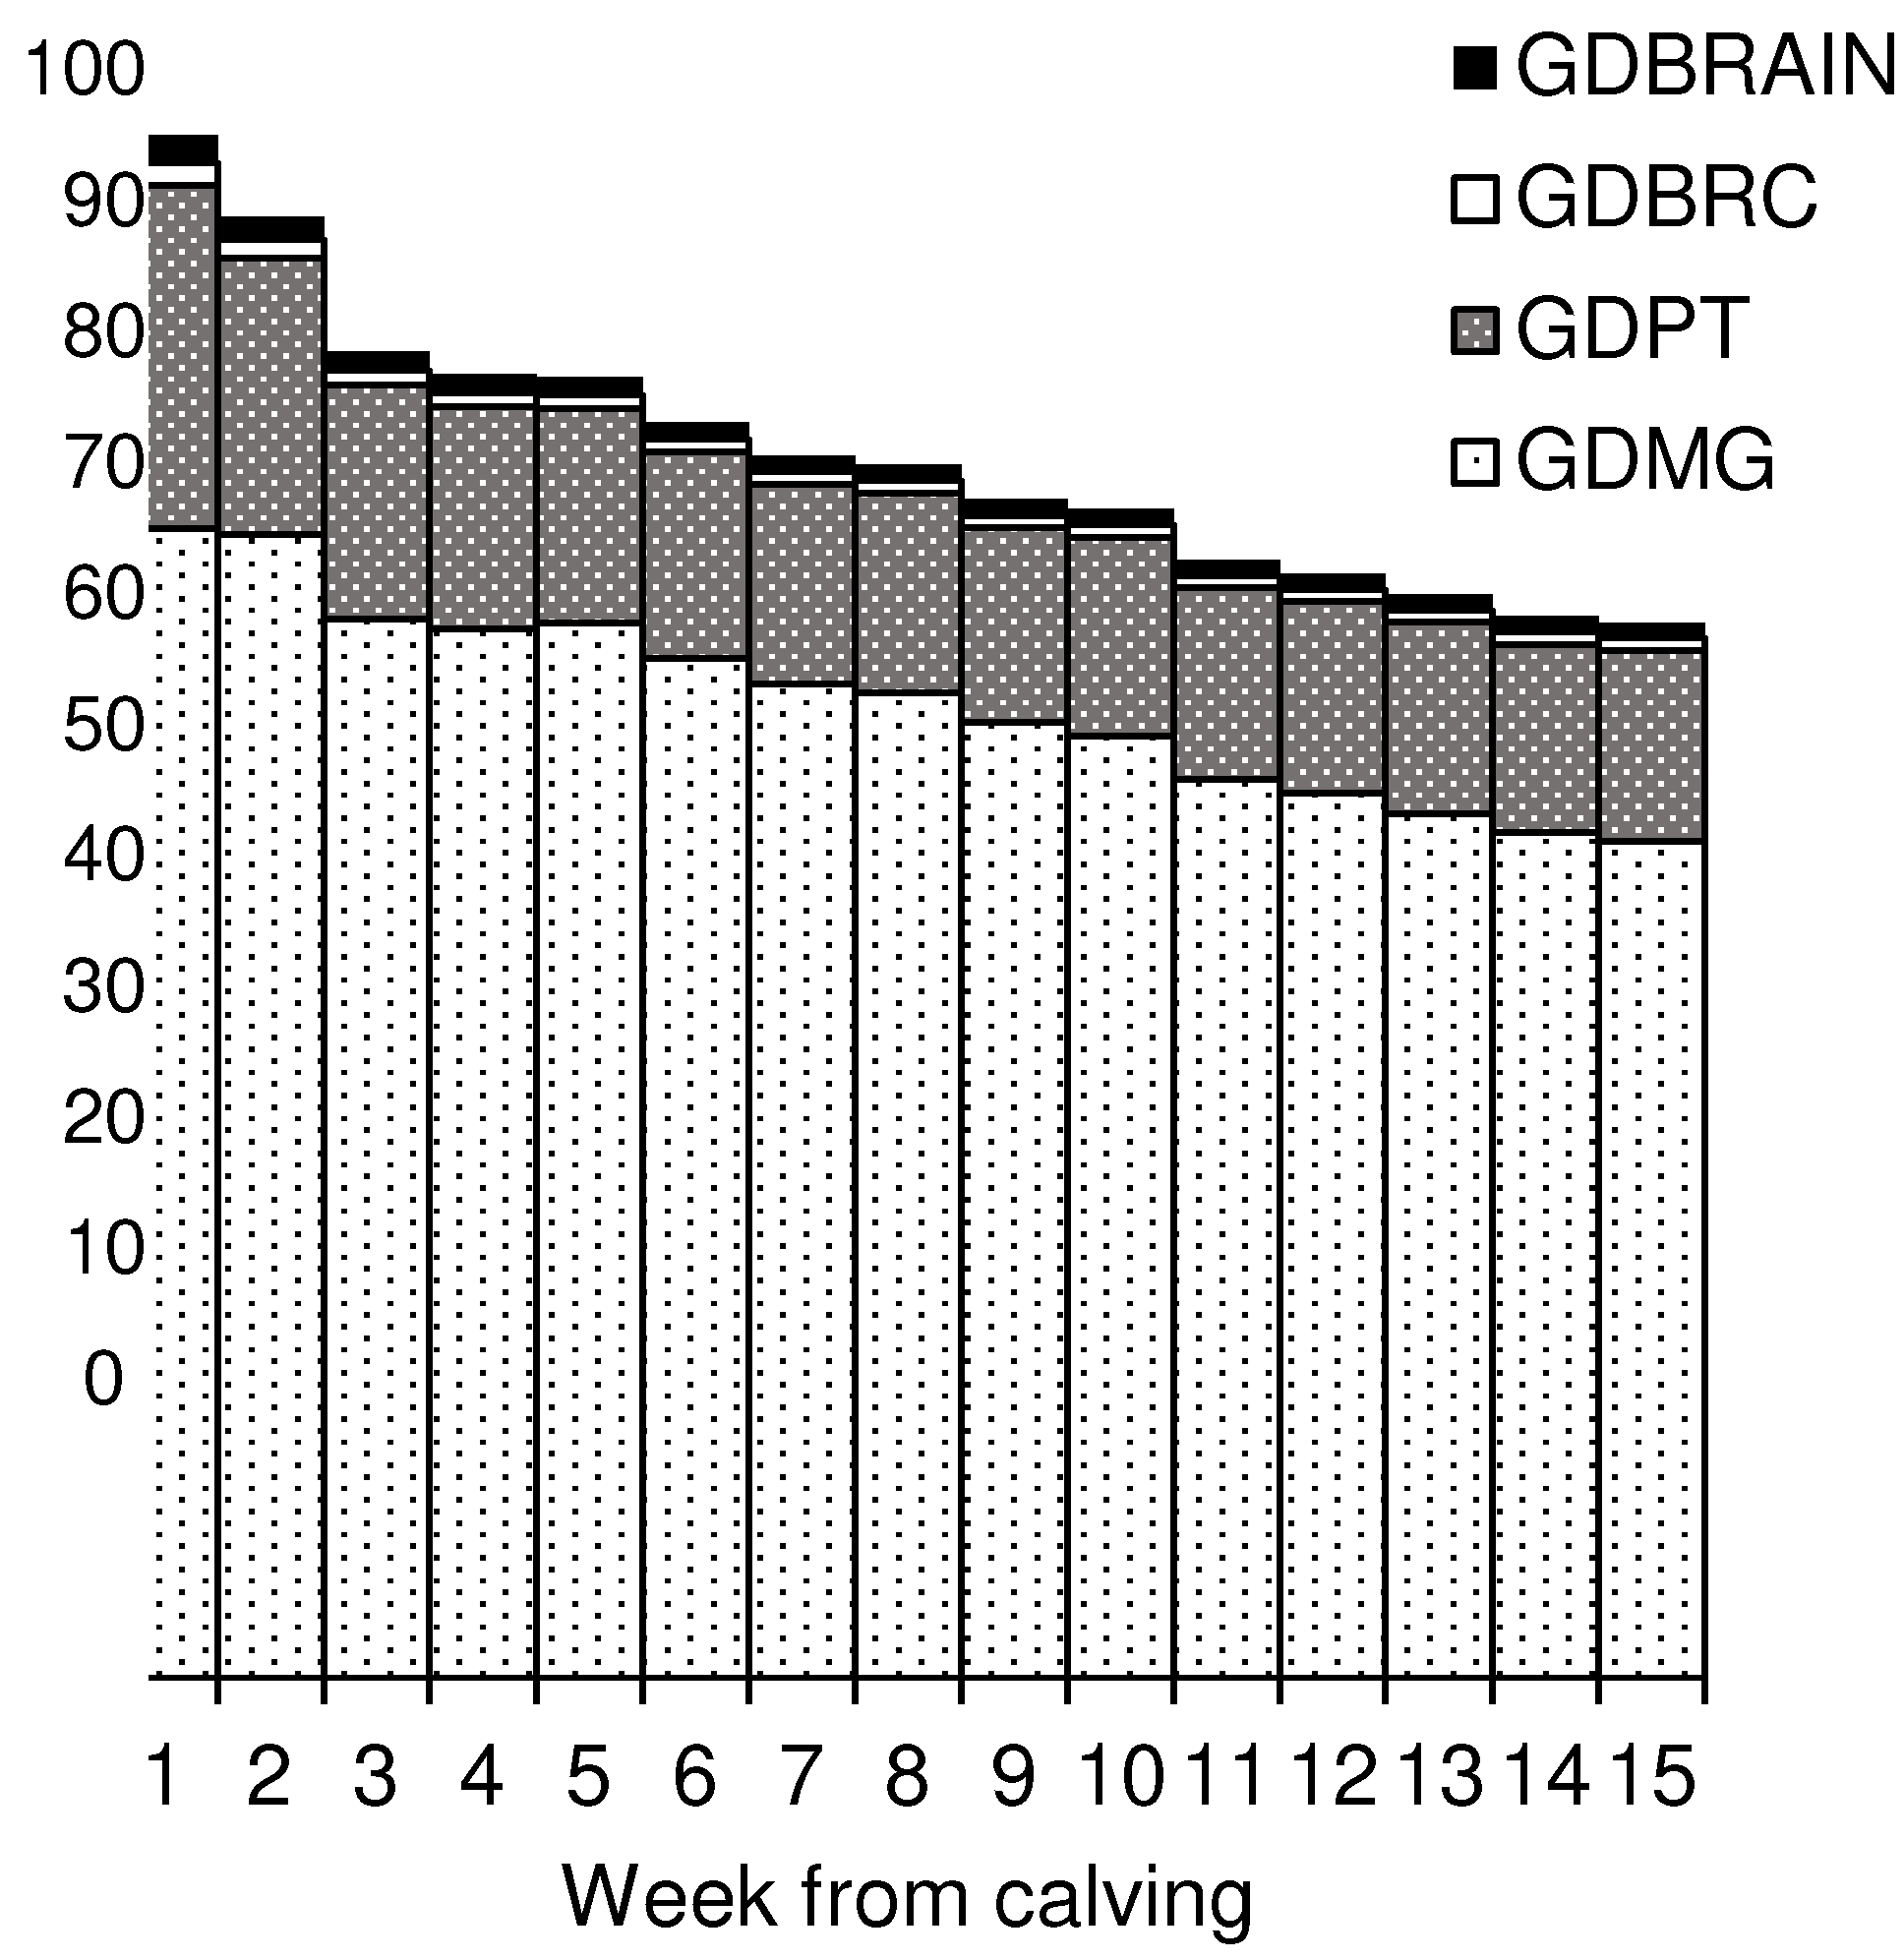
| (25) | Glucose demand (GD; molC/d) | GDMG + GDPT + GDRBC + GDBrain | |
| (26) | Glucose demand of mammary gland (GDMG; mol C/d) | lactose yield (g/d)/0.80/180.16 × 6 | [30,31] |
| (27) | Glucose demand of protein tissue (GDPT; molC/d) | PT (kg) × 0.0288 mol/d × 6 | [22] |
| (28) | Protein tissue mass (PT; kg) | (EBW − AT) * 0.215 | [20] |
| (29) | Adipose tissue mass (AT; kg) | 0.0377 × ((BCS − 0.5) × 8/4) × EBW | [50] |
| (30) | Glucose demand of red blood cells (GDRBC; molC/d) | 4.75 × BW × 10−4 × 6 | [27,34] |
| (31) | Glucose demand of brain (GDBrain; molC/d) | 3.58 × BW × 10−4 × 6 | [32,33] |
| (32) | Energy balance (EB; MJ) | (DMI (kg) × NEL(MJ NEL/kg)) − (ED_M + ED_P) | |
| (33) | Energy demand for production (ED_P; MJ of NEL) | MY × 1.05 + 0.38 × F % + 0.21 × P % | [51] |
| (34) | Energy-corrected milk (ECM; kg) | E_P/3.28 MJ of NEL/kg | [51] |
| (35) | Energy demand for maintenance (E_M; MJ of NEL) | 0.293 MJ/kg × BW0.75 (kg) | [51] |
2.1.3. The Mobilization of Glucogenic Precursors from Lipolysis and Proteolysis and L-Lactate Production in Muscle Tissues
2.1.4. The Sum of Precursors for Gluconeogenesis
2.1.5. Glucose Demand
Splanchnic Tissues/Portal-Drained Viscera and Liver
Mammary Gland
Muscle/Protein Tissue
Red Blood Cells
Brain
2.2. Data
2.2.1. Animals
2.2.2. Feeding Rations
2.3. Statistical Analyses
3. Results
4. Discussion
4.1. Estimation of the Supply with Glucogenic C in Cows during Early Lactation
4.1.1. Assessing Digestive and Portal Fluxes
4.1.2. The Contribution of Digestive Precursors
4.1.3. The Contribution of Endogenous Precursors
4.1.4. Hepatic Turnover of Glucogenic Carbon
4.1.5. Other Sources of Glucogenic C
4.2. Glucose Demand
4.2.1. Quantitative Glucose Metabolism in Non-Mammary Tissues
4.2.2. Quantitative Glucose Metabolism of the Mammary Gland
4.3. Glucose Balance as a Measure of the Cow’s Ability to Respond to Immune Challenges
5. Conclusions
Author Contributions
Funding
Institutional Review Board Statement
Data Availability Statement
Acknowledgments
Conflicts of Interest
Appendix A
| Week | N | MY | ECM | F % | P % | L % | DMI | BW | EBW | AT | PT | BWloss | EB |
|---|---|---|---|---|---|---|---|---|---|---|---|---|---|
| 1 | 187 | 29.0 ± 6.4 | 27.2 ± 9.2 | 3.8 ± 0.6 | 3.2 ± 0.4 | 4.6 ± 0.2 | 11.3 ± 2.0 | 658 ± 79 | 576 ± 70 | 124 ± 27 | 97 ± 12 | −2.5 ± 1.9 | −49.8 ± 20.9 |
| 2 | 199 | 34.5 ± 7.4 | 33.2 ± 8.3 | 3.8 ± 0.7 | 3.2 ± 0.4 | 4.8 ± 0.2 | 14.4 ± 2.8 | 646 ± 80 | 565 ± 69 | 118 ± 24 | 96 ± 12 | −1.8 ± 1.4 | −45.9 ± 23.7 |
| 3 | 198 | 37.1 ± 7.8 | 35.7 ± 8.8 | 3.8 ± 0.7 | 3.2 ± 0.4 | 4.8 ± 0.2 | 17.1 ± 3.3 | 637 ± 77 | 556 ± 68 | 112 ± 23 | 95 ± 11 | −1.2 ± 1.2 | −35.0 ± 24.1 |
| 4 | 194 | 38.6 ± 8.2 | 37.3 ± 8.9 | 3.8 ± 0.7 | 3.1 ± 0.3 | 4.8 ± 0.1 | 18.0 ± 3.2 | 631 ± 76 | 551 ± 66 | 108 ± 22 | 95 ± 11 | −0.8 ± 0.9 | −32.3 ± 24.7 |
| 5 | 188 | 40.1 ± 7.6 | 38.4 ± 8.6 | 3.8 ± 0.7 | 3.1 ± 0.4 | 4.8 ± 0.1 | 18.9 ± 3.1 | 627 ± 76 | 547 ± 66 | 105 ± 22 | 95 ± 11 | −0.5 ± 0.8 | −30.5 ± 20.8 |
| 6 | 186 | 40.5 ± 7.4 | 38.8 ± 8.2 | 3.7 ± 0.6 | 3.1 ± 0.4 | 4.8 ± 0.2 | 19.8 ± 2.9 | 626 ± 75 | 547 ± 65 | 103 ± 21 | 95 ± 11 | −0.4 ± 0.6 | −24.4 ± 20.2 |
| 7 | 182 | 40.6 ± 7.5 | 38.7 ± 8.1 | 3.7 ± 0.6 | 3.1 ± 0.4 | 4.8 ± 0.2 | 20.5 ± 3.0 | 627 ± 74 | 547 ± 65 | 102 ± 21 | 96 ± 11 | −0.3 ± 0.5 | −19.5 ± 21.3 |
| 8 | 178 | 40.5 ± 7.2 | 38.7 ± 8.2 | 3.7 ± 0.6 | 3.1 ± 0.4 | 4.8 ± 0.2 | 20.8 ± 3.0 | 628 ± 73 | 548 ± 64 | 101 ± 20 | 96 ± 11 | −0.2 ± 0.5 | −18.6 ± 20.2 |
| 9 | 176 | 40.1 ± 6.9 | 38.3 ± 8.0 | 3.7 ± 0.7 | 3.1 ± 0.4 | 4.8 ± 0.2 | 21.1 ± 3.0 | 629 ± 72 | 549 ± 63 | 100 ± 20 | 96 ± 11 | −0.2 ± 0.7 | −14.1 ± 19.7 |
| 10 | 170 | 39.4 ± 6.9 | 37.3 ± 7.9 | 3.7 ± 0.7 | 3.1 ± 0.4 | 4.8 ± 0.1 | 21.0 ± 3.3 | 629 ± 72 | 549 ± 63 | 100 ± 20 | 97 ± 11 | −0.2 ± 0.4 | −13.1 ± 21.7 |
| 11 | 164 | 39.0 ± 6.8 | 37.0 ± 7.6 | 3.7 ± 0.7 | 3.1 ± 0.3 | 4.8 ± 0.1 | 21.6 ± 3.0 | 631 ± 72 | 551 ± 63 | 101 ± 20 | 97 ± 10 | −0.2 ± 0.5 | −7.9 ± 20.2 |
| 12 | 160 | 38.6 ± 7.1 | 36.4 ± 7.6 | 3.6 ± 0.6 | 3.1 ± 0.4 | 4.8 ± 0.1 | 21.7 ± 3.0 | 632 ± 72 | 552 ± 63 | 101 ± 21 | 97 ± 10 | −0.2 ± 0.5 | −5.4 ± 17.7 |
| 13 | 157 | 37.9 ± 6.6 | 35.8 ± 7.5 | 3.7 ± 0.6 | 3.1 ± 0.4 | 4.8 ± 0.1 | 21.8 ± 3.1 | 635 ± 72 | 554 ± 63 | 101 ± 21 | 97 ± 11 | −0.2 ± 0.5 | −2.7 ± 18.6 |
| 14 | 152 | 37.9 ± 6.6 | 36.0 ± 7.4 | 3.7 ± 0.7 | 3.2 ± 0.4 | 4.8 ± 0.1 | 22.1 ± 3.1 | 636 ± 73 | 555 ± 64 | 102 ± 21 | 98 ± 11 | −0.2 ± 0.5 | −1.4 ± 19.4 |
| 15 | 136 | 37.3 ± 7.0 | 36.0 ± 8.0 | 3.8 ± 0.6 | 3.2 ± 0.4 | 4.8 ± 0.2 | 21.9 ± 3.2 | 640 ± 75 | 559 ± 66 | 103 ± 21 | 98 ± 11 | −0.3 ± 0.6 | −1.3 ± 18.9 |
| GLUIN from Digestive Precursors | GLUIN from Endogenous Precursors | |||||||||
|---|---|---|---|---|---|---|---|---|---|---|
| Week | GB | Total | PRO | gAA | LACdiet | GLU | Total | LACendo | GLY | ALA |
| 1 | 3.2 ± 13.5 | 59.0 ± 12.1 | 38.8 ± 7.0 | 21.5 ± 4.3 | 4.7 ± 0.6 | −5.9 ± 1.3 | 19.3 ± 5.9 | 11.7 ± 1.6 | 6.8 ± 5.0 | 0.9 ± 0.6 |
| 2 | 8.8 ± 15.1 | 78.8 ± 17.6 | 49.7 ± 10.0 | 28.0 ± 6.1 | 5.4 ± 0.8 | −4.3 ± 1.5 | 17.3 ± 4.5 | 12.0 ± 1.7 | 5.1 ± 3.9 | 0.6 ± 0.4 |
| 3 | 19.4 ± 16.3 | 97.0 ± 20.6 | 59.7 ± 11.7 | 34.0 ± 7.1 | 6.0 ± 0.9 | −2.8 ± 1.6 | 15.4 ± 4.1 | 11.8 ± 1.6 | 3.4 ± 3.3 | 0.3 ± 0.3 |
| 4 | 21.2 ± 17.6 | 103.8 ± 20.9 | 63.6 ± 12.0 | 36.1 ± 7.1 | 6.2 ± 0.9 | −2.1 ± 1.7 | 13.7 ± 3.4 | 11.3 ± 1.4 | 2.4 ± 2.7 | 0.2 ± 0.2 |
| 5 | 22.1 ± 15.3 | 109.3 ± 20.1 | 66.6 ± 11.6 | 37.9 ± 6.8 | 6.4 ± 0.9 | −1.7 ± 1.5 | 12.2 ± 2.8 | 10.6 ± 1.2 | 1.6 ± 2.3 | 0.1 ± 0.2 |
| 6 | 26.7 ± 14.8 | 116.0 ± 18.9 | 70.5 ± 11.1 | 40.1 ± 6.3 | 6.6 ± 0.8 | −1.1 ± 1.5 | 10.9 ± 2.4 | 9.7 ± 1.1 | 1.2 ± 2.0 | 0.1 ± 0.1 |
| 7 | 30.2 ± 16.3 | 121.0 ± 20.2 | 73.4 ± 11.9 | 41.6 ± 6.6 | 6.8 ± 0.8 | −0.7 ± 1.7 | 9.8 ± 2.0 | 8.9 ± 1.2 | 1.0 ± 1.8 | 0 ± 0 |
| 8 | 31.2 ± 14.8 | 122.4 ± 19.7 | 74.1 ± 11.7 | 42.0 ± 6.5 | 6.8 ± 0.9 | −0.6 ± 1.6 | 9.1 ± 1.8 | 8.3 ± 1.1 | 0.8 ± 1.7 | 0 ± 0 |
| 9 | 34.8 ± 15.2 | 125.2 ± 20.1 | 75.8 ± 11.8 | 42.9 ± 6.6 | 6.9 ± 0.8 | −0.4 ± 1.7 | 9.1 ± 2.4 | 8.2 ± 1.2 | 0.9 ± 2.4 | 0 ± 0 |
| 10 | 34.6 ± 18.1 | 123.8 ± 22.5 | 75.0 ± 13.1 | 42.5 ± 7.4 | 6.9 ± 0.9 | −0.5 ± 1.9 | 8.9 ± 1.8 | 8.3 ± 1.1 | 0.7 ± 1.5 | 0 ± 0 |
| 11 | 40.3 ± 17.2 | 128.7 ± 21.0 | 77.9 ± 12.4 | 44.0 ± 6.8 | 7.0 ± 0.8 | −0.2 ± 1.8 | 9.0 ± 1.9 | 8.3 ± 1.1 | 0.7 ± 1.8 | 0 ± 0 |
| 12 | 41.8 ± 15.5 | 129.3 ± 20.6 | 78.3 ± 12.2 | 44.2 ± 6.7 | 7.0 ± 0.8 | −0.2 ± 1.8 | 9.1 ± 1.8 | 8.4 ± 0.9 | 0.7 ± 1.8 | 0 ± 0 |
| 13 | 43.7 ± 15.9 | 129.7 ± 21.2 | 78.5 ± 12.5 | 44.3 ± 6.9 | 7.1 ± 0.8 | −0.2 ± 1.8 | 9.1 ± 1.8 | 8.4 ± 0.9 | 0.7 ± 1.7 | 0 ± 0 |
| 14 | 46.4 ± 16.8 | 131.9 ± 21.3 | 79.8 ± 12.6 | 45.0 ± 7.0 | 7.1 ± 0.8 | 0.0 ± 1.9 | 9.3 ± 1.9 | 8.4 ± 0.9 | 0.9 ± 1.8 | 0 ± 0 |
| 15 | 46.7 ± 17.4 | 130.8 ± 22.3 | 79.3 ± 13.1 | 44.7 ± 7.3 | 7.1 ± 0.9 | −0.3 ± 1.9 | 9.6 ± 2.0 | 8.5 ± 1.0 | 1.2 ± 1.9 | 0 ± 0 |
References
- Aschenbach, J.R.; Kristensen, N.B.; Donkin, S.S.; Hammon, H.M.; Penner, G.B. Gluconeogenesis in dairy cows: The secret of making sweet milk from sour dough. IUBMB Life 2010, 62, 869–877. [Google Scholar] [CrossRef] [PubMed]
- Larsen, M.; Kristensen, N.B. Precursors for liver gluconeogenesis in periparturient dairy cows. Anim. Int. J. Anim. Biosci. 2013, 7, 1640–1650. [Google Scholar] [CrossRef] [PubMed] [Green Version]
- Overton, T.R.; Drackley, J.K.; Ottemann-Abbamonte, C.J.; Beaulieu, A.D.; Emmert, L.S.; Clark, J.H. Substrate utilization for hepatic gluconeogenesis is altered by increased glucose demand in ruminants. J. Anim. Sci. 1999, 77, 1940–1951. [Google Scholar] [CrossRef] [PubMed]
- Linzell, J.L. Mechanism of Secretion of the Aqueous Phase of Milk. J. Dairy Sci. 1972, 55, 1316–1322. [Google Scholar] [CrossRef]
- Liu, H.; Zhao, K.; Liu, J. Effects of glucose availability on expression of the key genes involved in synthesis of milk fat, lactose and glucose metabolism in bovine mammary epithelial cells. PLoS ONE 2013, 8, e66092. [Google Scholar] [CrossRef] [Green Version]
- Bauman, D.E.; Griinari, J.M. Nutritional regulation of milk fat synthesis. Annu. Rev. Nutr. 2003, 23, 203–227. [Google Scholar] [CrossRef] [Green Version]
- Ingvartsen, K.L.; Moyes, K.M. Factors contributing to immunosuppression in the dairy cow during the periparturient period. Jpn. J. Vet. Res. 2015, 63, S15–S24. [Google Scholar]
- Kvidera, S.K.; Horst, E.A.; Mayorga, E.J.; Sanz-Fernandez, M.V.; Abuajamieh, M.; Baumgard, L.H. Estimating glucose requirements of an activated immune system in growing pigs. J. Anim. Sci. 2017, 95, 5020–5029. [Google Scholar] [CrossRef]
- Van Schyndel, S.J.; Dubuc, J.; Pascottini, O.B.; Carrier, J.; Kelton, D.F.; Duffield, T.F.; LeBlanc, S.J. The effect of pegbovigrastim on early-lactation disease, production, and reproduction in dairy cows. J. Dairy Sci. 2021, 104, 10100–10110. [Google Scholar] [CrossRef]
- Bauman, D.E.; Currie, B.W. Partitioning of Nutrients During Pregnancy and Lactation: A Review of Mechanisms Involving Homeostasis and Homeorhesis. J. Dairy Sci. 1980, 63, 1514–1529. [Google Scholar] [CrossRef]
- Habel, J.; Sundrum, A. Mismatch of Glucose Allocation between Different Life Functions in the Transition Period of Dairy Cows. Animals 2020, 10, 1028. [Google Scholar] [CrossRef] [PubMed]
- Drackley, J.K.; Dann, H.M.; Douglas, N.; Guretzky, N.A.J.; Litherland, N.B.; Underwood, J.P.; Loor, J.J. Physiological and pathological adaptations in dairy cows that may increase susceptibility to periparturient diseases and disorders. Ital. J. Anim. Sci. 2005, 4, 323–344. [Google Scholar] [CrossRef] [Green Version]
- Omari, M.; Lange, A.; Plöntzke, J.; Röblitz, S. Model-based exploration of the impact of glucose metabolism on the estrous cycle dynamics in dairy cows. Biol. Direct 2020, 15, 2. [Google Scholar] [CrossRef] [PubMed] [Green Version]
- Guo, J.; Peters, R.R.; Kohn, R.A. Modeling nutrient fluxes and plasma ketone bodies in periparturient cows. J. Dairy Sci. 2008, 91, 4282–4292. [Google Scholar] [CrossRef] [Green Version]
- Van Amburgh, M.E.; Collao-Saenz, E.A.; Higgs, R.J.; Ross, D.A.; Recktenwald, E.B.; Raffrenato, E.; Chase, L.E.; Overton, T.R.; Mills, J.K.; Foskolos, A. The Cornell Net Carbohydrate and Protein System: Updates to the model and evaluation of version 6.5. J. Dairy Sci. 2015, 98, 6361–6380. [Google Scholar] [CrossRef]
- Udén, P.; Danfaer, A. Modeling glucose metabolism in the dairy cow—A comparison of two dynamic models. Anim. Feed. Sci. Technol. 2008, 143, 59–69. [Google Scholar] [CrossRef]
- Noziere, P.; Sauvant, D.; Peyraud, J.L. The evolution of INRA feeding systems for ruminants based on absorbed nutrients and animal responses. In Energy and Protein Metabolism and Nutrition in Sustainable Animal Production; Wageningen Academic Publishers: Wageningen, The Netherlands, 2013; pp. 315–316. [Google Scholar]
- Martin, O.; Sauvant, D. A teleonomic model describing performance (body, milk and intake) during growth and over repeated reproductive cycles throughout the lifespan of dairy cattle. 2. Voluntary intake and energy partitioning. Anim. Int. J. Anim. Biosci. 2010, 4, 2048–2056. [Google Scholar] [CrossRef] [PubMed] [Green Version]
- Martin, O.; Sauvant, D. Dynamic model of the lactating dairy cow metabolism. Animal 2007, 1, 1143–1166. [Google Scholar] [CrossRef] [Green Version]
- INRA. INRA: Feeding System for Ruminants; Wageningen Academic Publishers: Wageningen, The Netherlands, 2018; ISBN 978-90-8686-292-4. [Google Scholar]
- Loncke, C.; Ortigues-Marty, I.; Vernet, J.; Lapierre, H.; Sauvant, D.; Nozière, P. Empirical prediction of net portal appearance of volatile fatty acids, glucose, and their secondary metabolites (beta-hydroxybutyrate, lactate) from dietary characteristics in ruminants: A meta-analysis approach. J. Anim. Sci. 2009, 87, 253–268. [Google Scholar] [CrossRef]
- Galindo, C.E.; Ouellet, D.R.; Pellerin, D.; Lemosquet, S.; Ortigues-Marty, I.; Lapierre, H. Effect of amino acid or casein supply on whole-body, splanchnic, and mammary glucose kinetics in lactating dairy cows. J. Dairy Sci. 2011, 94, 5558–5568. [Google Scholar] [CrossRef] [Green Version]
- Duplessis, M.; Lapierre, H.; Ouattara, B.; Bissonnette, N.; Pellerin, D.; Laforest, J.-P.; Girard, C.L. Whole-body propionate and glucose metabolism of multiparous dairy cows receiving folic acid and vitamin B12 supplements. J. Dairy Sci. 2017, 100, 8578–8589. [Google Scholar] [CrossRef] [PubMed]
- Loncke, C.; Noziere, P.; Vernet, J.; Lapierre, H.; Sauvant, D.; Ortigues-Marty, I. Empirical prediction of net splanchnic release of glucose in ruminants from dietary and animal characteristics: A meta-analysis approach. EAAP Sci. Ser. 2010, 127, 225. [Google Scholar]
- Reynolds, C.K. Glucose Balance in Cattle. In Proceedings of the 17th Annual Meeting of the Florida Ruminant Nutrition Conference, Florida Ruminant Nutrition Symposium, Gainesville, FL, USA; 2005; pp. 143–154. [Google Scholar]
- Amaral-Phillips, D.M.; McGilliard, A.D.; Lindberg, G.L.; Veenhuizen, J.J.; Young, J.W. Effects of Decreased Availability of Glucose for Dairy Cows. J. Dairy Sci. 1993, 76, 752–761. [Google Scholar] [CrossRef]
- Basarab, J.A.; Berg, R.T.; Thompson, J.R. Glucose Consumption and Lactic Acid Production by Erythrocytes from Double-Muscled Cattle. Can. J. Anim. Sci. 1982, 62, 751–757. [Google Scholar] [CrossRef]
- Martineau, R.; Côrtes, C.; Ortigues-Marty, I.; Ouellet, D.R.; Lapierre, H. Evaluation of equations predicting the net portal appearance of amino acid nitrogen in ruminants. J. Dairy Sci. 2014, 97, 1670–1681. [Google Scholar] [CrossRef]
- Wu, G.; Cross, H.R.; Gehring, K.B.; Savell, J.W.; Arnold, A.N.; McNeill, S.H. Composition of free and peptide-bound amino acids in beef chuck, loin, and round cuts. J. Anim. Sci. 2016, 94, 2603–2613. [Google Scholar] [CrossRef] [Green Version]
- Annison, E.F.; Bickerstaffe, R.; Linzell, J.L. Glucose and fatty acid metabolism in cows producing milk of low fat content. J. Agric. Sci. 1974, 82, 87–95. [Google Scholar] [CrossRef]
- Galindo, C.; Larsen, M.; Ouellet, D.R.; Maxin, G.; Pellerin, D.; Lapierre, H. Abomasal amino acid infusion in postpartum dairy cows: Effect on whole-body, splanchnic, and mammary glucose metabolism. J. Dairy Sci. 2015, 98, 7962–7974. [Google Scholar] [CrossRef] [Green Version]
- Mergenthaler, P.; Lindauer, U.; Dienel, G.A.; Meisel, A. Sugar for the brain: The role of glucose in physiological and pathological brain function. Trends Neurosci. 2013, 36, 587–597. [Google Scholar] [CrossRef] [Green Version]
- Ballarin, C.; Povinelli, M.; Granato, A.; Panin, M.; Corain, L.; Peruffo, A.; Cozzi, B. The Brain of the Domestic Bos taurus: Weight, Encephalization and Cerebellar Quotients, and Comparison with Other Domestic and Wild Cetartiodactyla. PLoS ONE 2016, 11, e0154580. [Google Scholar] [CrossRef] [Green Version]
- Harvey, J.W. The erythrocyte: Physiology, metabolism, and biochemical disorders. In Clinical Biochemistry of Domestic Animals, 6th ed.; Kaneko, J.J., Harvey, J.W., Bruss, M.L., Eds.; Academic Press/Elsevier: San Diego, CA, USA, 2008; pp. 157–203. ISBN 9780080568829. [Google Scholar]
- Larsen, M.; Kristensen, N.B. Effect of abomasal glucose infusion on splanchnic and whole-body glucose metabolism in periparturient dairy cows. J. Dairy Sci. 2009, 92, 1071–1083. [Google Scholar] [CrossRef] [PubMed]
- Kristensen, N.B.; Harmon, D.L. Splanchnic metabolism of volatile fatty acids absorbed from the washed reticulorumen of steers1. J. Anim. Sci. 2004, 82, 2033–2042. [Google Scholar] [CrossRef] [PubMed]
- Nozière, P.; Ortigues-Marty, I.; Loncke, C.; Sauvant, D. Carbohydrate quantitative digestion and absorption in ruminants: From feed starch and fibre to nutrients available for tissues. Anim. Int. J. Anim. Biosci. 2010, 4, 1057–1074. [Google Scholar] [CrossRef] [PubMed] [Green Version]
- Berthiaume, R.; Dubreuil, P.; Stevenson, M.; McBride, B.W.; Lapierre, H. Intestinal Disappearance and Mesenteric and Portal Appearance of Amino Acids in Dairy Cows Fed Ruminally Protected Methionine. J. Dairy Sci. 2001, 84, 194–203. [Google Scholar] [CrossRef]
- Lapierre, H.; Lobley, G.E. Nitrogen Recycling in the Ruminant: A Review. J. Dairy Sci. 2001, 84, E223–E236. [Google Scholar] [CrossRef]
- Reynolds, C.K.; Humphries, D.J.; van Vuuren, A.M.; Dijkstra, J.; Bannink, A. Considerations for feeding starch to high-yielding dairy cows. In Proceedings of the 46th University of Nottingham Feed Conference, Nottingham, UK, 24–26 June 2014; pp. 9–11. [Google Scholar]
- Huntington, G.B.; Harmon, D.L.; Richards, C.J. Sites, rates, and limits of starch digestion and glucose metabolism in growing cattle. J. Anim. Sci. 2006, 84, E14–E24. [Google Scholar] [CrossRef]
- Mills, J.A.N.; France, J.; Ellis, J.L.; Crompton, L.A.; Bannink, A.; Hanigan, M.D.; Dijkstra, J. A mechanistic model of small intestinal starch digestion and glucose uptake in the cow. J. Dairy Sci. 2017, 100, 4650–4670. [Google Scholar] [CrossRef] [Green Version]
- El-Kadi, S.W.; McLeod, K.R.; Elam, N.A.; Kitts, S.E.; Taylor, C.C.; Harmon, D.L.; Bequette, B.J.; Vanzant, E.S. Nutrient net absorption across the portal-drained viscera of forage-fed beef steers: Quantitative assessment and application to a nutritional prediction model. J. Anim. Sci. 2008, 86, 2277–2287. [Google Scholar] [CrossRef] [Green Version]
- Lapierre, H.; Galindo, C.; Lemosquet, S.; Ortigues-Marty, I.; Doepel, L.; Ouellet, D. Protein supply, glucose kinetics and milk yield in dairy cows. In Energy and Protein Metabolism and Nutrition, 3rd EAAP International Symposium on Energy and Protein Metabolism and Nutrition, Parma, Italy, 6–10 September 2010; Wageningen Academic Publishers: Wageningen; The Netherland, 2010; pp. 275–286. ISBN 9789086861538. [Google Scholar]
- Nozière, P.; Glasser, F.; Loncke, C.; Marty, I.O.; Vernet, J.; Sauvant, D. Modelling rumen volatile fatty acids and its evaluation on net portal fluxes in ruminants. In Modelling Nutrient Digestion and Utilisation in Farm Animals; Sauvant, D., Milgen, J., Faverdin, P., Friggens, N., Eds.; Wageningen Academic Publishers: Wageningen, The Netherland, 2011; ISBN 978-90-8686-712-7. [Google Scholar]
- Chapoutot, P.; Martin, O.; Noziere, P.; Sauvant, D. Systool Web, a new one-line application for the French INRA «systali» project. In Proceedings of the 66 Annual Meeting of the European Federation of Animal Science (EAAP), Warsaw, Poland, 31 August–4 September 2015. [Google Scholar]
- Loncke, C. Modeling Relationships between Dietary Intake and Net Fluxes of Energy Nutrients across Splanchnic Tissues in Ruminants: Modélisation des Relations entre L’alimentation et les Flux Splanchniques de Nutriments Énergétiques Chez le Ruminant. Ph.D. Thesis, AgroParisTech, Paris, France, 2009. [Google Scholar]
- Martineau, R.; Ortigues-Marty, I.; Vernet, J.; Lapierre, H. Technical note: Correction of net portal absorption of nitrogen compounds for differences in methods: First step of a meta-analysis. J. Anim. Sci. 2009, 87, 3300–3303. [Google Scholar] [CrossRef]
- Daniel, J.B.; Friggens, N.C.; Chapoutot, P.; van Laar, H.; Sauvant, D. Milk yield and milk composition responses to change in predicted net energy and metabolizable protein: A meta-analysis. Anim. Int. J. Anim. Biosci. 2016, 10, 1975–1985. [Google Scholar] [CrossRef] [Green Version]
- Daniel, J.B.; Friggens, N.C.; van Laar, H.; Ingvartsen, K.L.; Sauvant, D. Modeling homeorhetic trajectories of milk component yields, body composition and dry-matter intake in dairy cows: Influence of parity, milk production potential and breed. Anim. Int. J. Anim. Biosci. 2018, 12, 1182–1195. [Google Scholar] [CrossRef]
- Flachowsky, G.; Jeroch, H.; Kirchgeßner, M.; Pallauf, J.; Pfeffer, E.; Schulz, E.; Staudacher, W. Empfehlungen zur Energie- und Nährstoffversorgung der Milchkühe und Aufzuchtrinder 2001; Deutsche Landwirtschafts-Gesellschaft Verlag: Frankfurt, Germany, 2001; ISBN 0170-3757. [Google Scholar]
- Kuhla, B.; Nürnberg, G.; Albrecht, D.; Görs, S.; Hammon, H.M.; Metges, C.C. Involvement of skeletal muscle protein, glycogen, and fat metabolism in the adaptation on early lactation of dairy cows. J. Proteome Res. 2011, 10, 4252–4262. [Google Scholar] [CrossRef] [PubMed]
- Lindsay, D.B.; Barker, P.J.; Northrop, A.J.; Setchell, B.P.; Faichney, G.J. The recycling of carbon in glucose, lactate and alanine in sheep. J. Comp. Physiol. B 2005, 175, 413–422. [Google Scholar] [CrossRef] [PubMed]
- Rhoades, R.D.; Sawyer, J.E.; Chung, K.Y.; Schell, M.L.; Lunt, D.K.; Smith, S.B. Effect of dietary energy source on in vitro substrate utilization and insulin sensitivity of muscle and adipose tissues of Angus and Wagyu steers. J. Anim. Sci. 2007, 85, 1719–1726. [Google Scholar] [CrossRef] [PubMed]
- Bennink; Mellenberger, R.W.; Frobish, R.A.; de Bauman, E. Glucose oxidation and entry rate as affected by the initiation of lactation. J. Dairy Sci. 1972, 55, 712. [Google Scholar]
- Bruckental, I.; Oldham, J.D.; Sutton, J.D. Glucose and urea kinetics in cows in early lactation. Br. J. Nutr. 1980, 44, 33–45. [Google Scholar] [CrossRef]
- Baird, G.D.; van der Walt, J.G.; Bergman, E.N. Whole-body metabolism of glucose and lactate in productive sheep and cows. Br. J. Nutr. 1983, 50, 249–265. [Google Scholar] [CrossRef] [Green Version]
- Bickerstaffe, R.; Annison, E.F.; Linzell, J.L. The metabolism of glucose, acetate, lipids and amino acids in lactating dairy cows. J. Agric. Sci. 1974, 82, 71. [Google Scholar] [CrossRef]
- Hanigan, M.D.; Crompton, L.A.; Bequette, B.J.; Mills, J.A.N.; France, J. Modelling mammary metabolism in the dairy cow to predict milk constituent yield, with emphasis on amino acid metabolism and milk protein production: Model evaluation. J. Theor. Biol. 2002, 217, 311–330. [Google Scholar] [CrossRef]
- Cant, J.P.; Trout, D.R.; Qiao, F.; Purdie, N.G. Milk Synthetic Response of the Bovine Mammary Gland to an Increase in the Local Concentration of Arterial Glucose. J. Dairy Sci. 2002, 85, 494–503. [Google Scholar] [CrossRef]
- Mackle, T.R.; Dwyer, D.A.; Ingvartsen, K.L.; Chouinard, P.Y.; Ross, D.A.; Bauman, D.E. Evaluation of Whole Blood and Plasma in the Interorgan Supply of Free Amino Acids for the Mammary Gland of Lactating Dairy Cows. J. Dairy Sci. 2000, 83, 1300–1309. [Google Scholar] [CrossRef]
- Lemosquet, S.; Guinard-Flament, J.; Raggio, G.; Hurtaud, C.; van Milgen, J.; Lapierre, H. How does increasing protein supply or glucogenic nutrients modify mammary metabolism in lactating dairy cows? In 3rd EAAP International Symposium on Energy and Protein Metabolism and Nutrition; Wageningen Academic Publishers: Wageningen, The Netherlands, 2010. [Google Scholar]
- Moritz, A.; Kraft, W.; Dürr, U.M. (Eds.) Klinische Labordiagnostik in der Tiermedizin: Der neue Kraft/Dürr; mit 286 Tabellen; Vollständig Überarbeitete und Erweiterte Auflage; Schattauer: Stuttgart, Germany, 2014; ISBN 9783794527373. [Google Scholar]
- Harder, I.; Stamer, E.; Junge, W.; Thaller, G. Lactation curves and model evaluation for feed intake and energy balance in dairy cows. J. Dairy Sci. 2019, 102, 7204–7216. [Google Scholar] [CrossRef] [PubMed]
- Lescoat, P.; Sauvant, D. Development of a mechanistic model for rumen digestion validated using the duodenal flux of amino acids. Reprod. Nutr. Dev. 1995, 35, 45–70. [Google Scholar] [CrossRef] [PubMed] [Green Version]
- Martin, O.; Sauvant, D. Modélisation des contenus du tractus digestif bovin. In Proceedings of the Tenth Rencontres Autour des Recherches sur les Ruminants (3R), Paris, France, 3–4 December 2003; Volume 10, pp. 167–170. [Google Scholar]
- Bannink, A. Modelling Volatile Fatty Acid Dynamics and Rumen Function in Lactating Cows; Wageningen University and Research: Wageningen, Netherlands, 2007; ISBN 9085047854. [Google Scholar]
- Dong, R.; Zhao, G. Predicting in vitro rumen VFA production using CNCPS carbohydrate fractions with multiple linear models and artificial neural networks. PLoS ONE 2014, 9, e116290. [Google Scholar] [CrossRef]
- Loncke, C.; Nozière, P.; Vernet, J.; Lapierre, H.; Bahloul, L.; Al-Jammas, M.; Sauvant, D.; Ortigues-Marty, I. Net hepatic release of glucose from precursor supply in ruminants: A meta-analysis. Anim. Int. J. Anim. Biosci. 2020, 14, 1422–1437. [Google Scholar] [CrossRef] [Green Version]
- Bannink, A.; France, J.; Lopez, S.; Gerrits, W.; Kebreab, E.; Tamminga, S.; Dijkstra, J. Modelling the implications of feeding strategy on rumen fermentation and functioning of the rumen wall. Anim. Feed. Sci. Technol. 2008, 143, 3–26. [Google Scholar] [CrossRef]
- Lobley, G.E.; Lapierre, H. Post-absorptive metabolism of amino acids. Publ. Eur. Assoc. Anim. Prod. 2003, 109, 737–756. [Google Scholar]
- Reynolds, C.K.; Huntington, G.B.; Tyrrell, H.F.; Reynolds, P.J. Net Portal-Drained Visceral and Hepatic Metabolism of Glucose, L-Lactate, and Nitrogenous Compounds in Lactating Holstein Cows. J. Dairy Sci. 1988, 71, 1803–1812. [Google Scholar] [CrossRef]
- Reynolds, C.K.; Huntington, G.B.; Tyrrell, H.F.; Reynolds, P.J. Net Metabolism of Volatile Fatty Acids, D-β-Hydroxybutyrate, Nonesterified Fatty Acids, and Blood Gasses by Portal-Drained Viscera and Liver of Lactating Holstein Cows. J. Dairy Sci. 1988, 71, 2395–2405. [Google Scholar] [CrossRef]
- Reynolds, C.K.; Aikman, P.C.; Lupoli, B.; Humphries, D.J.; Beever, D.E. Splanchnic Metabolism of Dairy Cows During the Transition From Late Gestation Through Early Lactation. J. Dairy Sci. 2003, 86, 1201–1217. [Google Scholar] [CrossRef]
- Danfær, A.; Tetens, V.; Agergaard, N. Review and an experimental study on the physiological and quantitative aspects of gluconeogenesis in lactating ruminants. Comp. Biochem. Physiol. Part B Biochem. Mol. Biol. 1995, 111, 201–210. [Google Scholar] [CrossRef]
- Benson, J.A.; Reynolds, C.K.; Aikman, P.C.; Lupoli, B.; Beever, D.E. Effects of Abomasal Vegetable Oil Infusion on Splanchnic Nutrient Metabolism in Lactating Dairy Cows. J. Dairy Sci. 2002, 85, 1804–1814. [Google Scholar] [CrossRef] [Green Version]
- Larsen, M.; Kristensen, N.B. Effect of abomasal glucose infusion on splanchnic amino acid metabolism in periparturient dairy cows. J. Dairy Sci. 2009, 92, 3306–3318. [Google Scholar] [CrossRef] [PubMed]
- Larsen, M.; Kristensen, N.B. Effects of glucogenic and ketogenic feeding strategies on splanchnic glucose and amino acid metabolism in postpartum transition Holstein cows. J. Dairy Sci. 2012, 95, 5946–5960. [Google Scholar] [CrossRef] [PubMed]
- Bergman, E.N.; Heitmann, R.N. Metabolism of amino acids by the gut, liver, kidneys, and peripheral tissues. In Federation Proceedings; Europe PMC: London, UK, 1978; pp. 1228–1232. ISBN 0014-9446. [Google Scholar]
- Young, J.W. Gluconeogenesis in Cattle: Significance and Methodology. J. Dairy Sci. 1977, 60, 1–15. [Google Scholar] [CrossRef]
- Lomax, M.A.; Baird, G.D. Blood flow and nutrient exchange across the liver and gut of the dairy cow. Effects of lactation and fasting. Br. J. Nutr. 1983, 49, 481–496. [Google Scholar] [CrossRef] [Green Version]
- Hammon, H.M.; Metges, C.C.; Junghans, P.; Becker, F.; Bellmann, O.; Schneider, F.; Nürnberg, G.; Dubreuil, P.; Lapierre, H. Metabolic changes and net portal flux in dairy cows fed a ration containing rumen-protected fat as compared to a control diet. J. Dairy Sci. 2008, 91, 208–217. [Google Scholar] [CrossRef] [Green Version]
- Britton, R.; Krehbiel, C. Nutrient metabolism by gut tissues. J. Dairy Sci. 1993, 76, 2125–2131. [Google Scholar] [CrossRef]
- Lemosquet, S.; Rigout, S.; Bach, A.; Rulquin, H.; Blum, J.W. Glucose Metabolism in Lactating Cows in Response to Isoenergetic Infusions of Propionic Acid or Duodenal Glucose. J. Dairy Sci. 2004, 87, 1767–1777. [Google Scholar] [CrossRef] [Green Version]
- Brown, W.E.; Allen, M.S. Effects of intrajugular glucose infusion on feed intake, milk yield, and metabolic responses of early postpartum cows fed diets varying in protein and starch concentration. J. Dairy Sci. 2013, 96, 7132–7142. [Google Scholar] [CrossRef] [Green Version]
- Drackley, J.K.; Overton, T.R.; Douglas, G.N. Adaptations of Glucose and Long-Chain Fatty Acid Metabolism in Liver of Dairy Cows during the Periparturient Period. J. Dairy Sci. 2001, 84, E100–E112. [Google Scholar] [CrossRef]
- Lin, E.C. Glycerol utilization and its regulation in mammals. Annu. Rev. Biochem. 1977, 46, 765–795. [Google Scholar] [CrossRef] [PubMed]
- Weber, C.; Hametner, C.; Tuchscherer, A.; Losand, B.; Kanitz, E.; Otten, W.; Sauerwein, H.; Bruckmaier, R.M.; Becker, F.; Kanitz, W.; et al. Hepatic gene expression involved in glucose and lipid metabolism in transition cows: Effects of fat mobilization during early lactation in relation to milk performance and metabolic changes. J. Dairy Sci. 2013, 96, 5670–5681. [Google Scholar] [CrossRef] [Green Version]
- Hammon, H.M.; Stürmer, G.; Schneider, F.; Tuchscherer, A.; Blum, H.; Engelhard, T.; Genzel, A.; Staufenbiel, R.; Kanitz, W. Performance and metabolic and endocrine changes with emphasis on glucose metabolism in high-yielding dairy cows with high and low fat content in liver after calving. J. Dairy Sci. 2009, 92, 1554–1566. [Google Scholar] [CrossRef] [PubMed] [Green Version]
- Gross, J.J.; van Dorland, H.A.; Bruckmaier, R.M.; Schwarz, F.J. Performance and metabolic profile of dairy cows during a lactational and deliberately induced negative energy balance with subsequent realimentation. J. Dairy Sci. 2011, 94, 1820–1830. [Google Scholar] [CrossRef] [PubMed]
- Van den Top, A.M.; Geelen, M.J.; Wensing, T.; Wentink, G.H.; van’t Klooster, A.T.; Beynen, A.C. Higher postpartum hepatic triacylglycerol concentrations in dairy cows with free rather than restricted access to feed during the dry period are associated with lower activities of hepatic glycerolphosphate acyltransferase. J. Nutr. 1996, 126, 76–85. [Google Scholar] [CrossRef] [PubMed] [Green Version]
- Smith, N.E.; Baldwin, R.L. Effects of Breed, Pregnancy, and Lactation on Weight of Organs and Tissues in Dairy Cattle. J. Dairy Sci. 1974, 57, 1055–1060. [Google Scholar] [CrossRef]
- Schäff, C.; Hammon, H.M.; Röntgen, M.; Kuhla, B. Skeletal muscle fatty acid oxidation in lactating dairy cows during early lactation. In Energy and Protein Metabolism and Nutrition in Sustainable Animal Production; Oltjen, J.W., Kebreab, E., Lapierre, H., Eds.; Wageningen Academic Publishers: Wageningen, The Netherland, 2013; pp. 467–468. ISBN 978-90-8686-781-3. [Google Scholar]
- Mann, S.; Leal Yepes, F.A.; Wakshlag, J.J.; Behling-Kelly, E.; McArt, J.A.A. The effect of different treatments for early-lactation hyperketonemia on liver triglycerides, glycogen, and expression of key metabolic enzymes in dairy cattle. J. Dairy Sci. 2018, 101, 1626–1637. [Google Scholar] [CrossRef]
- Duske, K.; Hammon, H.M.; Langhof, A.-K.; Bellmann, O.; Losand, B.; Nürnberg, K.; Nürnberg, G.; Sauerwein, H.; Seyfert, H.M.; Metges, C.C. Metabolism and lactation performance in dairy cows fed a diet containing rumen-protected fat during the last twelve weeks of gestation. J. Dairy Sci. 2009, 92, 1670–1684. [Google Scholar] [CrossRef] [Green Version]
- Galvão, K.N.; Flaminio, M.J.B.F.; Brittin, S.B.; Sper, R.; Fraga, M.; Caixeta, L.; Ricci, A.; Guard, C.L.; Butler, W.R.; Gilbert, R.O. Association between uterine disease and indicators of neutrophil and systemic energy status in lactating Holstein cows. J. Dairy Sci. 2010, 93, 2926–2937. [Google Scholar] [CrossRef] [Green Version]
- Moretti, P.; Probo, M.; Cantoni, A.; Paltrinieri, S.; Giordano, A. Fluctuation of neutrophil counts around parturition in Holstein dairy cows with and without retained placenta. Res. Vet. Sci. 2016, 107, 207–212. [Google Scholar] [CrossRef] [PubMed]
- Baldwin, R.L. Modeling Ruminant Digestion and Metabolism, 1st ed.; Chapman & Hall: London, UK, 1995; ISBN 041259160X. [Google Scholar]
- Hanigan, M.D.; Baldwin, R.L. A mechanistic model of mammary gland metabolism in the lactating cow. Agric. Syst. 1994, 45, 369–419. [Google Scholar] [CrossRef]
- Van Wijk, R.; van Solinge, W.W. The energy-less red blood cell is lost: Erythrocyte enzyme abnormalities of glycolysis. Blood 2005, 106, 4034–4042. [Google Scholar] [CrossRef]
- Esievo, K.A.; Moore, W.E. Effects of dietary protein and stage of lactation on the haematology and erythrocyte enzymes activities of high-producing dairy cattle. Res. Vet. Sci. 1979, 26, 53–58. [Google Scholar] [CrossRef]
- Magistretti, P.J.; Allaman, I. A cellular perspective on brain energy metabolism and functional imaging. Neuron 2015, 86, 883–901. [Google Scholar] [CrossRef] [PubMed] [Green Version]
- Oddy, V.H.; Gooden, J.M.; Hough, G.M.; Teleni, E.; Annison, E.F. Partitioning of nutrients in merino ewes. II. Glucose utilization by skeletal muscle, the pregnant uterus and the lactating mammary gland in relation to whole body glucose utilization. Aust. J. Biol. Sci. 1985, 38, 95–108. [Google Scholar] [CrossRef]
- Vernon, R.G. Lipid metabolism in the adipose tissue of ruminant animals. Prog. Lipid Res. 1980, 19, 23–106. [Google Scholar] [CrossRef]
- Smith, S.B.; Crouse, J.D. Relative contributions of acetate, lactate and glucose to lipogenesis in bovine intramuscular and subcutaneous adipose tissue. J. Nutr. 1984, 114, 792–800. [Google Scholar] [CrossRef]
- Hurtaud, C.; Lemosquet, S.; Rulquin, H. Effect of Graded Duodenal Infusions of Glucose on Yield and Composition of Milk from Dairy Cows. 2. Diets Based on Grass Silage. J. Dairy Sci. 2000, 83, 2952–2962. [Google Scholar] [CrossRef]
- Kim, C.H.; Kim, T.G.; Choung, J.J.; Chamberlain, D.G. Effects of intravenous infusion of amino acids and glucose on the yield and concentration of milk protein in dairy cows. J. Dairy Res. 2001, 68, 27–34. [Google Scholar] [CrossRef]
- Nielsen, M.O.; Madsen, T.G.; Hedeboe, A.M. Regulation of mammary glucose uptake in goats: Role of mammary gland supply, insulin, IGF-1 and synthetic capacity. J. Dairy Res. 2001, 68, 337–349. [Google Scholar] [CrossRef] [PubMed]
- Huhtanen, P.; Vanhatalo, A.; Varvikko, T. Effects of Abomasal Infusions of Histidine, Glucose, and Leucine on Milk Production and Plasma Metabolites of Dairy Cows Fed Grass Silage Diets. J. Dairy Sci. 2002, 85, 204–216. [Google Scholar] [CrossRef]
- Lemosquet, S.; Delamaire, E.; Lapierre, H.; Blum, J.W.; Peyraud, J.L. Effects of glucose, propionic acid, and nonessential amino acids on glucose metabolism and milk yield in Holstein dairy cows. J. Dairy Sci. 2009, 92, 3244–3257. [Google Scholar] [CrossRef] [PubMed] [Green Version]
- Nichols, K.; Bannink, A.; Doelman, J.; Dijkstra, J. Mammary gland metabolite utilization in response to exogenous glucose or long-chain fatty acids at low and high metabolizable protein levels. J. Dairy Sci. 2019, 102, 7150–7167. [Google Scholar] [CrossRef] [PubMed]
- Zhao, F.-Q.; Keating, A.F. Expression and regulation of glucose transporters in the bovine mammary gland. J. Dairy Sci. 2007, 90 (Suppl. S1), E76–E86. [Google Scholar] [CrossRef] [Green Version]
- Zhao, F.Q.; Moseley, W.M.; Tucker, H.A.; Kennelly, J.J. Regulation of glucose transporter gene expression in mammary gland, muscle, and fat of lactating cows by administration of bovine growth hormone and bovine growth hormone-releasing factor. J. Anim. Sci. 1996, 74, 183–189. [Google Scholar] [CrossRef]
- Cai, J.; Zhao, F.-Q.; Liu, J.-X.; Wang, D.-M. Local Mammary Glucose Supply Regulates Availability and Intracellular Metabolic Pathways of Glucose in the Mammary Gland of Lactating Dairy Goats Under Malnutrition of Energy. Front. Physiol. 2018, 9, 1467. [Google Scholar] [CrossRef]
- Collard, B.L.; Boettcher, P.J.; Dekkers, J.; Petitclerc, D.; Schaeffer, L.R. Relationships Between Energy Balance and Health Traits of Dairy Cattle in Early Lactation. J. Dairy Sci. 2000, 83, 2683–2690. [Google Scholar] [CrossRef]
- Esposito, G.; Irons, P.C.; Webb, E.C.; Chapwanya, A. Interactions between negative energy balance, metabolic diseases, uterine health and immune response in transition dairy cows. Anim. Reprod. Sci. 2014, 144, 60–71. [Google Scholar] [CrossRef] [Green Version]
- Sundrum, A. Metabolic Disorders in the Transition Period Indicate that the Dairy Cows’ Ability to Adapt is Overstressed. Animals 2015, 5, 978–1020. [Google Scholar] [CrossRef]
- Kessel, S.; Stroehl, M.; Meyer, H.H.D.; Hiss, S.; Sauerwein, H.; Schwarz, F.J.; Bruckmaier, R.M. Individual variability in physiological adaptation to metabolic stress during early lactation in dairy cows kept under equal conditions. J. Anim. Sci. 2008, 86, 2903–2912. [Google Scholar] [CrossRef] [PubMed]
- Graber, M.; Kohler, S.; Müller, A.; Burgermeister, K.; Kaufmann, T.; Bruckmaier, R.M.; van Dorland, H.A. Identification of plasma and hepatic parameters related to metabolic robustness in dairy cows. J. Anim. Physiol. Anim. Nutr. 2012, 96, 75–84. [Google Scholar] [CrossRef] [PubMed]
- Ortigues-Marty, I.; Agabriel, J.; Vernet, J.; Sepchat, B.; Al-Jammas, M.; Nozière, P. Contribution of nutrient fluxes to the evolution of the net energy systems, example of the INRA feeding system for beef cattle. Transl. Anim. Sci. 2019, 3, 1048–1063. [Google Scholar] [CrossRef] [PubMed] [Green Version]
- Colditz, I. Allocation of resources to immune responses. In Resource Allocation Theory Applied to Farm Animal Production; Rauw, W.M., Ed.; CABI: Wallingford, UK, 2009; pp. 192–209. ISBN 9781845933944. [Google Scholar]
- Eger, M.; Hussen, J.; Koy, M.; Danicke, S.; Schuberth, H.-J.; Breves, G. Glucose transporter expression differs between bovine monocyte and macrophage subsets and is influenced by milk production. J. Dairy Sci. 2016, 99, 2276–2287. [Google Scholar] [CrossRef] [Green Version]
- Alba-Loureiro, T.C.; Munhoz, C.D.; Martins, J.O.; Cerchiaro, G.A.; Scavone, C.; Curi, R.; Sannomiya, P. Neutrophil function and metabolism in individuals with diabetes mellitus. Braz. J. Med. Biol. Res. 2007, 40, 1037–1044. [Google Scholar] [CrossRef] [Green Version]
- Welniak, L.; Sun, R.; Murphy, W. The role of growth hormone in T-cell development and reconstitution. J. Leukoc. Biol. 2002, 71, 381–387. [Google Scholar]
- Okamura, C.S.; Bader, J.F.; Keisler, D.H.; Lucy, M.C. Short communication: Growth hormone receptor expression in two dairy breeds during the periparturient period. J. Dairy Sci. 2009, 92, 2706–2710. [Google Scholar] [CrossRef] [Green Version]
- Jiang, H.; Lucy, M.C.; Crooker, B.A.; Beal, W.E. Expression of Growth Hormone Receptor 1A mRNA is Decreased in Dairy Cows but not in Beef Cows at Parturition. J. Dairy Sci. 2005, 88, 1370–1377. [Google Scholar] [CrossRef] [Green Version]
- Snijders, S.; Dillon, P.; O’Farrell, K.; Diskin, M.; Wylie, A.; O’Callaghan, D.; Rath, M.; Boland, M. Genetic merit for milk production and reproductive success in dairy cows. Anim. Reprod. Sci. 2001, 65, 17–31. [Google Scholar] [CrossRef]
| Feed | DM | DM | ME | OM | CP | CL | CF | ST | S | ADFom | aNDFom |
|---|---|---|---|---|---|---|---|---|---|---|---|
| % | g/kg FM | MJ/kg DM | g/kg DM | g/kg DM | g/kg DM | g/kg DM | g/kg DM | g/kg DM | g/kg DM | g/kg DM | |
| Grass silage, wilted, with additive | 25.4 ± 3.5 | 404.5 ± 13.6 | 10.6 ± 0.1 | 905.1 ± 2.2 | 157.9 ± 1.3 | 40.5 ± 1.5 | 247.6 ± 3.7 | 0.0 (0.0) | 14.0 ± 1.6 | 286.7 ± 8.7 | 445.7 ± 4.1 |
| Hay, permanent grassland | 4.3 ± 1.1 | 916.0 ± 0.0 | 7.3 ± 0.0 | 922.0 ± 0.0 | 100.0 ± 0.0 | 18.0 ± 0.0 | 306.0 ± 0.0 | 0.0 (0.0) | 69.0 ± 0.0 | 370.0 ± 0.0 | 233.0 ± 27.8 |
| Corn silage, whole crop | 20.9 ± 3.6 | 330.9 ± 3.5 | 11.3 ± 0.1 | 958.7 ± 1.7 | 78.8 ± 2.1 | 36.9 ± 0.6 | 163.2 ± 6.6 | 345.3 ± 3.5 | 0.0 ± 0.0 | 196.5 ± 8.2 | 656.0 0.0 |
| Pressed sugar beet pulp silage | 12.2 ± 4.1 | 295.2 ± 10.3 | 11.7 ± 0.2 | 920.5 ± 23.4 | 84.4 ± 5.9 | 13.5 ± 1.7 | 169.8 ± 8.0 | 0.0 ± 0.0 | 12.9 ± 1.0 | 203.0 ± 7.9 | 337.0 ± 5.9 |
| Vegetable oils | 0.8 ± 0.0 | 990.0 ± 0.0 | 28.7 ± 0.0 | 875.0 ± 0.0 | 0.0 ± 0.0 | 840.0 ± 0.0 | 0.0 ± 0.0 | 0.0 ± 0.0 | 0.0 ± 0.0 | 0.0 ± 0.0 | 419.1 ± 12.8 |
| Barley straw | 1.6 ± 0.7 | 860.0 ± 0.0 | 5.9 ± 0.0 | 954.0 ± 0.0 | 34.0 ± 0.0 | 12.0 ± 0.0 | 380.0 ± 0.0 | 0.0 ± 0.0 | 8.0 ± 0.0 | 440.0 ± 0.0 | 0.0 ± 0.0 |
| Concentrates * | 34.8 ± 0.7 | 883.1 ± 2.8 | 13.0 ± 0.2 | 938.8 ± 12.3 | 268.0 ± 17.5 | 38.7 ± 3.8 | 101.0 ± 25.2 | 253.6 ± 17.2 | 69.1 ± 6.0 | 141.5 ± 34.5 | 668.0 ± 0.0 |
| Total mixed ration | 100.0 ± 0.0 | 420.3 ± 18.2 | 11.5 ± 0.2 | 930.9 ± 4.3 | 160.7 ± 1.7 | 33.5 ± 1.1 | 160.1 ± 2.7 | 222.1 ± 6.2 | 58.9 ± 5.9 | 219.7 ± 8.0 | 334.6 ± 4.8 |
| Feed | OMd | Ed | ED6_N | ED6_S | FA | PF | FLref |
|---|---|---|---|---|---|---|---|
| % | % | % | % | g/kg DM | g/kg DM | % BW | |
| Grass silage, wilted, with additive | 70 | 66 | 77 | - | 22 | 85 | 1.39 |
| Hay, permanent grassland | 62 | 59 | 68 | - | 16 | 0 | - |
| Corn silage, whole crop | 73 | 70 | 75 | 70 | 28 | 80 | 1.53 |
| Pressed sugar beet pulp silage | 86 | 82 | 66 | - | 5 | 140 | 1.28 |
| Vegetable oils | 89 | 100 | 100 | - | 840 | 0 | 1.63 |
| Barley straw | 44 | 40 | 68 | - | 6 | 0 | - |
| Concentrates * | 80 | 86 | 52 | 85 | 37 | 0 | 2.47 |
| BW Level (kg) | n | Mean BW (kg) |
|---|---|---|
| <500 | 357 | 485 |
| 500 to 600 | 6015 | 561 |
| 600 to 700 | 8007 | 644 |
| 700 to 800 | 3416 | 738 |
| >800 | 300 | 824 |
| DMI Level (kg) | n | Mean DMI (kg) |
| <10 | 650 | 8.6 |
| 10 to 15 | 2621 | 12.9 |
| 15 to 20 | 6138 | 17.7 |
| 20 to 25 | 12,859 | 20.1 |
| 25 to 30 | 1880 | 26.5 |
| >30 | 136 | 31.4 |
| Intake Level (kgDM/kgBW) | OMD % | RfOM g/kgDM | RdNDF g/kgDM | VFA Prod mol/kgDM | Pro % mol/100 mol | PDI g/kgDM | STdI g/kgDM |
|---|---|---|---|---|---|---|---|
| <2 | 73.0 ±1.1 | 506.5 ±11.5 | 186.1 ±12.8 | 4.3 ±0.1 | 19.4 ±0.7 | 96.2 ±2.8 | 24.3 ±2.8 |
| 2–3 | 70.2 ±1.1 | 469.8 ±11.3 | 167.3 ±12.7 | 4.0 ±0.1 | 21.8 ±0.7 | 99.0 ±3.0 | 28.4 ±3.2 |
| 3–4 | 67.2 ±1.1 | 431.6 ±11.3 | 147.8 ±12.6 | 3.6 ±0.1 | 24.5 ±0.7 | 102.0 ±3.3 | 32.6 ±3.6 |
| 4–5 | 64.3 ±1.2 | 395.2 ±12.8 | 129.4 ±12.5 | 3.3 ±0.1 | 27.0 ±0.8 | 104.8 ±3.5 | 36.6 ±4.1 |
| >5 | 60.1 ±1.5 | 344.9 ±17.0 | 105.8 ±10.8 | 2.9 ±0.1 | 30.7 ±1.2 | 109.1 ±3.9 | 42.5 ±4.9 |
| p | Correlation Coefficients DIM 1–105 | p | Correlation Coefficients DIM 1 to 7 | |||||
|---|---|---|---|---|---|---|---|---|
| Zero Order | Partial | Semi-Partial | Zero Order | Partial | Semi-Partial | |||
| DMI | 0.000 | 0.819 | 0.987 | 0.849 | 0.000 | 0.332 | 0.956 | 0.716 |
| MY | 0.000 | −0.004 | −0.964 | −0.491 | 0.000 | −0.521 | −0.944 | −0.628 |
| L % | 0.000 | −0.028 | −0.552 | −0.090 | <0.001 | −0.239 | −0.473 | −0.118 |
| BW | 0.000 | 0.064 | −0.667 | −0.121 | <0.001 | −0.055 | −0.448 | −0.110 |
| BWLOSS | 0.000 | 0.244 | −0.698 | −0.132 | <0.001 | −0.276 | −0.839 | −0.339 |
| DIM | 0.000 | 0.467 | −0.284 | −0.040 | 0.501 | −0.285 | −0.023 | −0.005 |
| LACT | <0.001 | 0.021 | −0.054 | −0.007 | 0.691 | −0.009 | −0.014 | −0.003 |
| ME | 0.001 | 0.039 | −0.024 | −0.003 | <0.001 | −0.052 | −0.141 | −0.031 |
| CP | 0.396 | −0.097 | −0.006 | −0.001 | 0.358 | 0.115 | −0.031 | −0.007 |
| CF | 0.005 | −0.045 | 0.021 | 0.003 | 0.827 | 0.042 | 0.007 | 0.002 |
| ST | 0.973 | −0.029 | 0.000 | 0.000 | 0.201 | −0.036 | −0.044 | −0.010 |
| CS | <0.001 | 0.110 | −0.048 | −0.007 | 0.489 | −0.035 | −0.024 | −0.005 |
| aNDFom | <0.001 | 0.090 | 0.037 | 0.005 | <0.001 | −0.055 | 0.117 | 0.026 |
| CON % | <0.001 | 0.129 | 0.120 | 0.016 | <0.001 | 0.100 | 0.226 | 0.051 |
Publisher’s Note: MDPI stays neutral with regard to jurisdictional claims in published maps and institutional affiliations. |
© 2022 by the authors. Licensee MDPI, Basel, Switzerland. This article is an open access article distributed under the terms and conditions of the Creative Commons Attribution (CC BY) license (https://creativecommons.org/licenses/by/4.0/).
Share and Cite
Habel, J.; Chapoutot, P.; Koch, C.; Sundrum, A. Estimation of Individual Glucose Reserves in High-Yielding Dairy Cows. Dairy 2022, 3, 438-464. https://doi.org/10.3390/dairy3030033
Habel J, Chapoutot P, Koch C, Sundrum A. Estimation of Individual Glucose Reserves in High-Yielding Dairy Cows. Dairy. 2022; 3(3):438-464. https://doi.org/10.3390/dairy3030033
Chicago/Turabian StyleHabel, Jonas, Patrick Chapoutot, Christian Koch, and Albert Sundrum. 2022. "Estimation of Individual Glucose Reserves in High-Yielding Dairy Cows" Dairy 3, no. 3: 438-464. https://doi.org/10.3390/dairy3030033
APA StyleHabel, J., Chapoutot, P., Koch, C., & Sundrum, A. (2022). Estimation of Individual Glucose Reserves in High-Yielding Dairy Cows. Dairy, 3(3), 438-464. https://doi.org/10.3390/dairy3030033