Next Article in Journal
Emotions and Coping: “What I Feel about It, Gives Me More Strategies to Deal with It?”
Previous Article in Journal
A Gender Analysis of Hospital Workers during the COVID-19 Pandemic Using the Distress Questionnaire-5: A Cross-Sectional Study
 
 
Please note that, as of 22 March 2024, Psych has been renamed to Psychology International and is now published here.
Article

Proteins in Scalp Hair of Preschool Children

by
Cynthia R. Rovnaghi
1,
Kratika Singhal
2,
Ryan D. Leib
2,
Maria Xenochristou
3,
Nima Aghaeepour
3,
Allis S. Chien
2,
Deendayal Dinakarpandian
4 and
Kanwaljeet J. S. Anand
1,5,*
1
Child Wellness Lab, Maternal & Child Health Research Institute, Stanford University School of Medicine, Stanford, CA 94305, USA
2
Stanford University Mass Spectrometry (SUMS) Lab, Stanford University, Stanford, CA 94305, USA
3
Departments of Anesthesiology (Research), Biomedical Data Science & Pediatrics (Neonatology), Stanford University School of Medicine, Stanford, CA 94305, USA
4
Department of Medicine (Biomedical Informatics Research), Stanford University School of Medicine, Stanford, CA 94305, USA
5
Departments of Pediatrics (Critical Care Medicine) and Anesthesiology (by Courtesy), Stanford University School of Medicine, Stanford, CA 94305, USA
*
Author to whom correspondence should be addressed.
Psych 2024, 6(1), 143-162; https://doi.org/10.3390/psych6010009
Submission received: 12 December 2023 / Revised: 31 December 2023 / Accepted: 9 January 2024 / Published: 29 January 2024
(This article belongs to the Section Neuropsychology, Mental Health and Brain Disorders)

Abstract

:
Background. Early childhood experiences have long-lasting effects on subsequent mental and physical health, education, and employment. The measurement of these effects relies on insensitive behavioral signs, subjective assessments by adult observers, neuroimaging or neurophysiological studies, or retrospective epidemiologic outcomes. Despite intensive research, the underlying mechanisms of these long-term changes in development and health status remain unknown. Methods. We analyzed scalp hair from healthy children and their mothers using an unbiased proteomics platform combining tandem mass spectrometry, ultra-performance liquid chromatography, and collision-induced dissociation to reveal commonly observed hair proteins with a spectral count of 3 or higher. Results. We observed 1368 non-structural hair proteins in children and 1438 non-structural hair proteins in mothers, with 1288 proteins showing individual variability. Mothers showed higher numbers of peptide spectral matches and hair proteins compared to children, with important age-related differences between mothers and children. Age-related differences were also observed in children, with differential protein expression patterns between younger (2 years and below) and older children (3–5 years). We observed greater similarity in hair protein patterns between mothers and their biological children compared with mothers and unrelated children. The top 5% of proteins driving population variability represented biological pathways associated with brain development, immune signaling, and stress response regulation. Conclusions. Non-structural proteins observed in scalp hair include promising biomarkers to investigate the long-term developmental changes and health status associated with early childhood experiences.

1. Introduction

Early human development is extremely sensitive to parental, environmental, and societal influences that vary with the history of each individual (via genetic and epigenetic factors) and with their daily experiences. Variations in these factors, such as stress and social determinants of health, can singly or collectively introduce differences in developmental outcomes [1,2,3,4]. Such differences are then magnified in the higher-order cognitive and behavioral capacities of the human mind–brain–body connectome, which are built on a series of sequential or staggered developmental epochs that can enable or constrain individuals’ future potential, their role(s) in society, as well as their mental and physical health [4,5,6,7,8].
Objective assessment of social, emotional, and other environmental inputs across multiple timescales is challenging in early childhood. These challenges result from most subjects being pre-verbal, coming from unknown environments, or accompanied by unreliable, fearful, or distrusting historians [1,3,9,10]. Developmental timescales can also range from milliseconds to minutes (e.g., affecting acute neuromodulatory tone, neuronal oscillations, or neuroendocrine changes), days to weeks (e.g., affecting circadian rhythms, metabolic functions, or memory and learning), or months to years (e.g., affecting brain growth and brain plasticity or emerging cognitive, behavioral, or social capacities) [4,11]. Neurophysiological, neuroimaging, and observational studies have attempted to describe and quantify early developmental changes, but there remains a need for non-invasive, objective biomarkers that can be measured serially across the months and years of childhood development [12,13,14,15].
Human scalp hair from preschool children, derived from the neuroectoderm and mesoderm, grows constantly at about 1 cm/month and evolves via the prenatal lanugo, postnatal vellus, intermediate medullary, and terminal hair stages [16]. Hair is comprised of 65–85% protein, 15–35% water, 1–9% lipids, and 0.1–5% pigment, like melanin and trace elements [17]. Constantly growing scalp hair incorporates both endogenous and exogenous proteins in a time-averaged chronological manner [18], unlike any other biospecimens [19]. Therefore, it is used routinely to monitor drug exposures, heavy metals, and other environmental toxins [20] or even reflect the social determinants of health [3].
Developmentally regulated hair proteins could offer biomarker candidates for the mind–brain–body connectome with the potential to monitor health status in real time during early childhood development. However, all published data on hair proteins are limited to adult subjects, include relatively small sample sizes, and focus mainly on structural hair proteins. Lee et al. described 343 hair proteins from three adults, showing evidence for post-translational modifications [21]. Laatsch et al. analyzed hair from 18 males and 3 females, reporting ethnic differences in keratins and keratin-associated proteins (KAPs) [22]. Carlson et al. characterized hair proteins from one adult with limited sample availability [23], whereas Wu et al. used hierarchical protein clustering to match 10 monozygotic twin pairs and differentiate them from unrelated individuals [24]. Parker et al. reported quantifiable measures [21] of identity discrimination and racial ancestry by detecting genetically variant peptides in the structural hair proteins for forensic purposes [25].
To fill the extant gaps in knowledge, we analyzed non-structural hair proteins using ultra-performance liquid chromatography tandem mass spectrometry (UPLC–MS/MS) and ELISA-based validation studies conducted on a limited subset of the detected non-structural hair proteins present in preschool children and their mothers. Our subjects were not exposed to early life adversity, as evidenced by parental income, household structure, health insurance, and parent education [5] as well as hair cortisol concentrations [4,26].

2. Materials and Methods

After IRB approval and parental consent, mothers and children aged 1–6 years were recruited from local preschool facilities. All children were developmentally appropriate, healthy, and belonged to stable nuclear families (Table 1). We excluded children with tinea capitis, alopecia areata, eczema, or other scalp conditions; those receiving any prescription or over-the-counter drugs or steroid therapy in the past 3 months; and those with chronic medical conditions, developmental delay, or chemical exposures to the hair prior to study entry. Hair samples from the posterior vertex (1 cm2 area) were trimmed at 0.1 mm from the scalp and stored in Ziploc® bags at 4 °C.

2.1. Hair Protein Extraction

Proprietary methods were developed for extracting the soluble protein components of human scalp hair.

2.2. Proteomics Method

Protein pellets were resuspended in 50 mM ammonium bicarbonate in the presence of 0.0015% ProteaseMAX (Promega, Madison, WI, USA), and the total protein amount was estimated with Pierce BCA assays (Thermo Fisher Scientific, San Jose, CA, USA) for the consistent loading of all samples. Proteins were digested with 0.25 µg of Trypsin/LysC (Promega) at a 1:100 enzyme/substrate ratio overnight at 37 °C. Proteolytic digestion was quenched with 1% formic acid; peptides were dried by speed vac before dissolving in 30 µL of reconstitution buffer (2% acetonitrile + 0.1% Formic acid) to a concentration of 1 µg/µL, and 2 µL of this solution was injected into the MS instrument.
Experiments were performed on the Orbitrap Fusion Tribrid mass spectrometer (Thermo Scientific) coupled with an ACQUITY M-Class ultra-performance liquid chromatography (UPLC) system (Waters Corporation, Milford, MA, USA). For a typical LCMS experiment (liquid chromatography/mass spectrometry), a flow rate of 450 nL/min was used, in which mobile phase A was 0.2% formic acid in water and mobile phase B was 0.2% formic acid in acetonitrile. Analytical columns were pulled using fused silica (I.D. 100 microns) and packed with Magic 1.8-micron 120Å UChrom C18 stationary phase (nanoLCMS Solutions) to a length of ~25 cm. Peptides were directly injected onto the analytical column using a gradient (2–45% B followed by a high-B wash) of 80 min. The MS was operated in a data-dependent fashion using CID (collision-induced dissociation) to generate MS/MS spectra, which were collected in the ion trap with the collisional energy set at 35.
The *.raw data files were processed using Byonic v3.2.0 (ProteinMetrics, Cupertino, CA, USA) to infer protein isoforms using the Uniprot Homo sapiens database. Proteolysis with Trypsin/LysC was assumed to be semi-specific, allowing for N-ragged cleavage with up to 2 missed cleavage sites. Precursor mass accuracies were maintained within 12 ppm and 0.4 Da for MS/MS fragments. Proteins were limited to a false discovery rate (FDR) of 1% or lower using standard target-decoy approaches [27], and only the proteins with >3 spectral counts were selected for further data processing; keratins and KAPs were removed at this stage.

2.3. Generation of Age-Associated Proteomic Libraries

Initially, standard UPLC–MS/MS methods (Section 2.2) were employed to identify non-structural hair shaft proteins, using protein purification to remove keratins and establish age-associated hair shaft proteomic libraries with pooled hair samples from 40 children of diverse races/ethnicities (Asian, White, mixed, or other races; Hispanic/non-Hispanic ethnicity) aged 1–5 years (mean/SD = 44.5 months ± 12.6 months) and 43 mothers also of diverse races/ethnicities (aged 39 years ± 5 years). The utilization of large numbers of individuals of diverse races and ethnicities improved our ability to detect representative patterns of non-structural proteins incorporated in the hair shaft. We observed 1368 non-structural hair proteins in children and 1438 non-structural hair proteins in mothers, with 1288 proteins showing individual variability. The total number of age-associated proteins discovered in these libraries was also detected in the analyses of 40 independent subjects that were not used for the generation of the libraries. Individual hair samples from 8 mothers with 16 biologically related children and 16 unrelated children were analyzed against the pooled hair protein libraries to create a master library of hair proteins. These data were deposited through the PRIDE repository [28] into the ProteomeXchange Consortium [29,30].

2.4. Human Scalp Hair Shaft Proteoforms Validation Studies

Surplus volumes of protein remaining after UPLC-MS/MS generated libraries individual evaluations, and the quantification of hair cortisol concentrations (HCCs) were pooled by low, intermediate, or high HCC values. The hair cortisol concentration (HCC) assays were validated previously [31]. These pools were evaluated using commercially available ELISA kits according to the manufacturer’s instructions for cortisol (ALPCO/11-CORHU-E01-SLV), arginine vasopressin (AVP, Enzo/ADI-900-017A), Cu/ZN superoxide dismutase (SOD1, Enzo/ALX-850-033), glial fibrillary acidic protein (GFAP, Bioatrik/EKU04380), and HtrA serine peptidase 2 (HTRA2, Thermoscientific/EHHTRA2).

2.5. Statistical Analysis

Spectral counts were used to calculate Euclidean distances between individuals and determine hierarchical clustering. A correlation matrix with Spearman’s coefficient was also used for the rank-based depiction of similarities between the individual hair proteomes.
Principal component analysis (PCA) [32,33,34] was used to reduce the dimensionality of this rich dataset. PCA is a widely used technique for the analytical modeling of linear combinations of the original dimensions, which are called principal components [34]. The largest proportion of data variance is captured by the first principal component, the second largest proportion of variance falls into the second principal component, and so on [32]. For the first five principal components from each PCA, we multiplied the loading scores of each protein by the percent variance explained by that corresponding principal component; these weighted scores were summed for each protein to give its total loading score (TLS).
Weighted Score = Loading Score * Proportion of Variance
T o t a l   L o a d i n g   S c o r e   T L S = P C = 1 5 W e i g h t e d   s c o r e
On the basis of their TLS values, the top 5% of proteins were selected as the main drivers of variability in hair protein expression.
Additionally, we used t-distributed stochastic neighboring embedding (tSNE), a non-linear probabilistic approach [35,36], to visualize proteins with non-linear similarity in high-dimensional space as neighbors in low-dimensional linear depictions. Unlike the reproducible PCA results, the probabilistic nature of tSNE can result in somewhat different results for each computation. To avoid serendipitous results, we ran each computation at least 10 times to ensure reproducibility. For each computation, the maximum number of iterations to converge was set to 1000, and perplexity was set to the maximum permitted value. The statistical significance of the tSNE clustering was calculated by how often a given statistic was reproduced in 1000 simulations of permuted versions of the dataset.
Boolean profiles of the hair proteins were also compared between the original dataset (each mother coupled with her own children) and 5000 simulated datasets, which were created by swapping mothers between families such that no mother was paired with her own children, but the two siblings remained together in all simulated datasets. Observed conservation in pairwise intra-family Manhattan distances from the original dataset could then be attributed to the similarities in hair protein expression between each mother and her children.
For the top 5% of proteins in children (n = 32), we averaged spectral counts for girls and boys separately and divided the girls’ average by the boys’ average. The resulting values were converted to log base 2. The same process was followed for spectral counts from mothers and children.
The log fold-change values of the top 5% of proteins were used as input for ingenuity pathway analysis (Qiagen: https://digitalinsights.qiagen.com/products/features/ (accessed on 24 June 2019)). We analyzed direct and indirect relationships between molecules on the basis of experimentally observed data, restricted to human databases in the Ingenuity Knowledge Base. We used random forest (RF) models for both the classification (boys vs. girls, mothers vs. children) and regression (age prediction) tasks, with protein concentrations as model features and individuals as samples [37]. For classification, the model output was the probability of an individual being female (sex classification) or being a mother (person classification). For regression (age prediction), the model output was the individual’s predicted age.
Results were based on a 10-fold cross-validation repeated 100 times. Members of the same family were included in the same set, i.e., either training or test sets, to avoid information leaks due to familial similarities. For age prediction, we evaluated results using the R2 coefficient of determination and the linear model p-value fitted on the predicted and observed data. For the classification tasks, we used the area under the ROC curve (AUC) and the Wilcoxon Mann–Whitney test to test the null hypothesis that one distribution is not stochastically greater than the other.

3. Results

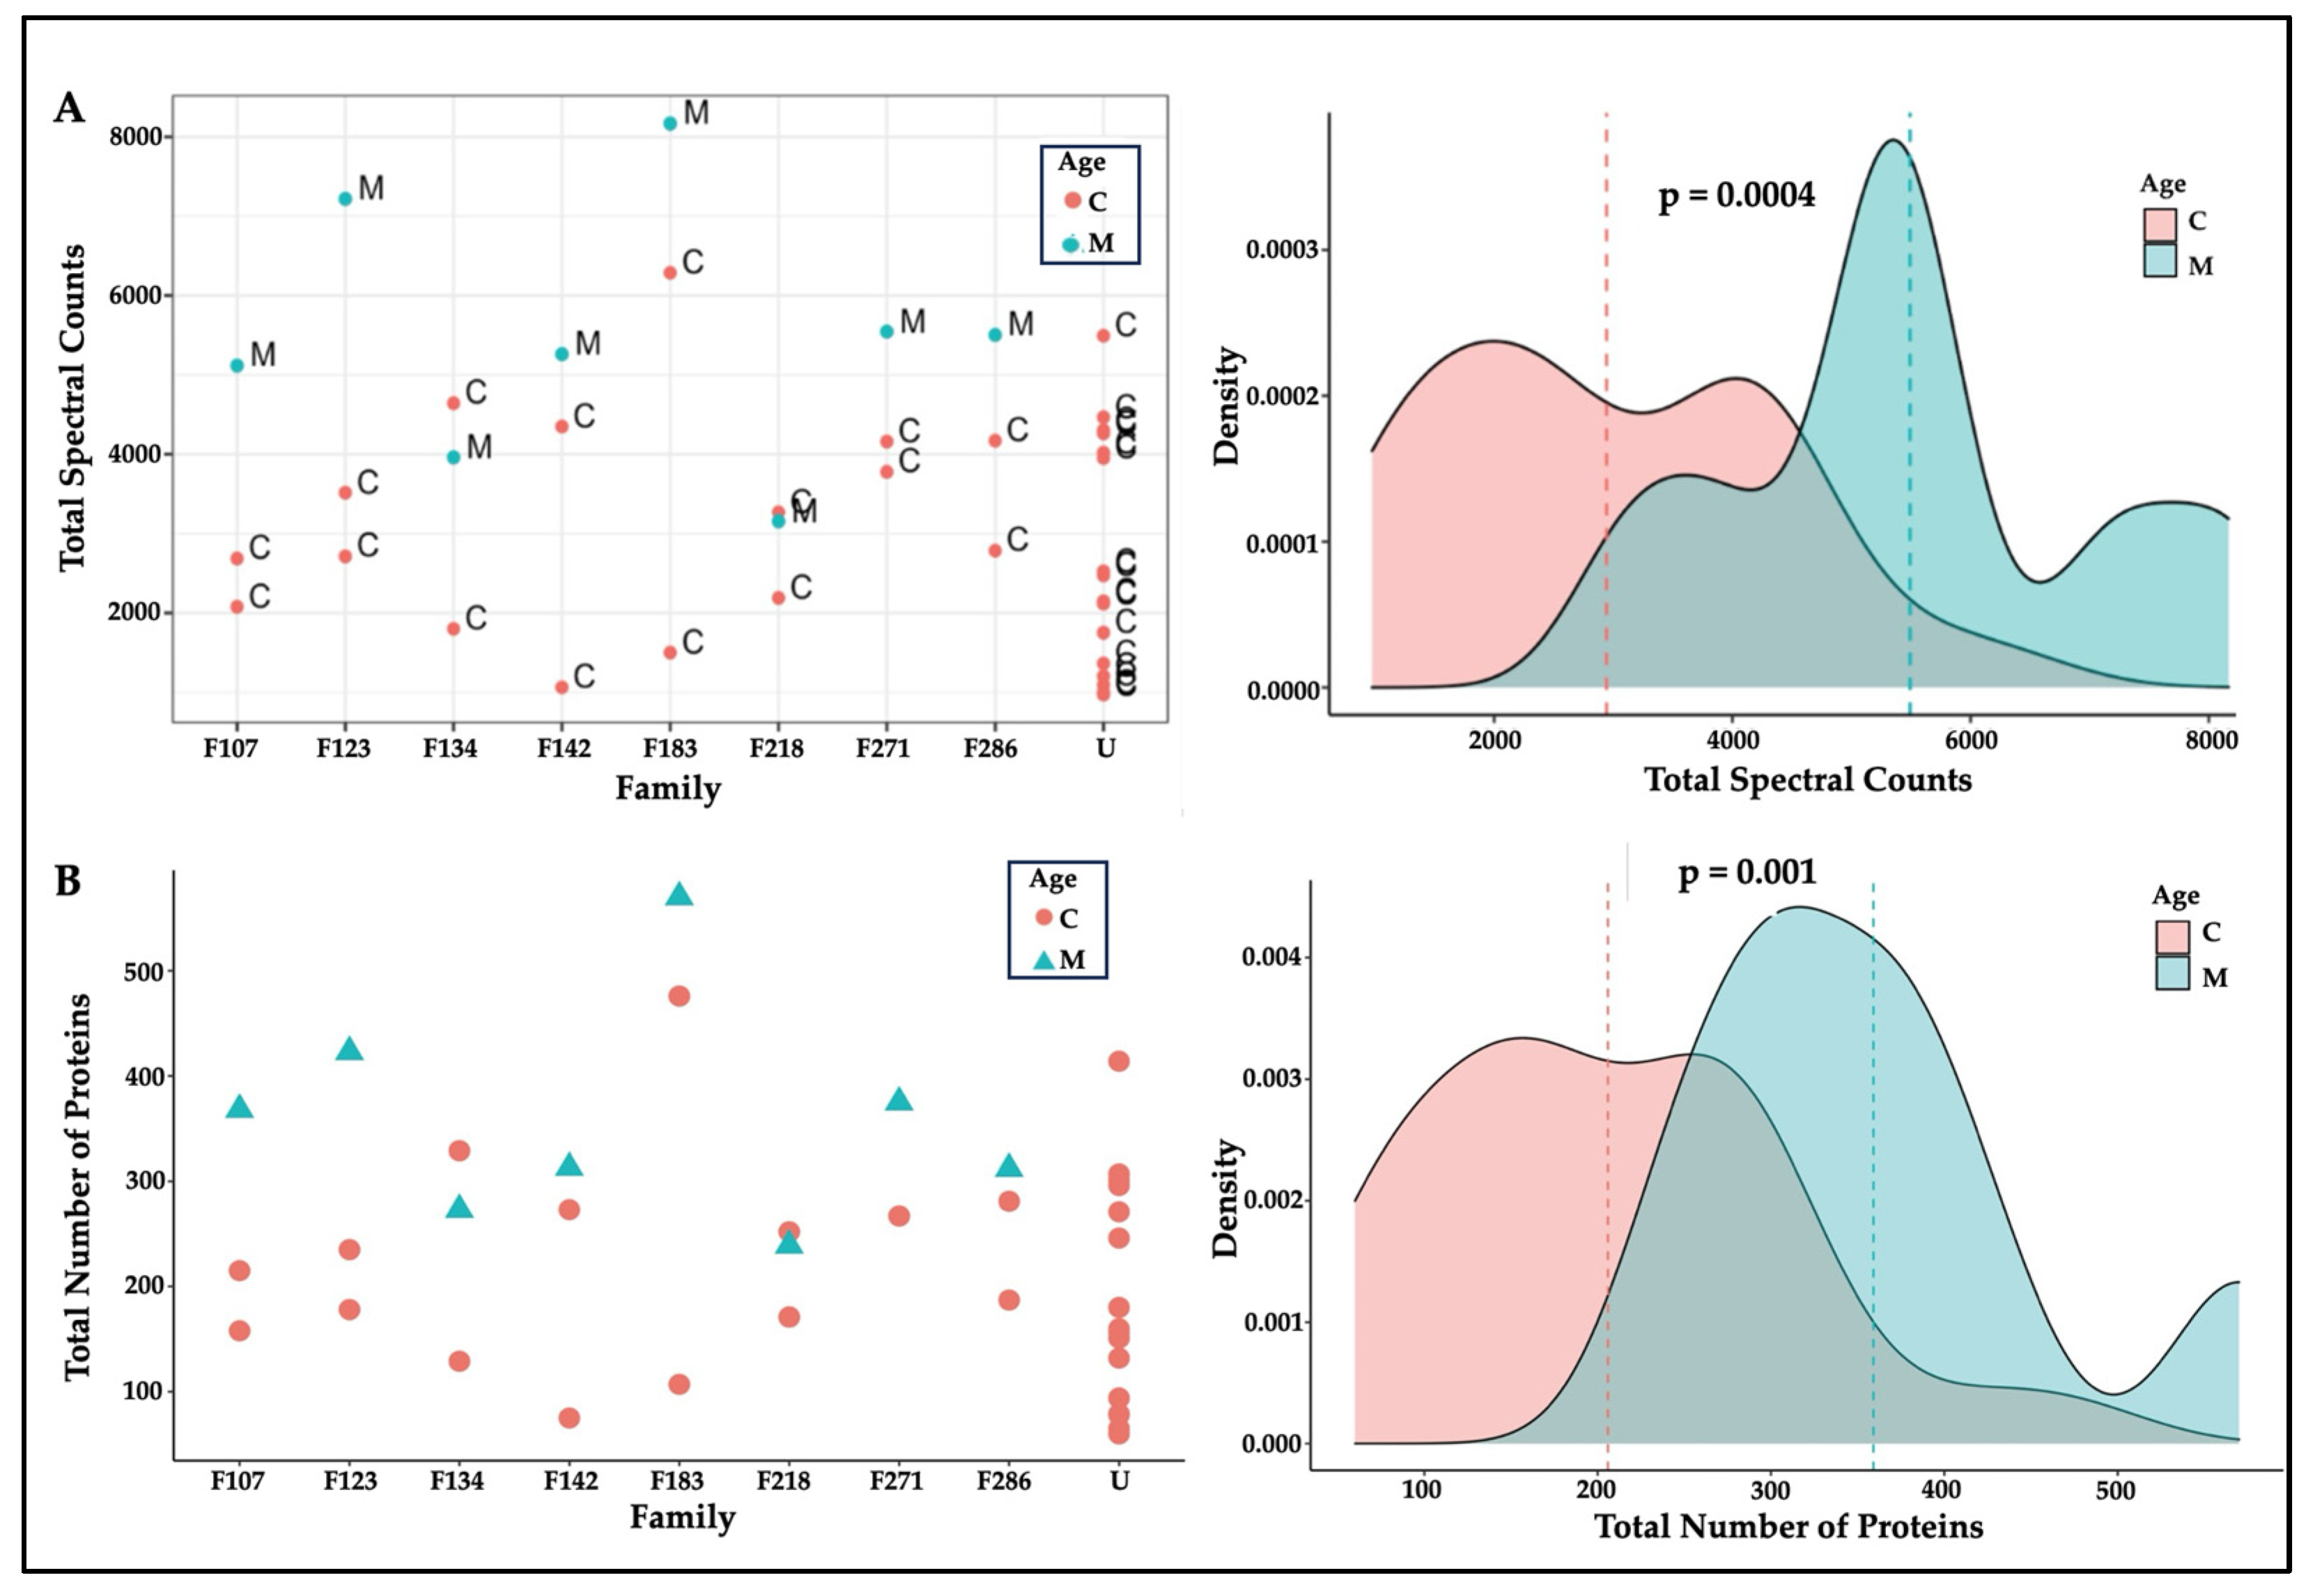
3.1. Features of Hair Proteins

There were 3124 proteoforms representing the gene products of 2278 genes. The expression of protein isoforms, alternative splicing of messenger RNA (mRNA), and post-translational modifications resulted in a higher number of hair proteins than their associated genes [21,38]. Hair proteins observed in individual mothers and children contained 2269 unique ‘proteoforms’ or protein isoforms; 1438 proteins were commonly observed in mothers and 1368 proteins were commonly observed in children, and 1288 hair proteins showed individual variability among mothers and children. Higher spectral counts (p = 0.0004) and higher numbers of proteins (p = 0.001) were observed in mothers than in children (Figure 1), perhaps reflecting a wider array of biological functions in adult females related to reproduction [39,40,41], aging [37,42], or disease states [43]. These age differences were explored further in subsequent analyses.

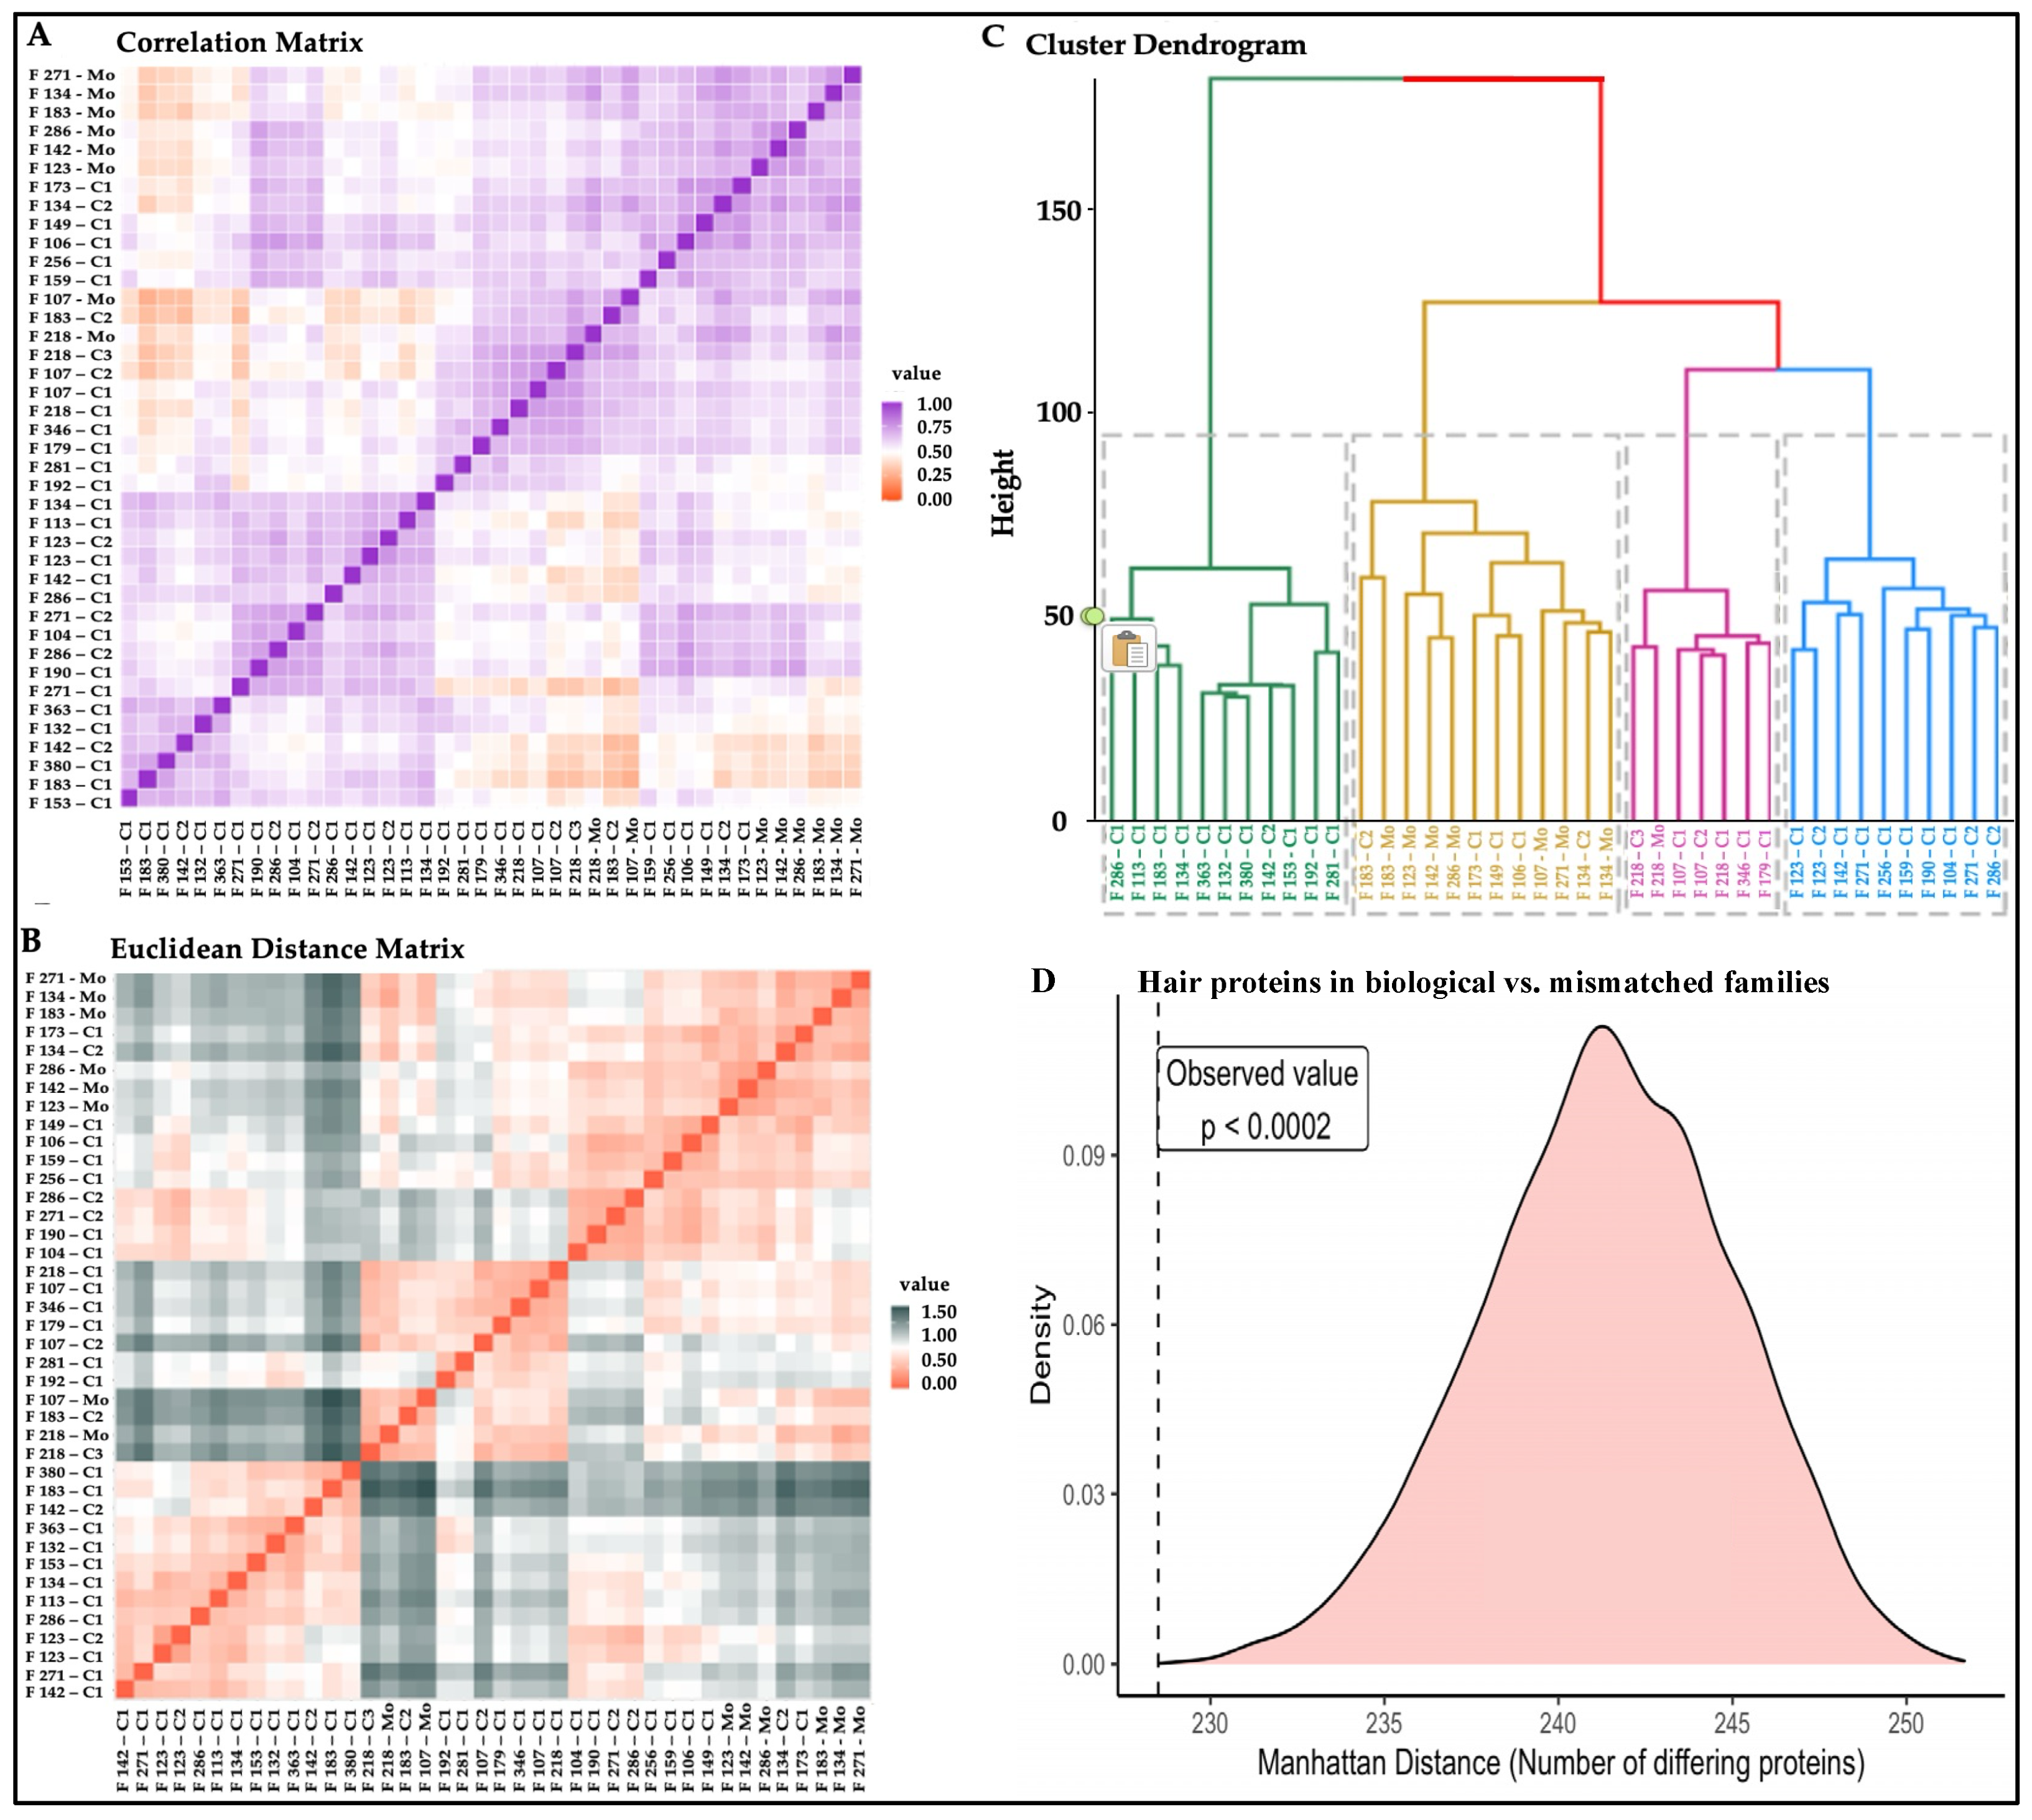
3.2. Hair Protein Profiles in Individuals and Families

Peptide spectral matches for each protein were combined to compare protein expression for all individuals and assess Spearman rank correlations. Hair proteins from the mothers were closely correlated to each other, whereas hair proteins in children showed correlations based on age and sex (Figure 2A). Euclidean distances were calculated for pairwise comparisons between individuals (Figure 2B) and used for hierarchical clustering to identify subjects with similarities in hair protein patterns (Figure 2C). Consistent with the correlation matrix, all mothers were clustered close together; younger children (0–2 years) were mostly located in one cluster, whereas older children were clustered with the mothers (Figure 2C). The Boolean profiles of the hair proteins for each mother and her two biological children showed significantly shorter intra-family Manhattan distances (p < 0.0002) than the 5000 ‘simulated’ families with mismatched mothers and children (Figure 2D), revealing hereditary vs. environmental conservation of hair protein profiles within each family.

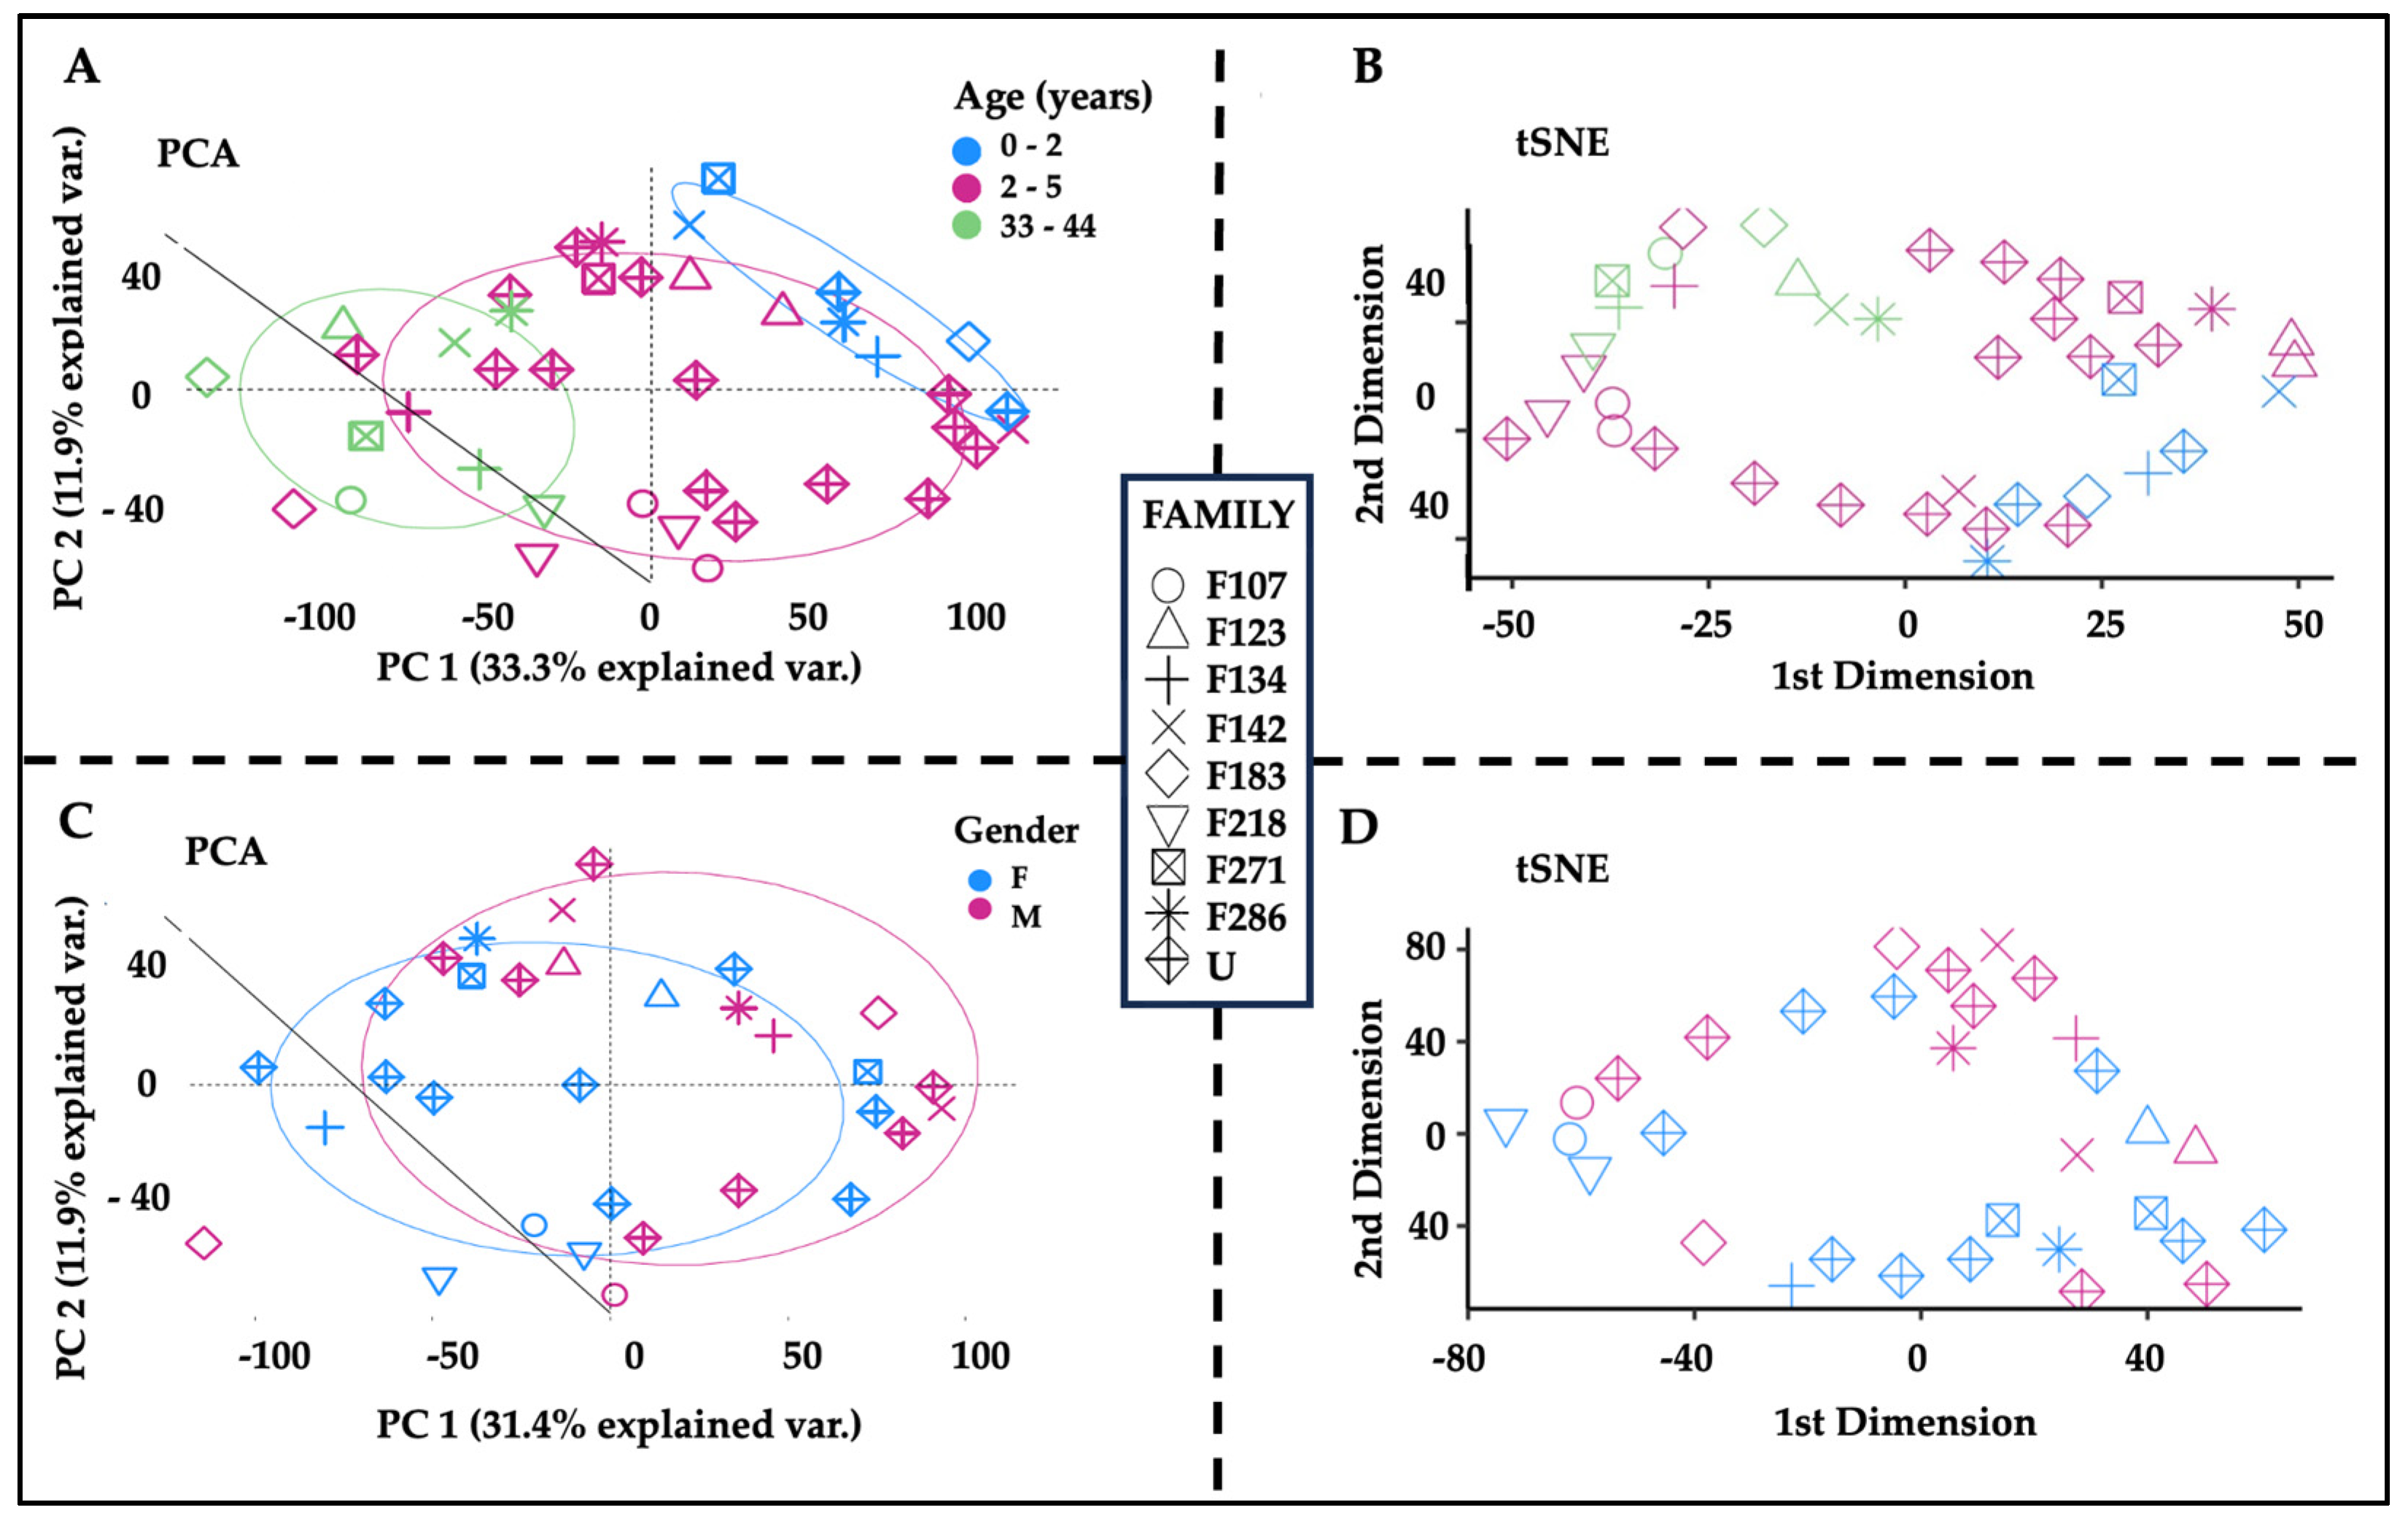
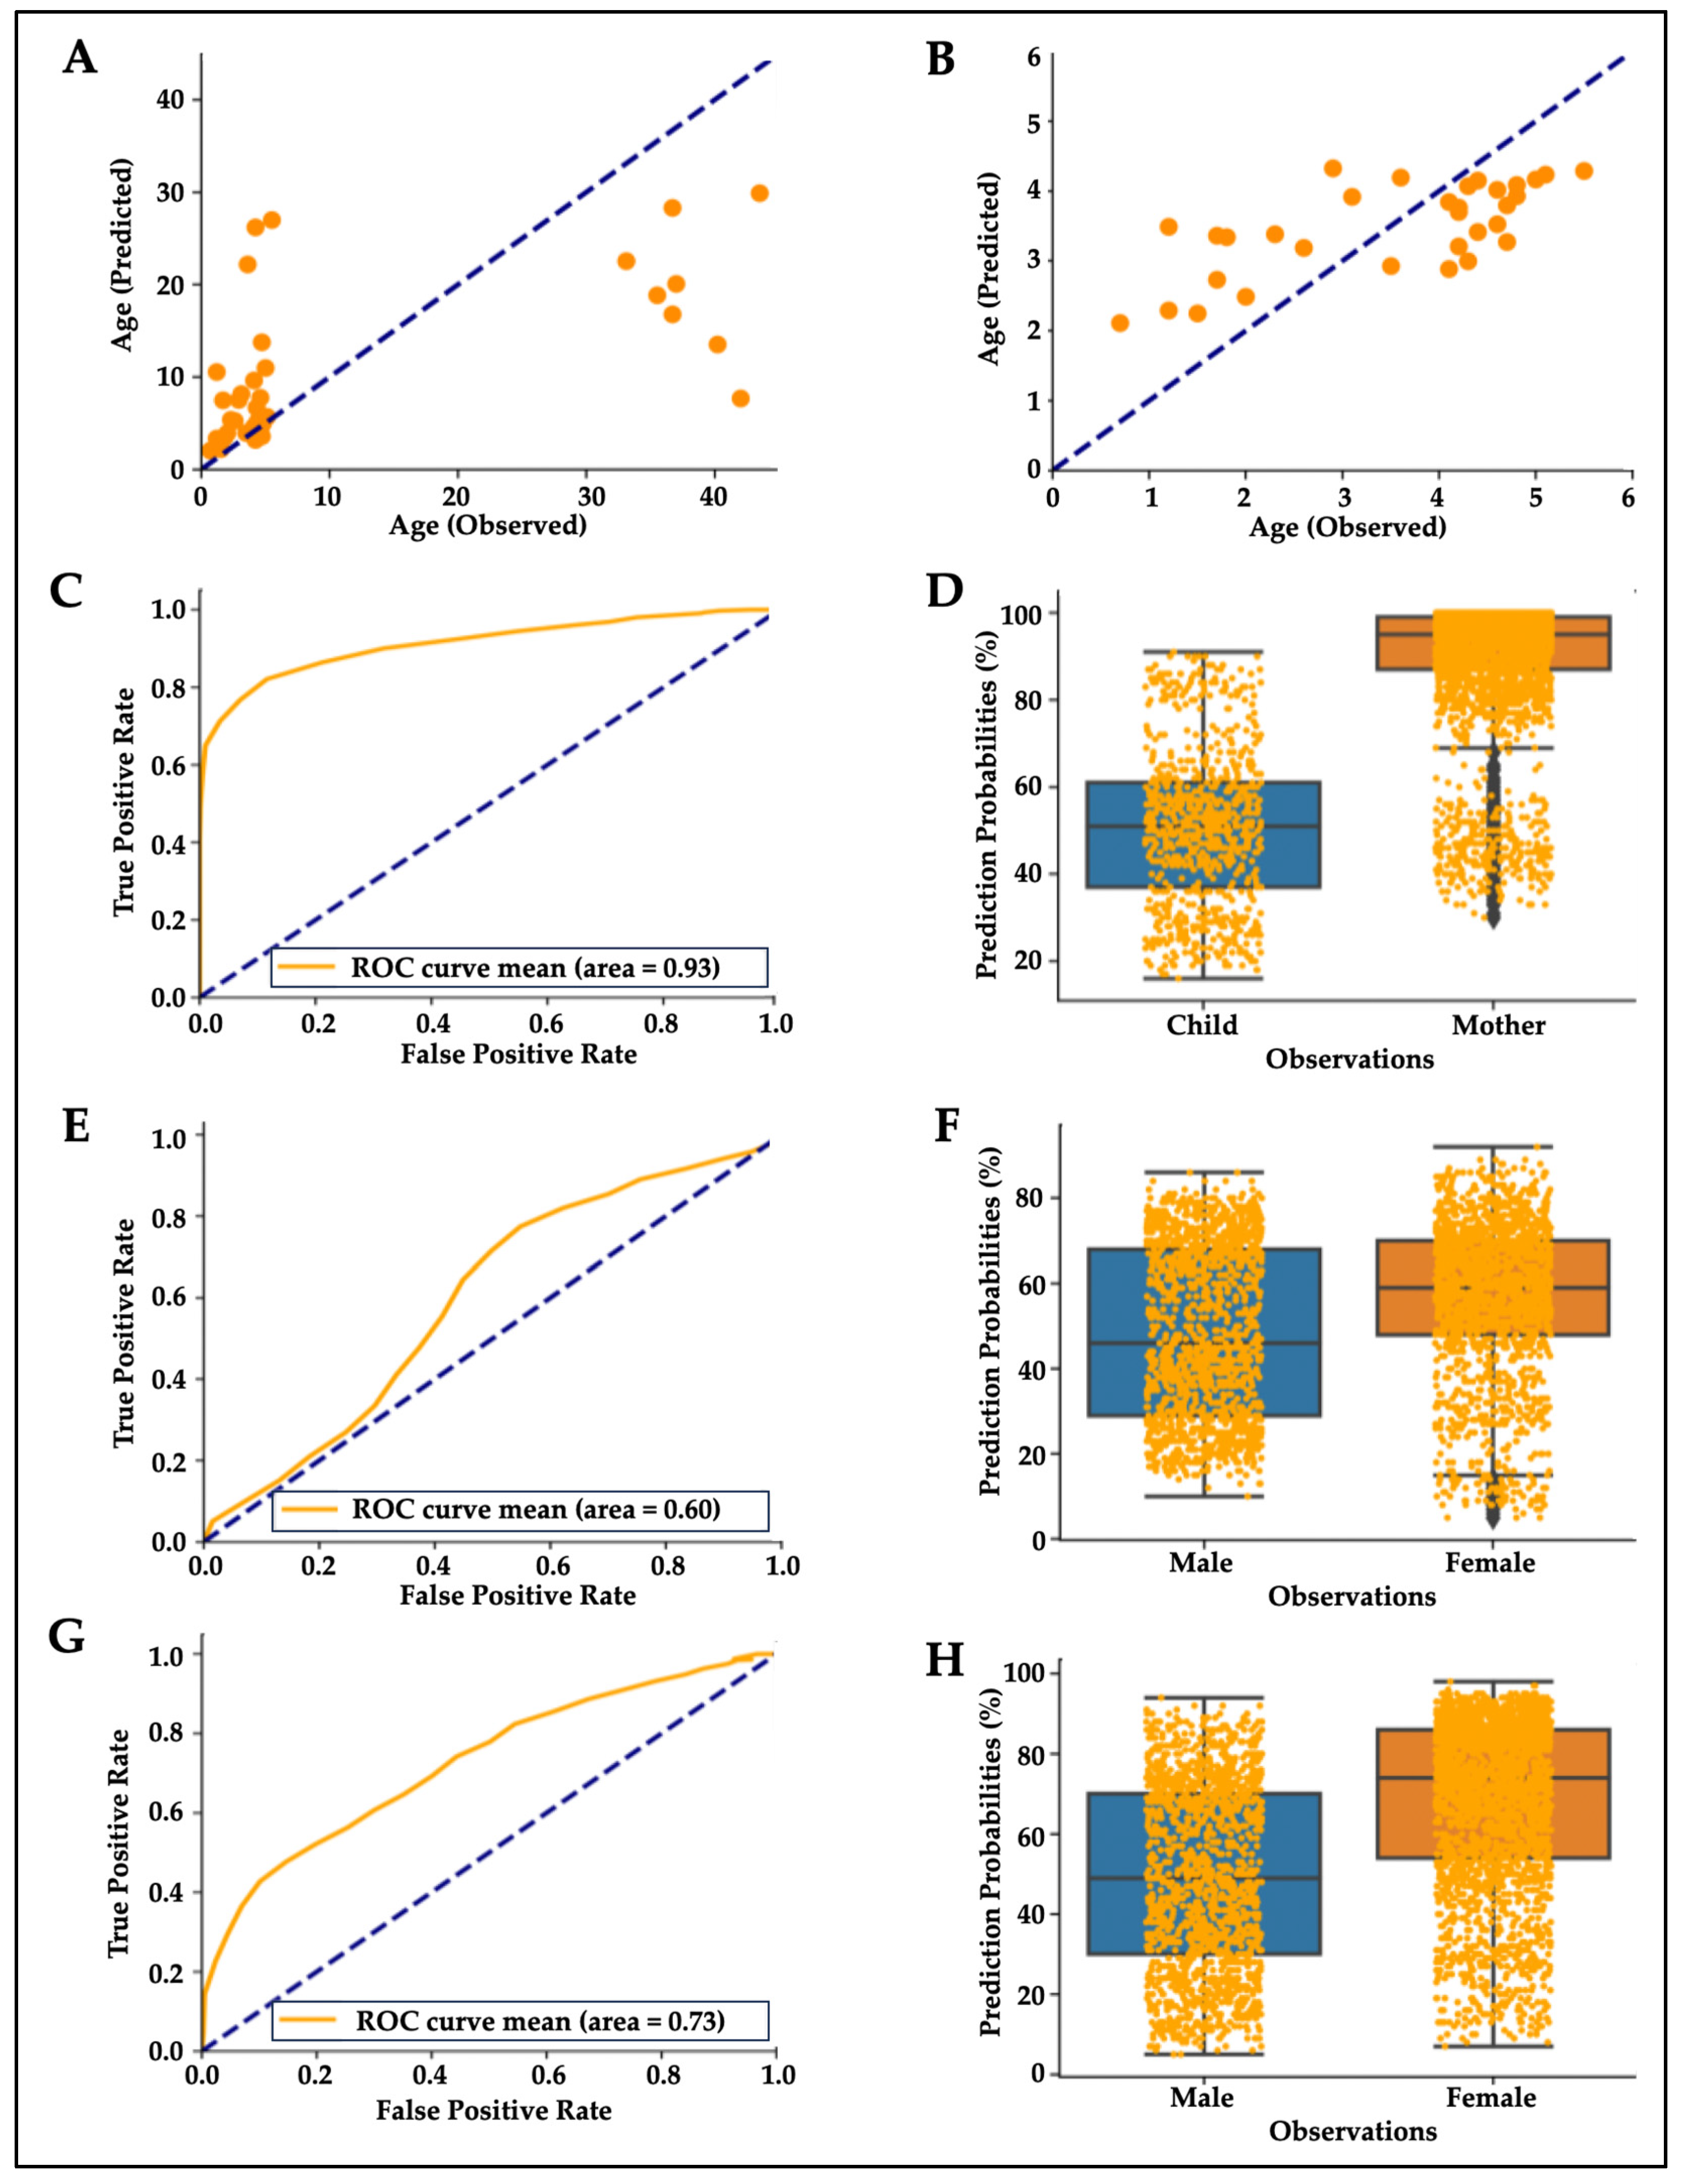
3.3. Age- and Sex-Related Differences in Hair Proteins

Both PCA [32,33,34] and tSNE [35,36] were used to reduce the data dimensionality and identify the major contributors of hair protein variability. Principal components 1–5 accounted for 61.6% of hair protein variability for all subjects, 57.5% for all children, 84.0% for all mothers, 60.8% for mothers and related children, and 62.3% for mothers and unrelated children.
Age differences were observed by plotting the first two principal components (PC1 and PC2) and tSNE dimensions (Figure 3). We observed two separate clusters for the younger children and the mothers, with the older children dispersed across these groups (Figure 3A). Similar clusters were observed from the remaining principal components. The tSNE projections also showed that mothers were located separately from the children (Figure 3B). The proteins driving these differences showed higher spectral counts in mothers vs. children for SERPINB4 (serine protease inhibitor), POF1B (actin filament binder), PLEC (cytoskeleton binding protein), A2ML1 (α2-macroglobulin-like proteinase inhibitor), HIST1H3A (histone), UQCRQ (electron transfer from ubiquinol to cytochrome C), and AHCY (adenosylhomocysteine hydrolase). By contrast, mammaglobin-B (SCGB2A1), a heterodimerization protein that binds androgen and other steroids, was observed only in children (Table 2). Older children had higher spectral counts for PLEC (plectin), EIF3A (eukaryotic translation initiation factor 3), AHCY (adenosylhomocysteinase), HAL (histidine ammonia-lyase), and TUBA1C (tubulin alpha 1c), whereas younger children had higher protein spectral counts for SCGB2A1 (secretoglobin 2A member 1) and CSN2 (casein beta) (Table 3).
Sex differences showed slightly higher spectral counts in girls vs. boys (p = 0.038) but no difference in the number of proteins (Table 1). PCA analyses and tSNE projections showed overlapping clusters of boys and girls (Figure 3C,D). When comparing individual proteins, higher spectral counts were observed for CSN2 (casein beta, p = 0.0184) in boys and ALMS1 (Alström syndrome protein 1, p = 0.0214) in girls (Table 3).
To further characterize the effects of early childhood and adulthood on hair proteins, random forest regressions [44] were used to predict the participants’ age from their hair protein profiles. This model predicted age differences in mothers and children (R2 = 0.37, Figure 4A), but the regression model improved (R2 = 0.45) when mothers were removed from this analysis and only children were included in this predictive model (Figure 4B). Random forest classifier algorithms showed acceptable mean accuracy for classifying mothers and children based on their predicted vs. observed age (mean area under the ROC curve = 0.93, Figure 4C; Wilcoxon test p = 0.00011, Figure 4).
A random forest classifier to predict sex from hair protein profiles in children could not reliably differentiate boys from girls (mean area under the ROC curve = 0.6, Figure 4E; Wilcoxon test p = 0.1703; Figure 4F), but predictions improved when classifying all participants including mothers and children (area under the ROC curve = 0.73, Figure 4G; Wilcoxon test p = 0.0083, Figure 4H). The latter result is likely due to the age-based distinction between mothers and children, although sample size-related effects cannot be ruled out (25 vs. 17 females).

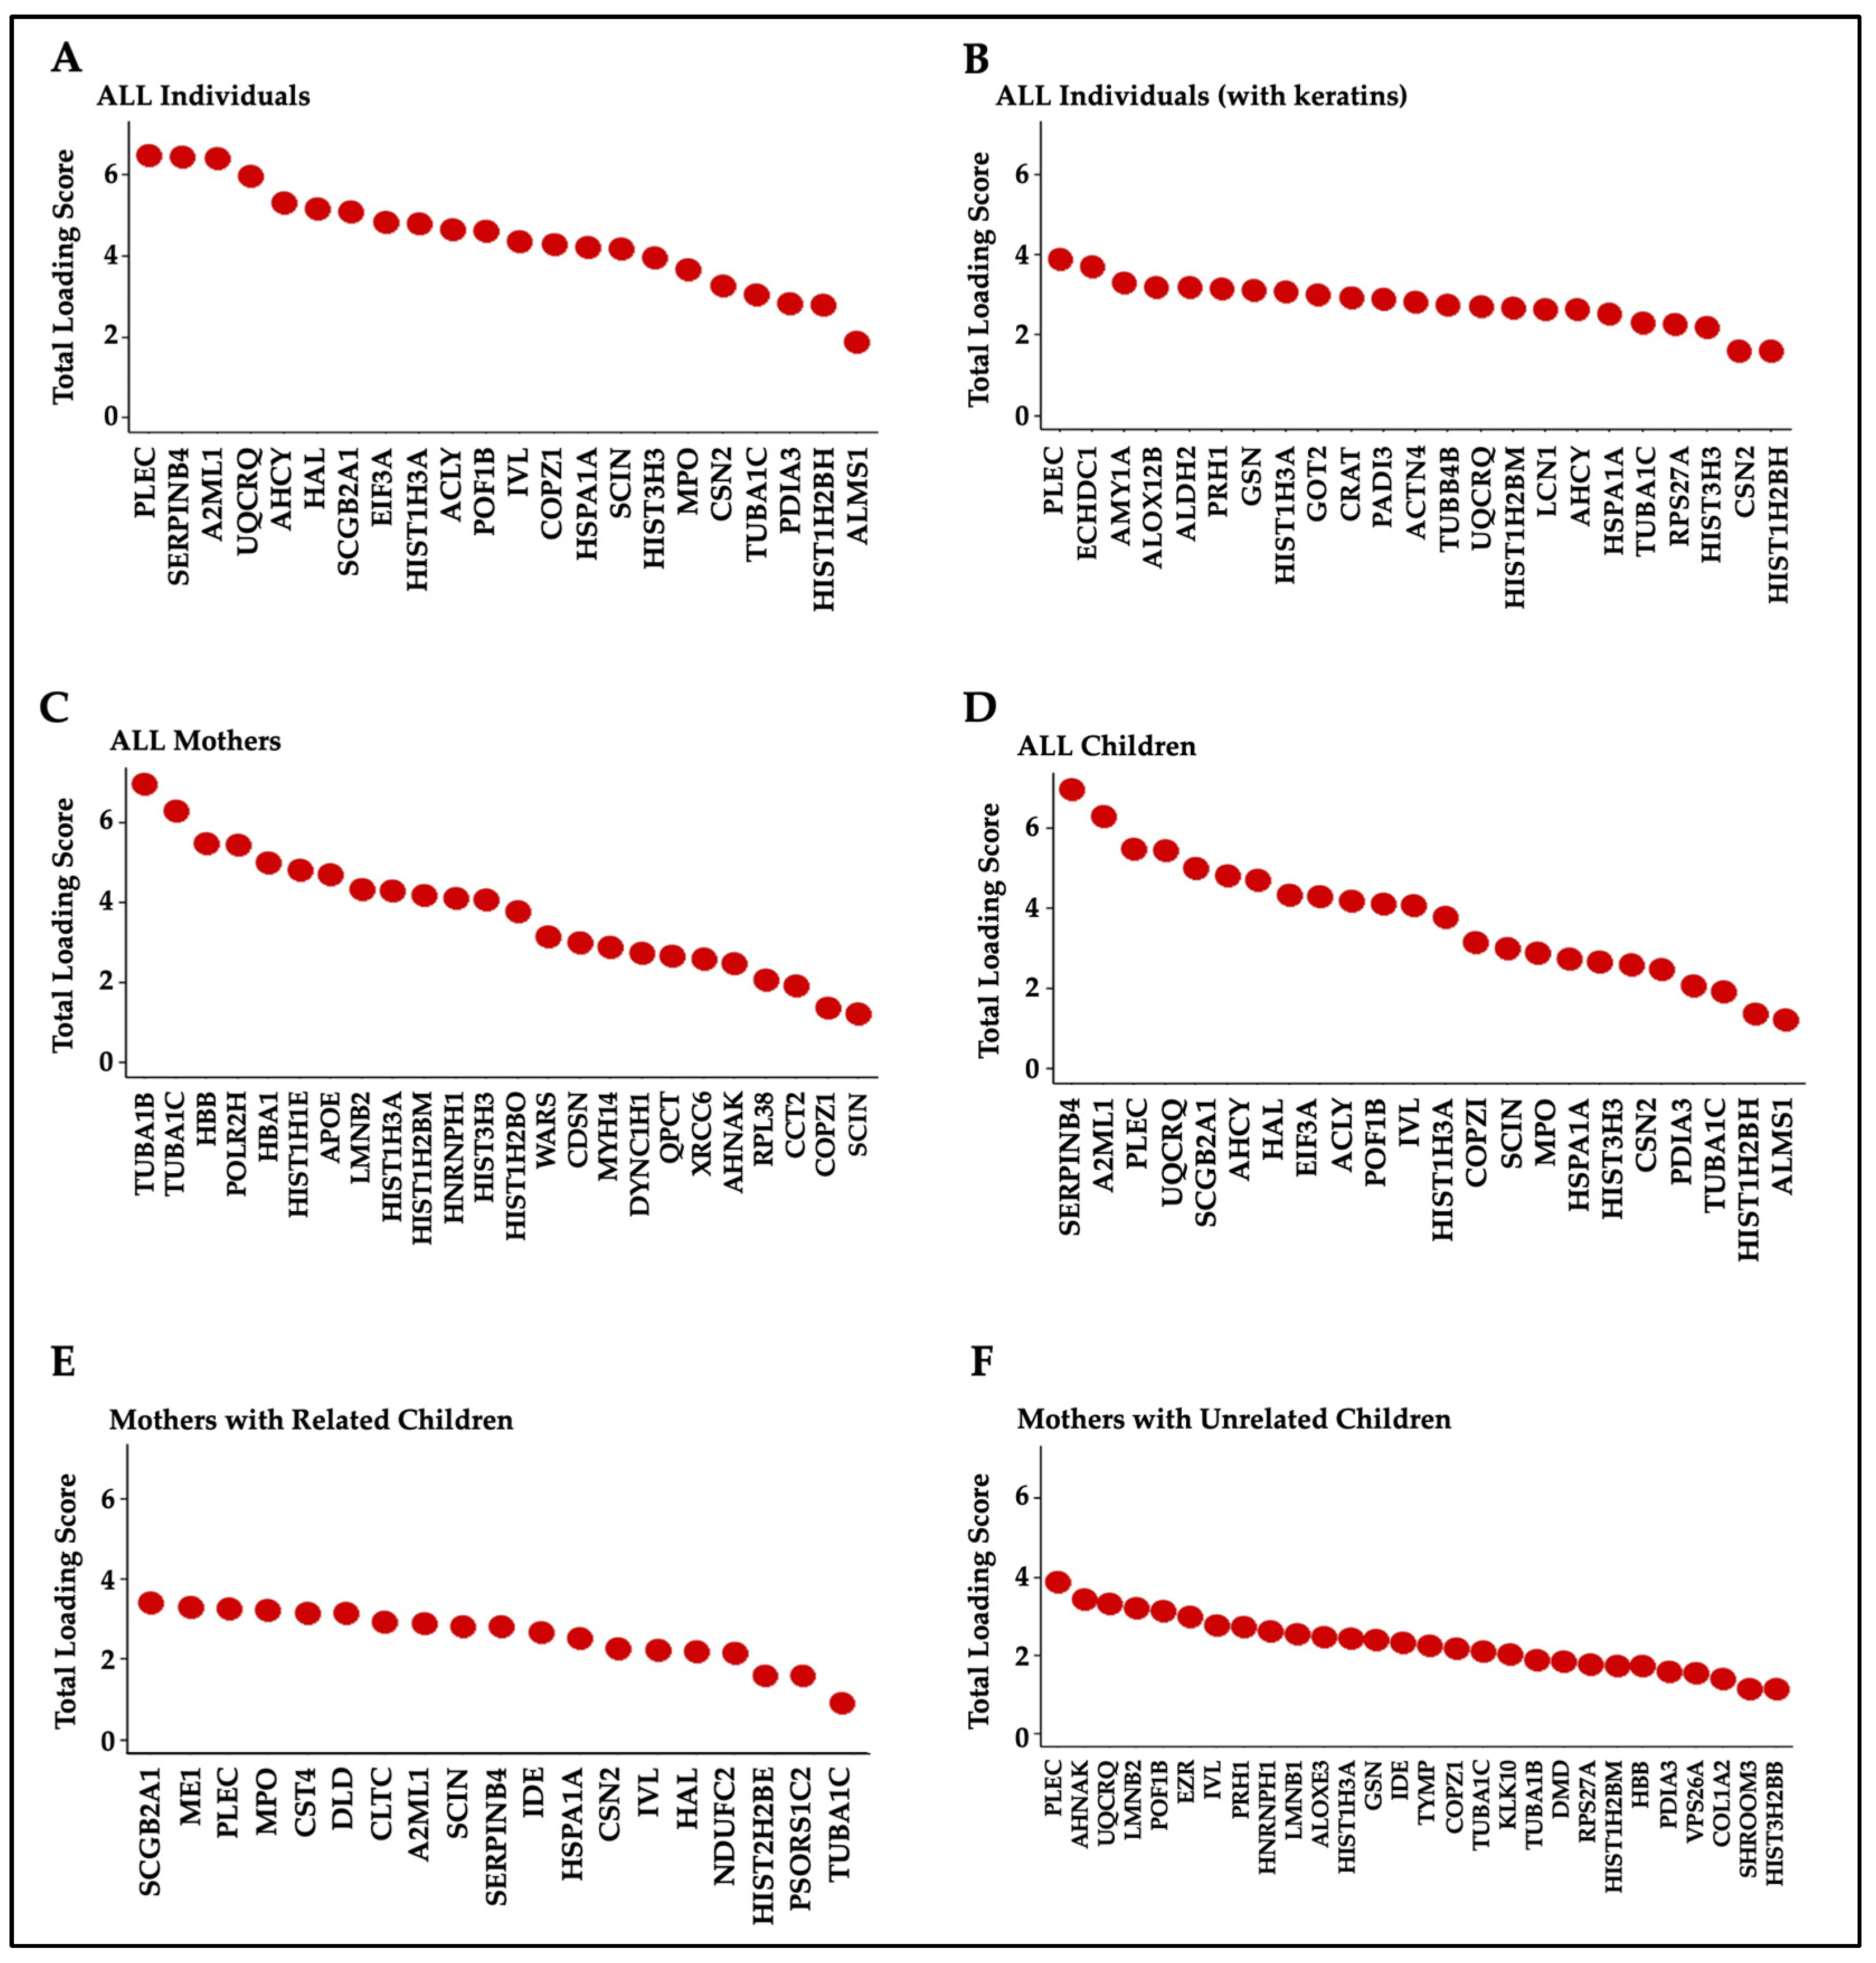
3.4. Top Contributors to Hair Protein Variability

The top 5% of proteins identified as the most prominent contributors, according to their total loading scores (TLS), explained 64.3% of hair protein variability in all individuals, 89.5% in all mothers, 57.5% in all children, 49.3% in mothers and related children, and 64.6% in mothers and unrelated children (Figure 5). A higher TLS indicates a higher influence of that protein on total variability. Keratins and KAPs are structural components but are usually considered contaminants in most proteomics experiments due to their high abundance in common lab analyses. We thus performed PCA analyses for all individuals with (Figure 5A) and without (Figure 5B) excluding the keratins and KAPs. Structural proteins contributed to hair protein variability, but they have limited biological significance. Separate PCA analyses performed to characterize the hair proteins observed in mothers (Figure 5C), children (Figure 5D), mothers and related children (Figure 5E), and mothers and unrelated children (Figure 5F) showed the same proteins as those ranked in all individuals and all children. Other than histones, no other proteins were common between mothers and children. TUBA1C, PLEC, SERPINB4, and UQCRQ were observed in multiple subgroups.

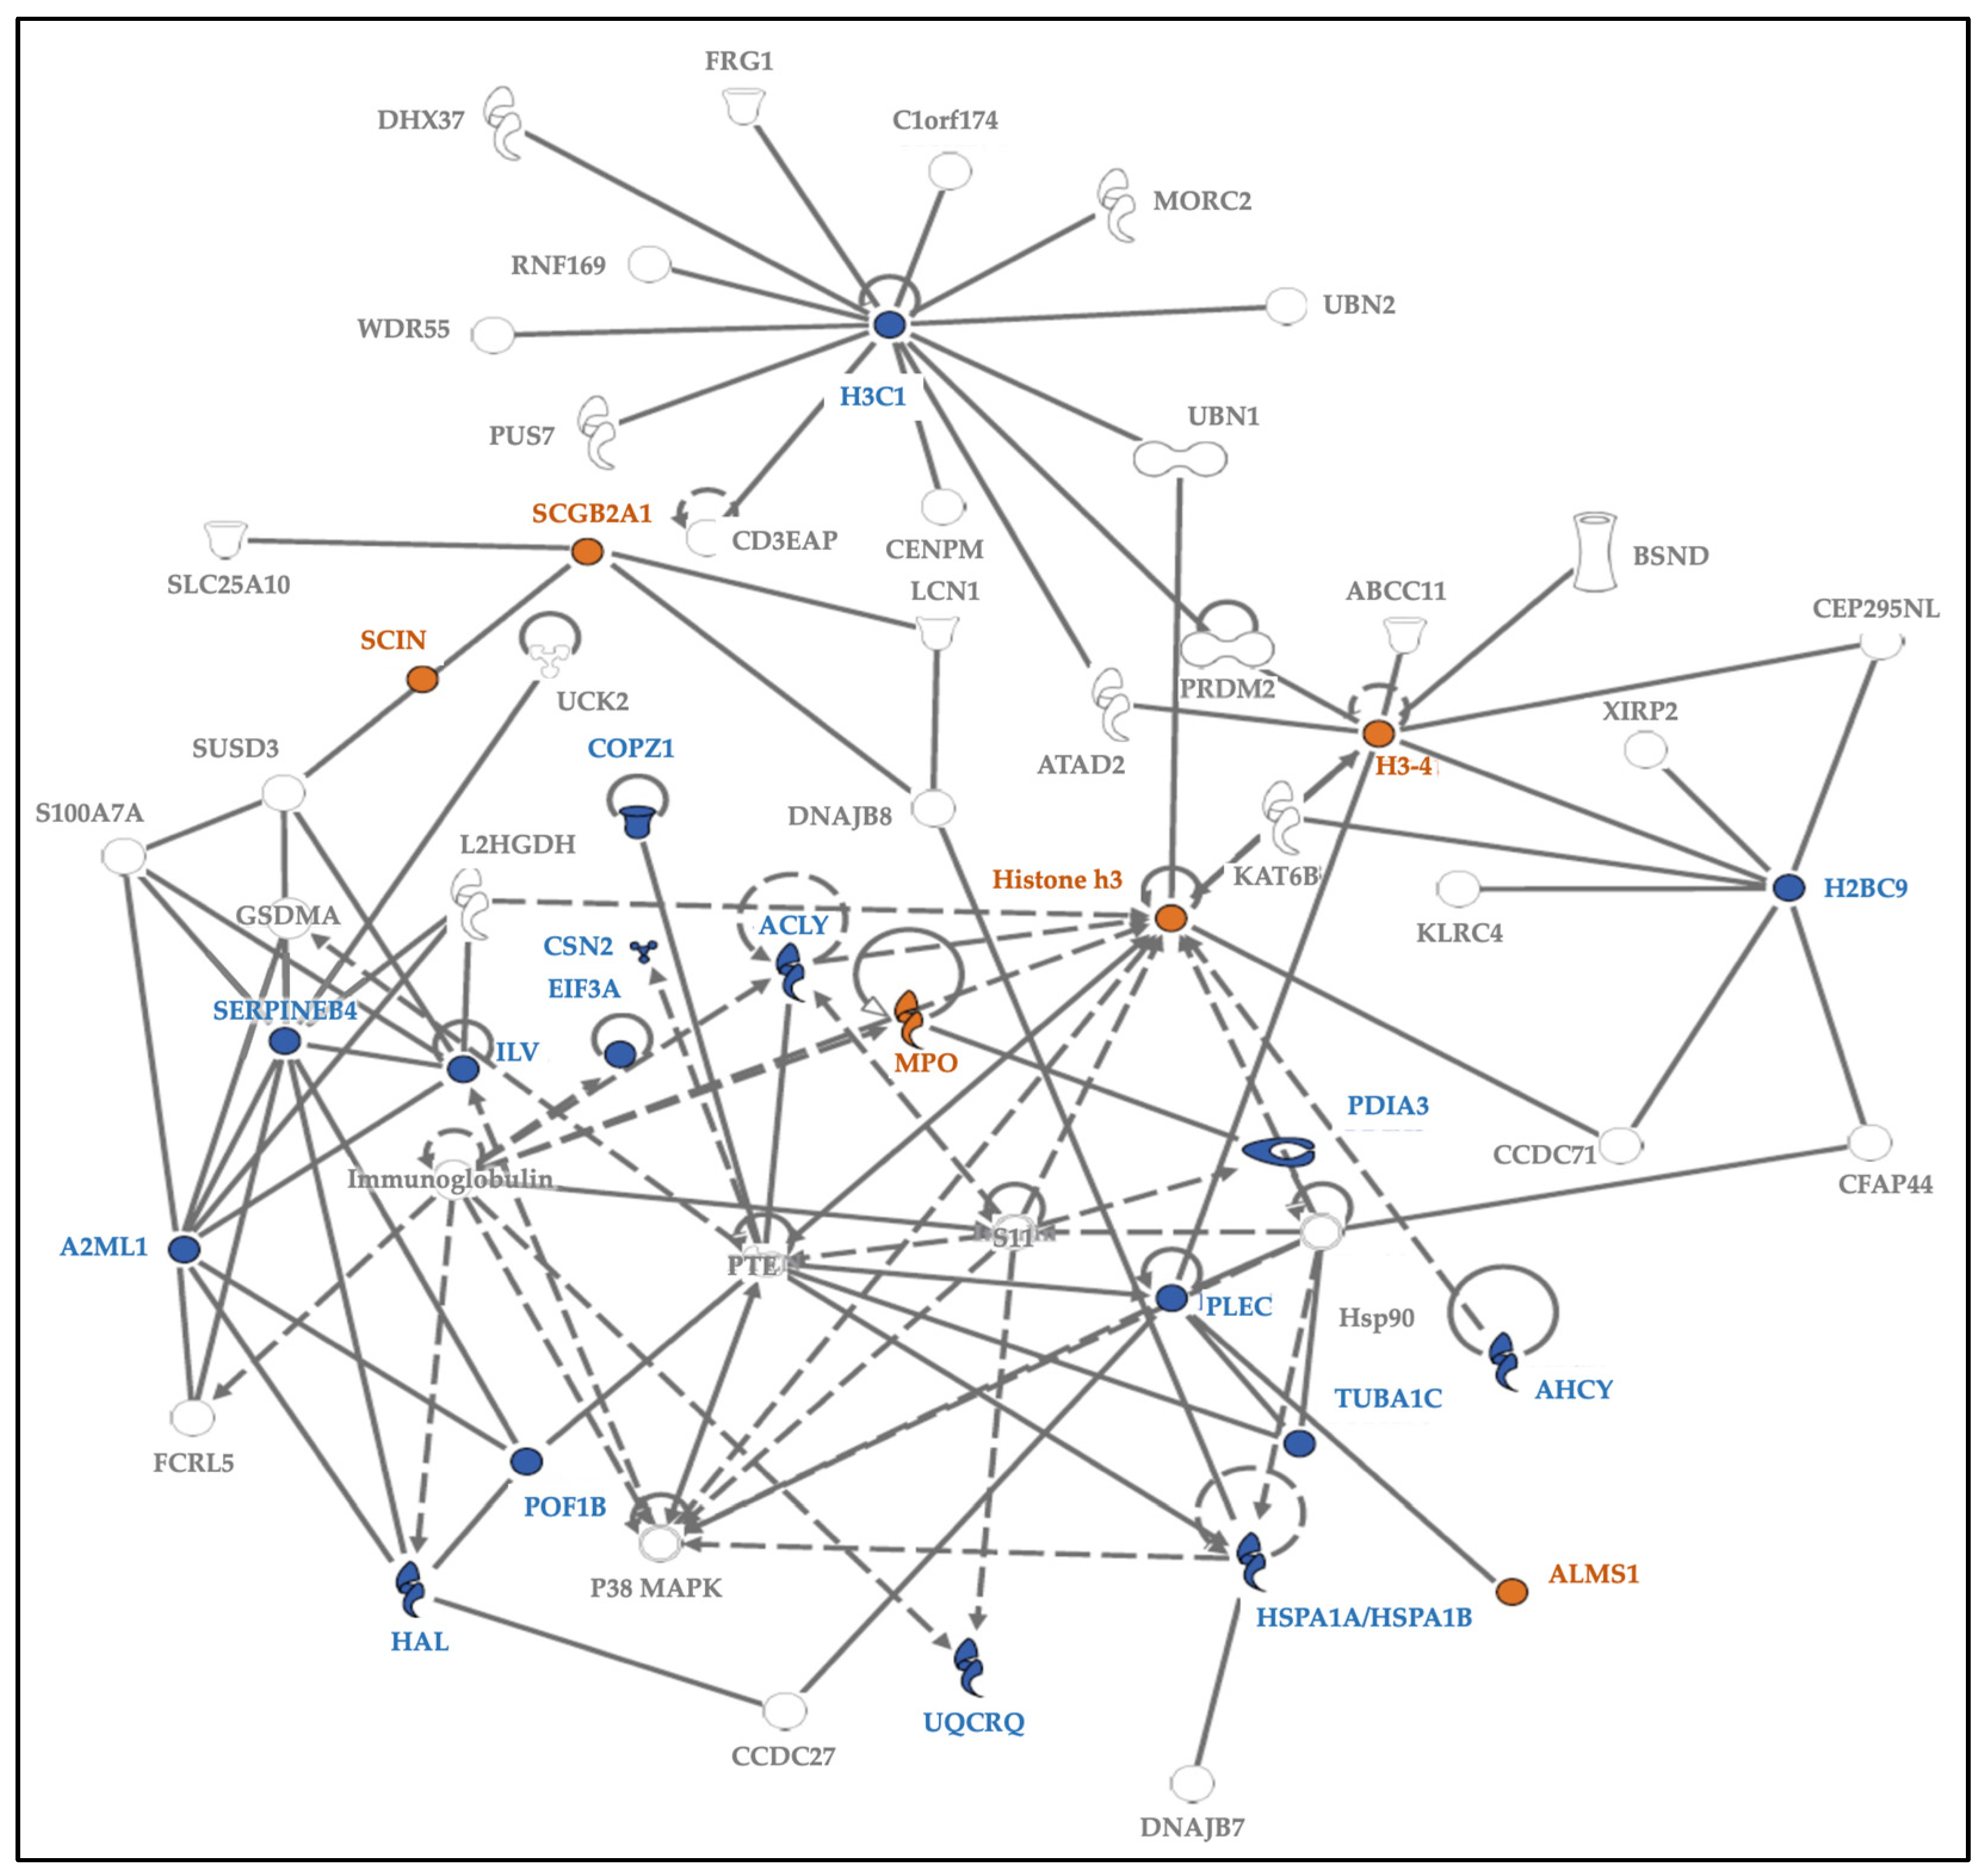
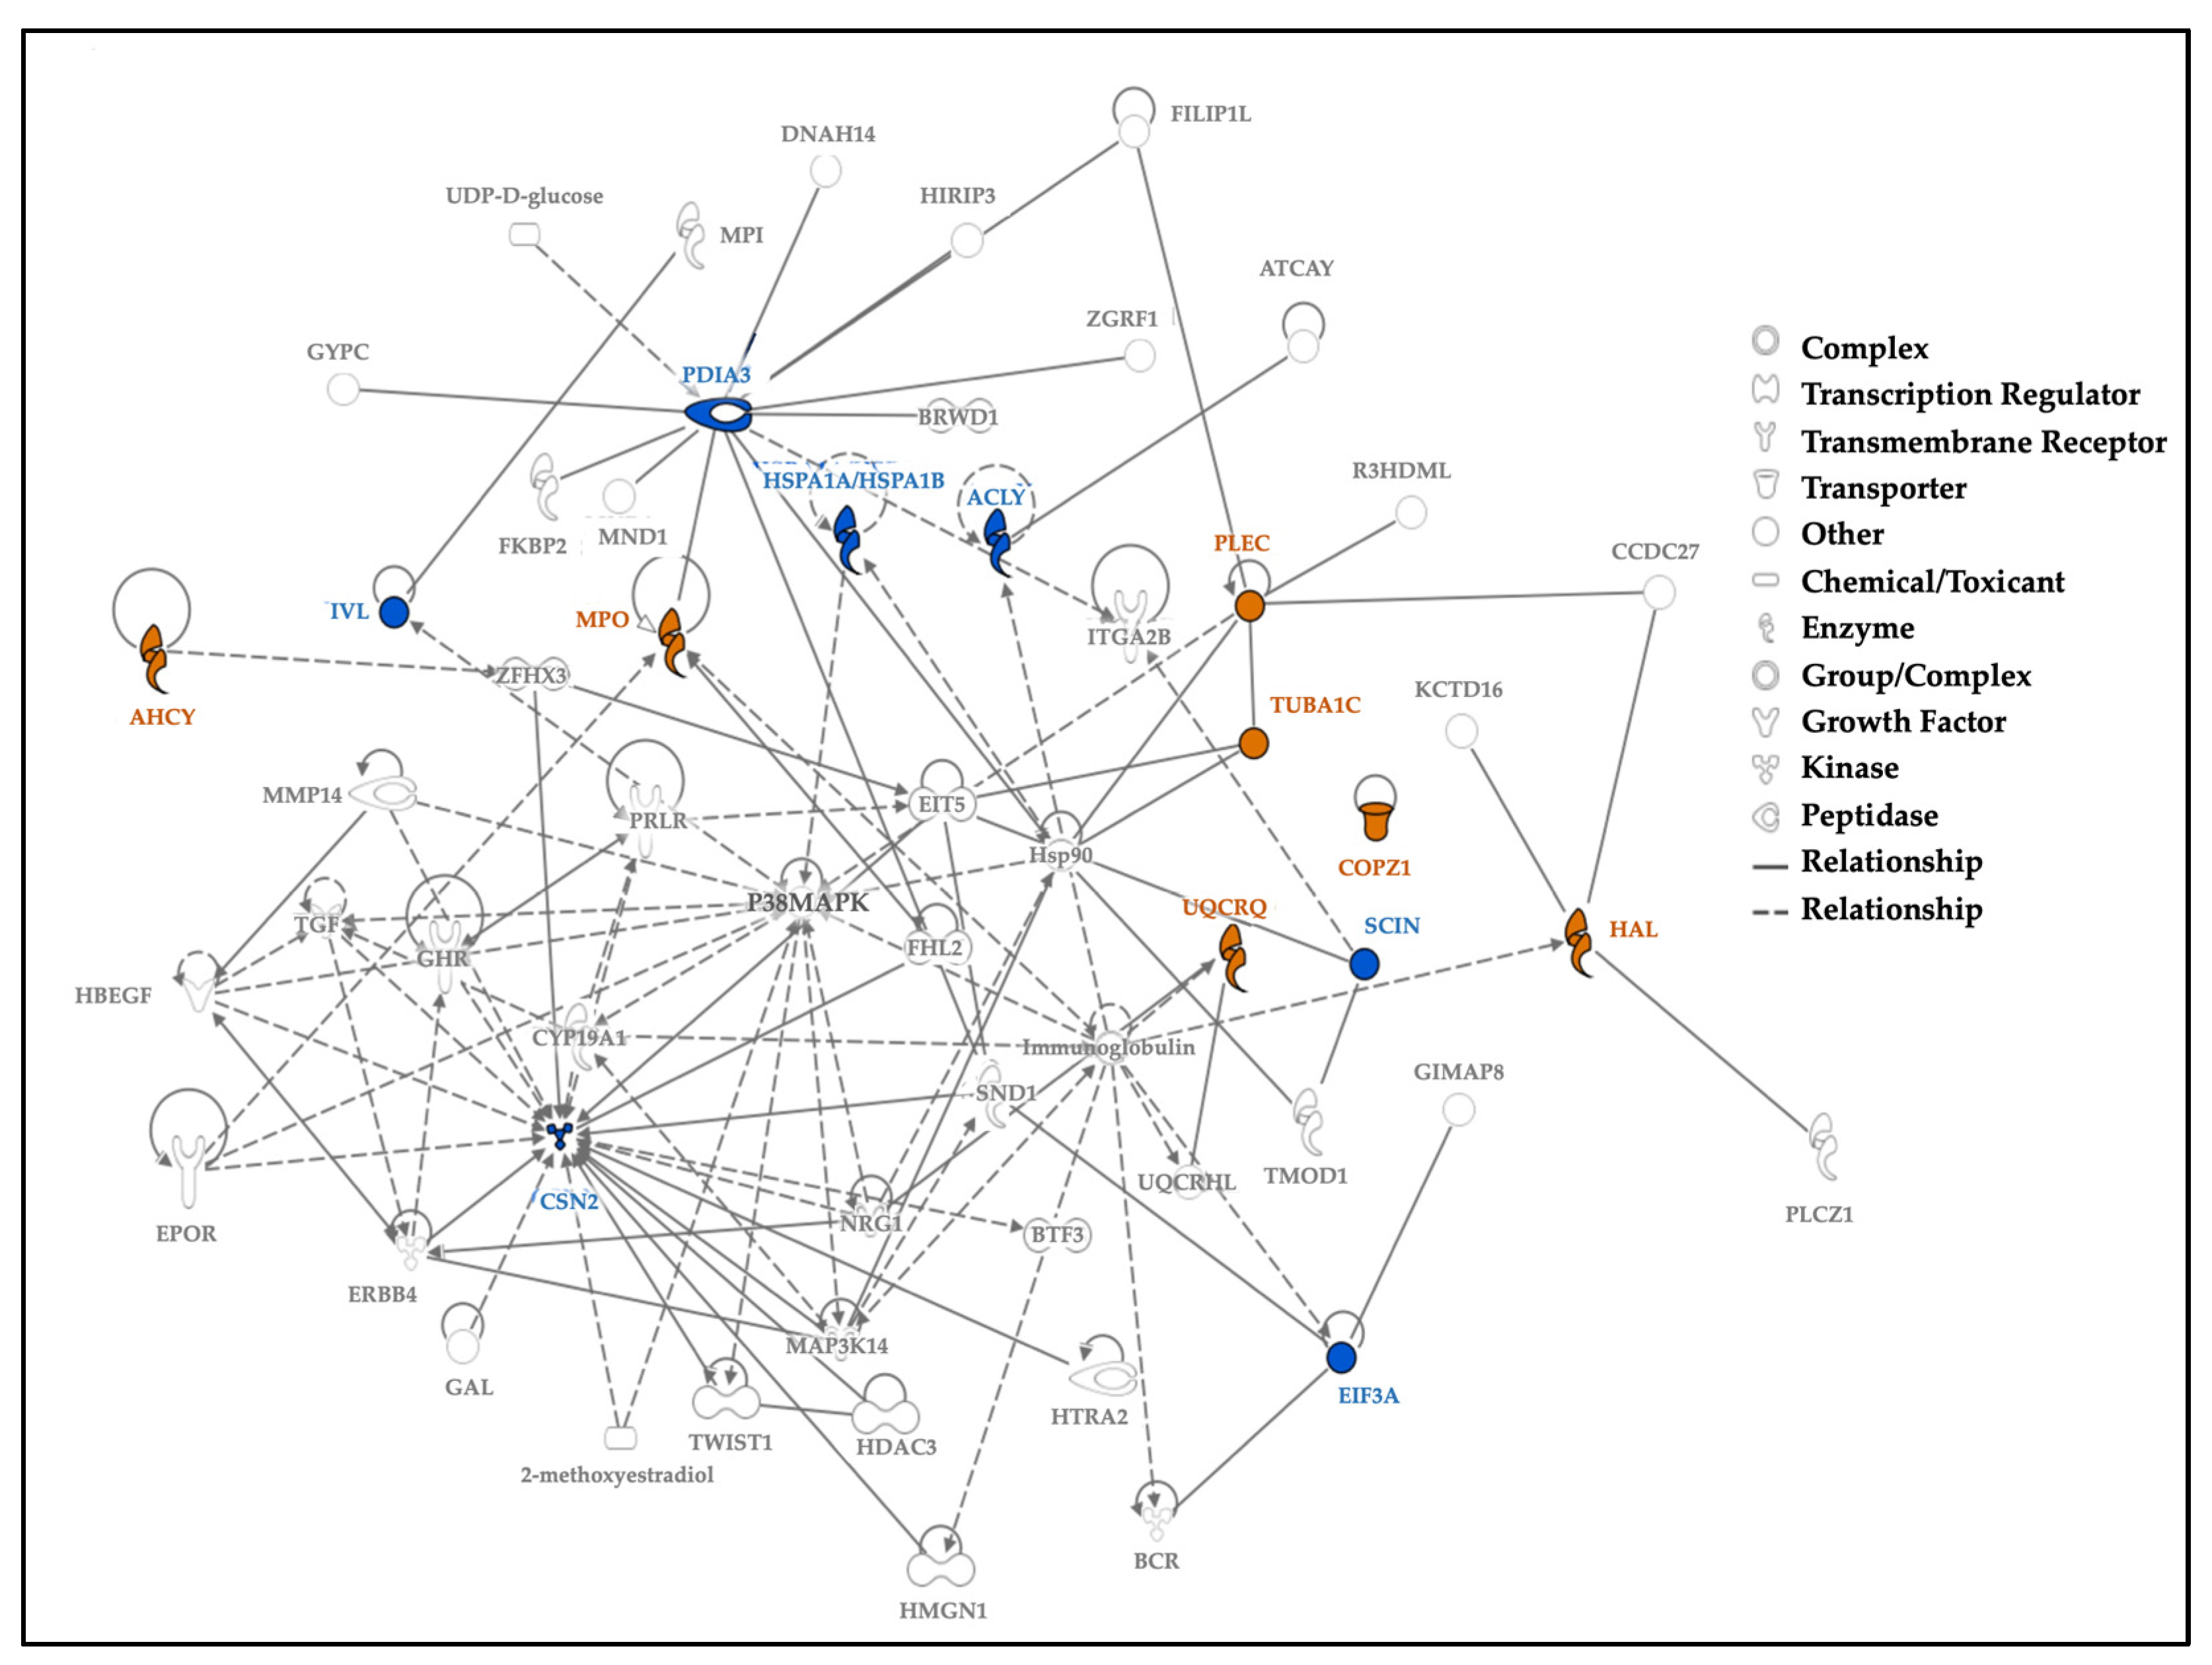
3.5. Biological Role(s) of the Strongest Contributors to Hair Protein Variability

Using experimentally observed human data in the Ingenuity Knowledge Base, the log fold change values of the top 5% of proteins from our dataset were used to analyze direct and indirect relationships between protein molecules. Protein networks for the top 5% of hair proteins contributing to age-related differences between mothers and children (Figure 6) and similar analyses for sex-related differences between girls and boys were examined (Figure 7). Using these molecular relationships as input for ingenuity pathway analysis, we identified protein classes involved in cellular metabolism, such as the protein ubiquitination pathway, the sirtuin signaling pathway, 14-3-3-mediated signaling, the Wnt-Ca++ pathway, histidine degradation, mitochondrial function, and oxidative phosphorylation (Figure 8). Other proteins were associated with immune responses (including phagosome maturation, IL-8 signaling, and the regulation of macrophages, fibroblasts, and endothelial cells) or were involved in the regulation of stress-related pathways, including corticotropin-releasing hormone signaling, glucocorticoid receptor signaling, and prolactin and aldosterone signaling. Finally, hair proteins associated with brain development, including axonal guidance and gap junction signaling, were also identified (Figure 8).

3.6. ELISA Validation of Other Non-Structural Hair Proteins

Select proteins of interest detected via standard UPLC–MS/MS methods were validated and quantified using commercially available ELISA kits. The first portion of the surplus volumes of individual protein extracts remaining after UPLC–MS/MS and HCC measures were pooled by low, intermediate, or high HCC values. Hair sample pools were used to quantify cortisol and arginine vasopressin (AVP), which potentiate the hypothalamic release of corticotropin-releasing hormone [45,46]; Cu/Zn superoxide dismutase (SOD1), an important cellular defense against reactive oxygen species [47,48]; HTrA serine peptidase 2 (HTRA2), a mitochondrial protease chaperone that regulates cellular proteostasis and cell-signaling events [49]; and glial fibrillary acid protein (GFAP), a protein responsible for the cytoskeletal structure of glial cells [50,51] (Table 4).

4. Discussion

The chemical composition of hair [17,52,53,54,55,56] and its structural proteins (keratins, KAPs) are well-studied [22,23,24,25], but minimal data exists on non-structural hair proteins. This study represents the first description of non-structural hair proteins in mothers and young children. We found 2269 non-structural hair proteins with important differences between mothers and children, age- and sex-related differences among preschool children, and conserved hair protein profiles within families. Hair proteins driving variability in different populations were found to play vital roles in functions other than those of trichocytes in the hair follicle, including cellular metabolic pathways, brain development, immune signaling, and stress regulation.
We observed age-related hair protein profiles in children and mothers, with distinct patterns emerging in multiple analyses. Differences between mothers and children were largely driven by increased maternal expression of SERPINB4, PLEC, and UQCRQ. SERPINB4 is a granzyme inhibitor linked to squamous cell carcinoma and chronic liver disease [57,58,59], Plectin mutations are linked to epidermolysis bullosa simplex and may be a susceptibility gene for testicular germ cell tumors [60,61,62], and UQCRQ is a nuclear protein in the mitochondrial respiratory chain complex III essential for brain development [63]. Mammaglobin-B (SCGB2A1), which is linked to familial febrile seizures in preschool children [64,65] and chemoresistant cancers in adults [66], was observed only in children’s hair.
We found minimal sex differences in early childhood, confirmed by random forest predictive models. Biological pathways of cellular metabolism and innate immunity appeared more prominent in girls, whereas brain development and stress regulation were more prominent in boys. Perhaps sex differences in hair proteins are accentuated following the onset of puberty [67]. Although hair protein profiles were conserved in mothers and their biological children, future studies in mother–child dyads and monozygotic vs. dizygotic twins will be required to explore the gene × environment interactions responsible for hair protein profiles [68].
From the ingenuity pathway analysis, we identified the hair proteins associated with axonal guidance [69] and gap junction signaling [70], both signifying important mechanisms in brain development. By cross-referencing the Uniprot database (https://www.uniprot.org/ (accessed on: 24 June 2019)) with the Allen Brain Atlas (https://human.brain-map.org/static/brainexplorer (accessed on: 26 June 2019)) and the Human Brain Protein Atlas (https://www.proteinatlas.org/search/brain_category (accessed on: 28 June 2019)), we identified 191 hair proteins that are regionally enriched in the brain. Further studies will examine whether hair proteomics can complement neuroimaging and neurophysiological studies of early brain development [12]. A study from Nepal reported specific plasma proteins associated with higher non-verbal intelligence and pro-inflammatory proteins associated with lower intelligence in children [71]. That study, however, used an FDR of 5%, whereas the FDR threshold for our analyses was set at 1% or lower. Future developmental studies with large sample sizes could correlate hair proteins with cognitive or behavioral outcomes, thus investigating their role in brain development [72]. Thus, unbiased or targeted protein profiles from serial hair samples (or sequential hair segments in the same hair sample) could be used as probes for child development [73,74] or life-course studies [43,75,76].
These findings must be interpreted in light of three limitations. First, our sample size of 32 children was insufficient to examine developmental differences at each age in the preschool period. We selected healthy children from homogenous socioeconomic environments; they did not experience any adverse conditions, and therefore, our data do not represent the full range of hair protein profiles present in the general population. Despite this, our sample size was larger than that of most other studies on hair proteomics in adults, and it is the first to include mothers and children. Our study design also allowed us to investigate differences in hair protein profiles between related and unrelated individuals, as well as differences between adults and children.
Second, our proteomics platform relied on peptide spectral matches, which presented only semi-quantitative data on the abundance of hair proteins in individuals. Since this is the first study investigating non-structural proteins from hair in humans, we chose a ‘shot-gun’ proteomics approach rather than targeted and more quantitative approaches. We did, however, orthogonally confirm the presence of specific hair proteins using well-validated ELISA assays. Having established the first hair protein libraries in mothers and children, future studies can be designed for the quantitation of specific protein targets or protein groups. Lastly, we did not correlate hair proteins with children’s developmental milestones or their cognitive and behavioral data. We feel that the sample size limitations at each age would preclude any generalizable conclusions from such analyses.
Despite these limitations, our initial findings reveal the potential importance of non-structural hair proteins as biomarkers for brain development or other cellular regulatory pathways, providing a rich source of chronologically ordered information for life-course studies and early childhood development.

5. Conclusions

This research shows that exposures to family adversity, chronic stress, parenting and caregiving practices, and early attachment can be monitored by serial hair sampling to determine children’s health status, brain development, and physical and mental health. We found that hair protein profiles are related to age, sex, and family relationships. The top 5% contributors to variability in hair protein patterns were associated with the regulation of (a) immune pathways (for phagosome maturation, IL-8 signaling, PKR interferon induction, regulation of fibroblasts, macrophages, and endothelial cells); (b) stress signaling pathways (for corticotropin-releasing hormone, glucocorticoid receptors, prolactin, and aldosterone); (c) brain development (axonal guidance and gap junction signaling); and (d) cellular metabolic pathways (for oxidative phosphorylation, mitochondrial dysfunction, histidine degradation, and caveolar-mediated endocytosis as well as the heat shock protein, 14-3-3 protein, sirtuin, and Wnt/Ca++ signaling pathways). When amalgamated with well-established methods for tracking changes in hair hormones, this approach may provide mechanistic explanations for the developmental sequences leading to HPA axis (dys)regulation in early life. The assessment of parent–child synchrony, children’s circadian rhythms, and positive and negative attachments need not depend on subjective questionnaires, invasive blood sampling, or neuroimaging. We propose that non-invasive hair sampling and tandem mass spectrometry methods can be used to compare non-structural hair protein profiles in healthy, normal children against hair protein profiles in subpopulations of children with confirmed exposures to toxic stress and/or adverse living conditions. Future studies will be designed to quantify and characterize panels of related hair proteins to probe changes in the immune system, stress regulation, brain development, and cellular metabolism to monitor environmental influences on the health status and development of children.

6. Patents

Pursuant to the Patent Cooperation Treaty, an international patent was filed on November 10, 2022, identifiable in the United States Patent and Trademark Office by Application No. US2022/079619.

Author Contributions

K.J.S.A. designed the study, obtained grant funding, and supervised all aspects of the research; C.R.R. processed hair samples and performed the protein extractions, data analyses, and ELISA assays; K.S., R.D.L. and A.S.C. performed the proteomics experiments; K.S., R.D.L., C.R.R. and K.J.S.A. wrote initial drafts and edited the manuscript; K.S., R.D.L., C.R.R., D.D., M.X. and N.A. performed statistical analyses and created the figures. All authors have read and agreed to the published version of the manuscript.

Funding

The Maternal and Child Health Research Institute (MCHRI) at Stanford, the Eunice Kennedy Shriver National Institute for Child Health and Human Development (R01 HD099296), the National Cancer Institute (P30 CA124435) for the Stanford Cancer Institute Proteomics/Mass Spectrometry Shared Resource, and the National Institute of General Medical Sciences (R35 GM138353) supported this research. The study sponsors had no role in the design or conduct of the study; the collection, management, analysis, or interpretation of the data; or the preparation, review, and approval of or the decision to publish this manuscript.

Institutional Review Board Statement

The study was conducted in accordance with the Declaration of Helsinki and approved by the Institutional Review Board of Stanford University (eProtocol #41369; approved 16 June 2017).

Informed Consent Statement

Written informed consent was obtained from all subjects enrolled in the study.

Data Availability Statement

Minimal datasets related to results presented in this manuscript are available upon request from the corresponding author. These data are not publicly available due to privacy, proprietary, and ethical considerations.

Acknowledgments

The authors sincerely acknowledge the leadership of Santa Clara County Office of Education; the children, parents, and staff at Bing Nursery School, Stanford Arboretum Children’s Center, the Children’s Center of the Stanford Community, Stanford Madera Grove Children’s Center, McKinley, Rouleau, and Wool Creek Head Start Centers for their partnership. We also thank David K. Stevenson, Gary Shaw, and Timothy Cornell for their valuable suggestions on previous versions of this manuscript; Sahil Tembulkar, Monica Ruiz, and Jitka Hiscox for their help with collecting and processing hair samples, Tanida Plamintr for the administrative assistance, Grant Padia and Jeanine Tsang for grants management.

Conflicts of Interest

The authors declare no conflicts of interest. The authors received no honoraria, grants, or other payments for writing this manuscript, and they report no relevant financial relationships and no conflicts of interest. The funders had no role in the design of the study; in the collection, analyses, or interpretation of data; in the writing of the manuscript; or in the decision to publish the results.

References

  1. Bitsko, R.H.; Holbrook, J.R.; Robinson, L.R.; Kaminski, J.W.; Ghandour, R.; Smith, C.; Peacock, G. Health Care, Family, and Community Factors Associated with Mental, Behavioral, and Developmental Disorders in Early Childhood—United States, 2011–2012. MMWR Morb. Mortal. Wkly. Rep. 2016, 65, 221–226. [Google Scholar] [CrossRef] [PubMed]
  2. Lopez, M.; Ruiz, M.O.; Rovnaghi, C.R.; Tam, G.K.; Hiscox, J.; Gotlib, I.H.; Barr, D.A.; Carrion, V.G.; Anand, K.J.S. The social ecology of childhood and early life adversity. Pediatr. Res. 2021, 89, 353–367. [Google Scholar] [CrossRef] [PubMed]
  3. Dubowitz, H.; Kressly, S.J. Documenting Psychosocial Problems in Children’s Electronic Health Records. JAMA Pediatr. 2023, 177, 881–882. [Google Scholar] [CrossRef] [PubMed]
  4. Rovnaghi, C.R.; Rigdon, J.; Roue, J.M.; Ruiz, M.O.; Carrion, V.G.; Anand, K.J.S. Longitudinal Trajectories of Hair Cortisol: Hypothalamic-Pituitary-Adrenal Axis Dysfunction in Early Childhood. Front. Pediatr. 2021, 9, 740343. [Google Scholar] [CrossRef]
  5. Anand, K.J.S.; Rigdon, J.; Rovnaghi, C.R.; Qin, F.; Tembulkar, S.; Bush, N.; LeWinn, K.; Tylavsky, F.A.; Davis, R.; Barr, D.A.; et al. Measuring socioeconomic adversity in early life. Acta Paediatr. 2019, 108, 1267–1277. [Google Scholar] [CrossRef] [PubMed]
  6. Nelson, C.A.; Scott, R.D.; Bhutta, Z.A.; Harris, N.B.; Danese, A.; Samara, M. Adversity in childhood is linked to mental and physical health throughout life. BMJ 2020, 371, m3048. [Google Scholar] [CrossRef]
  7. Palmer, F.B.; Anand, K.J.; Graff, J.C.; Murphy, L.E.; Qu, Y.; Volgyi, E.; Rovnaghi, C.R.; Moore, A.; Tran, Q.T.; Tylavsky, F.A. Early adversity, socioemotional development, and stress in urban 1-year-old children. J. Pediatr. 2013, 163, 1733–1739.e1731. [Google Scholar] [CrossRef]
  8. Erema, V.V.; Yakovchik, A.Y.; Kashtanova, D.A.; Bochkaeva, Z.V.; Ivanov, M.V.; Sosin, D.V.; Matkava, L.R.; Yudin, V.S.; Makarov, V.V.; Keskinov, A.A.; et al. Biological Age Predictors: The Status Quo and Future Trends. Int. J. Mol. Sci. 2022, 23, 15103. [Google Scholar] [CrossRef]
  9. Anand, K.J.S.; Rovnaghi, C.R.; Rigdon, J.; Qin, F.; Tembulkar, S.; Murphy, L.E.; Barr, D.A.; Gotlib, I.H.; Tylavsky, F.A. Demographic and psychosocial factors associated with hair cortisol concentrations in preschool children. Pediatr. Res. 2020, 87, 1119–1127. [Google Scholar] [CrossRef]
  10. Timmers, I.; Quaedflieg, C.W.E.M.; Hsu, C.; Healthcote, L.; Rovnaghi, C.R.; Simons, L. The interaction between stress and chronic pain through the lens of threat learning. Neurosci. Biobehav. Rev. 2019, 107, 641–655. [Google Scholar] [CrossRef]
  11. Reh, R.K.; Dias, B.G.; Nelson, C.A., 3rd; Kaufer, D.; Werker, J.F.; Kolb, B.; Levine, J.D.; Hensch, T.K. Critical period regulation across multiple timescales. Proc. Natl. Acad. Sci. USA 2020, 117, 23242–23251. [Google Scholar] [CrossRef]
  12. Brown, T.T.; Jernigan, T.L. Brain development during the preschool years. Neuropsychol. Rev. 2012, 22, 313–333. [Google Scholar] [CrossRef]
  13. Jernigan, T.L.; Brown, T.T.; Hagler, D.J., Jr.; Akshoomoff, N.; Bartsch, H.; Newman, E.; Thompson, W.K.; Bloss, C.S.; Murray, S.S.; Schork, N.; et al. The Pediatric Imaging, Neurocognition, and Genetics (PING) Data Repository. Neuroimage 2016, 124, 1149–1154. [Google Scholar] [CrossRef]
  14. Tozzi, L.; Garczarek, L.; Janowitz, D.; Stein, D.J.; Wittfeld, K.; Dobrowolny, H.; Lagopoulos, J.; Hatton, S.N.; Hickie, I.B.; Carballedo, A.; et al. Interactive impact of childhood maltreatment, depression, and age on cortical brain structure: Mega-analytic findings from a large multi-site cohort. Psychol. Med. 2020, 50, 1020–1031. [Google Scholar] [CrossRef]
  15. Warrier, V.; Stauffer, E.M.; Huang, Q.Q.; Wigdor, E.M.; Slob, E.A.W.; Seidlitz, J.; Ronan, L.; Valk, S.L.; Mallard, T.T.; Grotzinger, A.D.; et al. Genetic insights into human cortical organization and development through genome-wide analyses of 2,347 neuroimaging phenotypes. Nat. Genet. 2023, 55, 1483–1493. [Google Scholar] [CrossRef]
  16. Ruiz, M.O.; Rovnaghi, C.R.; Tembulkar, S.; Qin, F.; Truong, L.; Shen, S.; Anand, K.J.S. Linear hair growth rates in preschool children. Pediatr. Res. 2023, 95, 359–366. [Google Scholar] [CrossRef]
  17. Nicolaides, N.; Rothman, S. Studies on the chemical composition of human hair fat. II. The overall composition with regard to age, sex and race. J. Invest. Dermatol. 1953, 21, 9–14. [Google Scholar] [CrossRef] [PubMed]
  18. Adeola, H.A.; Van Wyk, J.C.; Arowolo, A.; Ngwanya, R.M.; Mkentane, K.; Khumalo, N.P. Emerging Diagnostic and Therapeutic Potentials of Human Hair Proteomics. Proteomics Clin. Appl. 2018, 12, 48. [Google Scholar] [CrossRef] [PubMed]
  19. Tobin, D.J. The Human Hair Fibre. In Hair in Toxicology: An Important Bio-Monitor; Tobin, D.J., Ed.; Royal Society of Chemistry (U.K.): Cambridge, UK, 2005; pp. 34–56, Chapter 2. [Google Scholar]
  20. Villain, M.; Cirimele, V.; Kintz, P. Hair analysis in toxicology. Clin. Chem. Lab. Med. 2004, 42, 1265–1272. [Google Scholar] [CrossRef]
  21. Lee, Y.J.; Rice, R.H.; Lee, Y.M. Proteome analysis of human hair shaft: From protein identification to posttranslational modification. Mol. Cell Proteom. 2006, 5, 789–800. [Google Scholar] [CrossRef]
  22. Laatsch, C.N.; Durbin-Johnson, B.P.; Rocke, D.M.; Mukwana, S.; Newland, A.B.; Flagler, M.J.; Davis, M.G.; Eigenheer, R.A.; Phinney, B.S.; Rice, R.H. Human hair shaft proteomic profiling: Individual differences, site specificity and cuticle analysis. PeerJ 2014, 2, e506. [Google Scholar] [CrossRef]
  23. Carlson, T.L.; Moini, M.; Eckenrode, B.A.; Allred, B.M.; Donfack, J. Protein extraction from human anagen head hairs 1-millimeter or less in total length. Biotechniques 2018, 64, 170–176. [Google Scholar] [CrossRef]
  24. Wu, P.W.; Mason, K.E.; Durbin-Johnson, B.P.; Salemi, M.; Phinney, B.S.; Rocke, D.M.; Parker, G.J.; Rice, R.H. Proteomic analysis of hair shafts from monozygotic twins: Expression profiles and genetically variant peptides. Proteomics 2017, 17, 462. [Google Scholar] [CrossRef]
  25. Parker, G.J.; Leppert, T.; Anex, D.S.; Hilmer, J.K.; Matsunami, N.; Baird, L.; Stevens, J.; Parsawar, K.; Durbin-Johnson, B.P.; Rocke, D.M.; et al. Demonstration of Protein-Based Human Identification Using the Hair Shaft Proteome. PLoS ONE 2016, 11, e0160653. [Google Scholar] [CrossRef]
  26. Tawfik, D.S.; Rovnaghi, C.; Profit, J.; Cornell, T.T.; Anand, K.J.S. Prevalence of burnout and its relation to the neuroendocrine system among pediatric residents during the early COVID-19 pandemic: A pilot feasibility study. Compr. Psychoneuroendocrinol. 2023, 14, 100174. [Google Scholar] [CrossRef]
  27. Elias, J.E.; Gygi, S.P. Target-decoy search strategy for increased confidence in large-scale protein identifications by mass spectrometry. Nat. Methods 2007, 4, 207–214. [Google Scholar] [CrossRef] [PubMed]
  28. Perez-Riverol, Y.; Csordas, A.; Bai, J.; Bernal-Llinares, M.; Hewapathirana, S.; Kundu, D.J.; Inuganti, A.; Griss, J.; Mayer, G.; Eisenacher, M.; et al. The PRIDE database and related tools and resources in 2019: Improving support for quantification data. Nucleic Acids Res. 2019, 47, D442–D450. [Google Scholar] [CrossRef] [PubMed]
  29. Anand, K.J.S.; Leib, R.D.; Rovnaghi, C.R.; Singhal, K. PRIDE Repository, ProteomeXchange: 22 December 2019.
  30. Deutsch, E.W.; Csordas, A.; Sun, Z.; Jarnuczak, A.; Perez-Riverol, Y.; Ternent, T.; Campbell, D.S.; Bernal-Llinares, M.; Okuda, S.; Kawano, S.; et al. The ProteomeXchange consortium in 2017: Supporting the cultural change in proteomics public data deposition. Nucleic Acids Res. 2017, 45, D1100–D1106. [Google Scholar] [CrossRef]
  31. Slominski, R.; Rovnaghi, C.R.; Anand, K.J. Methodological Considerations for Hair Cortisol Measurements in Children. Ther. Drug Monit. 2015, 37, 812–820. [Google Scholar] [CrossRef]
  32. Wold, S.; Esbensen, K.; Geladi, P. Principal component analysis. WIREs Comput. Stat. 2010, 2, 433–459. [Google Scholar] [CrossRef]
  33. Hotelling, H. Analysis of a complex of statistical variables into principal components. J. Educ. Psychol. 1933, 24, 417–441. [Google Scholar] [CrossRef]
  34. Jolliffe, I.T. Principal Component Analysis; Springer: New York, NY, USA, 1986. [Google Scholar]
  35. Linderman, G.C.; Steinerberger, S. Clustering with t-SNE, provably. SIAM J. Math. Data Sci. 2019, 1, 313–332. [Google Scholar] [CrossRef]
  36. Van der Maaten, L.; Hinton, G. Visualizing data using t-SNE. J. Mach. Learn. Res. 2008, 9, 2579–2605. [Google Scholar]
  37. Jylhävä, J.; Pedersen, N.L.; Hägg, S. Biological Age Predictors. EbioMedicine 2017, 21, 29–36. [Google Scholar] [CrossRef]
  38. Barthelemy, N.R.; Bednarczyk, A.; Schaeffer-Reiss, C.; Jullien, D.; Van Dorsselaer, A.; Cavusoglu, N. Proteomic tools for the investigation of human hair structural proteins and evidence of weakness sites on hair keratin coil segments. Anal. Biochem. 2012, 421, 43–55. [Google Scholar] [CrossRef]
  39. Gomes, J.; Au, F.; Basak, A.; Cakmak, S.; Vincent, R.; Kumarathasan, P. Maternal blood biomarkers and adverse pregnancy outcomes: A systematic review and meta-analysis. Crit. Rev. Toxicol. 2019, 49, 461–478. [Google Scholar] [CrossRef]
  40. Handelman, S.K.; Romero, R.; Tarca, A.L.; Pacora, P.; Ingram, B.; Maymon, E.; Chaiworapongsa, T.; Hassan, S.S.; Erez, O. The plasma metabolome of women in early pregnancy differs from that of non-pregnant women. PLoS ONE 2019, 14, e0224682. [Google Scholar] [CrossRef]
  41. Romero, R.; Erez, O.; Maymon, E.; Chaemsaithong, P.; Xu, Z.; Pacora, P.; Chaiworapongsa, T.; Done, B.; Hassan, S.S.; Tarca, A.L. The maternal plasma proteome changes as a function of gestational age in normal pregnancy: A longitudinal study. Am. J. Obstet. Gynecol. 2017, 217, 67.e61–67.e67. [Google Scholar] [CrossRef]
  42. Lara, J.; Cooper, R.; Nissan, J.; Ginty, A.T.; Khaw, K.T.; Deary, I.J.; Lord, J.M.; Kuh, D.; Mathers, J.C. A proposed panel of biomarkers of healthy ageing. BMC Med. 2015, 13, 222. [Google Scholar] [CrossRef] [PubMed]
  43. Deelen, J.; Kettunen, J.; Fischer, K.; van der Spek, A.; Trompet, S.; Kastenmuller, G.; Boyd, A.; Zierer, J.; van den Akker, E.B.; Ala-Korpela, M.; et al. A metabolic profile of all-cause mortality risk identified in an observational study of 44,168 individuals. Nat. Commun. 2019, 10, 3346. [Google Scholar] [CrossRef] [PubMed]
  44. Breiman, L. Random Forest. Mach. Learn. 2001, 45, 5–32. [Google Scholar] [CrossRef]
  45. Ebstein, R.P.; Knafo, A.; Mankuta, D.; Chew, S.H.; Lai, P.S. The contributions of oxytocin and vasopressin pathway genes to human behavior. Horm. Behav. 2012, 61, 359–379. [Google Scholar] [CrossRef]
  46. Muscogiuri, G.; Barrea, L.; Annunziata, G.; Vecchiarini, M.; Orio, F.; Di Somma, C.; Colao, A.; Savastano, S. Water intake keeps type 2 diabetes away? Focus on copeptin. Endocrine 2018, 62, 292–298. [Google Scholar] [CrossRef] [PubMed]
  47. Chandrasekharan, B.; Montllor-Albalate, C.; Colin, A.E.; Andersen, J.L.; Jang, Y.C.; Reddi, A.R. Cu/Zn Superoxide Dismutase (Sod1) regulates the canonical Wnt signaling pathway. Biochem. Biophys. Res. Commun. 2021, 534, 720–726. [Google Scholar] [CrossRef] [PubMed]
  48. Une, M.; Yamakawa, M.; Watanabe, Y.; Uchino, K.; Honda, N.; Adachi, M.; Nakanishi, M.; Umezawa, A.; Kawata, Y.; Nakashima, K.; et al. SOD1-interacting proteins: Roles of aggregation cores and protein degradation systems. Neurosci. Res. 2021, 170, 295–305. [Google Scholar] [CrossRef] [PubMed]
  49. Nam, M.K.; Seong, Y.; Jeong, G.H.; Yoo, S.A.; Rhim, H. HtrA2 regulates alpha-Synuclein-mediated mitochondrial reactive oxygen species production in the mitochondria of microglia. Biochem. Biophys. Res. Commun. 2023, 638, 84–93. [Google Scholar] [CrossRef] [PubMed]
  50. Ganne, A.; Balasubramaniam, M.; Griffin, W.S.T.; Shmookler Reis, R.J.; Ayyadevara, S. Glial Fibrillary Acidic Protein: A Biomarker and Drug Target for Alzheimer’s Disease. Pharmaceutics 2022, 14, 71354. [Google Scholar] [CrossRef] [PubMed]
  51. Griffin, S.T.G.; Stanley, L.C.; Yeralan, O.; Rovnaghi, C.R.; Marshak, D.R. Cytokines in Human Neurodegenerative Disease; Conn, P.M., Ed.; Academic Press, Inc.: San Diego, CA, USA, 1993; Volume 17, p. 295. [Google Scholar]
  52. Cruz, C.F.; Fernandes, M.M.; Gomes, A.C.; Coderch, L.; Marti, M.; Mendez, S.; Gales, L.; Azoia, N.G.; Shimanovich, U.; Cavaco-Paulo, A. Keratins and lipids in ethnic hair. Int. J. Cosmet. Sci. 2013, 35, 244–249. [Google Scholar] [CrossRef] [PubMed]
  53. Franbourg, A.; Hallegot, P.; Baltenneck, F.; Toutain, C.; Leroy, F. Current research on ethnic hair. J. Am. Acad. Dermatol. 2003, 48, S115–S119. [Google Scholar] [CrossRef]
  54. Horvath, A.L. Solubility of structurally complicated materials: 3. Hair. Sci. World J. 2009, 9, 255–271. [Google Scholar] [CrossRef]
  55. Marti, M.; Barba, C.; Manich, A.M.; Rubio, L.; Alonso, C.; Coderch, L. The influence of hair lipids in ethnic hair properties. Int. J. Cosmet. Sci. 2016, 38, 77–84. [Google Scholar] [CrossRef]
  56. Wilson, A.S.; Tobin, D.J. Aging Hair; Springer: Berlin, Germany, 2010; pp. 249–261. [Google Scholar]
  57. Biasiolo, A.; Tono, N.; Ruvoletto, M.; Quarta, S.; Turato, C.; Villano, G.; Beneduce, L.; Fassina, G.; Merkel, C.; Gatta, A.; et al. IgM-linked SerpinB3 and SerpinB4 in sera of patients with chronic liver disease. PLoS ONE 2012, 7, e40658. [Google Scholar] [CrossRef]
  58. Markovina, S.; Wang, S.; Henke, L.E.; Luke, C.J.; Pak, S.C.; DeWees, T.; Pfeifer, J.D.; Schwarz, J.K.; Liu, W.; Chen, S.; et al. Serum squamous cell carcinoma antigen as an early indicator of response during therapy of cervical cancer. Br. J. Cancer 2018, 118, 72–78. [Google Scholar] [CrossRef]
  59. van Kempen, P.M.; Noorlag, R.; Swartz, J.E.; Bovenschen, N.; Braunius, W.W.; Vermeulen, J.F.; Van Cann, E.M.; Grolman, W.; Willems, S.M. Oropharyngeal squamous cell carcinomas differentially express granzyme inhibitors. Cancer Immunol. Immunother. 2016, 65, 575–585. [Google Scholar] [CrossRef]
  60. Charlesworth, A.; Chiaverini, C.; Chevrant-Breton, J.; DelRio, M.; Diociaiuti, A.; Dupuis, R.P.; El Hachem, M.; Le Fiblec, B.; Sankari-Ho, A.M.; Valhquist, A.; et al. Epidermolysis bullosa simplex with PLEC mutations: New phenotypes and new mutations. Br. J. Dermatol. 2013, 168, 808–814. [Google Scholar] [CrossRef]
  61. Paumard-Hernandez, B.; Calvete, O.; Inglada Perez, L.; Tejero, H.; Al-Shahrour, F.; Pita, G.; Barroso, A.; Carlos Trivino, J.; Urioste, M.; Valverde, C.; et al. Whole exome sequencing identifies PLEC, EXO5 and DNAH7 as novel susceptibility genes in testicular cancer. Int. J. Cancer 2018, 143, 1954–1962. [Google Scholar] [CrossRef]
  62. Winter, L.; Turk, M.; Harter, P.N.; Mittelbronn, M.; Kornblum, C.; Norwood, F.; Jungbluth, H.; Thiel, C.T.; Schlotzer-Schrehardt, U.; Schroder, R. Downstream effects of plectin mutations in epidermolysis bullosa simplex with muscular dystrophy. Acta Neuropathol. Commun. 2016, 4, 44. [Google Scholar] [CrossRef]
  63. Barel, O.; Shorer, Z.; Flusser, H.; Ofir, R.; Narkis, G.; Finer, G.; Shalev, H.; Nasasra, A.; Saada, A.; Birk, O.S. Mitochondrial complex III deficiency associated with a homozygous mutation in UQCRQ. Am. J. Hum. Genet. 2008, 82, 1211–1216. [Google Scholar] [CrossRef]
  64. Eckhaus, J.; Lawrence, K.M.; Helbig, I.; Bui, M.; Vadlamudi, L.; Hopper, J.L.; Scheffer, I.E.; Berkovic, S.F. Genetics of febrile seizure subtypes and syndromes: A twin study. Epilepsy Res. 2013, 105, 103–109. [Google Scholar] [CrossRef]
  65. Lagae, L. What’s new in: “genetics in childhood epilepsy”. Eur. J. Pediatr. 2008, 167, 715–722. [Google Scholar] [CrossRef]
  66. Munakata, K.; Uemura, M.; Takemasa, I.; Ozaki, M.; Konno, M.; Nishimura, J.; Hata, T.; Mizushima, T.; Haraguchi, N.; Noura, S.; et al. SCGB2A1 is a novel prognostic marker for colorectal cancer associated with chemoresistance and radioresistance. Int. J. Oncol. 2014, 44, 1521–1528. [Google Scholar] [CrossRef]
  67. Mauvais-Jarvis, F.; Bairey Merz, N.; Barnes, P.J.; Brinton, R.D.; Carrero, J.J.; DeMeo, D.L.; De Vries, G.J.; Epperson, C.N.; Govindan, R.; Klein, S.L.; et al. Sex and gender: Modifiers of health, disease, and medicine. Lancet 2020, 396, 565–582. [Google Scholar] [CrossRef]
  68. Wright, F.A.; Sullivan, P.F.; Brooks, A.I.; Zou, F.; Sun, W.; Xia, K.; Madar, V.; Jansen, R.; Chung, W.; Zhou, Y.H.; et al. Heritability and genomics of gene expression in peripheral blood. Nat. Genet. 2014, 46, 430–437. [Google Scholar] [CrossRef]
  69. Stoeckli, E.T. Understanding axon guidance: Are we nearly there yet? Development 2018, 145, 151415. [Google Scholar] [CrossRef]
  70. Sutor, B.; Hagerty, T. Involvement of gap junctions in the development of the neocortex. Biochim. Biophys. Acta 2005, 1719, 59–68. [Google Scholar] [CrossRef]
  71. Lee, S.E.; West, K.P., Jr.; Cole, R.N.; Schulze, K.J.; Wu, L.S.; Yager, J.D.; Groopman, J.; Christian, P. General intelligence is associated with subclinical inflammation in Nepalese children: A population-based plasma proteomics study. Brain Behav. Immun. 2016, 56, 253–263. [Google Scholar] [CrossRef]
  72. Lakshmi Priya, M.D.; Geetha, A. A biochemical study on the level of proteins and their percentage of nitration in the hair and nail of autistic children. Clin. Chim. Acta 2011, 412, 1036–1042. [Google Scholar] [CrossRef]
  73. Breen, M.S.; Ozcan, S.; Ramsey, J.M.; Wang, Z.; Ma’ayan, A.; Rustogi, N.; Gottschalk, M.G.; Webster, M.J.; Weickert, C.S.; Buxbaum, J.D.; et al. Temporal proteomic profiling of postnatal human cortical development. Transl. Psychiatry 2018, 8, 267. [Google Scholar] [CrossRef]
  74. Carlyle, B.C.; Kitchen, R.R.; Kanyo, J.E.; Voss, E.Z.; Pletikos, M.; Sousa, A.M.M.; Lam, T.T.; Gerstein, M.B.; Sestan, N.; Nairn, A.C. A multiregional proteomic survey of the postnatal human brain. Nat. Neurosci. 2017, 20, 1787–1795. [Google Scholar] [CrossRef]
  75. Johnson, A.A.; Shokhirev, M.N.; Wyss-Coray, T.; Lehallier, B. Systematic review and analysis of human proteomics aging studies unveils a novel proteomic aging clock and identifies key processes that change with age. Ageing Res. Rev. 2020, 60, 101070. [Google Scholar] [CrossRef]
  76. Pedlar, C.R.; Newell, J.; Lewis, N.A. Blood Biomarker Profiling and Monitoring for High-Performance Physiology and Nutrition: Current Perspectives, Limitations and Recommendations. Sports Med. 2019, 49, 185–198. [Google Scholar] [CrossRef] [PubMed]
Figure 1. Hair proteins in mothers and children. Note. (A) Protein spectral counts (p = 0.0004) and (B) the numbers of proteins observed (with spectral counts >3) were consistently higher (p = 0.001, Wilcoxon tests) in mothers (M; cyan) than in children (C; pink). Mothers and their biological children (family labels: F107, F123, F134, F142, F183, F218, F271, and F288) and unrelated children (U) are identified on the X-axis: all mothers except F134 and F218 had higher spectral counts and more hair proteins than their children.
Psych 06 00009 g001
Figure 2. Similarities in hair protein profiles of individuals and families. Note. (A) Spearman rank correlation matrix with high (purple) to low (orange) correlation coefficients; (B) Euclidean distances based on protein spectral counts showing individuals more closely related (red) or more distant (grey) from each other; (C) hierarchical cluster dendrogram based on log spectral counts showing 7/8 mothers grouped into one cluster with older children (4–6 years) (mustard), mostly White or Asian families, with the highest numbers of proteins and protein spectral matches (PSMs); one mother in an adjacent cluster with children 2–4 years (pink), mostly Hispanic families, with fewer proteins and PSMs; the younger children (1–4 years) grouped into one cluster (green), with the fewest numbers of proteins and PSMs; whereas a wide age range (1–5 years) of children cluster together (blue) with intermediate numbers of proteins and PSMs; (D) intra-family Manhattan distances from Boolean hair protein profiles were shorter in mothers matched with their own children (p < 0.0002) vs. 5000 simulated datasets created with mismatched mothers and children. Individuals are listed on the X- and Y-axes with their family identifier, with Mo for mother, C1 for the younger child, and C2 for the older child in each family.
Psych 06 00009 g002
Figure 3. Age and sex-related differences in hair proteins. Note. (A) The first two principal components showing spatial separations by age, with children over 2 years old (pink) located between the children up to 2 years of age (blue, upper right) and the mothers (green, lower left). (B) The first two tSNE dimensions by age, showing mothers (green) in the left upper quadrant separate from the younger (0–2 years, blue) and older (3–5 yeas, pink) children. Higher spectral counts for 7/17 hair proteins occurred in mothers (SERPINB4, POF1B, PLEC, A2ML1, HIST1H3A, UQCRQ, and AHCY) and one protein (SCGB2A1) in children (Kruskal–Wallis ANOVA and post hoc Benjamini–Hochberg corrections). (C) PCA analyses of all children showing overlapping circles for girls (blue) and boys (pink). (D) tSNE dimensions by sex, showing overlap between boys (pink) and girls (blue). Higher spectral counts were observed for CSN2 (casein beta) in boys (p = 0.0184) and ALMS1 (Alström syndrome protein 1) in girls (p = 0.0214) (see Table 3).
Psych 06 00009 g003
Figure 4. Machine learning algorithms predict age and sex from hair proteins. Note. Mean scatterplot from 100 runs of random forest regression showing (A) observed vs. predicted age for mothers and children (R2 0.37, p = 0.00005) and (B) only for children (R2 0.45, p = 0.00004). (C,D) Random forest plot showing mean accuracy for classifying mothers and children based on hair proteins (mean area under the ROC curve = 0.93, Wilcoxon test p = 0.00011). (E,F) Random forest plot showing mean accuracy for classifying by sex based on hair proteins for children (mean area under the ROC curve = 0.60, Wilcoxon test p = 0.1703). (G,H) Random forest plot improved when classifying all participants, including mothers and children (area under the ROC curve = 0.73, Wilcoxon test p = 0.00831).
Psych 06 00009 g004
Figure 5. Top 5% of proteins contributing to hair protein variability. Note. The loading scores for each protein were weighted by the percent variance explained by the corresponding principal component and then summed to give the total loading score (TLS) for each protein. The top 5% of proteins based on their TLSs were identified as the most prominent contributors in each group. (A) All individuals (n = 40, 49% of hair protein variability); (B) all individuals, including keratins and KAPs (n = 40, 64.3% variability); (C) all mothers (n = 8, 89.5% variability); (D) all children (n = 32, 57.5% variability); (E) mothers (n = 8) and their biological children (n = 16) (49.3% variability); and (F) mothers (n = 8) and unrelated children (n = 16) (64.6% variability).
Psych 06 00009 g005
Figure 6. Protein network for the top 5% of hair proteins contributing to age-related differences between mothers and children. Note. Some hair proteins had higher spectral counts in children (orange), and others had higher spectral counts in mothers (blue); continuous lines show direct relationships, and interrupted lines denote indirect relationships. Mothers showed higher spectral counts mostly for ‘enzymes’ and ‘peptidases’ involved in cellular and metabolic processes, while proteins with higher spectral counts in children belonged to the ‘other’ group involved in growth and biological maturation.
Psych 06 00009 g006
Figure 7. Protein network for top 5% of hair proteins contributing to sex differences between boys and girls. Note. Protein network for the top 5% of hair proteins contributing to sex differences between boys and girls. Some proteins had higher spectral counts in girls (orange), and others had higher spectral counts in boys (blue); continuous lines show direct relationships, and interrupted lines denote indirect relationships. Girls showed higher protein spectral counts mostly for ‘enzymes’ or ‘transporters’ associated with cellular localization and metabolic processes. Proteins with higher spectral counts in boys are ‘enzymes’, like ‘kinases’ or ‘peptidases’, associated with biological regulation of cellular and metabolic processes.
Psych 06 00009 g007
Figure 8. Canonical pathways. Note. Canonical pathways associated with biologically significant proteins from the top 5% of variables in all individuals (n = 40) contributing to age- and sex-related differences were identified using ingenuity pathway analysis. Most of these proteins are involved in cellular metabolism, immune responses, brain development, and stress regulatory pathways.
Psych 06 00009 g008
Table 1. Demographic characteristics and hair protein data of all participants.
Family CodeSubjectAge (Months)Age (Years)GenderRaceEthnicity# of Hair ProteinsPeptide Spectral Matches
F107Mother450.637.6FWhiteNH8196.533
Child127.62.3FWhiteNH5683.949
Child258.04.8MWhiteOther4642.873
F123Mother447.137.3FWhiteNH80910.370
Child124.02FWhiteNH4993.728
Child252.44.4MWhiteNH5735.078
F134Mother431.835.9FWhiteNA6845.445
Child120.91.74MMixedNA3872.760
Child267.65.6FMixedNA7596.872
F142Mother447.337.3FAsianNA6508.370
Child120.11.7MMixedNA5816.208
Child250.64.2MMixedNA2262.353
F183Mother530.044.2FAsianNH109010.527
Child18.50.7MAsianNH3142.331
Child244.03.7MAsianNH10108.065
F218Mother50442FWhiteH6094.144
Child158.54.9FWhiteH5243.107
Child235.22.9FWhiteH6314.475
F271Mother402.633.6FWhiteNH7697.525
Child115.11.3FWhiteNH5577.161
Child242.53.5FWhiteNH6005.615
F286Mother489.840.8FWhiteNH6169.209
Child122.01.8MWhiteNH4034.727
Child252.54.4FWhiteNH6146.061
F346Child50.34.2MWhiteNA4753.429
F192Child38.13.2FOtherH2831.731
F132Child51.44.3FWhiteNA2721.892
F363Child56.64.7MMixedNH2701.914
F281Child53.54.5MMixedMixed4063.192
F173Child51.34.3FOther Other8357.168
F380Child14.81.2MAsianNA2371.814
F159Child62.75.2FWhiteNH4853.830
F179Child53.04.4FAsianOther4942.926
F149Child61.35.1FMixedNH6985.733
F106Child56.74.7FAsianNH6686.390
F153Child57.14.8MAsianNA2752.549
F256Child55.84.7MMixedMixed6387.016
F190Child31.52.6FAsianOther5277.460
F104Child50.24.2MWhiteNH6728.084
F113Child17.91.5FWhiteNH4413.640
Note. Demographic data, total number of proteins, and peptide spectral matches observed in all 40 individuals. Mothers’ hair (n = 8) had a significantly higher number of proteins (p = 0.001) and protein spectral matches (p = 0.0004) than children’s hair (n = 32). Related children (n = 16) are grouped with their mothers, and unrelated children are listed below them (n = 16). Abbreviations: NH = Non-Hispanic, H = Hispanic, NA = Not Available.
Table 2. Hair proteins mediating differences between mothers and children.
Entrez Gene NameGene Symbol: HumanExpr Log Ratiop-ValueLocationType(s)
InvolucrinIVL–2.850.0576Cytoplasmother
Serpin family B4SERPINB4–2.4520.0009 ***Cytoplasmother
Actin binding proteinPOF1B–2.0970.0151 *Membraneother
PlectinPLEC–1.8860.0004 ***Cytoplasmother
Alpha-2-macroglobulin like 1A2ML1–1.8580.0042 **Cytoplasmother
H3 clustered histone 1HIST1H3A–1.7430.0038 **Nucleusother
Ubiquinol-cytochrome c reductase complex IIIUQCRQ–1.7160.0007 ***Cytoplasmenzyme
AdenosylhomocysteinaseAHCY–1.4720.0040 **Cytoplasmenzyme
Heat shock protein family A (Hsp70-1A)HSPA1A–1.350.0569Cytoplasmenzyme
H2B clustered histone 9HIST1H2BH–1.170.5070Nucleusother
Histidine ammonia-lyaseHAL–1.0870.0851Cytoplasmenzyme
COPI coat complex subunit zeta 1COPZ1–0.9310.158Cytoplasmtransporter
Eukaryotic translation initiation factor 3AEIF3A–0.80.0567Cytoplasmother
Tubulin alpha 1cTUBA1C–0.5260.262Cytoplasmother
Casein betaCSN2–0.2690.491Extracellularkinase
ATP citrate lyaseACLY–0.2490.0954Cytoplasmenzyme
Protein disulfide isomerase A3PDIA3–0.0510.884Cytoplasmpeptidase
ScinderinSCIN0.0280.221Cytoplasmother
Alström syndrome protein 1ALMS10.180.572Cytoplasmother
Histone H3.4HIST3H30.640.153Nucleusother
MyeloperoxidaseMPO0.9250.886Cytoplasmenzyme
Secretoglobin 2A1SCGB2A15.320.0008 ***Extracellularother
Note. Mothers showed higher spectral counts than children for 7/17 hair proteins (negative Expr Log Ratio), although children had higher spectral counts for SCGB2A1 (positive Expr Log Ratio). Of these, SCGB2A1 showed the most prominent results, with >5-fold differences from the mothers. Significance was based on Kruskal–Wallis ANOVA with post hoc Benjamini–Hochberg corrections for multiple comparisons (* p-value ≤ 0.05, ** p-value ≤ 0.01, *** p-value ≤ 0.001).
Table 3. Hair proteins mediating differences between preschool boys and girls.
Entrez Gene NameGene Symbol: HumanExpr Log Ratiop-ValueLocationType
Casein betaCSN2−3.0460.0184 *Extracellularkinase
Serpin family B4SERPINB4−1.3030.391Cytoplasmother
Secretoglobin family 2A1SCGB2A1−1.0360.0513Extracellularother
Protein disulfide isomerase A3PDIA3−0.780.662Cytoplasmpeptidase
ATP citrate lyaseACLY−0.5310.585Cytoplasmenzyme
MyeloperoxidaseMPO−0.4930.581Cytoplasmenzyme
InvolucrinIVL−0.4760.804Cytoplasmother
Eukaryotic translation initiation factor 3AEIF3A−0.2950.226Cytoplasmother
Alpha-2-macroglobulin like 1A2ML1−0.2540.923Cytoplasmother
ScinderinSCIN−0.1870.375Cytoplasmother
Heat shock protein family A (Hsp70-1A)HSPA1A−0.1220.573Cytoplasmenzyme
Actin binding proteinPOF1B0.0940.875Membraneother
Histone H3.4 H3-40.1390.938Nucleusother
Histidine ammonia-lyaseHAL0.1750.522Cytoplasmenzyme
COPI coat complex zeta 1COPZ10.2250.536Cytoplasmtransporter
Tubulin alpha 1cTUBA1C0.2450.314Cytoplasmother
H3 clustered histone 1H3C10.2490.562Nucleusother
AdenosylhomocysteinaseAHCY0.3330.202Cytoplasmenzyme
PlectinPLEC0.4410.256Cytoplasmother
Ubiquinol-cytochrome c reductase complex III UQCRQ1.4150.0976Cytoplasmenzyme
H2B clustered histone 9H2BC91.4230.221Nucleusother
Alström syndrome protein 1ALMS11.7540.0214 *Cytoplasmother
Note. Girls showed higher spectral counts than boys for several proteins (negative Expr Log Ratio), whereas boys had higher spectral counts for other proteins (positive Expr Log Ratio). CSN2 was significantly higher in boys, whereas ALMS1 was significantly higher in girls. Significance was based on Kruskal–Wallis ANOVA with post hoc Benjamini–Hochberg corrections for multiple comparisons (* p-value ≤ 0.05).
Table 4. ELISA validation of proteins detected in human scalp hair via UPLC–MS/MS.
Hair Sample Pools Based on Hair Cortisol ConcentrationCortisol ng/mLAVP pg/mLCu/Zn SOD ng/mLHTRA2 ng/mLGFAP ng/mL
Low Child pool cortisol (n = 72)40.8414.810.257.540.00
Moderate Child pool cortisol (n = 21)60.3411.910.184.610.41
High Child pool cortisol (n = 7)190.897.180.239.14n/a
Low Father pool cortisol (n = 13)22.398.360.639.652.64
Low Mother pool cortisol (n = 39)17.247.880.497.711.45
High Mother pool cortisol (n = 7)36.7711.68n/an/an/a
Note. Groups of children and parents were determined on the basis of low, moderate, or high HCC values. Each of the six pools of samples was loaded in duplicate on the respective ELISA plates for testing arginine vasopressin (AVP), Cu/Zn superoxide dismutase (SOD1), HTrA serine peptidase 2 (HTRA2), and glial fibrillary acid protein (GFAP). Each method passed our criteria for low inter-assay (≤8% CV) and intra-assay (≤6%) variability.
Disclaimer/Publisher’s Note: The statements, opinions and data contained in all publications are solely those of the individual author(s) and contributor(s) and not of MDPI and/or the editor(s). MDPI and/or the editor(s) disclaim responsibility for any injury to people or property resulting from any ideas, methods, instructions or products referred to in the content.

