Next Article in Journal
Well-Being Technologies and Positive Psychology Strategies for Training Metacognition, Emotional Intelligence and Motivation Meta-Skills in Clinical Populations: A Systematic Review
Previous Article in Journal
Freezing Effect and Bystander Effect: Overlaps and Differences
 
 
Please note that, as of 22 March 2024, Psych has been renamed to Psychology International and is now published here.
Article

Early Change in Quality of Life in the Treatment of Anorexia Nervosa

1
School of Psychology, Western Sydney University, Sydney, NSW 2751, Australia
2
School of Medicine, Translational Health Research Institute, Western Sydney University, Sydney, NSW 2751, Australia
3
Inside Out Institute, University of Sydney, Sydney, NSW 2006, Australia
4
School of Medicine, University of Nottingham, Nottingham NG7 2RD, UK
5
Psychoneurobiology of Eating and Addictive Behaviors Group, Neurosciences Programme, Bellvitge Biomedical Research Institute (IDIBELL), 08908 Barcelona, Spain
6
Mental Health Services, The Sydney Children’s Hospitals Network, Westmead, Sydney, NSW 2145, Australia
7
World Health Organization Collaborating Centre for Capacity Building and Training in Global Mental Health, Columbia University Medical Center, New York, NY 10032, USA
8
Mental Health Services, Camden and Campbelltown Hospitals, SWSLHD, Sydney, NSW 2750, Australia
*
Author to whom correspondence should be addressed.
Psych 2024, 6(1), 288-304; https://doi.org/10.3390/psych6010018
Submission received: 31 December 2023 / Revised: 13 February 2024 / Accepted: 19 February 2024 / Published: 29 February 2024
(This article belongs to the Section Neuropsychology, Mental Health and Brain Disorders)

Abstract

:
This study aimed to examine whether early change in self-reported quality of life (QoL) was a predictor of outcomes in the treatment of anorexia nervosa (AN). Given suggestions that people with AN overestimate their QoL when unwell, we hypothesised that any early change in self-reported QoL, be it an early improvement or early worsening, would predict better outcomes in terms of end-of-treatment body mass index (BMI), eating disorder (ED) psychopathology, and QoL. Participants were 78 adult outpatients engaged in cognitive behaviour therapy for anorexia nervosa (CBT-AN) either with or without the embedded compulsive exercise module “compuLsive Exercise Activity TheraPy” (LEAP). Polynomial regression was utilised to examine the effects of varying combinations of baseline and 10-week self-reported physical-health-relatedr QoL (SF-12; PHRQoL subscale), mental-health-related QoL (SF-12; MHRQoL subscale), and eating-disorder-specific QoL (EDQoL; global, psychological, cognitive/physical, financial, and school/work subscales) on end-of-treatment BMI, ED psychopathology, and QoL. Greater magnitudes of early change in global EDQoL scores, both positive and negative, predicted better MHRQoL but not BMI or ED psychopathology at the end of treatment. Psychological EDQoL ratings also accounted for 38.1% of the variance in end-of-treatment ED psychopathology, although tests examining the 6ratings may be meaningful in predicting treatment outcomes. The positive impact of early worsening in QoL ratings suggests that early QoL ratings are inflated due to denial and poor insight. Clinicians should be reassured that early QoL decline does not indicate treatment failure.

1. Introduction

Anorexia nervosa is an eating disorder characterised by body image concerns and an intense fear of weight gain, which is managed by individuals through severe dietary restriction and other weight-control behaviours [1]. Despite its severity, or perhaps due to it, treatment efficacy remains low [2]. Of those who survive, more than 50% remain unwell at 10 years’ follow-up [3]. More recent research considering outcomes at 20 years’ follow-up has found higher recovery rates of 64% and 73%, respectively [4,5]; however, there remains a significant proportion of individuals who remain ill for decades, and there is little clarity around which treatments are effective in these instances [6].
Beyond the issue of recovery rates, the definition of recovery itself is problematic. It has been consistently reported that, for individuals with eating disorders, recovery means more than the cessation of behavioural symptoms and achievement of a healthy weight [7,8,9,10]. One consequence of a narrow definition of recovery is that, even when disorder symptoms have reduced, individuals continue to experience poorer outcomes in quality of life (QoL) compared to the general population [11]. What this finding suggests is that focus on disorder symptoms alone is not enough to achieve the holistic sense of recovery that individuals with AN desire. There is, therefore, a need for continued research into what really constitutes “successful treatment” beyond the usual measures of symptom reduction.

1.1. Quality of Life

In this context, there is emerging evidence that QoL has value as an active target of treatment and as mechanism of change itself. A study [12] utilised a time-lag analytical procedure and determined that there was a bidirectional relationship. In this study, eating disorder (ED) symptoms predicted reduced QoL, and reductions in QoL predicted increases in ED symptoms over time. Such a finding was not without precedent, however, with [13] comparing cognitive behaviour therapy (CBT) and interpersonal therapy (IPT) for AN and unexpectedly finding that their “control treatment” of non-specific clinical management was superior to both. Supportive counselling, as well as providing information, praise, and reassurance, together with allowing the patients to dictate the content they wished to work on were effective in helping 82% reach few or no features of an eating disorder at the end of treatment [13,14]. Thus, having improved QoL as a primary focus in treatment may lead to ED symptom reduction. Further studies have found that a person-centred approach results in improvements in ED psychopathology and BMI, even when not the focus of treatment [15]. Despite these promising findings, QoL continues to be largely positioned as a secondary outcome, and the literature examining QoL as a mechanism is limited.
A key factor influencing the need for an increased focus on QoL in the treatment of AN is its ego-syntonic nature. While symptoms in most other disorders are viewed by the individual as detracting from their wellbeing, individuals with AN often may not acknowledge a problem exists. Instead, they report that, through their disorder, they experience a sense of control over their lives, which in turn improves their self-worth [8]. Within this, AN provides a sense of identity in which they learn to feel secure, to the point that early consideration of treatment is conceptualised largely in terms of what they would lose [8,16]. Therefore, treatments must be perceived as benefiting the individual and improving wellbeing to counter the loss of the perceived positives of AN. This idea has led efforts calling for improvements in QoL to be as central to treatment as the reduction in symptoms of psychopathology or improved body weight [17,18].
While the ego-syntonic aspects of AN indicate the importance of targeting QoL during treatment, it also introduces significant complexity in measuring the QoL experiences in individuals with AN. Despite having objectively poorer physical health, [19] found that individuals with the restricting subtype of AN (i.e., individuals without binge/purging behaviours) reported QoL comparable to that of healthy controls. Further research [20] has provided evidence of the relationship between QoL and ego-syntonicity, demonstrating an interaction between motivation to change and QoL ratings. At admission, individuals with higher readiness to change reported lower physical health QoL (PHRQoL) but higher mental health QoL (MHRQoL) than those in pre-contemplation. While it is possible that lower MHRQoL enhances the need for change more than PHRQoL, another possible interpretation is that, as insight and motivation to change increases, self-reports of QoL become more accurate. Thus, people may inaccurately report a higher MHRQoL earlier in treatment. Given this, it is unclear whether reduction in QoL ratings reflects true reduction in QoL or reflects a reduction in ego-syntonicity and increased readiness to accept the need to change. Critically, these findings suggest that both increases and decreases in QoL ratings may be reflective of an individual’s progression in treatment.

1.2. Early Change

Another focus within the wider ED literature has been the importance and impact of early change in treatment. Early change has been well established as a predictor of outcome in binge-eating disorder [21,22,23], but there is comparatively less research on the impact of early change on the outcome of treatment for AN, with early weight gain being the most consistent predictor [24].
Research in this area has largely focussed on “direct early change predictors”, that is, predictive relationships where the same variable is examined as both the predictor and the outcome. Several systematic reviews have concluded that early weight gain, reduction in bingeing and purging behaviours, and reduction in ED psychopathology all predict better outcomes in these same variables [25,26,27,28]. Although strong and robust relationships have been found, with ED treatment interventions already placing emphasis on the direct treatment of symptoms, mechanisms of change are unclear. There may be a third variable that predicts both the magnitude of early as well as end-of-treatment improvements.
In line with calls for an expanded definition of recovery that moves beyond the direct targeting of disorder symptoms, there is some evidence of what [29] has termed “novel early change predictors”. These are predictor variables that theoretically underlie the outcome variable (e.g., early change in self-compassion as a predictor of end-of-treatment ED psychopathology). While the research in this area is sparse, a review of the literature indicates that early reductions in fear of expressing compassion, fear of receiving compassion, depression, subjective incompetence, and intolerance of uncertainty, as well as early increases in emotional regulation ability, are associated with better treatment outcomes in AN [29,30,31,32,33,34,35]. In line with the reported experience of individuals with AN, these findings indicate that improvements in ED symptoms are predicted not only by early changes in the symptoms themselves but also by broader improvements in wellbeing. However, there is an incomplete understanding of what is needed to achieve a holistic functional recovery beyond ED symptom reduction. In particular, to the author’s knowledge, no prior studies have investigated whether early change in QoL predicts better outcomes in terms of BMI, ED psychopathology, or QoL in AN treatment.

1.3. Aims and Hypotheses

This study aims to add to the literature on AN treatment efficacy by examining whether early changes in quality of life predict the end-of-treatment outcomes of BMI, ED psychopathology, and quality of life. Through this, we intend to provide clarity to clinicians on how early changes in QoL should be interpreted. The literature, including broad investigations of putative predictors in this study sample [36,37] suggests that QoL may be an important consideration in the treatment of AN as both an outcome and as an active treatment target. As such, we hypothesise that early improvement in QoL will predict better outcomes in terms of end-of-treatment outcomes. However, the literature has also indicated that the assessment of QoL is not straightforward, with the ego-syntonic nature of the disorder leading to impairment in insight and the subsequent denial of QoL impairments. In light of this, it is also possible that early reductions in QoL represent improved insight and subsequently lead to better outcomes. Therefore, we hypothesised that any early change in self-reported QoL, be it an early improvement or early worsening, would predict better outcomes in terms of end-of-treatment BMI, ED psychopathology, and QoL.

2. Materials and Methods

2.1. Study Design

This current study utilised data gathered as part of a multi-site randomised controlled trial [36] (ACTRN12610000585022, prospectively registered 21 July 2010).

2.2. Participants

The participants were 78 adults (2 male, 76 female) from Sydney (n = 28), Leicester(n = 40), and New York (n = 10), recruited through eating disorder clinics and community advertising [36,37]. They had a mean age of 27.38 years (SD = 9.22), with mean onset at age 16.7 (SD = 4.9). Participants were eligible for inclusion if they were at least 18 years of age, had a primary diagnosis of AN according to the Diagnostic and Statistical Manual [1] criteria, had a BMI between 14 and 18.5, and reported engaging in a physical exercise activity at least once in the past four weeks. Fifty (64%) had restricting-type AN, and the remainder had binge–purge-type AN. Participants were excluded if they had a current diagnosis of psychosis, bipolar disorder, or a substance use disorder according to the DSM-5, had an elevated risk of suicide, or were medically unstable.

2.3. Procedure

The participants were randomised to one of two groups. All participants completed 34 individual sessions of outpatient manualised CBT for AN over 8–10 months [38]. The active intervention group (n= 38) received 8 sessions of “compuLsive Exercise Activity TheraPy” (LEAP), and the remainder (n = 40) received CBT-AN alone. LEAP was incorporated into the 3rd to the 10th CBT-AN session. The first data point post-baseline was at the 10th session, after which all participants received the same therapy, CBT-AN. Participants attended therapy twice weekly for 4 weeks and weekly thereafter with 3- and 6- month follow-ups delivered by CBT-trained specialist therapists. In the trial, there were no significant differences at any time point in the primary and secondary outcomes (excepting body weight). All outcomes were assessed at the end of treatment and follow-up [36].

2.4. Measures

Body Mass Index: Weight (kg) divided by height (m2), derived from objective measurement-calibrated scales and stadiometers.
Eating Disorder Examination—Questionnaire Version 6 [39]: This 28-item measure is a participant’s self-report form of the clinician-administered Eating Disorder Examination and is used to assess ED symptoms. Participants rate the frequency of eating disorder symptoms using a 7-point Likert scale ranging from “no days” (0) to “every day” (6). The EDE-Q produces a global score, which is calculated as the mean rating across all subscales, with higher scores indicating greater eating disorder psychopathology. The EDE-Q has good reliability, with Cronbach’s alpha of 0.94 for the global score in this study [36].
Short-Form-12 Health Status Questionnaire [40]: General health-related quality of life was assessed using the SF-12, a well-known measure of functional limitations associated with impairment in physical and mental health. This measure produces two subscale scores: the Physical Health Component Scale (PHRQoL) and the Mental Health Component Scale (MHRQoL). Participants rate how often their physical and mental health limits them in various life domains using several rating scales, with higher scores indicating better functioning. The scale is not specific to eating disorders and examines the impact of physical and psychological health on quality of life. Cronbach’s alpha for the scale was 0.89 [36].
Eating Disorder Quality of Life [41]: The EDQoL is a 25-item measure of eating disorder-specific quality of life, comprising four domains distinct from the previous questionnaire: psychological, physical/cognitive, financial, and work/school. Participants answer using a 5-point Likert scale ranging from never (0) to always (4). Mean scores for each scale are calculated, with higher scores representing a poorer quality of life. The scale was specially designed to assess the impact of eating disorder symptoms, and questions are explicitly related to the impact of eating disorder symptomatology on quality of life. Cronbach’s alpha for the global scale was calculated to be 0.93 [36].

2.5. Data Analyses

For this study, independent variables were baseline (T0), 10 week (T1), and early change scores for global EDQoL, psychological EDQoL, cognitive/physical EDQoL, financial EDQoL, work/school EDQoL, MHRQoL, and PHRQoL. Change scores were calculated as the T1 minus T0 ratings. Dependent variables were BMI, EDE-Q Global, EDQoL, MHRQoL, and PHRQoL ratings at the end of treatment (T3).
Data were cleaned, and missing data were corrected for by using maximum likelihood imputation (Hay et al., 2018 [36]). First, descriptive statistics for independent and dependent variables were calculated to assess the distribution of data. Second, Pearson correlational analyses were run to understand the bivariate relationships between variables. Finally, polynomial regression with response surface modelling, as outlined in [42], was utilised to test the early change hypothesis. Polynomial regression provides an alternative to difference scores that preserves the absolute values and allows researchers to understand how varying combinations of two predictor variables relate to an outcome [42,43]. As polynomial regression requires that differences between each predictor variable be meaningful, MHRQoL and PHRQoL subscales were deemed inappropriate for inclusion as predictor variables and were examined as dependent variables (DVs) only. This is because the MHRQoL and PHRQoL subscales of the SF-12 are dependent upon one another, and a change in PHRQoL ratings thus affects the MHRQoL score even if no changes in MHRQoL are reported, reducing the interpretability of differences between the early time points.
If the model explained a significant proportion of the variance in the end-of-treatment outcome variable, response surface modelling [42] was conducted to examine significant effects and visually represent the predicted outcome variable at different configurations of Time 0 (T0) and Time 1 (T1) QoL scores. Response surface modelling produces a visual representation of the polynomial model and coefficient values that test the significance of different levels of agreement and discrepancy between predictor variables as they relate to the outcome variable [42]. See Appendix A, or Shanock at al. [42] for further explanation of this analysis.

3. Results

Descriptive statistics with mean, standard deviation, and maximum and minimum scores are presented in Appendix B.

3.1. Correlations

Correlations between variables are presented in Table 1. There were no significant correlations observed between any early change score and any outcome variable. However, as difference scores combine two variables into one score and lose information relating to the unique effects of each variable, we continued with polynomial regression to investigate how different combinations of T0 and T1 EDQoL ratings related to the outcomes.

3.2. Polynomial Regression

Assumption checks resulted in the financial and work/school subscales being excluded from analysis due to violations of normality and homoscedasticity assumptions required for regression. Multivariate outliers (i.e., Mahalanobis distance > 20.52) for global EDQoL, psychological EDQoL, and cognitive/physical EDQoL change were excluded from the relevant analyses. Multicollinearity assumptions were met, except for squared terms as expected. Polynomial regression analyses were used to determine whether combinations of T0 and T1 EDQoL ratings were significant predictors of BMI, EDE-Q, global EDQoL, MHRQoL, and PHRQoL scores at the end of treatment. As polynomial regression is designed to specifically examine the effect of agreement and discrepancy between two predictor variables on one outcome variable, separate analyses were run [42,43]. Results utilising the global EDQoL, psychological EDQoL, and cognitive/physical EDQoL models are presented in Table 2, Table 3, and Table 4, respectively.

3.2.1. End-of-Treatment BMI and PHRQoL

In contrast to our discrepancy hypothesis, polynomial models using the discrepancy between T0 and T1 scores for global EDQoL, psychological EDQoL, and physical/cognitive EDQoL did not reach significance for either BMI or PHRQoL. As such, response surface analysis was not performed.

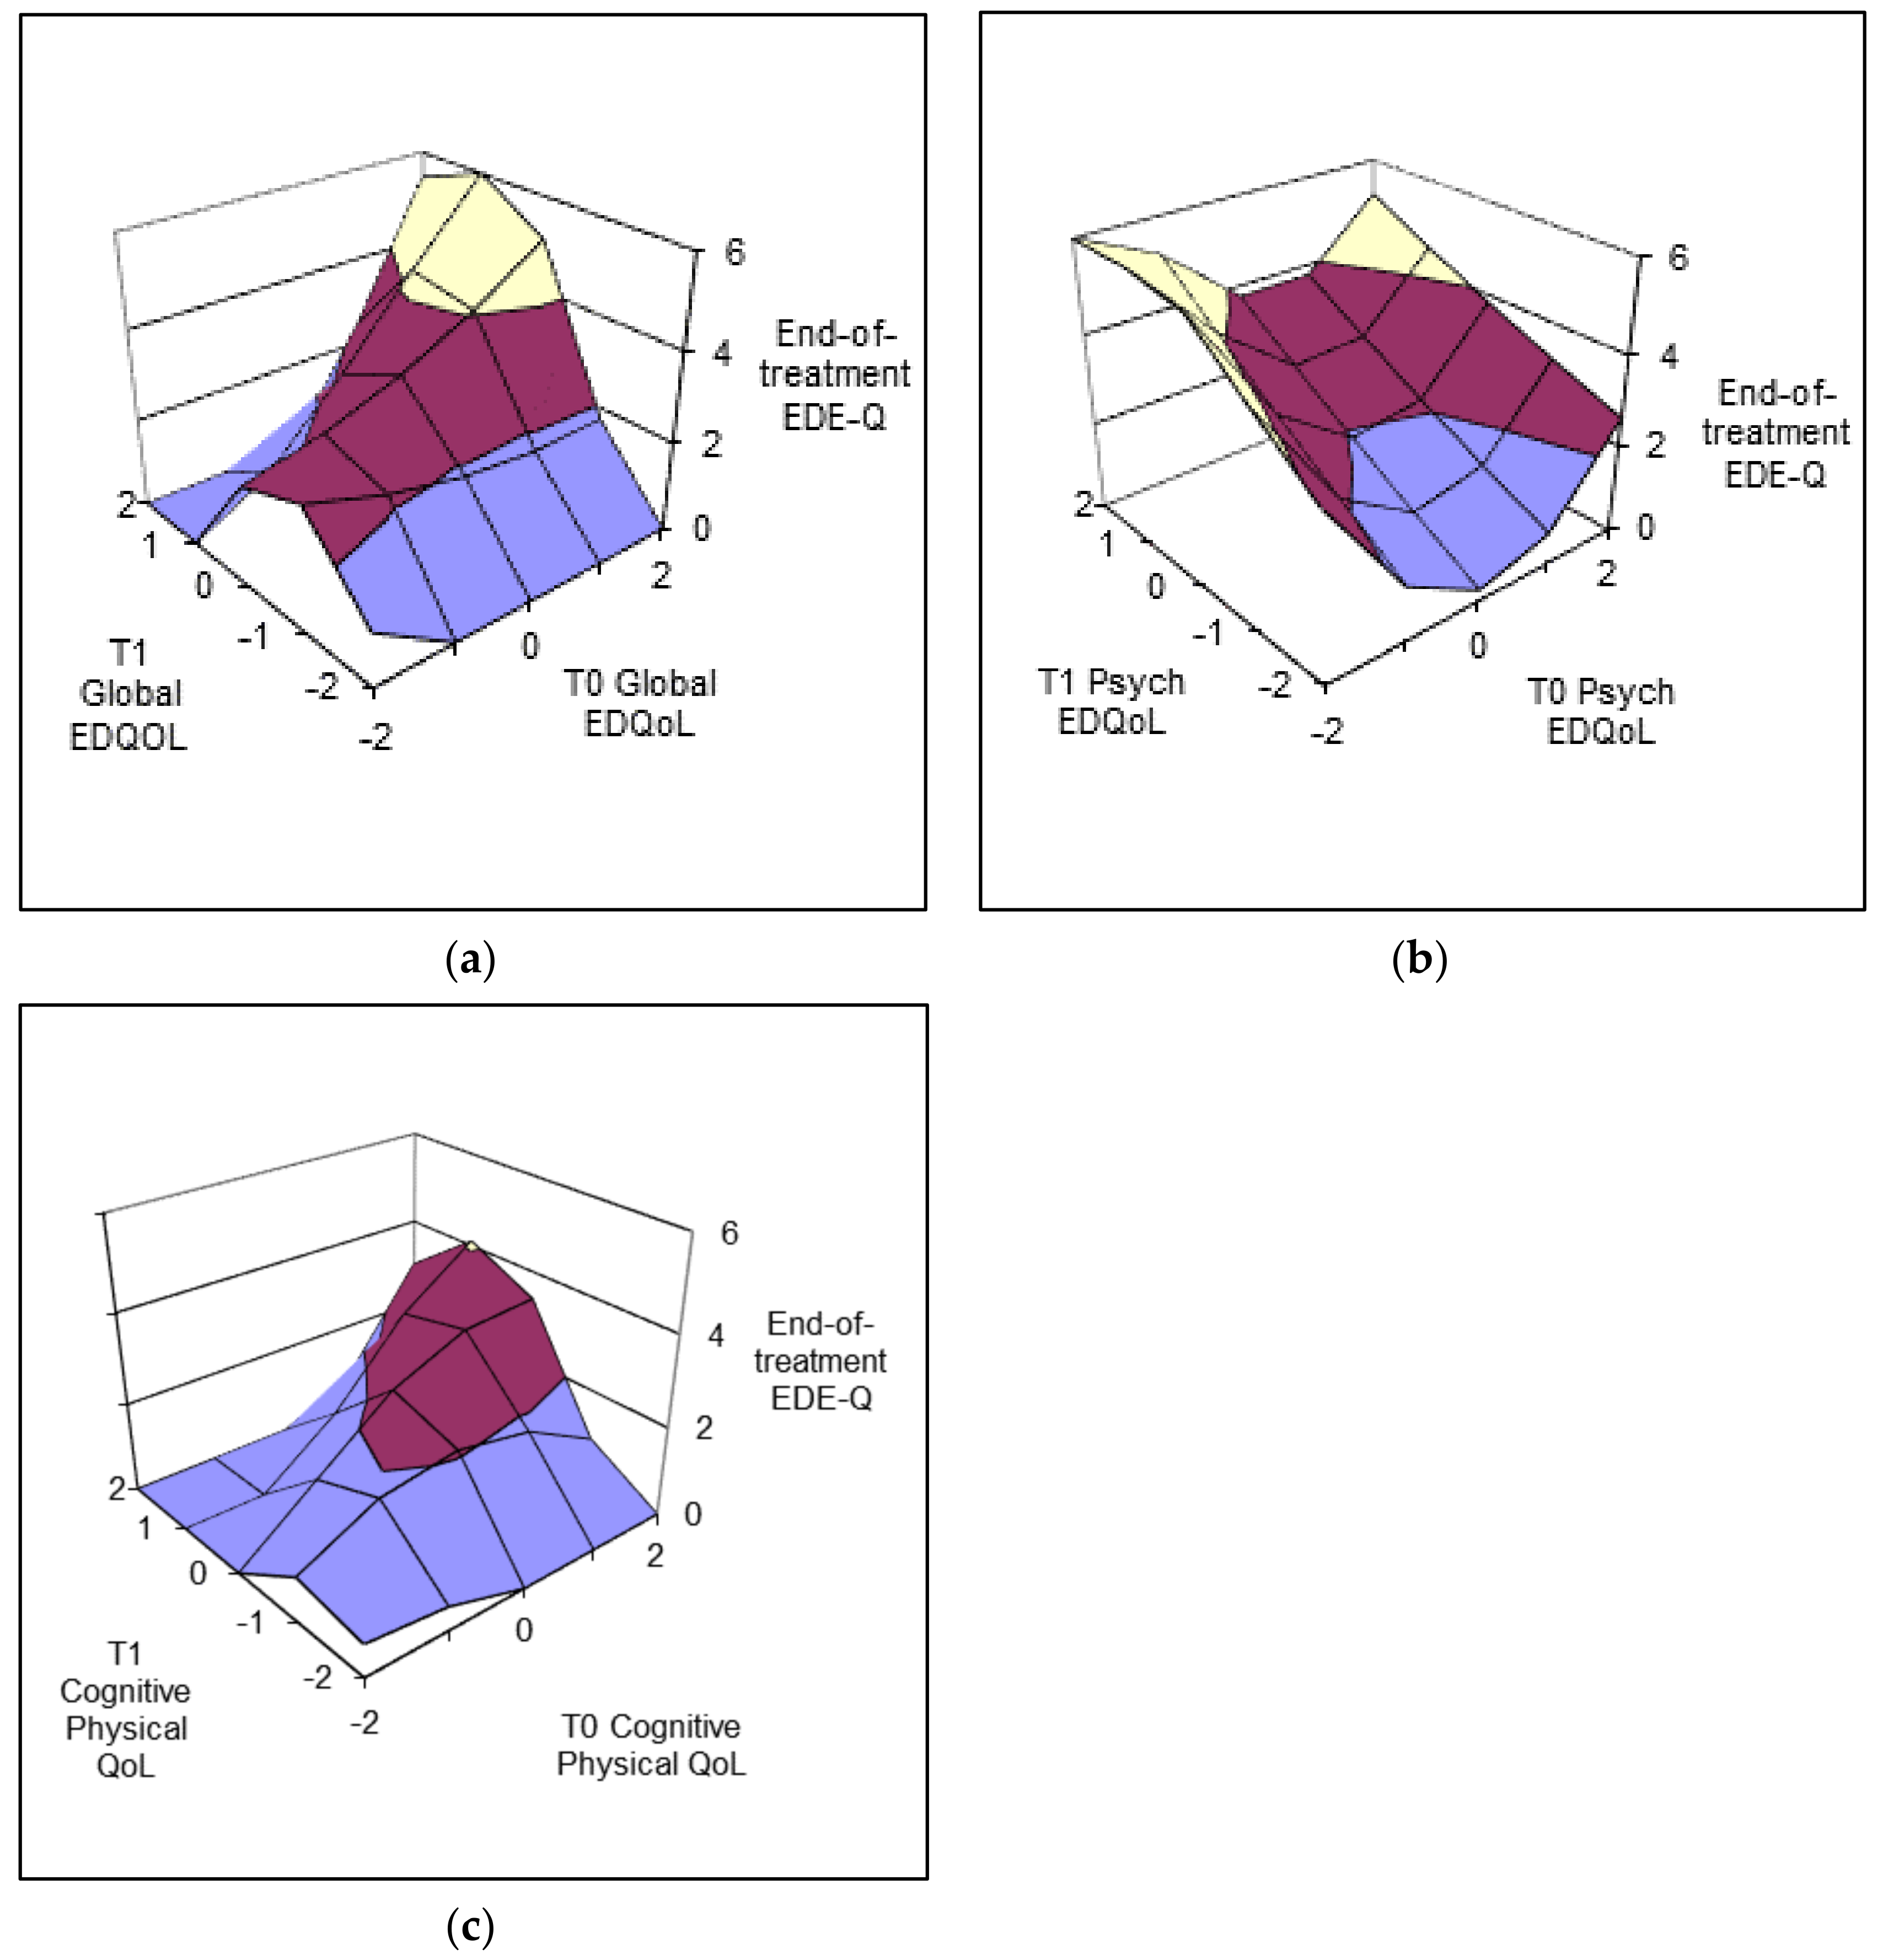
3.2.2. End-of-Treatment EDE-Q—Psychopathology

Polynomial regression models predicting end-of-treatment EDE-Q scores were significant using global EDQoL (R2 = 0.271, F (5, 69) = 5.137, p < 0.001), psychological EDQoL (R2 = 0.381, F (5, 68) = 8.359 p < 0.001), and cognitive/physical EDQoL (R2 = 0.180, F (5, 69) = 3.038, p = 0.015).
In order to examine how the direction and degree of early change in global EDQoL, psychological EDQoL, and cognitive/physical EDQoL relates to end-of-treatment EDE-Q scores, response surface modelling was conducted (Figure 1). Across all three models, there was a common trend, with there being a positive linear trend along the line of agreement (running from the nearest to farthest points on the modes), such that when no change occurs between T0 and T1, greater quality-of-life impairments predict greater psychopathology. This relationship was only statistically significant for the global EDQoL model (a1 = 1.06, p < 0.05).
In contrast to our hypothesis, no significant effects were found along the line of discrepancy for any model of end-of-treatment EDE-Q. Though not significant, the response surface models suggest a possible effect of discrepancy that aligns with the previous literature. For the global and cognitive/physical EDQoL models, the lowest levels of end-of-treatment psychopathology were estimated to occur where the degree of early change in either direction was the greatest (i.e., the far left and far right points of the graph). However, the inverse was seen for the psychological EDQoL model, with greater levels of early change predicting a poorer end-of-treatment EDE-Q. This effect was more pronounced when there was an early decline rather than an early improvement. For the psychological EDQoL subscale, there was an additional significant curvilinear effect along the line of agreement, such that when no change occurred, moderate QoL scores predicted the lowest EDE-Q scores, whilst high and low extremes in QoL ratings predicted higher EDE-Q scores and worse outcomes. Given that the effects along the line of discrepancy were not statistically significant, possibly due to large individual variation noting the high standard error, the results related to early change should be interpreted with caution. However, the differential effect of psychological and physical quality of life has precedent within the literature, with the findings of [20] suggesting that physical QoL ratings may be more impacted by ego-syntonicity and a lack of insight.

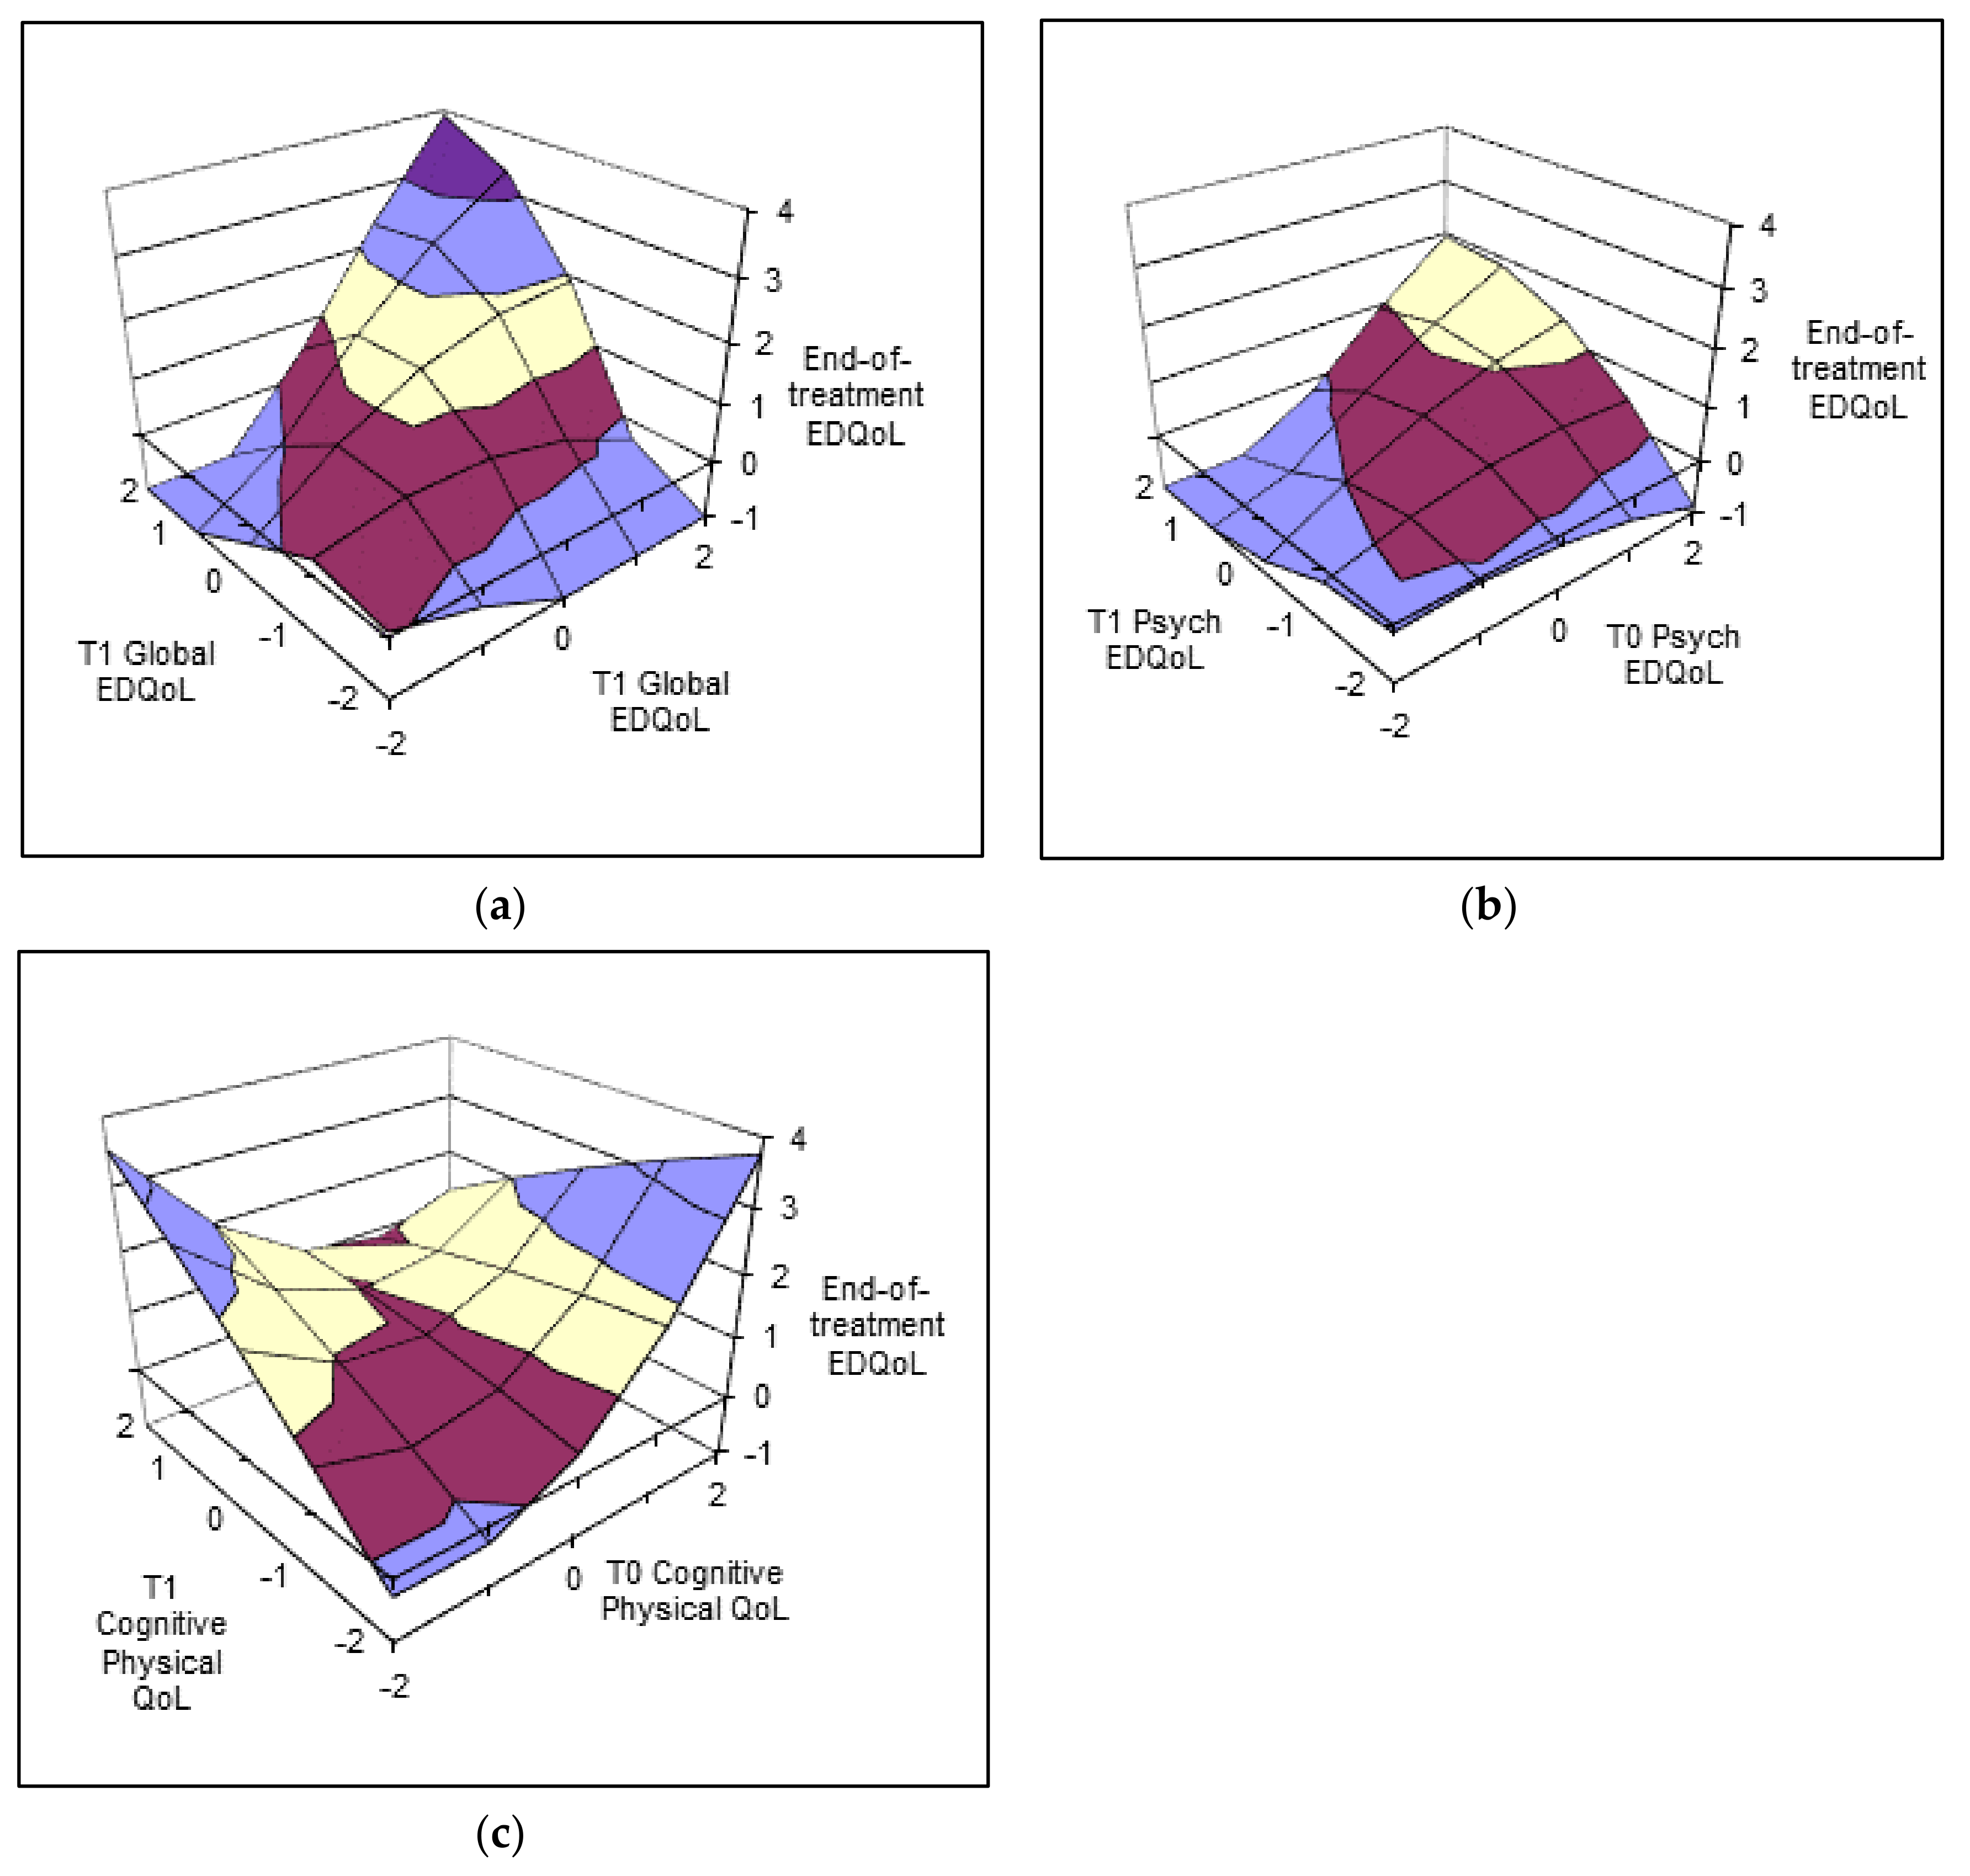
3.2.3. End-of-Treatment EDQoL

In line with correlational findings, polynomial regression models predicting end-of-treatment EDQoL scores were significant when using global EDQoL (R2 = 0.385, F (5, 69) = 8.631, p < 0.001), psychological EDQoL (R2 = 0.356, F (5, 68) = 7.529, p < 0.001), and cognitive/physical EDQoL (R2 = 0.281, F (5, 69) = 5.399, p < 0.001). To examine how the direction and degree of early change relates to end-of-treatment EDQoL scores, response surface modelling was conducted (Figure 2).
For each model, there was a significant linear positive relationship along the line of agreement, such that when no change occurred, higher degrees of impairment at baseline and at the 10-week mark predicted more global EDQoL impairment at the end of treatment. This effect was most pronounced when using the global EDQoL model. Regarding the area of interest, the effect of discrepancy, statistical tests were again non-significant, and the response surfaces should be interpreted with caution. Inverse to the relationships found when predicting end-of-treatment EDE-Q, when predicting end-of-treatment EDQoL the polynomial models estimated that greater degrees of change in psychological EDQoL predicted worse outcomes, whereas a higher cognitive/physical EDQoL change predicted better outcomes.

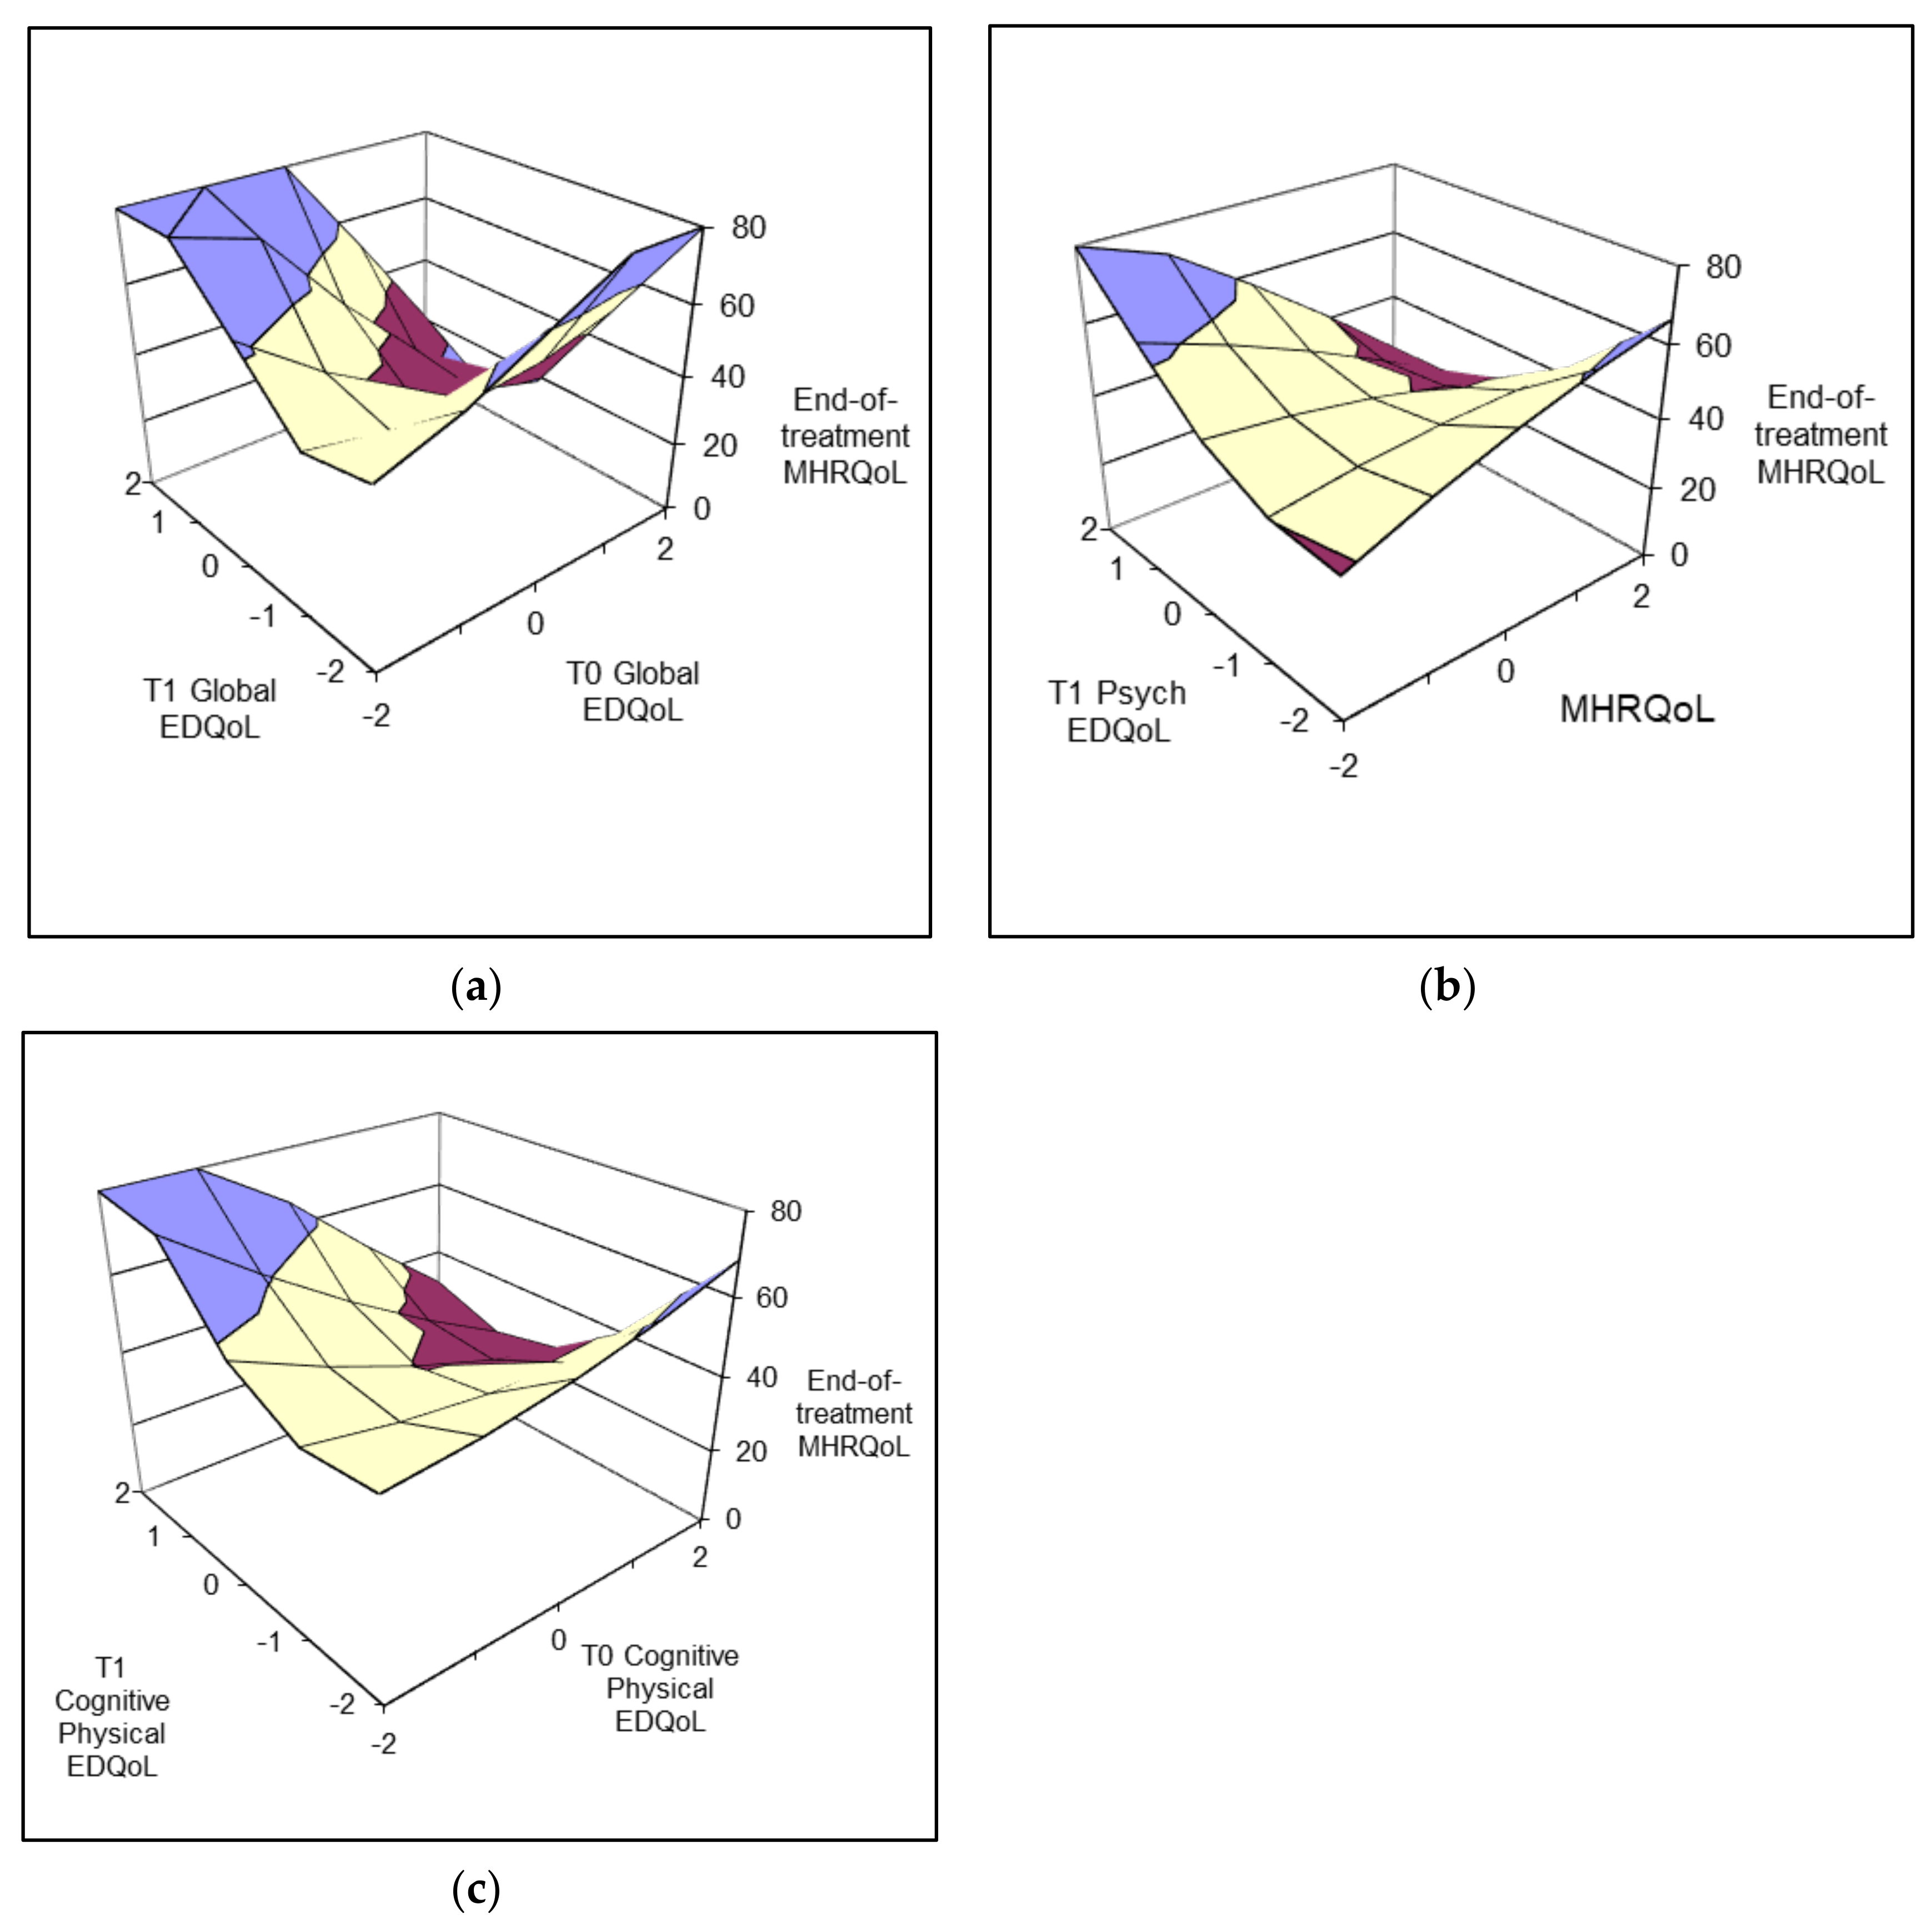
3.2.4. End-of-Treatment MHRQoL

Polynomial regression models predicting end-of-treatment MHRQoL scores were significant using global EDQoL (R2 = 0.349, F (5, 69) = 7.397, p < 0.001), psychological EDQoL (R2 = 0.365, F (5, 68) = 7.802, p < 0.001), and cognitive/physical EDQoL (R2 = 0.265, F (5, 69) = 4.980, p < 0.001).
In order to examine how the direction and degree of early change relates to end-of-treatment MHRQoL scores, response surface modelling was conducted (Figure 3). The global, psychological, and cognitive/physical EDQoL response surface models each demonstrated similar trends. As with models predicting EDE-Q and EDQoL, for each model, there was a linear trend along the line of agreement, such that when no change occurs, higher EDQoL impairment predicts poorer MHRQoL.
In support of our hypothesis, there was a significant curvilinear effect along the line of discrepancy for the global EDQoL, model indicating that greater magnitudes of early change predicted greater end-of-treatment MHRQoL. There was also a significant linear effect along this line, indicating that this effect was more pronounced when EDQoL was reported to worsen between baseline and 10 weeks. Although not statistically significant, a similar trend was observed in the response surfaces modelling the psychological and cognitive/physical EDQoL models of end-of-treatment MHRQoL.

4. Discussion

The overall goal of this study was to clarify the previously untested meanings of early changes in QoL ratings in the treatment of AN. In line with cross-sectional research of the present sample (showing a negative relationship between ED psychopathology such as compulsive exercise and QoL) [37], we expected that early improvement would predict better outcomes in BMI, ED psychopathology, and QoL. Additionally, given theoretical expectations that early QoL ratings are inflated by poor insight and denial, we hypothesised that decreases in QoL may reflect increased insight and, thus, would similarly predict better outcomes. The results indicated partial support, with both early improvement and early worsening in global EDQoL ratings, predicting better end-of-treatment MHRQoL. Surface modelling provided indications of the same pattern existing between global EDQoL early change and end-of-treatment ED psychopathology, but statistical significance was not reached, likely due to underpowered analyses.

4.1. General Health-Related Quality of Life

Correlation analyses indicated that there was no relationship between any general health-related QoL early change scores and end-of-treatment BMI, ED psychopathology, or QoL. This is possibly reflective of the limitation associated with simple difference scores or with the calculation of the SF-12 itself. As difference scores reduce the unique contributions of two variables into a single score, they lose valuable context. For example, a difference score of −0.50 makes no distinction between an individual who began treatment with a high QoL and reduced it to a moderate score and one who began with a slightly low QoL and reduced it even further than that. The SF-12 is further limited by the fact that the two subscales are not scored independently. That is, changes in the ratings of one’s physical health results in a change to the MHRQoL score. As such, despite its common usage within the early change literature, the scale is severely limited in its interpretability when examining change.

4.2. Eating-Disorder-Specific Quality of Life

Correlation analyses did not indicate any relationship between early change in global EDQoL or any subscale and any of the outcomes of BMI, ED psychopathology, and QoL. As stated above, it is possible that this was due to the limiting nature of difference scores. This study was able to overcome this through the use of polynomial regression with response surface analyses and was unique in its application of this analysis to the study of early change.
Early change in global EDQoL was found to predict better outcomes in terms of MHRQoL, regardless of whether the early change was in improvement or worsening. As it is well demonstrated within the literature that higher QoL is related to more positive outcomes [44,45,46], the finding that improved QoL predicts better QoL is not surprising. However, as these earlier studies also demonstrate the inverse, that lower QoL is related to worse outcomes, our finding that early worsening also predicts good outcomes is likely to be mediated by another factor. Given the ego-syntonic nature of AN and the associated impairments in insight, one possible explanation for these results is that individuals who shift from reporting unimpaired QoL to reporting moderate-to-high levels of impairment 10 weeks into treatment did not experience a true decline in QoL. Rather, they developed the insight required to acknowledge their impaired functioning. Although there is scarce research examining the effect of changes in insight on treatment outcomes, the literature shows that preserved insight [47] and awareness of the need for change [20] are each associated with more positive clinical outcomes. This interpretation is further supported by Mond (2005), who urged caution in interpreting self-reported QoL in AN populations due to their finding that individuals with AN reported QoL comparable to control populations despite their objectively poor health [19]. Several studies have further commented on improbably high self-reported QoL by individuals with AN in early stages of treatment [19,48,49,50] and noted that QoL tended to reduce between baseline and 3 months into treatment [50]. Our findings support the literature-wide assumption that self-reports of unimpaired QoL are probably inaccurate. In addition, relationships are complex, and stress had been found to be an important mediator between body dissatisfaction and other eating disorder symptoms [51]. It is thus possible that QoL was adversely impacted by, e.g., the increased stress of the challenges of treatment and change. It remains possible that actual decline in QoL predicts better outcomes, with a possible explanation being that, through the experience of an early decline, individuals experience a heightened awareness of the need for change and are subsequently more motivated during treatment. Taken together, the findings point to the importance of targeting development of insight and motivation to change within treatment.
In addition to the above, our results also indicated preliminary support for our hypothesis that early change in quality of life could be used as a novel predictor of end-of-treatment outcomes of psychopathology. Polynomial regression models showed that global EDQoL, psychological EDQoL, and cognitive/physical EDQoL models predicted 27.1%, 38.1%, and 19% of the variance in end-of-treatment ED psychopathology, respectively. Response surface modelling showed that, for global and cognitive/physical EDQoL, greater degrees of early change in either direction predicted lower psychopathology, whereas a decrease in psychological EDQoL predicted increased psychopathology. While these results should be interpreted with caution, this trend is in line with suggestions in the literature that self-reports of physical QoL may be more strongly influenced by poor insight than psychological QoL ratings [20]. That is, decreases in psychological QoL are more likely to reflect an actual decline in QoL.

4.3. Implications

The main finding from this study, that both early improvement and early worsening in EDQoL predict better MHRQoL at the end of treatment, leads to three key implications for clinical practice. Firstly, these results clarify that the relationship between early-change self-reported quality of life and end-of-treatment outcomes is not linear. While individuals with AN consistently report that quality of life is an important factor within treatment [8,9,10], our results showed that early declines in QoL ratings correlate with better end-of-treatment MHRQoL. Thus, when individuals who present with high self-reported QoL at baseline demonstrate a significant decline in scores at 10 weeks, clinicians may consider this as reflecting an increase in accuracy (and possibly insight) rather than a true deterioration.
Secondly, in light of consistent calls from individuals with AN that QoL is a key and often overlooked aspect of recovery, our findings suggest that early improvement in QoL should be a key target within the first 10 weeks. The efficacy of QoL-focussed treatment for AN has previously been demonstrated by Touyz et al. [52] where CBT-AN and specialist supportive clinical management (SSCM) were modified to prioritise quality of life, with weight gain positioned as a secondary goal [52]. This treatment was successful in achieving significant improvements in both quality of life and in core symptoms of BMI and ED psychopathology, despite not being the core focus. Additionally, the treatment appeared to be successful in combatting the ego-syntonic aspects of AN by focussing on the individuals own sense of wellbeing, resulting in an attrition rate of only 15%, compared to typical rates of 30% [52]. Our results add to this, suggesting that meaningful improvement can be observed within the first 10 weeks of treatment.
Finally, these results provide clinicians with confirmation that early reductions in self-reported QoL did not predict worse outcomes for any end-of-treatment variables. Clinicians should be reassured that an early QoL decline does not signal that treatment is failing and may indicate progress in terms of insight into impairment. However, clinicians should be equally aware that, just as reduced QoL does not represent failure, high QoL at baseline does not always indicate good outcomes. Our results indicate that high QoL may be as much a reason for concern as low QoL. As such, clinicians should be careful to not ignore a patient’s QoL and assume it does not need to be addressed based solely on reports of unimpaired QoL at baseline.

4.4. Limitations

Although the hypothesised effect of change was demonstrated for MHRQoL outcomes, this study was limited by several factors. First, several variables were unable to be analysed using the polynomial regression methodology. The financial and school/work EDQoL subscales were unsuitable due to their non-normal distribution, and the lack of independence between the MHRQoL and PHRQoL subscales restricted the interpretability of change and rendered them similarly unsuitable for analysis. In the future, it may be beneficial to examine the effect of early change in these variables using methodologies of receiver operator characteristic curve (ROC) and area under the curve (AUC) analyses used within the early change literature. Additionally, our post hoc study design meant that we were limited by the existing sample size and unable to perform a priori power analyses. Visual examination of response surface graphs indicates that the regression model estimated that higher degrees of change predicted better end-of-treatment psychopathology and EDQoL with a substantial effect size, but due to high standard error, statistical significance was not reached. As such, it is possible that with a greater sample size, this study may have been able to detect these differences that were approaching significance.
In the future, studies may seek to confirm the hypothesis that increases in insight and/or motivation to change mediate the relationship between early decline in QoL and increased end-of-treatment MHRQoL. Furthermore, these relationships may be bidirectional. Additionally, a replication of this study with a larger sample size is strongly recommended in order to confirm the statistical significance of the demonstrated pattern of results between psychological EDQoL and end-of-treatment ED psychopathology, as well as replication with other, and potentially newly developed, measures of eating-disorder-related quality of life.

5. Conclusions

Overall, this study was successful in providing clarification on the interpretation of early changes in QoL ratings in the treatment of AN and demonstrated that early worsening and early improvement in global EDQoL are equally predictive of better MHRQoL at the end of treatment. We found that the relationships between QoL change and outcomes are non-linear and may be likely to be dependent upon changes in insight. This study highlights the complicated nature of AN and the key role of clinicians in guiding patients through the stages of change and holding strong and patient when clients feel that they are going backwards.

Author Contributions

Conceptualization, E.D.N., L.L., J.C. and P.H.; methodology, E.D.N. and L.L.; software, E.D.N., L.L. and P.H.; validation, E.D.N. and L.L.; formal analysis, E.D.N.; investigation, P.H., S.T., J.A., K.P., S.M. and P.H.; resources, P.H.; data curation, P.H.; writing—original draft preparation, E.D.N.; writing—review and editing, E.D.N., L.L., J.C., S.T., J.A., K.P., S.M. and P.H.; supervision, L.L., J.C. and P.H.; project administration, P.H.; funding acquisition, P.H., S.T., J.A., S.M. and K.P. All authors have read and agreed to the published version of the manuscript.

Funding

This research was funded by NHMRC, grant number PG 634922.

Institutional Review Board Statement

This study was conducted in accordance with the Declaration of Helsinki, and approved by Ethics approvals that were obtained from the Western Sydney University Human Research Ethics Committee (HREC; lead committee), Protocol Approval number H7732; University of Sydney HREC, Protocol Approval number 2012/684; the National Research Ethics Service in the UK, Health Research Authority, Approval number 10/H0406/25; and the Institutional Review Board at Columbia University, Protocol Approval number 1205012397.

Informed Consent Statement

Informed consent was obtained from all subjects involved in the study.

Data Availability Statement

Data are unavailable due to privacy and ethical restrictions.

Conflicts of Interest

PH receives sessional fees and lecture fees from the Australian Medical Council, Therapeutic Guidelines publication and New South Wales Health Education and Training Institute and royalties from Hogrefe and Huber, McGraw Hill Education, and Blackwell Scientific Publications, and she has received research grants from the NHMRC and ARC. She is Chair of the National Eating Disorders Collaboration Steering Committee in Australia (2019-) and was a Member of the ICD-11 Working Group for Eating Disorders (2012–2018) as well as Chair of the Clinical Practice Guidelines Project Working Group (Eating Disorders) of RANZCP (2012–2015). She has prepared a report under contract for Shire Pharmaceuticals (July 2017) and received travel and consulting fees for educational activities from Takeda (formerly Shire). All views in this paper are her own. S.T. receives royalties from Taylor and Francis, Hogrefe and Huber and McGraw Hill for published book chapters. He has received honoraria from Shire/Takeda Group of Companies for chairing the Australian Clinical Advisory Board for Binge Eating Disorder, public speaking engagements, commissioned reports as well as investigator- initiated research grants. He is an Editor in Chief of this journal, an inaugural committee member of the National Eating Disorders Collaboration, a Member of the Technical Advisory Group (TAG) on Eating Disorders (Commonwealth of Australia) and a member of the governing council of the Australian Eating Disorders Research and Translation Centre. All views in this paper are his own. The funders had no role in the design of the study; in the collection, analyses, or interpretation of data; in the writing of the manuscript; or in the decision to publish the results.

Appendix A. Response Surface Modelling

In order to use polynomial regression to examine whether the degree of discrepancy between QoL ratings at T0 and T1 could be used to predict end-of-treatment outcomes, we used one-step polynomial regression models. The polynomial regression terms were entered using the enter method to ensure all variables important to estimating the variance in outcomes were retained. For each early change predictor variable (i.e., global EDQoL, psychological EDQoL, and cognitive/physical EDQoL), the terms entered were Time 0 (b1), Time 1 (b2), Time 0 squared (b3), the cross product of Time 0 and Time 1 (b4), and Time 1 squared (b5). If the model explained a significant proportion of the variance in the end-of-treatment outcome variable, response surface modelling (Shanock et al., [42]) was conducted to examine significant effects and visually represent the predicted outcome variable at different configurations of Time 0 and Time 1 QoL scores. Response surface modelling produces four coefficient values. Surface test values a1 and a2 represent the line of agreement, where Time 0 and Time 1 scores are matched, and no change has occurred. A significant a1 indicates a linear relationship, such that the outcome variables increase as predictor variables increase. A significant a2 indicates a curvilinear relationship. Surface test values a3 and a4 represent the line of discrepancy, where there is a difference between scores at Time 0 and Time 1, and change has occurred. This line indicates how the outcome variables is affected by the direction and degree of change that has occurred. A significant a3 value represents a linear relationship along the line of discrepancy. For example, a positive value here would indicate that ED psychopathology scores increase when Time 0 QoL scores are higher than Time 1 scores. A significant a4 value suggests the existence of a curvilinear relationship, such that the degree of discrepancy, rather than the direction, affects the outcome variable. For the hypothesis in this study that a greater degree of early change in QoL predicts better end-of-treatment outcomes, a significant a4 value and curvilinear effect along the line of discrepancy would be seen. The interpretation of the visual response surface models is summarised as follows. The line of agreement (i.e., where no change occurred between T0 and T1) runs from the nearest (low QoL impairment) to furthest (high QoL impairments) points. The line of discrepancy (i.e., where change occurred between T0 and T1) runs from left to right. The farthest left point represents the greatest decline in QoL (i.e., low impairment at T0 and high impairment at T1), and the far right represents the greatest degree of improvement (i.e., high impairment at T0 and low impairment at T1).

Appendix B. Descriptive Statistics for Study Variables

Table A1. Descriptive statistics for study variables.
MeanSDMinMax
Age27.389.2217.7256.74
T3 BMI17.762.9910.7026.46
T3 EDEQ Global2.711.590.005.75
T3 EDQoL1.050.86−0.953.69
T3 PHRQoL50.8910.1813.1185.86
T3 MHRQoL37.3810.8211.4860.45
EDQoL T01.700.690.163.68
EDQoL T11.510.670.062.71
EDQoL EC−0.180.53−2.341.11
PHRQoL T046.9010.1719.6465.59
PHRQoL T147.3911.0020.7769.39
PHRQoL EC0.498.70−23.0925.89
MHRQoL T029.1111.935.9560.04
MHRQoL T132.7111.5511.2963.40
MHRQoL EC3.6010.02−18.8941.21
Psychological T02.750.880.134.00
Psychological T12.350.840.224.00
Psychological EC−0.400.83−3.781.56
Physical/cognitive T02.470.840.174.00
Physical/cognitive T12.040.840.003.67
Physical/cognitive EC−0.440.73−4.001.00
Financial T00.660.870.004.00
Financial T10.450.610.003.40
Financial EC−0.210.82−3.551.60
School/work T00.891.000.004.00
School/work T10.760.790.003.40
School/work EC−0.130.86−3.202.80
n = 78

References

  1. American Psychiatric Association. Diagnostic and Statistical Manual of Mental Disorders (DSM-5®); American Psychiatric Publishing: Washington, DC, USA, 2013. [Google Scholar]
  2. van den Berg, E.; Houtzager, L.; de Vos, J.; Daemen, I.; Katsaragaki, G.; Karyotaki, E.; Cuijpers, P.; Dekker, J. Meta-analysis on the efficacy of psychological treatments for anorexia nervosa. Eur. Eat. Disord. Rev. 2019, 27, 331–351. [Google Scholar] [CrossRef]
  3. Steinhausen, H.-C. The Outcome of Anorexia Nervosa in the 20th Century. Am. J. Psychiatry 2002, 159, 1284–1293. [Google Scholar] [CrossRef]
  4. Dobrescu, S.R.; Dinkler, L.; Gillberg, C.; Råstam, M.; Gillberg, C.; Wentz, E. Anorexia nervosa: 30-year outcome. Br. J. Psychiatry 2020, 216, 97–104. [Google Scholar] [CrossRef]
  5. Eddy, K.T.; Tabri, N.; Thomas, J.J.; Murray, H.B.; Keshaviah, A.; Hastings, E.; Edkins, K.; Krishna, M.; Herzog, D.B.; Keel, P.K.; et al. Recovery From Anorexia Nervosa and Bulimia Nervosa at 22-Year Follow-Up. J. Clin. Psychiatry 2017, 78, 184–189. [Google Scholar] [CrossRef]
  6. Wonderlich, S.A.; Bulik, C.M.; Schmidt, U.; Steiger, H.; Hoek, H.W. Severe and enduring anorexia nervosa: Update and observations about the current clinical reality. Int. J. Eat. Disord. 2020, 53, 1303–1312. [Google Scholar] [CrossRef]
  7. Bardone-Cone, A.M.; Hunt, R.A.; Watson, H.J. An overview of conceptualizations of eating disorder recovery, recent findings, and future directions. Curr. Psychiatry Rep. 2018, 20, 79. [Google Scholar] [CrossRef]
  8. Conti, J.E. Recovering identity from anorexia nervosa: Women’s constructions of their experiences of recovery from anorexia nervosa over 10 years. J. Constr. Psychol. 2018, 31, 72–94. [Google Scholar] [CrossRef]
  9. Federici, A.; Kaplan, A.S. The patient’s account of relapse and recovery in anorexia nervosa: A qualitative study. European Eating Disorders Review: Prof. J. Eat. Disord. Assoc. 2008, 16, 1–10. [Google Scholar] [CrossRef]
  10. Jenkins, J.; Ogden, J. Becoming ‘whole’ again: A qualitative study of women’s views of recovering from anorexia nervosa. Eur. Eat. Disord. Rev. 2012, 20, e23–e31. [Google Scholar] [CrossRef]
  11. Mitchison, D.; Hay, P.; Mond, J.; Slewa-Younan, S. Self-reported history of anorexia nervosa and current quality of life: Findings from a community-based study. Qual. Life Res. 2013, 22, 273–281. [Google Scholar] [CrossRef]
  12. Mitchison, D.; Morin, A.; Mond, J.; Slewa-Younan, S.; Hay, P. The Bidirectional Relationship between Quality of Life and Eating Disorder Symptoms: A 9-Year Community-Based Study of Australian Women. PLoS ONE 2015, 10, e0120591. [Google Scholar] [CrossRef]
  13. McIntosh, V.V.; Jordan, J.; Carter, F.A.; Luty, S.E.; McKenzie, J.M.; Bulik, C.M.; Frampton, C.M.; Joyce, P.R. Three Psychotherapies for Anorexia Nervosa: A Randomized, Controlled Trial. Am. J. Psychiatry 2005, 162, 741–747. [Google Scholar] [CrossRef]
  14. McIntosh, V.V.W.; Jordan, J.; Luty, S.E.; Carter, F.A.; McKenzie, J.M.; Bulik, C.M.; Joyce, P.R. Specialist supportive clinical management for anorexia nervosa. Int. J. Eat. Disord. 2006, 39, 625–632. [Google Scholar] [CrossRef]
  15. Williams, K.D.; Dobney, T.; Geller, J. Setting the eating disorder aside: An alternative model of care. Eur. Eat. Disord. Rev. 2010, 18, 90–96. [Google Scholar] [CrossRef]
  16. Nordbø, R.H.S.; Espeset, E.M.S.; Gulliksen, K.S.; Skårderud, F.; Geller, J.; Holte, A. Reluctance to recover in anorexia nervosa. Eur. Eat. Disord. Rev. 2012, 20, 60–67. [Google Scholar] [CrossRef]
  17. Hay, P.; Chinn, D.; Forbes, D.; Madden, S.; Newton, R.; Sugenor, L.; Touyz, S.; Ward, W. Royal Australian and New Zealand College of Psychiatrists clinical practice guidelines for the treatment of eating disorders. Aust. N. Z. J. Psychiatry 2014, 48, 977–1008. [Google Scholar] [CrossRef]
  18. Wonderlich, S.; Mitchell, J.E.; Crosby, R.D.; Myers, T.C.; Kadlec, K.; LaHaise, K.; Swan-Kremeier, L.; Dokken, J.; Lange, M.; Dinkel, J.; et al. Minimizing and treating chronicity in the eating disorders: A clinical overview. Int. J. Eat. Disord. 2012, 45, 467–475. [Google Scholar] [CrossRef]
  19. Mond, J.M.; Owen, C.; Hay, P.J.; Rodgers, B.; Beumont, P.J.V. Assessing quality of life in eating disorder patients. Qual. Life Res. 2005, 14, 171–178. [Google Scholar] [CrossRef]
  20. McHugh, M.D. Readiness for change and short-term outcomes of female adolescents in residential treatment for anorexia nervosa. Int. J. Eat. Disord. 2007, 40, 602–612. [Google Scholar] [CrossRef]
  21. Grilo, C.M.; Masheb, R.M.; Wilson, G.T. Rapid response to treatment for binge eating disorder. J. Consult. Clin. Psychol. 2006, 74, 602–613. [Google Scholar] [CrossRef]
  22. Grilo, C.M.; White, M.A.; Wilson, G.T.; Gueorguieva, R.; Masheb, R.M. Rapid response predicts 12-month post-treatment outcomes in binge-eating disorder: Theoretical and clinical implications. Psychol. Med. 2012, 42, 807–817. [Google Scholar] [CrossRef]
  23. Masheb, R.M.; Grilo, C.M. Rapid response predicts treatment outcomes in binge eating disorder: Implications for stepped care. J. Consult. Clin. Psychol. 2007, 75, 639–644. [Google Scholar] [CrossRef]
  24. Isserlin, L.; Spettigue, W.; Norris, M.; Couturier, J. Outcomes of inpatient psychological treatments for children and adolescents with eating disorders at time of discharge: A systematic review. J. Eat. Disord. 2020, 8, 32. [Google Scholar] [CrossRef]
  25. Chang, P.G.R.Y.; Delgadillo, J.; Waller, G. Early response to psychological treatment for eating disorders: A systematic review and meta-analysis. Clin. Psychol. Rev. 2021, 86, 102032. [Google Scholar] [CrossRef]
  26. Linardon, J.; Brennan, L.; De La Piedad Garcia, X. Rapid response to eating disorder treatment: A systematic review and meta-analysis. Int. J. Eat. Disord. 2016, 49, 905–919. [Google Scholar] [CrossRef]
  27. Nazar, B.P.; Gregor, L.K.; Albano, G.; Marchica, A.; Coco, G.L.; Cardi, V.; Treasure, J. Early Response to treatment in Eating Disorders: A Systematic Review and a Diagnostic Test Accuracy Meta-Analysis. Eur. Eat. Disord. Rev. 2017, 25, 67–79. [Google Scholar] [CrossRef]
  28. Vall, E.; Wade, T.D. Predictors of treatment outcome in individuals with eating disorders: A systematic review and meta-analysis. Int. J. Eat. Disord. 2015, 48, 946–971. [Google Scholar] [CrossRef]
  29. Pellizzer, M.L.; Waller, G.; Wade, T.D. Predictors of outcome in cognitive behavioural therapy for eating disorders: An exploratory study. Behav. Res. Ther. 2019, 116, 61–68. [Google Scholar] [CrossRef]
  30. Kelly, A.C.; Carter, J.C.; Borairi, S. Are improvements in shame and self-compassion early in eating disorders treatment associated with better patient outcomes? Int. J. Eat. Disord. 2014, 47, 54–64. [Google Scholar] [CrossRef]
  31. Thompson-Brenner, H.; Shingleton, R.M.; Sauer-Zavala, S.; Richards, L.K.; Pratt, E.M. Multiple measures of rapid response as predictors of remission in cognitive behavior therapy for bulimia nervosa. Behav. Res. Ther. 2015, 64, 9–14. [Google Scholar] [CrossRef]
  32. Kahn, M.; Brunstein-Klomek, A.; Hadas, A.; Snir, A.; Fennig, S. Early changes in depression predict outcomes of inpatient adolescent anorexia nervosa. Eat. Weight. Disord. Stud. Anorex. Bulim. Obesity 2020, 25, 777–785. [Google Scholar] [CrossRef]
  33. Macdonald, D.E.; Trottier, K. Rapid improvements in emotion regulation predict eating disorder psychopathology and functional impairment at 6-month follow-up in individuals with bulimia nervosa and purging disorder. Int. J. Eat. Disord. 2019, 52, 962–967. [Google Scholar] [CrossRef]
  34. Reilly, E.E.; Perry, T.R.; Brown, T.A.; Wierenga, C.E.; Kaye, W.H. Intolerance of Uncertainty and Eating Disorder Symptoms Over the Course of Intensive Treatment. Behav. Ther. 2020, 52, 698–708. [Google Scholar] [CrossRef]
  35. Tecuta, L.; Tomba, E. Subjective incompetence as a predictor of treatment outcomes in eating disorder outpatients. Psychiatry Res. 2018, 266, 193–198. [Google Scholar] [CrossRef]
  36. Hay, P.; Touyz, S.; Arcelus, J.; Pike, K.; Attia, E.; Crosby, R.D.; Madden, S.; Wales, J.; La Puma, M.; Heriseanu, A.I.; et al. A randomized controlled trial of the compuLsive Exercise Activity TheraPy (LEAP): A new approach to compulsive exercise in anorexia nervosa. Int. J. Eat. Disord. 2018, 51, 999–1004. [Google Scholar] [CrossRef]
  37. Young, S.; Touyz, S.; Meyer, C.; Arcelus, J.; Rhodes, P.; Madden, S.; Pike, K.; Attia, E.; Crosby, R.D.; Hay, P. Relationships between compulsive exercise, quality of life, psychological distress and motivation to change in adults with anorexia nervosa. J. Eat. Disord. 2018, 6, 2. [Google Scholar] [CrossRef]
  38. Pike, K.M.; Walsh, B.T.; Vitousek, K.; Wilson, G.T.; Bauer, J. Cognitive behavior therapy in the posthospitalization treatment of anorexia nervosa. Am. J. Psychiatry 2003, 160, 2046–2049. [Google Scholar] [CrossRef]
  39. Fairburn, C.G.; Beglin, S.J. Assessment of eating disorders: Interview or self-report questionnaire? Int. J. Eat. Disord. 1994, 16, 363–370. [Google Scholar] [CrossRef]
  40. Ware, J.E.; Kosinski, M.; Keller, S.D. A 12-Item Short-Form Health Survey: Construction of scales and preliminary tests of reliability and validity. Med. Care 1996, 34, 220–233. [Google Scholar] [CrossRef]
  41. Engel, S.G.; Wittrock, D.A.; Crosby, R.D.; Wonderlich, S.A.; Mitchell, J.E.; Kolotkin, R.L. Development and psychometric validation of an eating disorder-specific health-related quality of life instrument. Int. J. Eat. Disord. 2006, 39, 62–71. [Google Scholar] [CrossRef]
  42. Shanock, L.R.; Baran, B.E.; Gentry, W.A.; Pattison, S.C.; Heggestad, E.D. Polynomial regression with response surface analysis: A powerful approach for examining moderation and overcoming limitations of difference scores. J. Bus. Psychol. 2010, 25, 543–554. [Google Scholar] [CrossRef]
  43. Edwards, J.R.; Parry, M.E. On the use of polynomial regression equations as an alternative to difference scores in organizational research. Acad. Manag. J. 1993, 36, 1577–1613. [Google Scholar] [CrossRef]
  44. Padierna, A.; Quintana, J.M.; Arostegui, I.; Gonzalez, N.; Horcajo, M.J. The health-related quality of life in eating disorders. Qual. Life Res. 2000, 9, 667–674. [Google Scholar] [CrossRef]
  45. Bamford, B.; Sly, R. Exploring quality of life in the eating disorders. Eur. Eat. Disord. Rev. 2010, 18, 147–153. [Google Scholar] [CrossRef] [PubMed]
  46. Weigel, A.; König, H.-H.; Gumz, A.; Löwe, B.; Brettschneider, C. Correlates of health related quality of life in anorexia nervosa. Int. J. Eat. Disord. 2016, 49, 630–634. [Google Scholar] [CrossRef] [PubMed]
  47. Errichiello, L.; Iodice, D.; Bruzzese, D.; Gherghi, M.; Senatore, I. Prognostic factors and outcome in anorexia nervosa: A follow-up study. Eat. Weight. Disord.-Stud. Anorex. Bulim. Obes. 2016, 21, 73–82. [Google Scholar] [CrossRef] [PubMed]
  48. Padierna, A.; Quintana, J.; Arostegui, I.; Gonzalez, N.; Horcajo, M. Changes in health related quality of life among patients treated for eating disorders. Qual. Life Res. 2002, 11, 545–552. [Google Scholar] [CrossRef] [PubMed]
  49. Doll, H.A.; Petersen, S.E.; Stewart-Brown, S.L. Eating disorders and emotional and physical well-being: Associations between student self-reports of eating disorders and quality of life as measured by the SF-36. Qual. Life Res. 2005, 14, 705–717. [Google Scholar] [CrossRef] [PubMed]
  50. Adair, C.E.; Marcoux, G.C.; Cram, B.S.; Ewashen, C.J.; Chafe, J.; Cassin, S.E.; Pinzon, J.; Gusella, J.L.; Geller, J.; Scattolon, Y.; et al. Development and multi-site validation of a new condition-specific quality of life measure for eating disorders. Health Qual. Life Outcomes 2007, 5, 23. [Google Scholar] [CrossRef] [PubMed]
  51. Castellano, S.; Rizzotto, A.; Neri, S.; Currenti, W.; Guerrera, C.S.; Pirrone, C.; Coco, M.; Di Corrado, D. The Relationship between Body Dissatisfaction and Eating Disorder Symptoms in Young Women Aspiring Fashion Models: The Mediating Role of Stress. Eur. J. Investig. Health Psychol. Educ. 2021, 11, 607–615. [Google Scholar] [CrossRef]
  52. Touyz, S.; Le Grange, D.; Lacey, H.; Hay, P.; Smith, R.; Maguire, S.; Bamford, B.; Pike, K.M.; Crosby, R.D. Treating severe and enduring anorexia nervosa: A randomized controlled trial. Psychol. Med. 2013, 43, 2501–2511. [Google Scholar] [CrossRef] [PubMed]
Figure 1. Response surface models demonstrating expected end-of-treatment EDE-Q scores (z axis; vertical), at varying combinations of baseline (x-axis; right side) and 10-week (y-axis; left side) self-reports: (a) global EDQoL; (b) psychological EDQoL; (c) cognitive/physical EDQoL. Colour added to assist with readability of response surface.
Psych 06 00018 g001
Figure 2. Response surface models demonstrating expected end-of-treatment global EDQoL (z axis; vertical), at varying combinations of baseline (x-axis; right side) and 10-week (y-axis; left side) self-reports: (a) global EDQoL; (b) psychological EDQoL; (c) cognitive/physical EDQoL. Colour added to assist with readability of response surface.
Psych 06 00018 g002
Figure 3. Response surface models demonstrating expected end-of-treatment MHRQoL (z axis; vertical) at varying combinations of baseline (x-axis; right side) and 10-week (y-axis; left side) self-reports: (a) global EDQoL; (b) psychological EDQoL; (c) cognitive/physical EDQoL. Colour added to assist with readability of response surface.
Psych 06 00018 g003
Table 1. Pearson correlations between quality of life and end-of-treatment outcomes.
VariablesBMI T3EDEQ−0Global T3EDQoL T3MHRQoL T3PHRQoL T3
MHRQoL EC−0.204−0.1760.032−0.047−0.139
PHRQoL EC0.1580.279−0.028−0.1220.141
EDQoL EC0.0200.0410.0260.116−0.010
Psychological EC0.177−0.019−0.1710.221−0.084
Physical/cognitive EC0.096−0.184−0.2020.207−0.106
Financial EC0.011−0.1010.0380.1800.026
School/work EC0.076−0.078−0.1710.2030.154
EC = Early Change; Note: There were no correlations that reached statistical significance of p < 0.05.
Table 2. Polynomial regression analysis and response surface modelling for T0 and T1 global EDQoL as predictors of end-of-treatment outcomes.
BMIEDE-QEDQoLMHRQoLPHRQoL
b (se)b (se)b (se)b (se)b (se)
Constant17.38 (0.48)3.25 (0.23)1.38 (0.11)33.58 (1.51)49.78 (1.73)
b1: T00.03 (0.93)0.72 (0.46)0.56 (0.22)−11.18 (3.01)0.41 (3.32)
b2: T1−0.98 (1.03)0.34 (0.50)0.39 (0.24)3.89 (3.23)−1.59 (3.69)
b3: T02−0.86 (0.96) 0.10 (0.48)0.15 (0.23)1.77 (3.10)−3.39 (3.43)
b4: T0 × T10.05 (2.09)0.98 (1.01)0.72 (0.49)−12.13 (6.60)0.27 (7.50)
b5: T120.69 (1.33)−1.06 (0.64)−0.42 (.31)10.80 (4.18)3.31 (4.76)
R20.0950.271 **0.385 ** 0.349 ** 0.066
Response surface modelling coefficients
a1-1.06 *0.95 *−7.29 **-
a2- 0.02 0.15 0.44 -
a3- 0.37 0.18 −15.07 **-
a4- −1.94 −1.29 24.70 **-
Note: b = unstandardized beta coefficient; se = standard error of unstandardized beta coefficient; R2 = r-squared value. * p < 0.05; ** p < 0.01.
Table 3. Polynomial regression analysis and response surface modelling for T0 and T1 psychological EDQoL as predictors of end-of-treatment outcomes.
BMIEDE-QEDQoLMHRQoLPHRQoL
b (se)b (se)b (se)b (se)b (se)
Constant18.14 (0.52)1.91 (0.24)0.61 (0.13)42.54 (1.64)52.51 (1.75)
b1: T0−2.11 (0.97)−0.49 (0.44)0.53 (0.24)−4.26 (3.07)4.67 (3.27)
b2: T1 1.13 (0.76)0.88 (0.35)−0.01 (0.19)0.47 (2.42)−4.75 (2.58)
b3: T02 1.10 (0.68)0.72 (0.31)−0.08 (0.17)−0.63 (2.17)−3.64 (2.31)
b4: T0 × T1−1.73 (1.06)−0.12 (0.49)0.36 (0.26)−5.64 (3.38)3.85 (3.59)
b5: T12 1.06 (0.63)0.02 (0.29)−0.21 (0.16)3.36 (2.00)−1.68 (2.13)
R20.1080.381 **0.356 **0.365 **0.071
Response surface modelling coefficients
a1-0.390.51 *−3.79-
a2-0.63 *0.07−2.90-
a3-−1.370.54−4.73-
a4-0.86−0.648.37-
Note: b = unstandardized beta coefficient; se = standard error of unstandardized beta coefficient; R2 = r-squared value. * p < 0.05; ** p < 0.01.
Table 4. Polynomial regression analysis and response surface modelling for T0 and T1 cognitive/physical EDQoL as predictors of end-of-treatment outcomes.
BMIEDE-QEDQoLMHRQoLPHRQoL
b (se)b (se)b (se)b (se)b (se)
Constant18.23 (0.53)2.57 (0.27)0.83 (0.14)39.53 (1.74)52.82 (1.81)
b1: T00.39 (0.92)0.99 (0.46)0.22 (0.24)−7.37 (3.01)2.43 (3.14)
b2: T1 −1.14 (0.86)−0.43 (0.43)0.17 (0.22)2.39 (2.82)−6.03 (2.94)
b3: T02 −1.38 (0.75)−0.29 (0.38)0.34 (0.19)0.78 (2.47)−3.79 (2.57)
b4: T0 × T11.74 (1.46)1.02 (0.74)−0.39 (0.38)−5.96 (4.78)6.87 (4.99)
b5: T12 −0.29 (0.99)−0.91 (0.50)−0.03 (0.26)5.44 (3.24)−4.41 (3.38)
R21290.180 *0.281 **0.265 **0.112
Response surface modelling coefficients
a1-0.560.39 *−4.98 *-
a2-−0.18−0.080.26-
a3-1.420.06−9.76-
a4-−2.210.7012.18-
Note: b = unstandardized beta coefficient; se = standard error of unstandardized beta coefficient; R2 = r-squared value. * p < 0.05; ** p < 0.01.
Disclaimer/Publisher’s Note: The statements, opinions and data contained in all publications are solely those of the individual author(s) and contributor(s) and not of MDPI and/or the editor(s). MDPI and/or the editor(s) disclaim responsibility for any injury to people or property resulting from any ideas, methods, instructions or products referred to in the content.

