Differential Item Functioning on Raven’s SPM+ Amongst Two Convenience Samples of Yakuts and Russians


Abstract
1. Introduction
2. Materials and Methods
3. Results
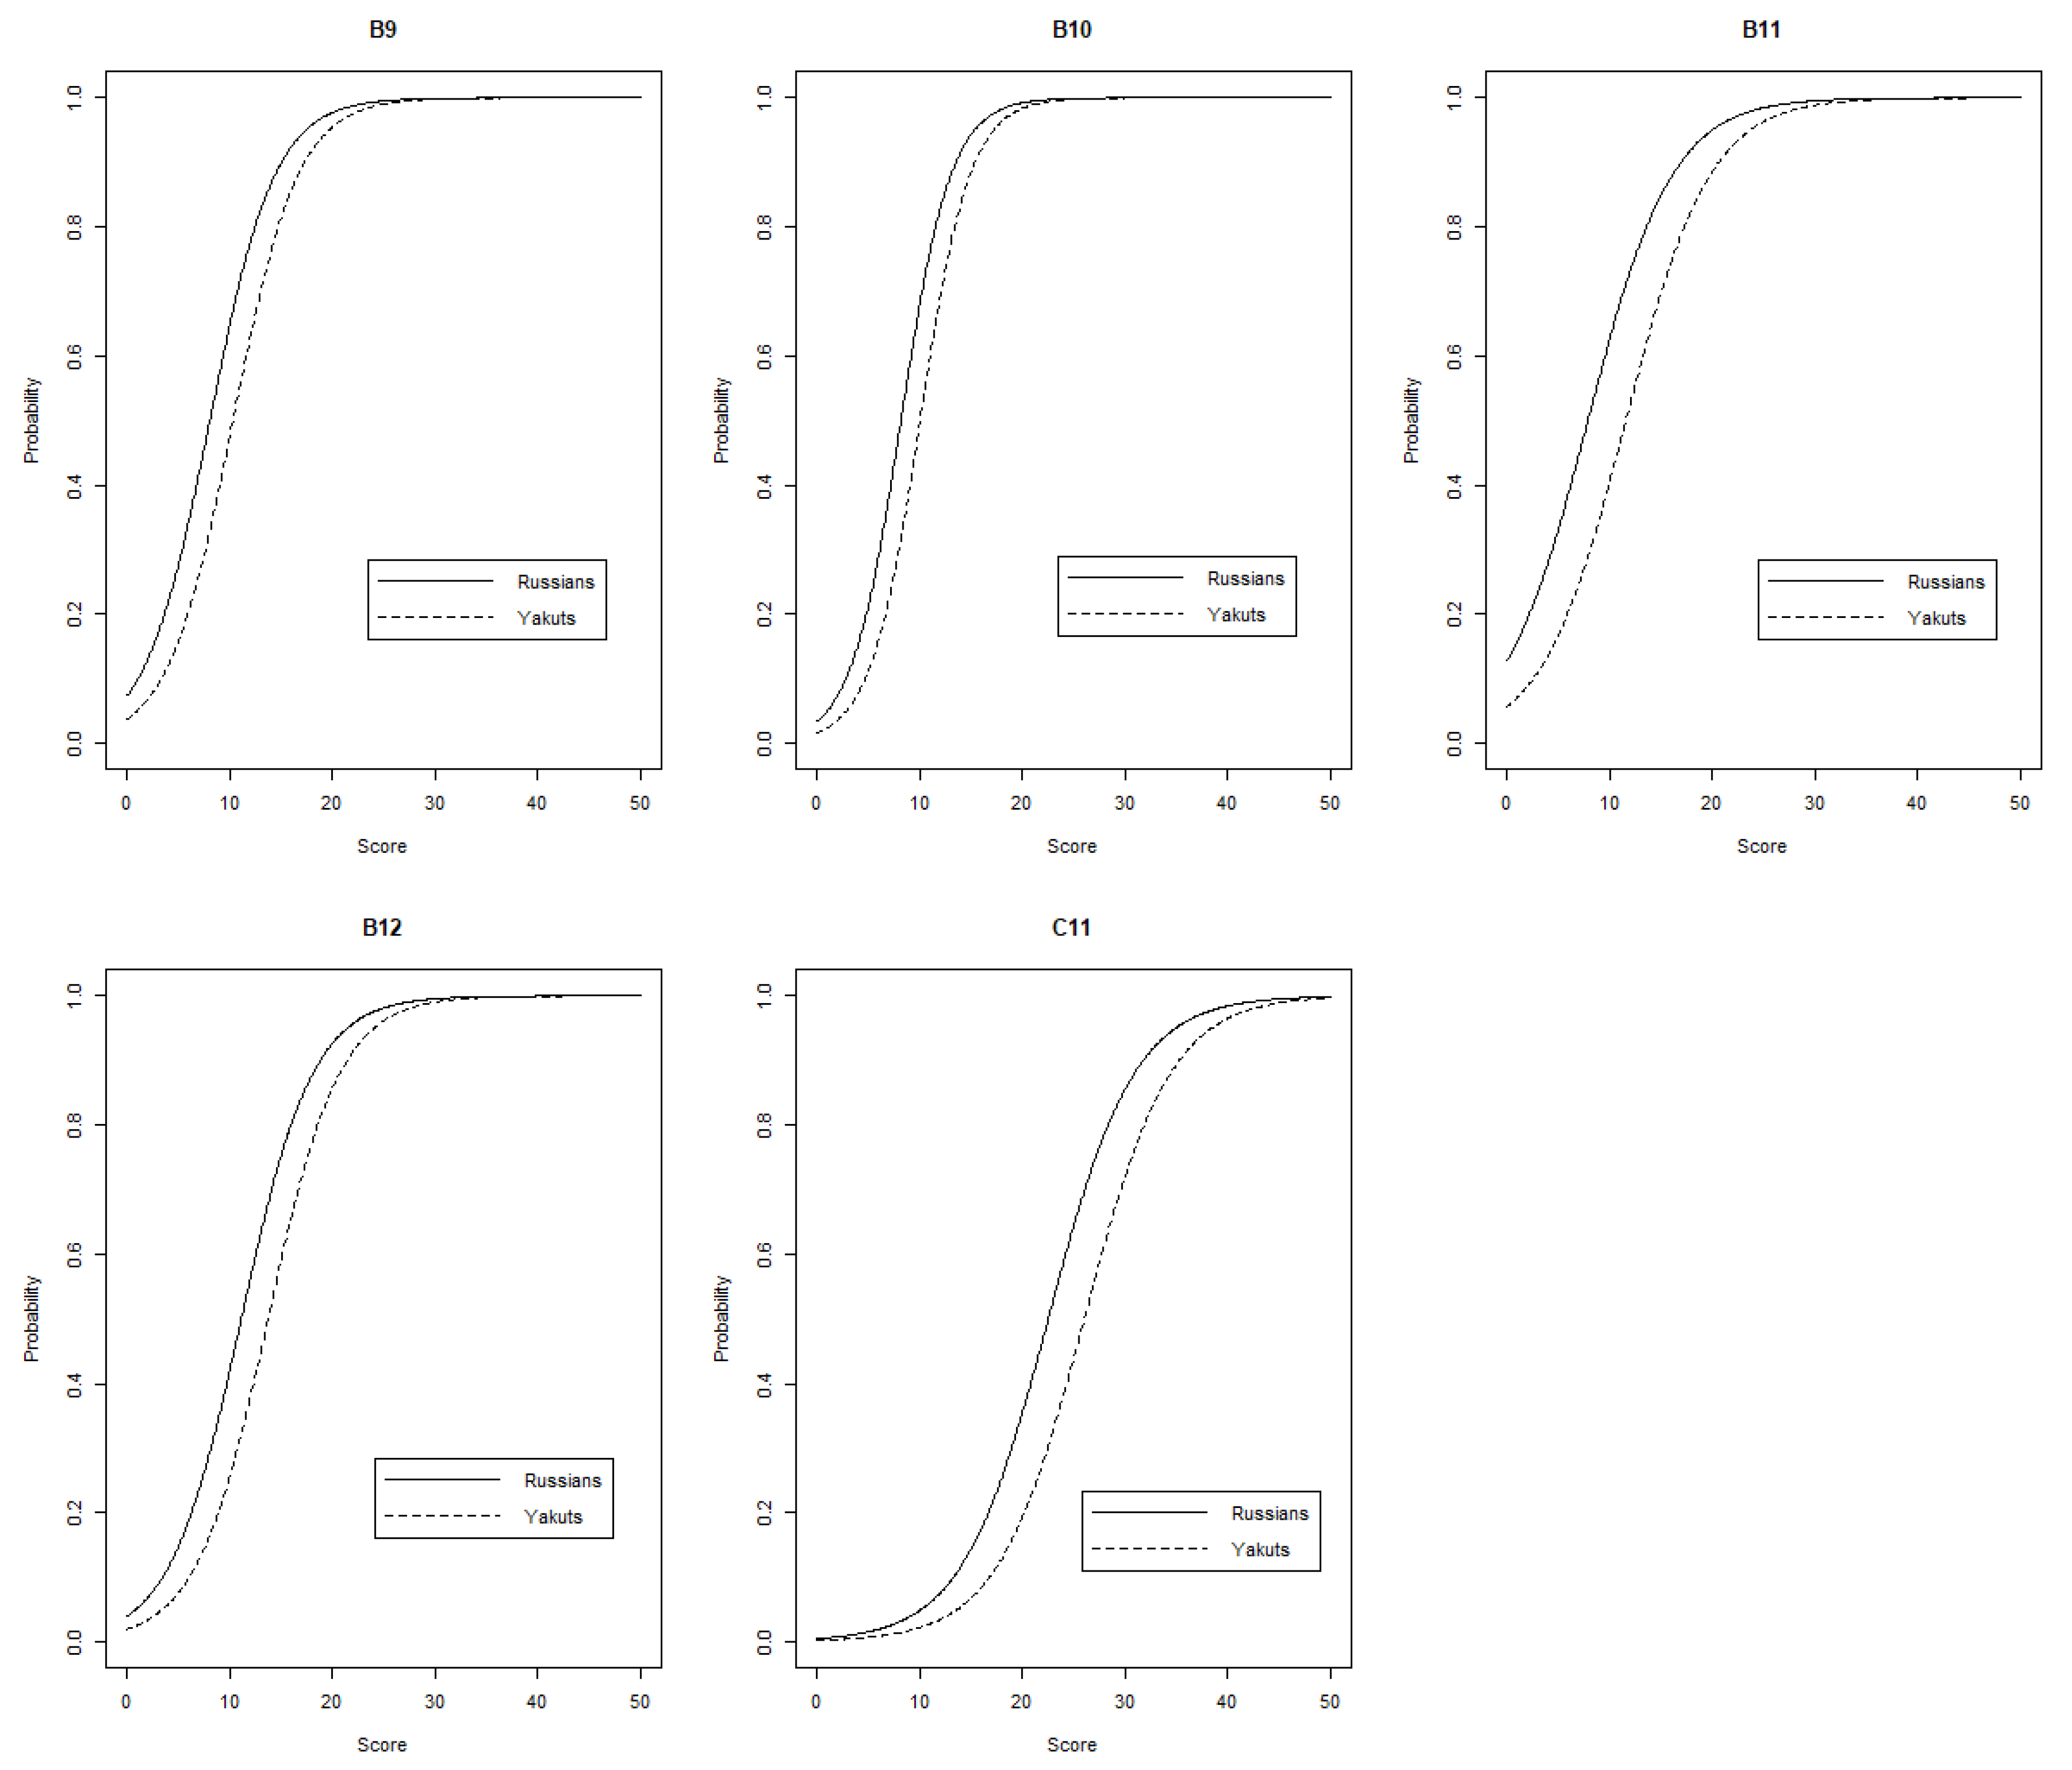
4. DIF Analysis
5. Discussion
Supplementary Materials
Author Contributions
Funding
Conflicts of Interest
References
- Lynn, R.; Vanhanen, T. IQ and the Wealth of Nations; Praeger Publishers/Greenwood Publishing Group: Westport, CT, USA, 2002; p. 298. ISBN 9780275975104. [Google Scholar]
- Lynn, R.; Vanhanen, T. IQ and Global Inequality, 1st ed.; Washington Summit Publishers: Augusta, GA, USA, 2006; ISBN 9781593680244. [Google Scholar]
- Lynn, R.; Vanhanen, T. Intelligence: A Unifying Construct for the Social Sciences; Ulster Institute for Social Research: London, UK, 2012; ISBN 9780956881182. [Google Scholar]
- Lynn, R. Race Differences in Intelligence: An Evolutionary Analysis; Washington Summit Books: Augusta, GA, USA, 2006; ISBN 9781593680206. [Google Scholar]
- Rushton, J.P.; Skuy, M. Performance on Raven’s Matrices by African and White University Students in South Africa. Intelligence 2000, 28, 251–265. [Google Scholar] [CrossRef]
- Rushton, J.P. Jensen Effects and African/Coloured/Indian/White differences on Raven’s Standard Progressive Matrices in South Africa. Pers. Individ. Differ. 2002, 33, 1279–1284. [Google Scholar] [CrossRef]
- Rushton, J.P.; Skuy, M.; Fridjhon, P. Jensen Effects among African, Indian, and White engineering students in South Africa on Raven’s Standard Progressive Matrices. Intelligence 2002, 30, 409–423. [Google Scholar] [CrossRef]
- Rushton, J.P.; Skuy, M.; Bons, T.A. Construct validity of Raven’s advanced progressive matrices for African and non-African engineering students in South Africa. Int. J. Sel. Assess. 2004, 12, 220–229. [Google Scholar] [CrossRef]
- Owen, K. The suitability of Raven’s standard progressive matrices for various groups in South Africa. Pers. Individ. Differ. 1992, 13, 149–159. [Google Scholar] [CrossRef]
- Rushton, J.P.; Jensen, A.R. Thirty years of research on race differences in cognitive ability. Psychol. Public Policy Law 2005, 11, 235–294. [Google Scholar] [CrossRef]
- Wicherts, J.M. Psychometric problems with the method of correlated vectors applied to item scores (including some nonsensical results). Intelligence 2017, 60, 26–38. [Google Scholar] [CrossRef]
- Wicherts, J.M.; Dolan, C.V.; Carlson, J.S.; van der Maas, H.L.J. Raven’s test performance of sub-Saharan Africans: Average performance, psychometric properties, and the Flynn Effect. Learn. Individ. Differ. 2010, 20, 135–151. [Google Scholar] [CrossRef]
- Raven, J. Testing the Spearman-Jensen Hypothesis Using the Items of the RPM. Available online: http://eyeonsociety.co.uk/resources/testingSJHyp.pdf. (accessed on 13 December 2019).
- Wicherts, J.M. Ignoring psychometric problems in the study of group differences in cognitive test performance. J. Biosoc. Sci. 2018, 50, 868–869. [Google Scholar] [CrossRef]
- Wicherts, J.M.; Johnson, W. Group differences in the heritability of items and test scores. Proc. Biol. Sci. 2009, 276, 2675–2683. [Google Scholar] [CrossRef] [PubMed]
- Facon, B.; Magis, D.; Nuchadee, M.-L.; De Boeck, P. Do Raven’s Colored Progressive Matrices function in the same way in typical and clinical populations? Insights from the intellectual disability field. Intelligence 2011, 39, 281–291. [Google Scholar] [CrossRef]
- Nye, C.D.; Drasgow, F. Effect size indices for analyses of measurement equivalence: Understanding the practical importance of differences between groups. J. Appl. Psychol. 2011, 96, 966–980. [Google Scholar] [CrossRef] [PubMed]
- Meade, A.W. A taxonomy of effect size measures for the differential functioning of items and scales. J. Appl. Psychol. 2010, 95, 728–743. [Google Scholar] [CrossRef]
- Magis, D.; Béland, S.; Tuerlinckx, F.; De Boeck, P. A general framework and an R package for the detection of dichotomous differential item functioning. Behav. Res. Methods 2010, 42, 847–862. [Google Scholar] [CrossRef]
- Taylor, N. Raven’s Standard and Advanced Progressive Matrices among adults in South-Africa. In Uses and Abused of Intelligence. Studies Advancing Spearman and Raven’s Quest for Non-Arbitrary Metrics; Raven, J., Raven, J.C., Eds.; Royal Fireworks Press: Unionville, NY, USA, 2008; pp. 371–391. [Google Scholar]
- Vanderpool, M.; Catano, V.M. Comparing the Performance of Native North Americans and Predominantly White Military Recruits on Verbal and Nonverbal Measures of Cognitive Ability. Int. J. Sel. Assess. 2008, 16, 239–248. [Google Scholar] [CrossRef]
- Kim, J.; Oshima, T.C. Effect of Multiple Testing Adjustment in Differential Item Functioning Detection. Educ. Psychol. Meas. 2013, 73, 458–470. [Google Scholar] [CrossRef]
- Chiesi, F.; Ciancaleoni, M.; Galli, S.; Primi, C. Using the Advanced Progressive Matrices (Set I) to assess fluid ability in a short time frame: An item response theory-based analysis. Psychol. Assess. 2012, 24, 892–900. [Google Scholar] [CrossRef]
- Chiesi, F.; Ciancaleoni, M.; Galli, S.; Morsanyi, K.; Primi, C. Item Response Theory analysis and Differential Item Functioning across age, gender and country of a short form of the Advanced Progressive Matrices. Learn. Individ. Differ. 2012, 22, 390–396. [Google Scholar] [CrossRef]
- Waschl, N.A.; Nettelbeck, T.; Jackson, S.A.; Burns, N.R. Dimensionality of the Raven’s Advanced Progressive Matrices: Sex differences and visuospatial ability. Pers. Individ. Differ. 2016, 100, 157–166. [Google Scholar] [CrossRef]
- Sugonyaev, K.; Grigoriev, A.; Lynn, R. A New Study of Differences in Intelligence in the Provinces and Regions of the Russian Federation and Their Demographic and Geographical Correlates. Mank. Q. 2018, 59, 31–37. [Google Scholar]
- Lynn, R.; Cheng, H.; Grigoriev, A. Differences in the Intelligence of 15 Year Olds in 42 Provinces and Cities of the Russian Federation and Their Economic, Social and Geographical Correlates. Mank. Q. 2017, 57, 659–668. [Google Scholar]
- Zumbo, B.D.; Thomas, D.R. A Measure of Effect Size for A Model-Based Approach for Studying DIF; University of Northern British Columbia, Edgeworth Laboratory for Quantitative Behavioral Science: Prince George, BC, Canada, 1997. [Google Scholar]
- Jodoin, M.G.; Gierl, M.J. Evaluating Type I Error and Power Rates Using an Effect Size Measure with the Logistic Regression Procedure for DIF Detection. Appl. Meas. Educ. 2001, 14, 329–349. [Google Scholar] [CrossRef]
- Van der Ven, A.H.G.S.; Ellis, J.L. A Rasch analysis of Raven’s standard progressive matrices. Pers. Individ. Differ. 2000, 29, 45–64. [Google Scholar] [CrossRef]
- Shibaev, V.; Lynn, R. The Intelligence of Yakuts and Ethnic Russians in Yakutia. Psychol. J. High. Sch. Econ. 2016, 13, 678–682. [Google Scholar]


| Age | Yakuts | Russians | D 1 | P | ||||
|---|---|---|---|---|---|---|---|---|
| N | Mean | SD | N | Mean | SD | |||
| <7 | - | - | - | 76 | 26.9 | 6.2 | - | - |
| 8 | 2 | 27.5 | 2.1 | 105 | 28.2 | 4.9 | −0.15 | 0.713 |
| 9 | 34 | 25.7 | 6 | 115 | 29.7 | 6 | −0.66 | 0.001 |
| 10 | 21 | 29.1 | 4.5 | 125 | 32.1 | 4.7 | −0.64 | 0.01 |
| 11 | 30 | 32.9 | 4 | 121 | 32.2 | 4.5 | 0.16 | 0.378 |
| 12 | 82 | 32.4 | 5.9 | 89 | 34.8 | 4 | −0.48 | 0.002 |
| 13 | 62 | 38 | 4.5 | 82 | 36.6 | 5.4 | 0.28 | 0.091 |
| 14 | 59 | 36.7 | 4.2 | 96 | 39.9 | 5.1 | −0.67 | 0 |
| 15 | 79 | 38.1 | 5.4 | 77 | 39.9 | 4.9 | −0.35 | 0.029 |
| 16 | 61 | 40.2 | 5.6 | 59 | 42 | 5.6 | −0.31 | 0.091 |
| 17 | 56 | 42.1 | 7 | 11 | 42.5 | 6 | −0.07 | 0.813 |
| 18+ | 32 | 39.5 | 5.2 | - | - | - | - | - |
| Item | Adjusted P-Value | DIF Type | Effect Size |
|---|---|---|---|
| B9 | 0.0068 | uniform | 0.02 |
| B10 | 0.029 | uniform | 0.01 |
| B11 | 0 | uniform | 0.03 |
| B12 | 0 | uniform | 0.01 |
| C11 | 0 | uniform | 0.03 |
| Age | Yakuts | Russians | D 1 | P | ||||
|---|---|---|---|---|---|---|---|---|
| N | Mean | SD | N | Mean | SD | |||
| <7 | - | - | - | 76 | 24.2 | 5.4 | - | - |
| 8 | 2 | 24.5 | 2.1 | 105 | 25.2 | 4.2 | −0.17 | 0.712 |
| 9 | 34 | 23.6 | 4.7 | 115 | 26.6 | 5.1 | −0.6 | 0.002 |
| 10 | 21 | 26.6 | 3.5 | 125 | 28.7 | 4.1 | −0.52 | 0.021 |
| 11 | 30 | 29.7 | 3.7 | 121 | 28.9 | 4.1 | 0.2 | 0.302 |
| 12 | 82 | 29.4 | 4.9 | 89 | 30.8 | 3.7 | −0.33 | 0.035 |
| 13 | 62 | 34.2 | 4.1 | 82 | 32.7 | 4.7 | 0.32 | 0.051 |
| 14 | 59 | 33.1 | 4 | 96 | 35.7 | 4.8 | −0.57 | 0 |
| 15 | 79 | 34.5 | 4.9 | 77 | 35.8 | 4.7 | −0.27 | 0.094 |
| 16 | 61 | 36.3 | 5.1 | 59 | 37.7 | 5.3 | −0.26 | 0.16 |
| 17 | 56 | 38.1 | 6.5 | 11 | 38.1 | 5.6 | 0 | 0.992 |
| 18+ | 32 | 36.1 | 5.1 | - | - | - | - | - |
© 2020 by the authors. Licensee MDPI, Basel, Switzerland. This article is an open access article distributed under the terms and conditions of the Creative Commons Attribution (CC BY) license (http://creativecommons.org/licenses/by/4.0/).
Share and Cite
Shibaev, V.; Grigoriev, A.; Valueva, E.; Karlin, A. Differential Item Functioning on Raven’s SPM+ Amongst Two Convenience Samples of Yakuts and Russians. Psych 2020, 2, 44-51. https://doi.org/10.3390/psych2010005
Shibaev V, Grigoriev A, Valueva E, Karlin A. Differential Item Functioning on Raven’s SPM+ Amongst Two Convenience Samples of Yakuts and Russians. Psych. 2020; 2(1):44-51. https://doi.org/10.3390/psych2010005
Chicago/Turabian StyleShibaev, Vladimir, Andrei Grigoriev, Ekaterina Valueva, and Anatoly Karlin. 2020. "Differential Item Functioning on Raven’s SPM+ Amongst Two Convenience Samples of Yakuts and Russians" Psych 2, no. 1: 44-51. https://doi.org/10.3390/psych2010005
APA StyleShibaev, V., Grigoriev, A., Valueva, E., & Karlin, A. (2020). Differential Item Functioning on Raven’s SPM+ Amongst Two Convenience Samples of Yakuts and Russians. Psych, 2(1), 44-51. https://doi.org/10.3390/psych2010005