3.3. Regression Analyses
Our primary focus is whether genetic ancestry predicts cognitive ability. The rationale for the analysis has been explained in detail by Kirkegaard et al. [
24]. In order to determine if this is the case, we constructed a series of regression models. These models were applied to the African-American and the combined African-, European-, and biracial African-European-American sample. Restricting the first analysis to SIRE African-Americans approximates the methodology used by Scarr et al. [
52]. Our initial analysis used European ancestry (EUR) as the independent variable. We then added skin color to test discrimination (i.e., colorism) and other appearance-based hypotheses. Finally, we added SES to assess the effect of familial environmental influences on the observed gap, noting again that these measures are genetically confounded.
To provide results that can be easily compared across groups and studies, we standardize all values except European ancestry and then report the unstandardized beta coefficients. Doing so leaves only ancestry unstandardized. This allows one to interpret the beta coefficient for ancestry as a change in a standard deviation of cognitive ability over a change of 100% European ancestry. Following Kirkegaard et al. [
24], we do not report standardized betas (except in
Table 5 for illustration), because, in the context of the effect of ancestry on outcomes, these are difficult to compare across groups. This difficulty arises because groups differ substantially in their variability in ancestry and its effects. As such, a change of one standard deviation of ancestry from one group has a substantially different meaning than the same from another group.
In models that only included monoracial African-Americans, we found that European ancestry was always strongly and significantly related to cognitive ability. Skin color (assessed genetically with the highly accurate predictor [
79,
93] was associated with cognitive ability (Model 1b,
Table 5), but made no significant incremental contribution when ancestry was also in the model (Model 2,
Table 5). Results could still be due to phenotypic confounding from other appearance variables. To test this possibility, we fitted a number of models including skin, hair, and eye color. We found that none of these features had significant effects on their own, except for brown eye color, which was positively related to cognitive ability, but with a large standard error. These results are shown in the R notebook. The last monoracial African-American model (Model 3,
Table 5) included SES, which had a considerable effect on cognitive ability. However, the so-called sociologist’s fallacy [
2,
5] may be at play here. That is, controlling for parental SES also controls for genetic effects on SES which may be shared with cognitive ability.
As an alternative to the model with only monoracial African-Americans, we next included both individuals who identified as monoracial African- and biracial African-European-American. This is equivalent to the “broadly-defined” African-American group used by Kirkegaard et al. [
24]. These results are shown in
Table 6. In Model 2, with self-identified European-American race (which, in this case, indicates biracial status) as a covariate, the beta for European ancestry (B
EUR = 0.85;
n = 2407) was comparable although slightly higher than that for the monoracial African-American sample (B
EUR = 0.78;
n = 2179).
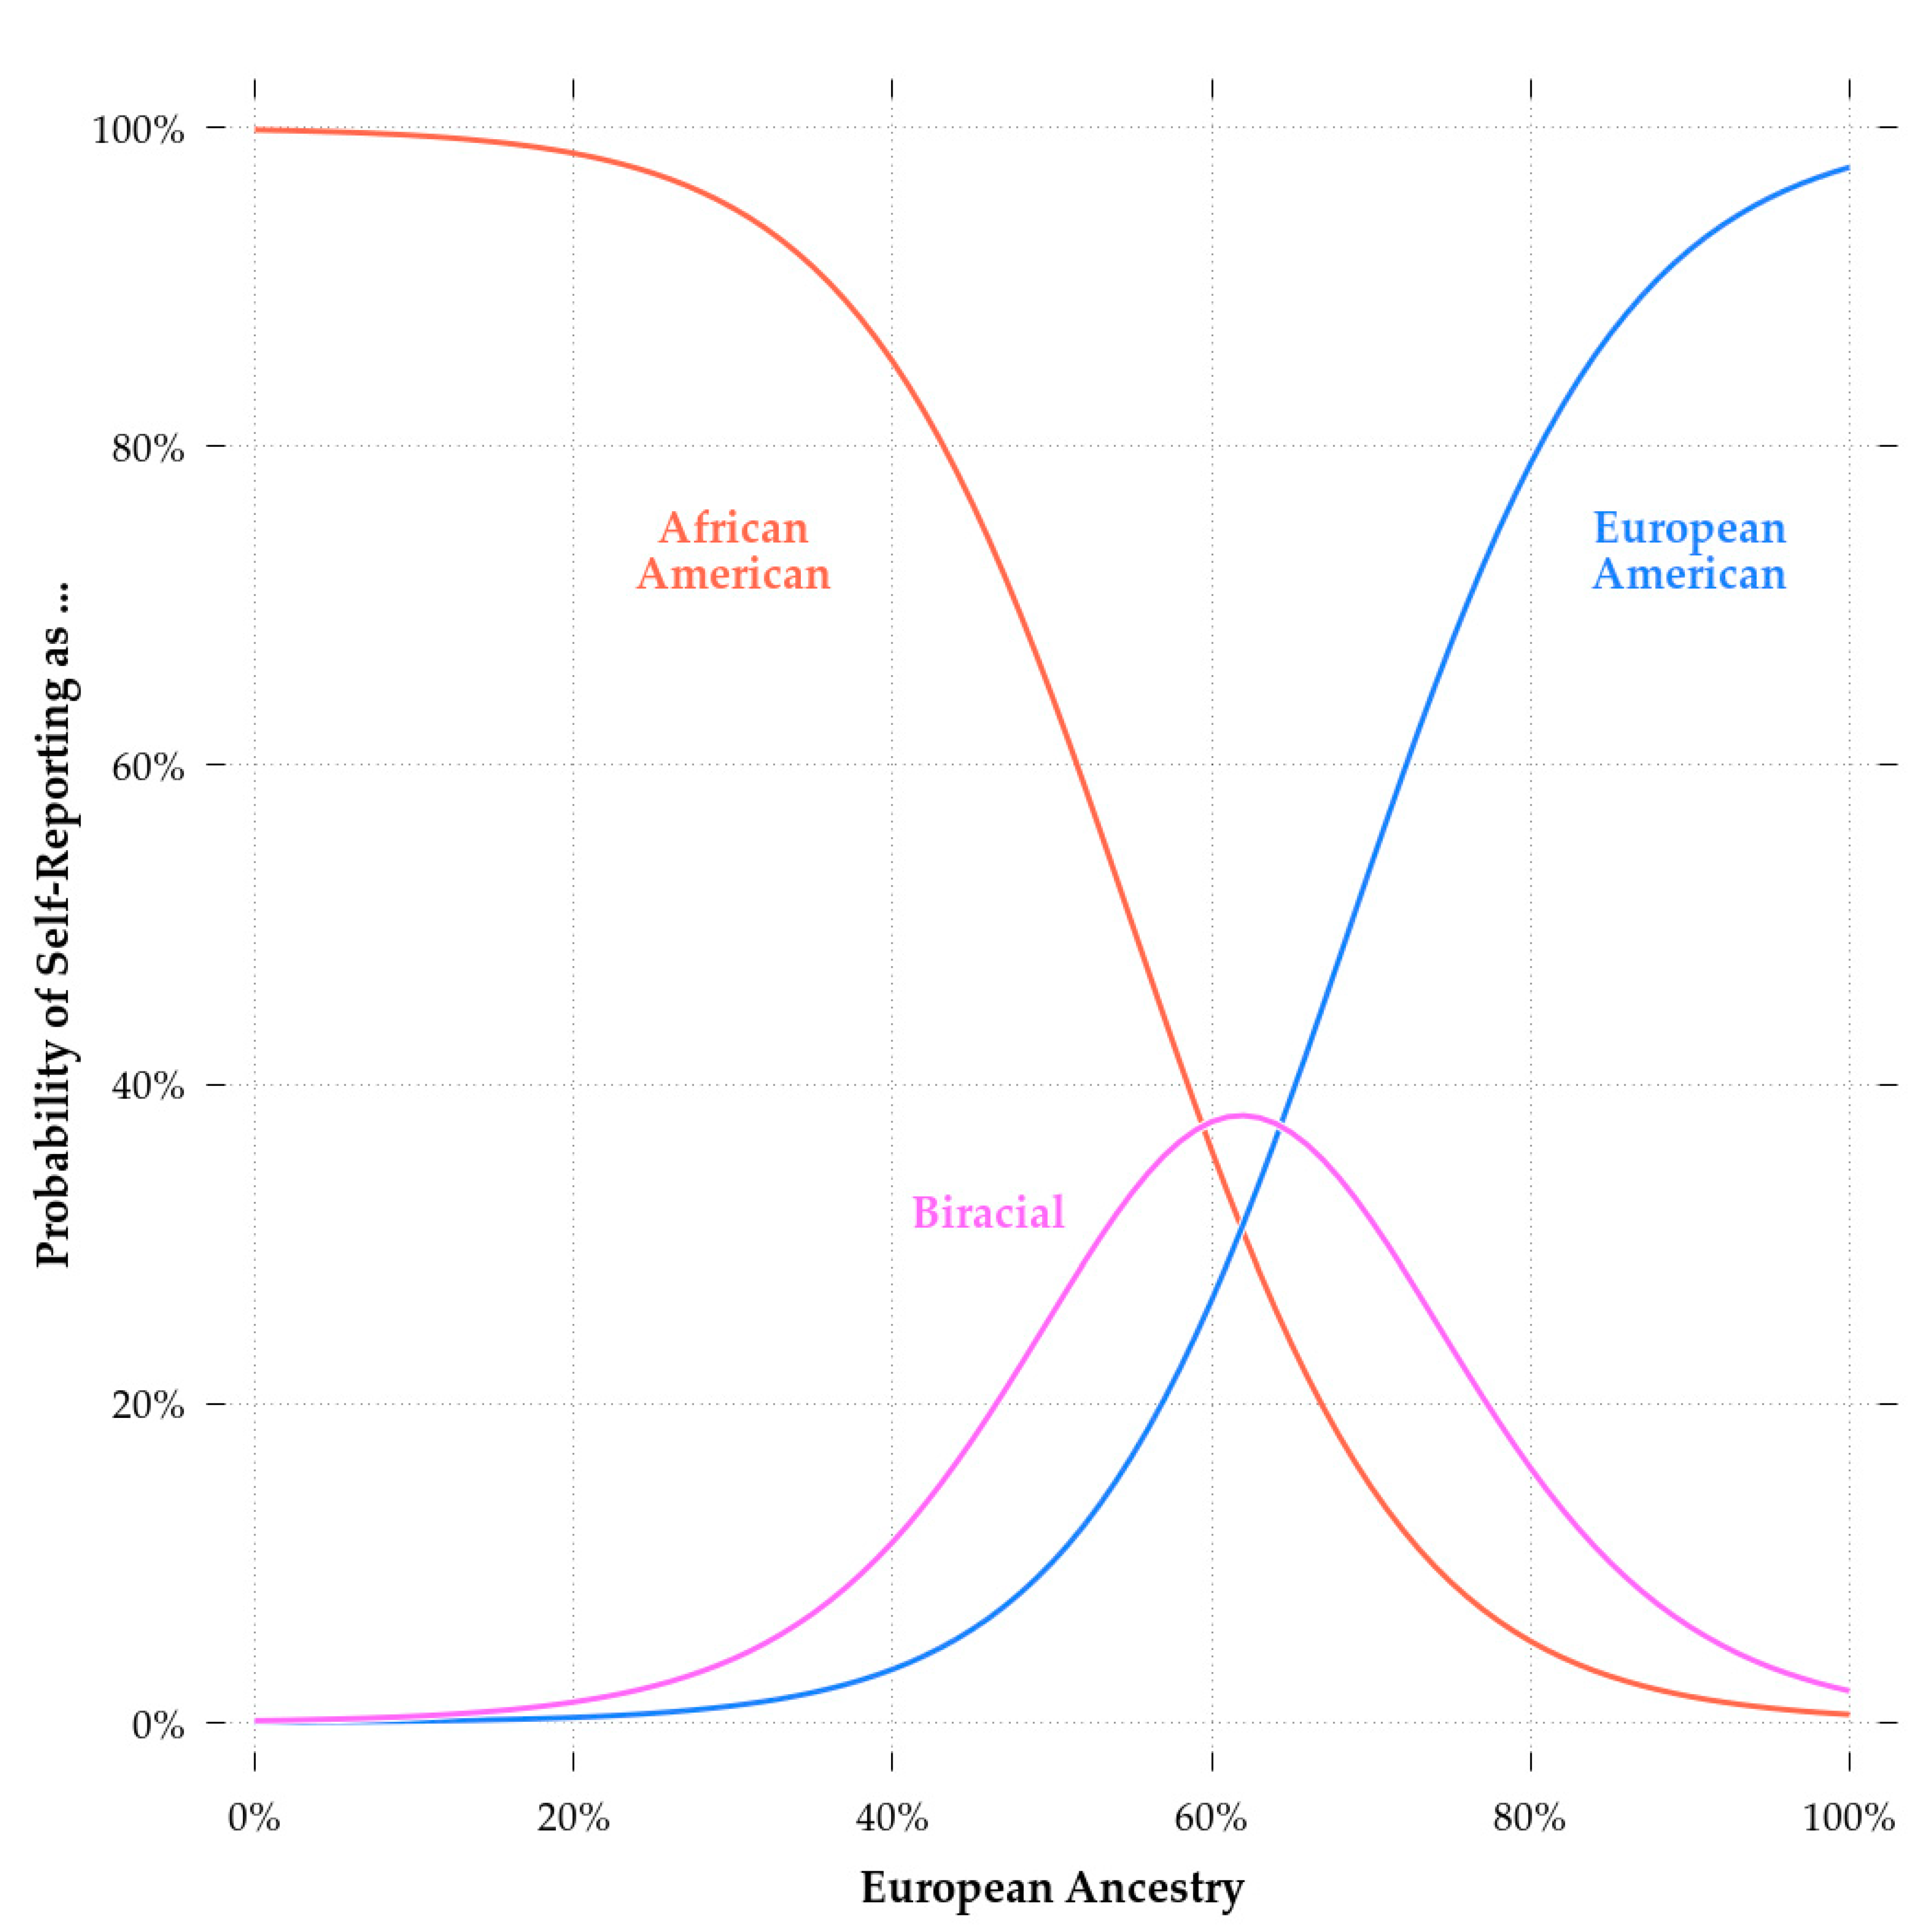
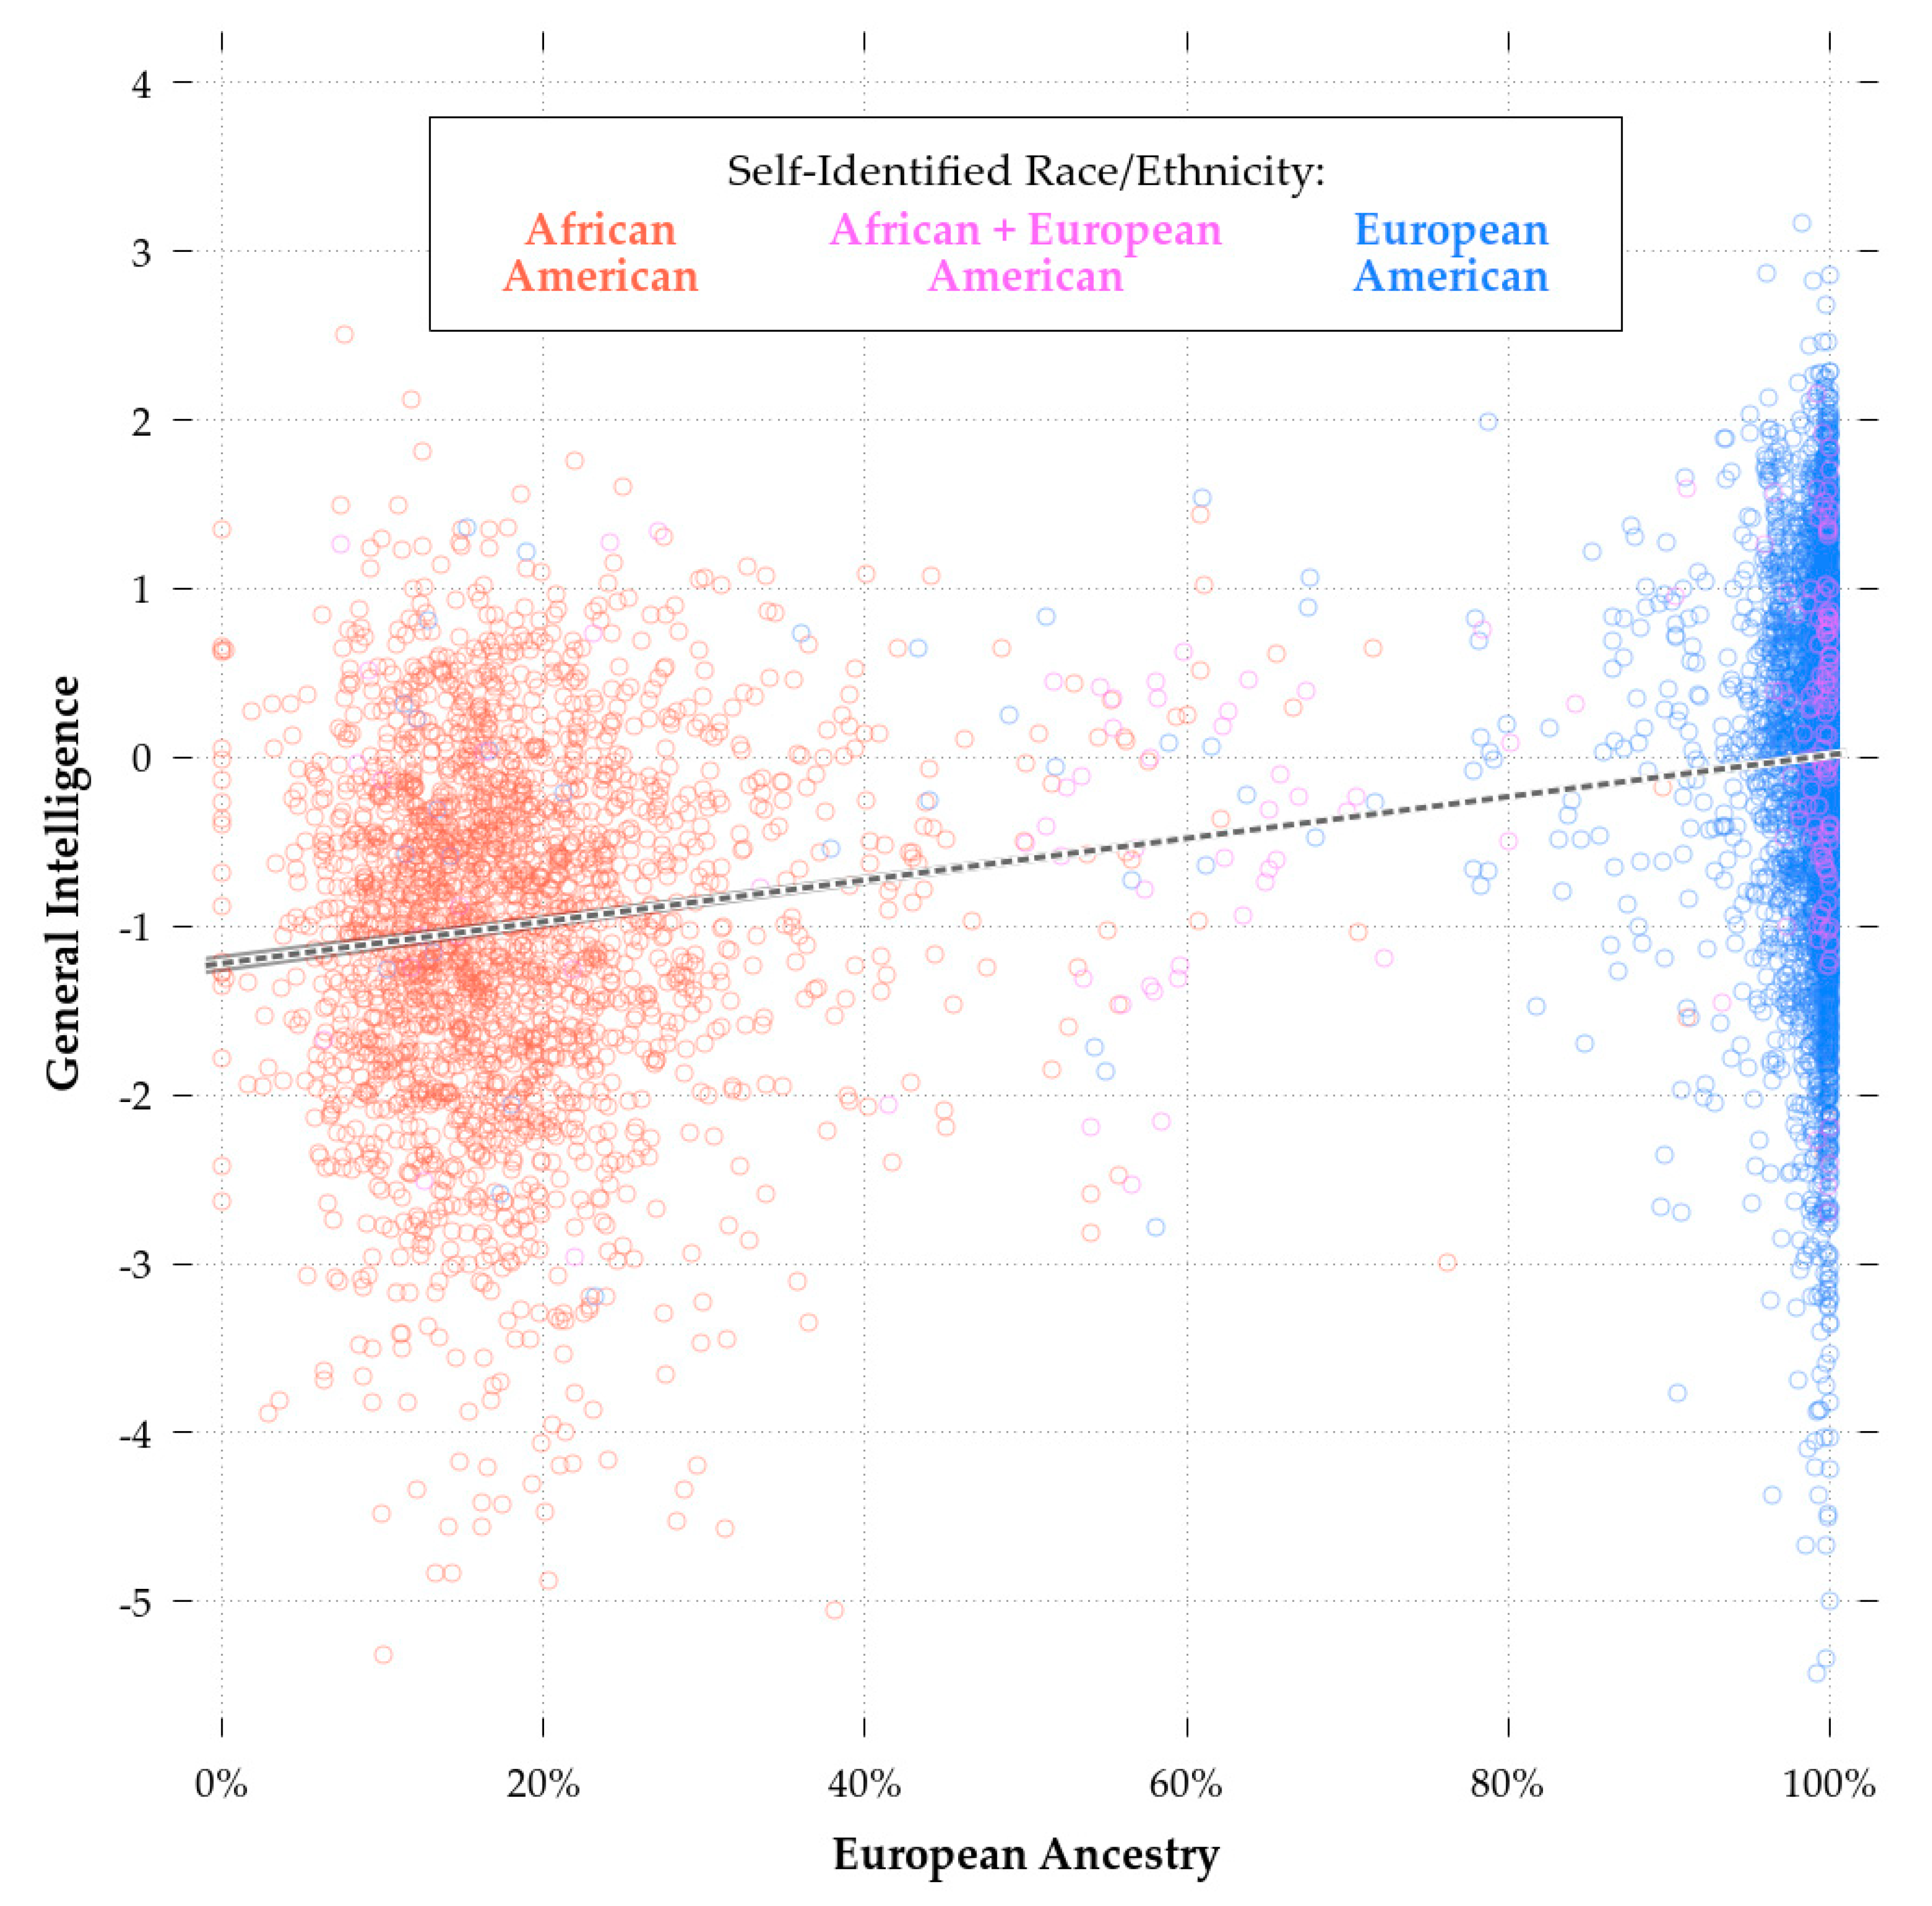
Comparing Model 2 and Model 3b, biracial status had a significant effect independent of European ancestry. This could be due to selective patterns of self-identification, whereby choosing to report that one is a European-American, regardless of one’s genetic ancestry, is associated with greater cognitive ability. This appears to have been the case as evidenced by
Figure 3, which shows the relationship between European ancestry and cognitive ability. Being above the regression line was associated with a greater likelihood of biracial African-European self-identification regardless of one’s actual ancestry. Whatever the case, unlike with self-reported European-American race, skin color did not have significant predictive validity independent of European ancestry. The comparison between Model 3a and Model 3b shows that the inclusion of ancestry reduced the effect of color from highly significant to non-significant (B
color = −0.25 in 3a and B
color = −0.06 in 3b,
n = 1,690). As in the models for monoracial AAs, the inclusion of parental SES reduced, but did not eliminate, the effect of European ancestry (Model 4).
The next set of models utilized the whole sample of African, European, and biracial African-European-Americans. These results appear in
Table 7. The first model revealed a substantial impact of European ancestry on cognitive ability. The next model found the same, but also produced a significant effect of SIRE European-American (but not SIRE African-American) self-identification. That is, some incremental validity existed which was associated with self-identification as European-American and this did not occur for self-identification as African-American. The next model included physical appearance in the form of skin color. As with the African-American-only and the combined African- and biracial African-European-American sample, this variable had no significant effect on cognitive ability in the full sample with ancestry included (Model 3b). Our final model included SES. The inclusion of SES reduced the effect of SIRE European-American, although it still remained significant. Nonetheless, in this model, European ancestry was the dominant determinant of cognitive ability. The effect of SES on cognitive ability was essentially the same in the full sample as it was in the monoracial African-American model. The fact that the effect of SIRE European-American weakened with the inclusion of SES is perhaps notable, as it may imply that selective self-identification as European-American is driven in part by social processes. It is clear here though that self-identification and other-identifiable physical characteristics are much less important as determinants of cognitive ability than is genetic ancestry.
Cumulatively, European ancestry was consistently positively related to cognitive ability in all models. SES was similarly related to cognitive ability. European-American SIRE also had a significant effect independently of genetic ancestry, indicating that differences were not wholly explained by ancestry. Skin color was not significantly related to cognitive ability in any of our models which included genetic ancestry. However, it was related to cognitive ability in models not including ancestry, as found in previous studies [
17,
94,
95,
96] (for a review of older studies, see [
1]).
Recent immigrants from Africa in the sample may have affected the scores reported here as migrants may have been selected for cognitive ability when they emigrated from their home countries. As such, we conducted a robustness test by rerunning the analyses excluding individuals with one percent or less European ancestry. This exclusion did not substantially affect the results (reported in the R notebook, Model 17b). Thus, confounding due to migration likely did not influence our findings.
3.4. Cognitive Ability and Education-Related Polygenic Scores (eduPGS)
We examined the validity of four cognitive ability and education-related PGSs reported by Lee et al. [
84]. The eduPGS were derived from European populations. First, we used the eduPGS based on all variants trained without the 23andme cohort (n = 7,762,369 variants overlapping in the present dataset). The goal was to construct a predictor with good within-discovery population (European, in this case) validity, but very high LD decay bias, and thus low transethnic validity. Second, we used MTAG eduPGS with 10k variants (n = 8442 overlapping variants) to construct a predictor with good within-discovery population validity and reduced LD decay bias. Third, we used the MTAG eduPGS lead SNPs (n = 1558 overlapping variants) to see if we could reduce LD decay bias and increase transethnic validity while retaining within-discovery population validity. Finally, we used the putatively causal variants (N = 111 overlapping variants in our dataset) to construct an eduPGS with minimal LD decay bias, but low within-discovery population validity. At some point, screening SNPs based on
p values may lead to lower validity in both the discovery population and other-ethnic populations, despite having relatively high transethnic validity [
90]. The goal is to identify PGS which have both high within-discovery population and transethnic validities.
The correlations with
g are shown in
Table 8, with results for European-Americans above the diagonal and results for (monoracial) African-Americans below. Since the PNC is independent from the samples analyzed by Lee et al. [
84], the results for European-Americans constitute an independent replication of those reported by Lee et al. [
84]. This may be of interest to some because our dependent variable was a good measure of
g.
Of the PGS, the MTAG_10k PGS had the highest validity in both the European-American and African-American samples, although the validity for African-Americans was reduced by 51%. The results for MTAG_10k and MTAG eduPGS lead SNPs correlated highly with one another (r > 0.80) in both the African- and European-American samples. These eduPGS also had similar relationships with cognitive ability.
As expected, the GWAS eduPGS had high within-source population validity but low transethnic validity. While significant in the African-American sample, the validity was only 0.044/0.225 = 20% of that in the European-American sample. This low transethnic validity occurred because the 7,762,369 variants in conjunction with high LD decay produced considerable noise. Due to being based on only 111 overlapping variants, the putatively causal eduPGS had low validity within both samples but had the highest relative transethnic validity: 0.031/0.058 = 54%.
Consistent with theory [
90], the eduPGS with the highest validity in both the African- and European-American samples was the MTAG_EA_10K (
r = 0.112 &
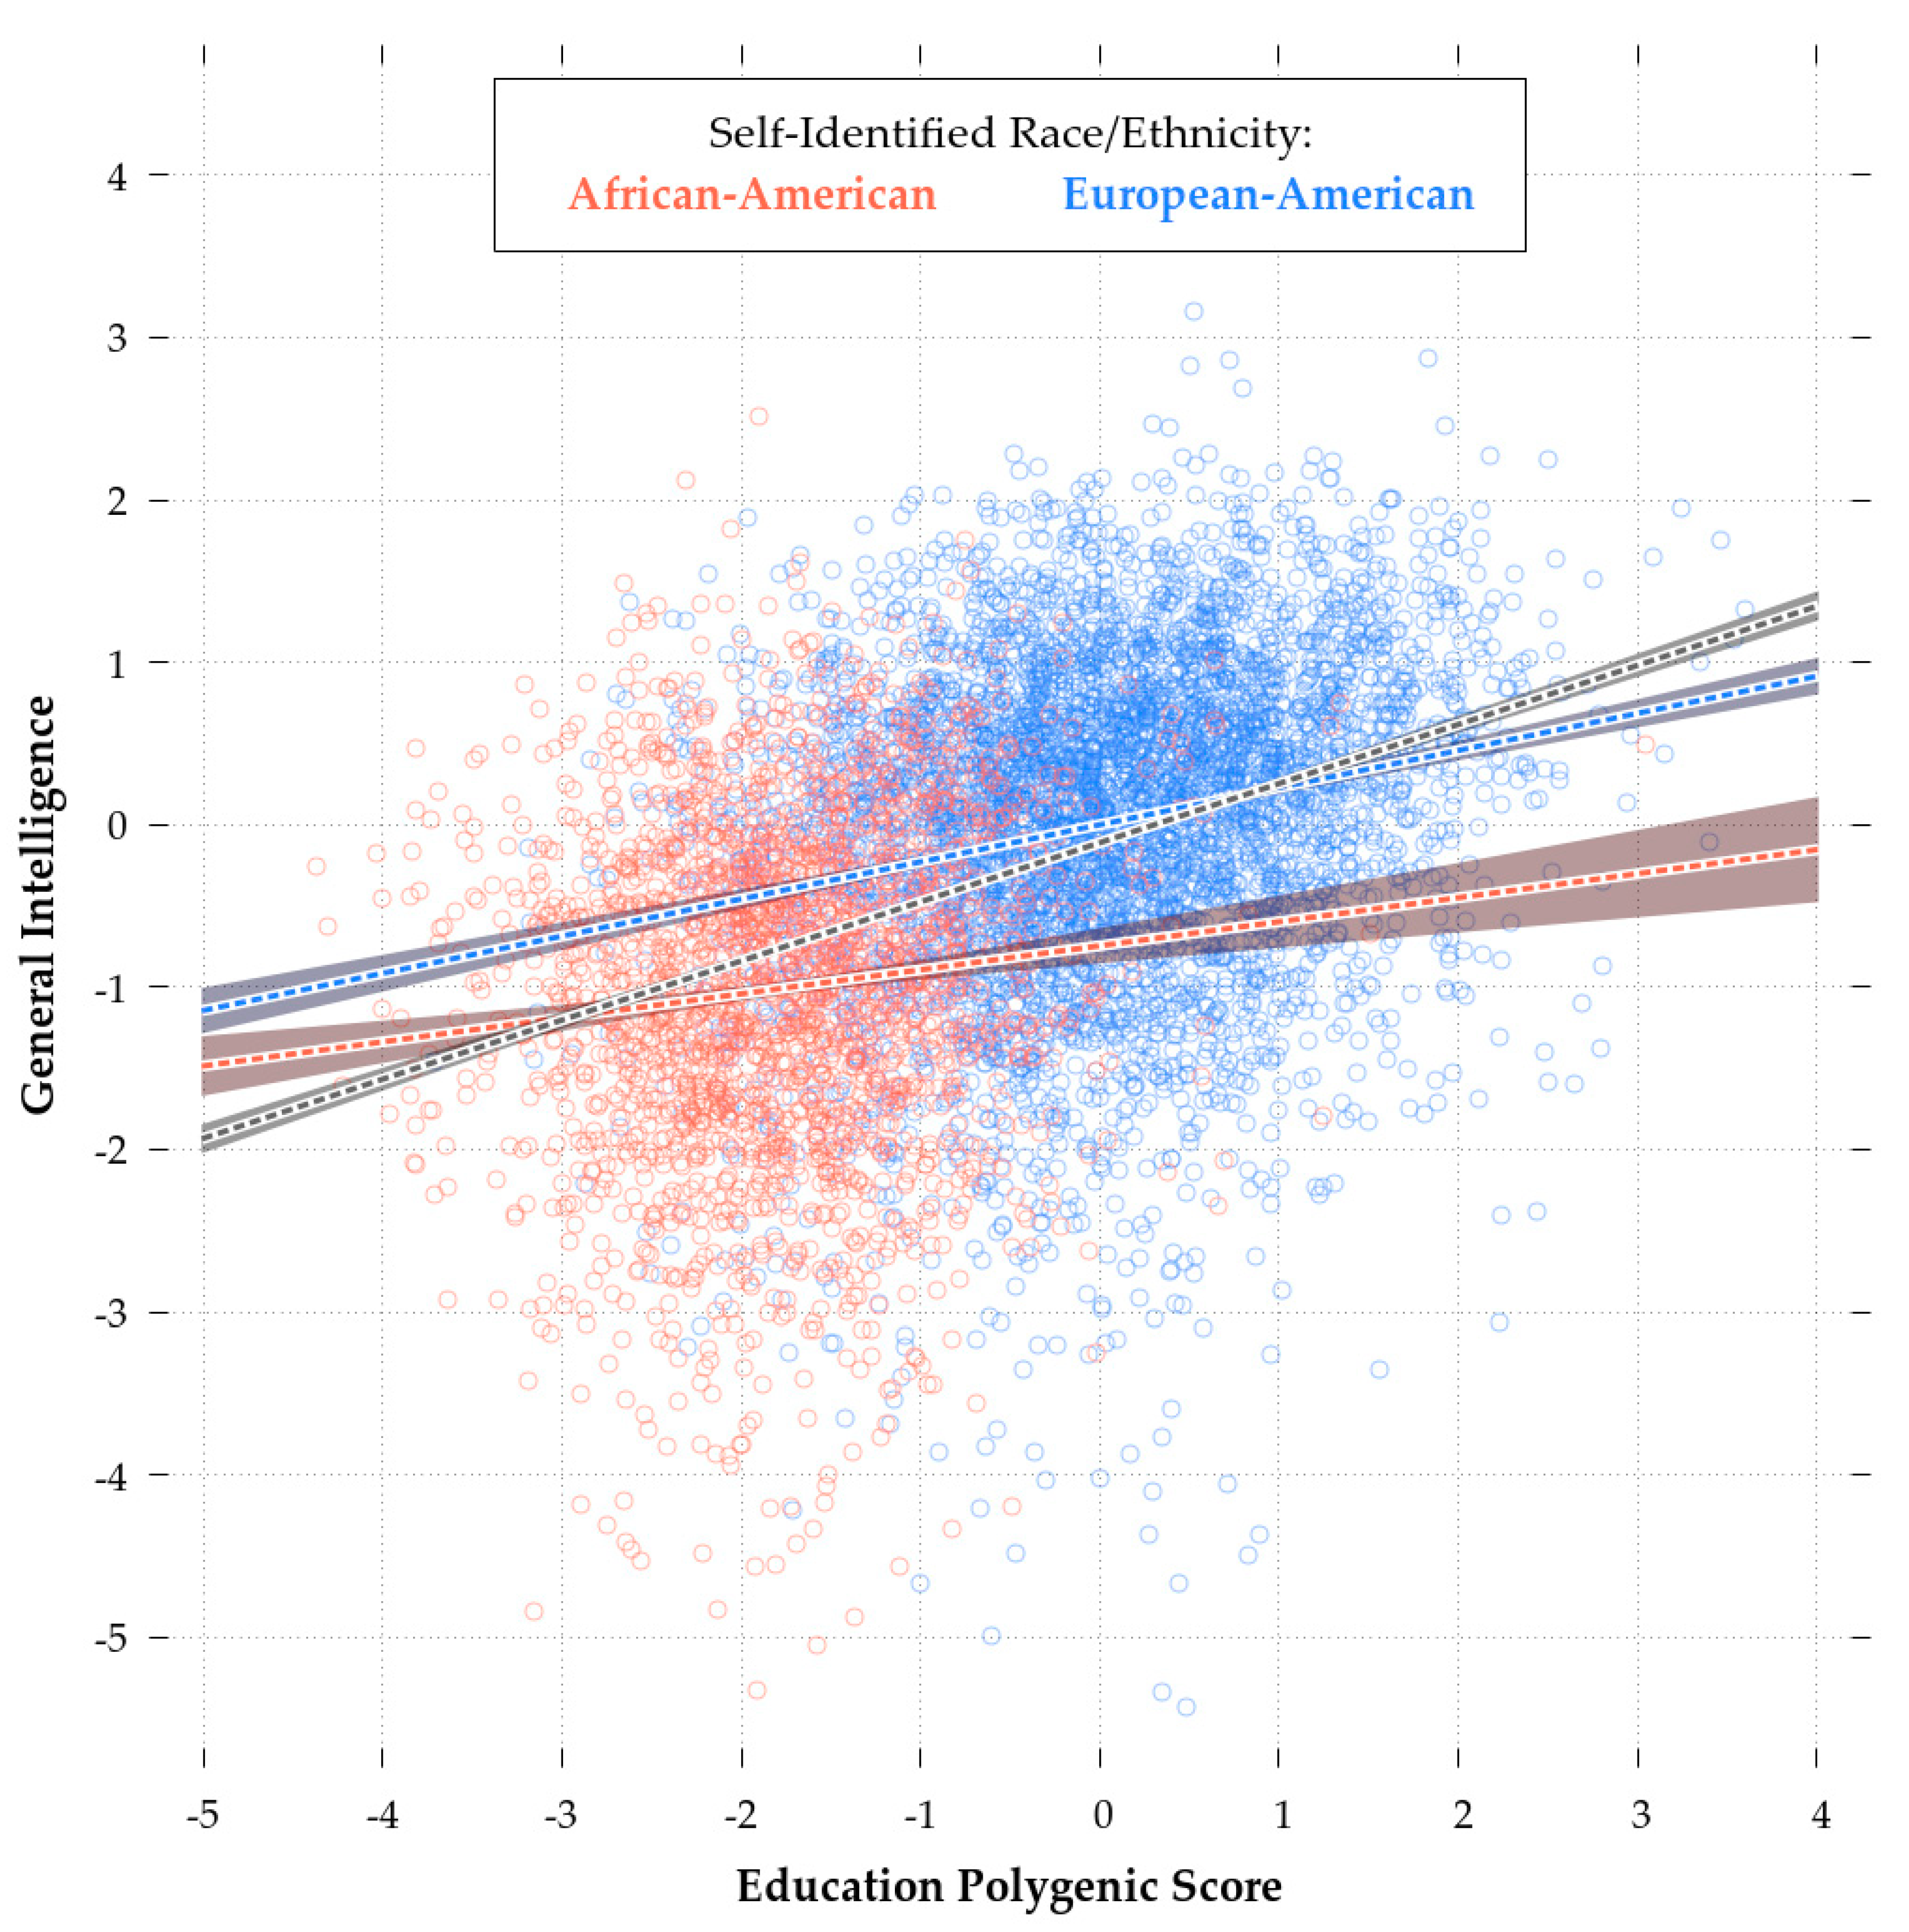
r = 0.227, respectively). As such, in the following analyses, we restricted consideration to these scores. While retaining some validity in the African-American sample, the MTAG_10k eduPGS showcased predictive bias. Indeed, a Fisher
r-to-
z Test showed that the differences in the correlations for African and European-Americans was highly significant (
z = −4.6, p < 0.01). This difference is illustrated in
Figure 4, which shows the regression plot for eduPGS and
g for European (red) and African-Americans (blue).
The slope of the regression line and the intercepts for the African-American sample are both lower. As Zanetti & Weale [
86] note, differences in SNP predictivity could be due to (1) lack of statistical power, (2) allele frequency differences, (3) linkage disequilibrium, or (4) differences in true causal variant effect sizes/directions. These authors suggest that the last explanation is generally not necessary. Regardless, a combination of these factors could lead to PGS bias in favor of Europeans (or Africans). There are a number of possible ways in which such bias could have arisen. For example, imagine the case for more recent polymorphisms. These more recent polymorphisms will probably have a higher frequency in the discovery population. If recent selection favored IQ-promoting variants and purged IQ-reducing variants, the more recent polymorphisms will be IQ-promoting, which will result in bias in favor of the discovery population. There is some evidence of an increase in PGS over time [
97]. Of course, the reverse would be true, if recent selection disfavored high IQ alleles. However, given that most mutations are deleterious [
98], if the PGS contain a large number of recent variants it is likely that they’ll be biased against their discovery populations. For disease phenotypes, Kim, Patel, Teng, Berens, & Lachance [
99] showed how this bias can function and found that correcting for differences in derived vs. ancestral polymorphisms can improve the transracial predictivity of PGS. In a
supplementary analysis, conducted to address a reviewer’s point, we did not find evidence of a substantive (or even statistically significant) effect of young vs. old polymorphisms. Thus, the concern raised regarding bias due to polymorphism age (e.g., [
99]) does not seem to be a problem in this case and so we did not create polymorphism age-corrected PGS.
Table 9 shows eduPGS means and standard deviations for African, biracial African-European, and European-Americans. The eduPGS difference is large at
d = 1.89 and it is larger than the phenotypic gap in
g. This would be expected even if the PGS were unbiased given the imperfect relationship between PGS and
g. Beyond this and possible bias in the PGS, another possibility is that the PGS differences between groups are primarily in common variants, while the differences between individuals within groups are in both common variants and rare variants that arose recently by mutations and which are under mutation-selection balance. Given this scenario, PGS which indexed mostly common variants between populations would manifest as reduced phenotypic differences even assuming consistent validity.
The association between eduPGS (MTAG_10k) and
g in the African-American sample could, in principle, result from confounding with environmental factors. This could be an indirect effect of the association between
g and European ancestry or, alternatively, color. Alternatively, the variants in the eduPGS could be “chopstick genes” [
100] which have a statistical but no causal effect. If eduPGS were merely indexing European ancestry, one would expect the GWAS eduPGS (which is based on more than 7 million additional variants) to exhibit an association as high as the one we found with MTAG_EA_10k eduPGS. This is because the GWAS_eduPGS, with its greater number of variants, is likely to be a better index of ancestry. This does not appear to be the case. Regardless, to explore this possibility further, we ran regression models with European ancestry (Model 1b) and color scores (Model 2b) for the monoracial African-American and combined African-, European-, and biracial African-European-American samples. The results are shown in
Table 10 and
Table 11 respectively.
Adjusting for European ancestry does not reduce the validity of eduPGS in the African-American sample (
Table 10; Model 1b), nor does controlling for skin color. In fact, the validity here increases slightly relative to that found among European-Americans.
Table 12 shows the regression results for European-Americans (Model 2). Comparing the monoracial African-American SIRE beta (Model 1b,
Table 10) to the European-American beta (Model 2,
Table 12) gives an African-American validity 52% the size of the European-American validity.
If we take the beta of 0.124 in the AA-only sample (Model 1b,
Table 10) as an estimate of the LD-unbiased effect of eduPGS on
g, the
g-score differences due to eduPGS would be 0.124 × 1.89 (i.e., the Cohen’s
d for the African-/European-American eduPGS difference) = 0.23. This implies that 20%–25% of the difference in
g can be accounted for by presently known cognitive ability- and education-related PGS.
Concerns have been raised that the eduPGS computed by Lee et al. [
84] may be biased against non-Europeans due to the inclusion of population-specific variants [
101] (for a more general discussion see [
99]). These population-specific variants would have very low frequency in non-European populations. Following Piffer’s suggestion [
101], as a robustness check, we computed MTAG eduPGS excluding variants with MAF < 0.01 (leaving 7636 overlapping variants) and <0.05 (leaving 7172 overlapping variants) among African lineages. The 1000 Genomes reference samples were used to determine the African MAF. This exclusion had no substantive effect on the eduPGS validity with respect to
g for either African or European-Americans. For SIRE monoracial African-Americans
rMAF ≥
0.01 = 0.112 and
rMAF ≥
0.05 = 0.114.
Theory predicts that, in the absence of countervailing confounds, variants which show concordant as opposed to discordant effects across racial groups, will exhibit higher validity in non-discovery populations (Piffer, personal communication, February 3, 2019; [
90]). This is because variants which show transracially concordant effects are more likely to be causal and also because causal variants, as opposed to variants in LD with causal ones, are more likely to have transethnic predictivity [
89,
102]. These predictions are borne out in this sample. Among European-Americans, the predictivity for concordant MTAG_10k eduPGS was higher (
rconcordant = 0.223 vs.
rdiscordant = 0.145), and among African-Americans, it was even more so (
rconcordant = 0.223 vs.
rdiscordant = -0.128). Similarly, when we grouped variants by the
p value for the interaction between race and the effect on g (with higher
p values signifying less discordance in effect), among African-Americans, the variants with higher
p values were substantially more predictive of g (
rhigh_P = 0.141 vs.
rlow_P = 0.035), while among European-Americans, this was not the case (
rhigh_P = 0.265 vs.
rlow_P = 0.263). Cross-validation confirmed that the concordant PGS had higher predictive validity among the non-discovery population. However, the concordant PGS subset did not seem to have higher predictivity, based on cross-validation, than the combined set. The identical validity for concordant PGS could not be sustained in cross-validation. Thus, we do not use these disaggregated PGS in further analysis.


