Filling in the Gaps: The Association between Intelligence and Both Color and Parent-Reported Ancestry in the National Longitudinal Survey of Youth 1997


Abstract
1. Introduction
A great majority of the literature focuses on the intelligence gap between Blacks and Whites. Therefore, more research is needed on intragroup differences among Blacks and intelligence (Averhart and Bigler, 1997) [14]. Results from this research have huge implications for the skin tone hierarchy in the African American community. Despite the gap in the literature …
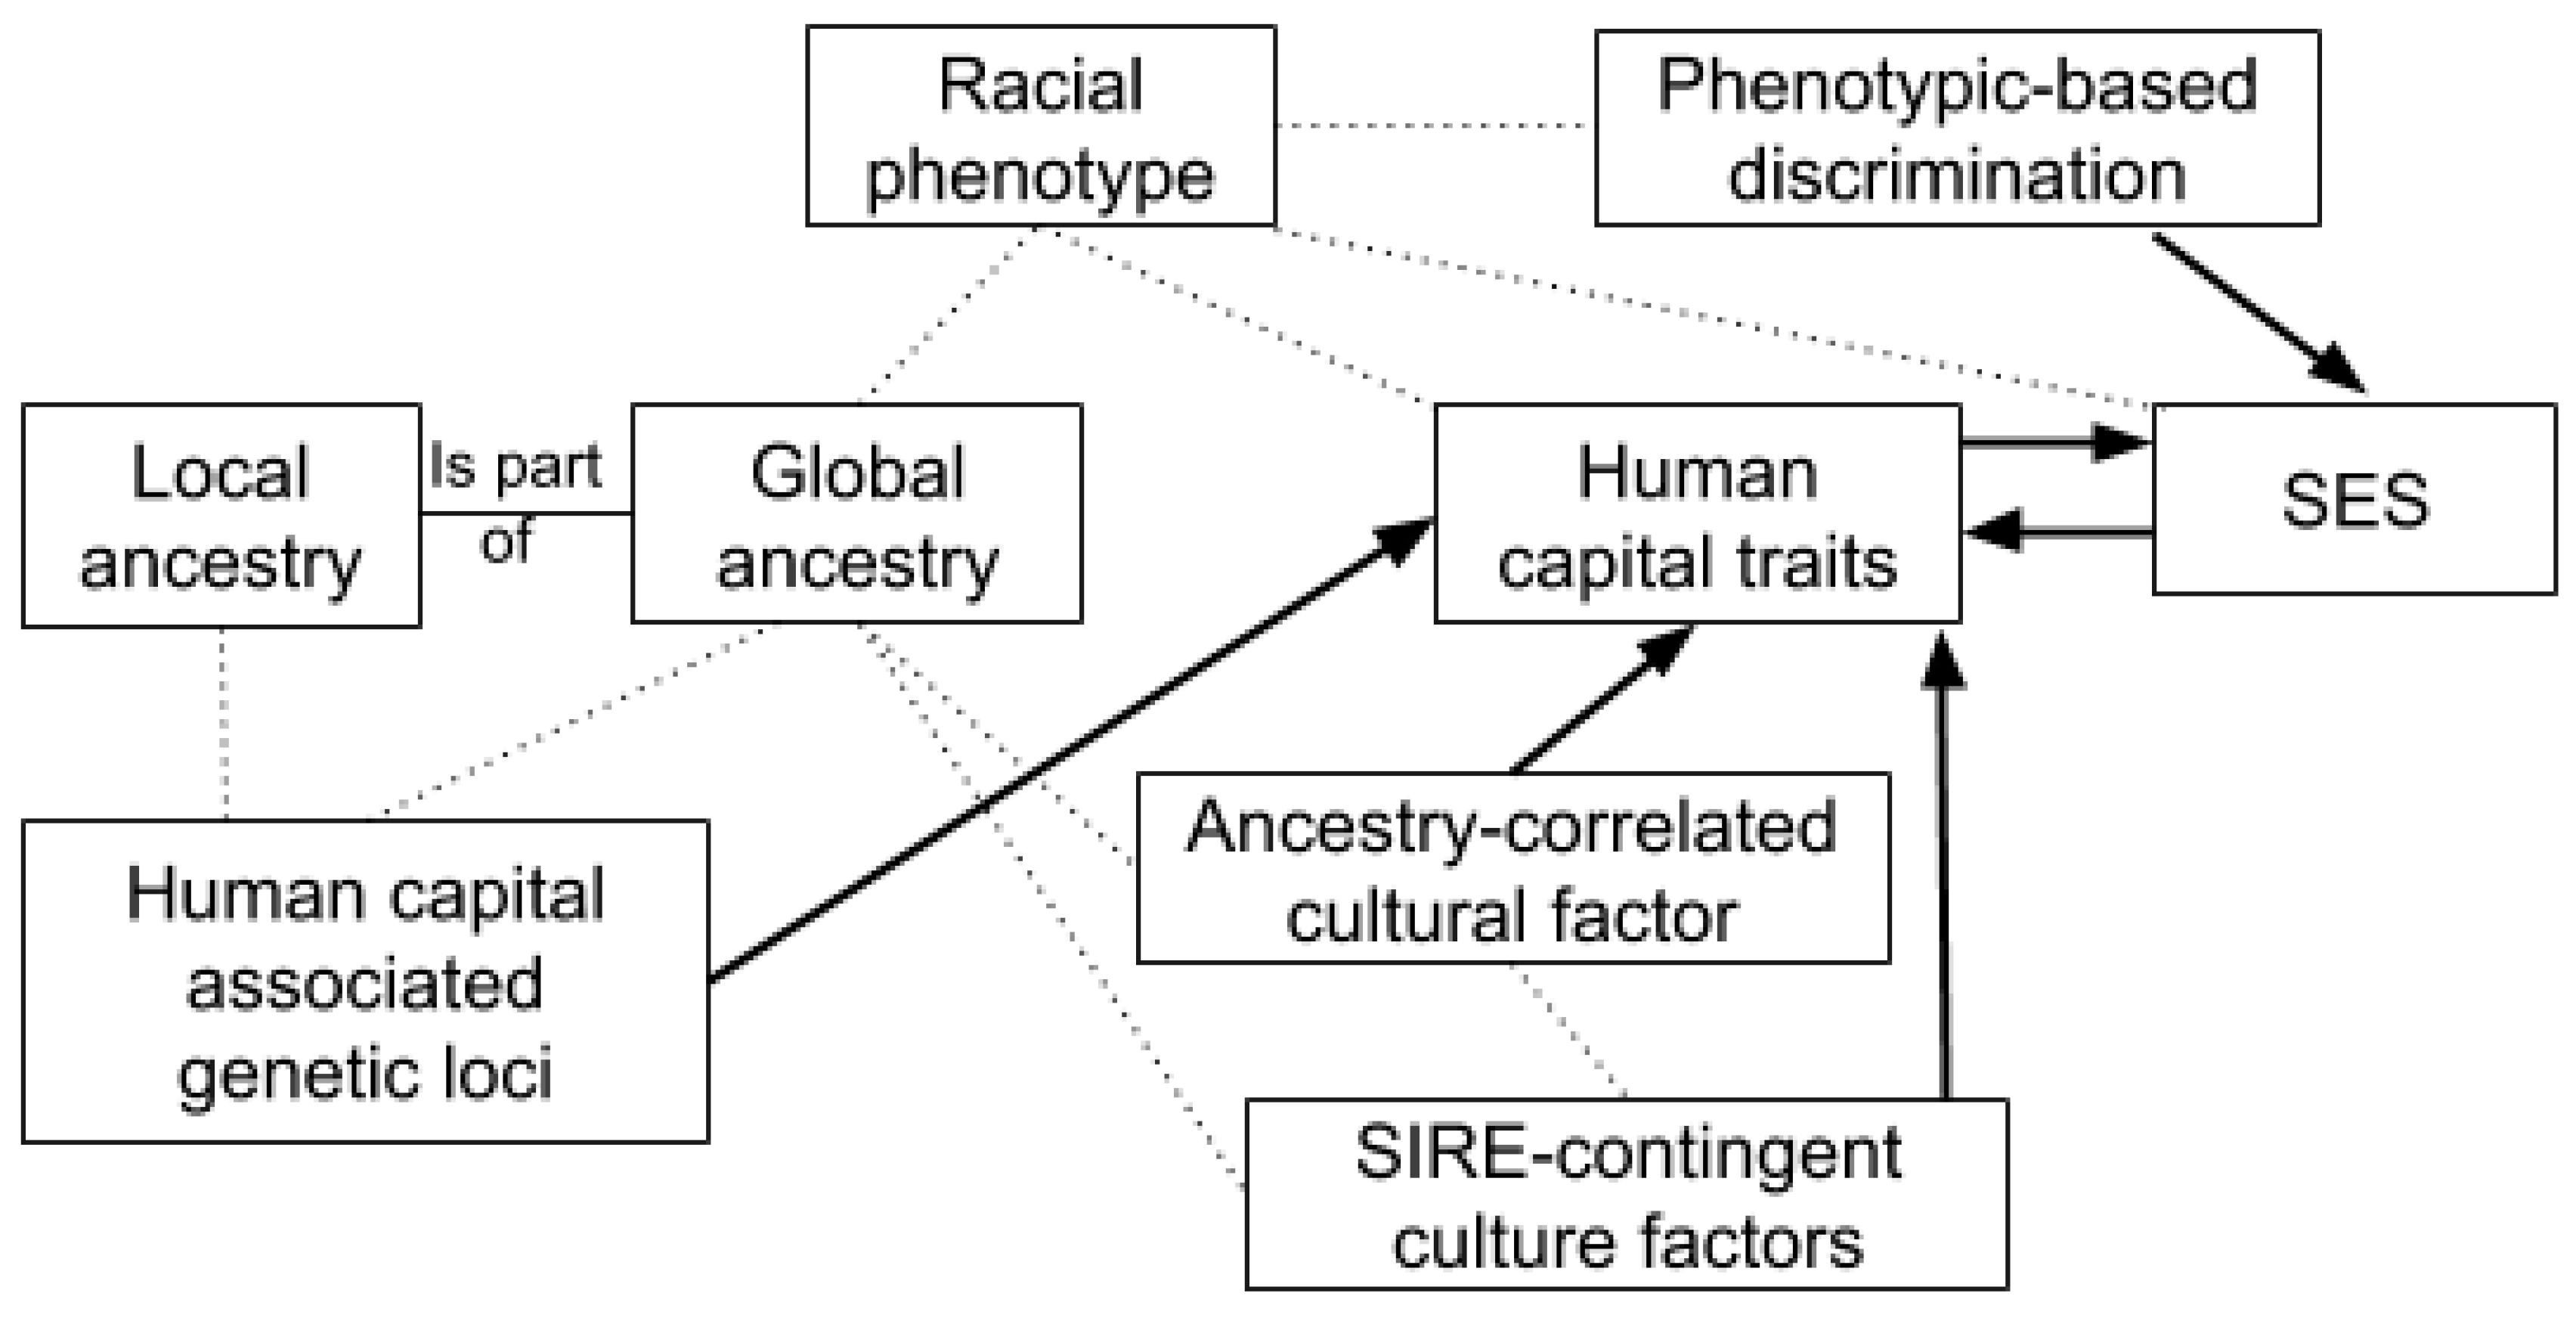
- There is an association between racial phenotype and cognitive ability within self-identified race/ethnic (SIRE) groups.
- There is an association between reported ancestry and cognitive ability within SIREs.
- The associations above are mediated by the relationship between genetic ancestry and cognitive ability.
- The associations between phenotype and cognitive ability can be identified prior to completing formal education and entering the labor market, since they are not a result of differences in educational attainment nor are they a result of labor market discrimination.
- The associations will be larger on the better measures of general cognitive ability, since the differences between racial groups are largely a result of g, which is the predictive backbone of tests of cognitive ability.
- The associations will not appear, to a substantial degree, between full siblings within families, which differ little in ancestry and not at all in shared environment. The potential for linkage between ancestry and skin color implies that there may be a small within-family residual effect. (Briefly: the simpler the genetic architecture of the traits, the less genetic linkage there will be between traits, and the lower the genetic correlation will be among full-siblings; skin color is a relatively simple, but still complex trait.)
- In a multivariate model with genetic ancestry, cognitive ability, color, and other race-related phenotypes, the latter will show little independent relation with cognitive ability. This is because color and other race-related phenotype act as proxies of ancestry, not vice versa.
- Admixture mapping will not show an association between genomic regions associated with conspicuous race-related phenotype and cognitive ability, as would be the case were the colorism model correct. However, it will still show a relationship between admixture and cognitive ability.
2. Materials and Methods
2.1. Identified Race and Parent-Reported Ancestry
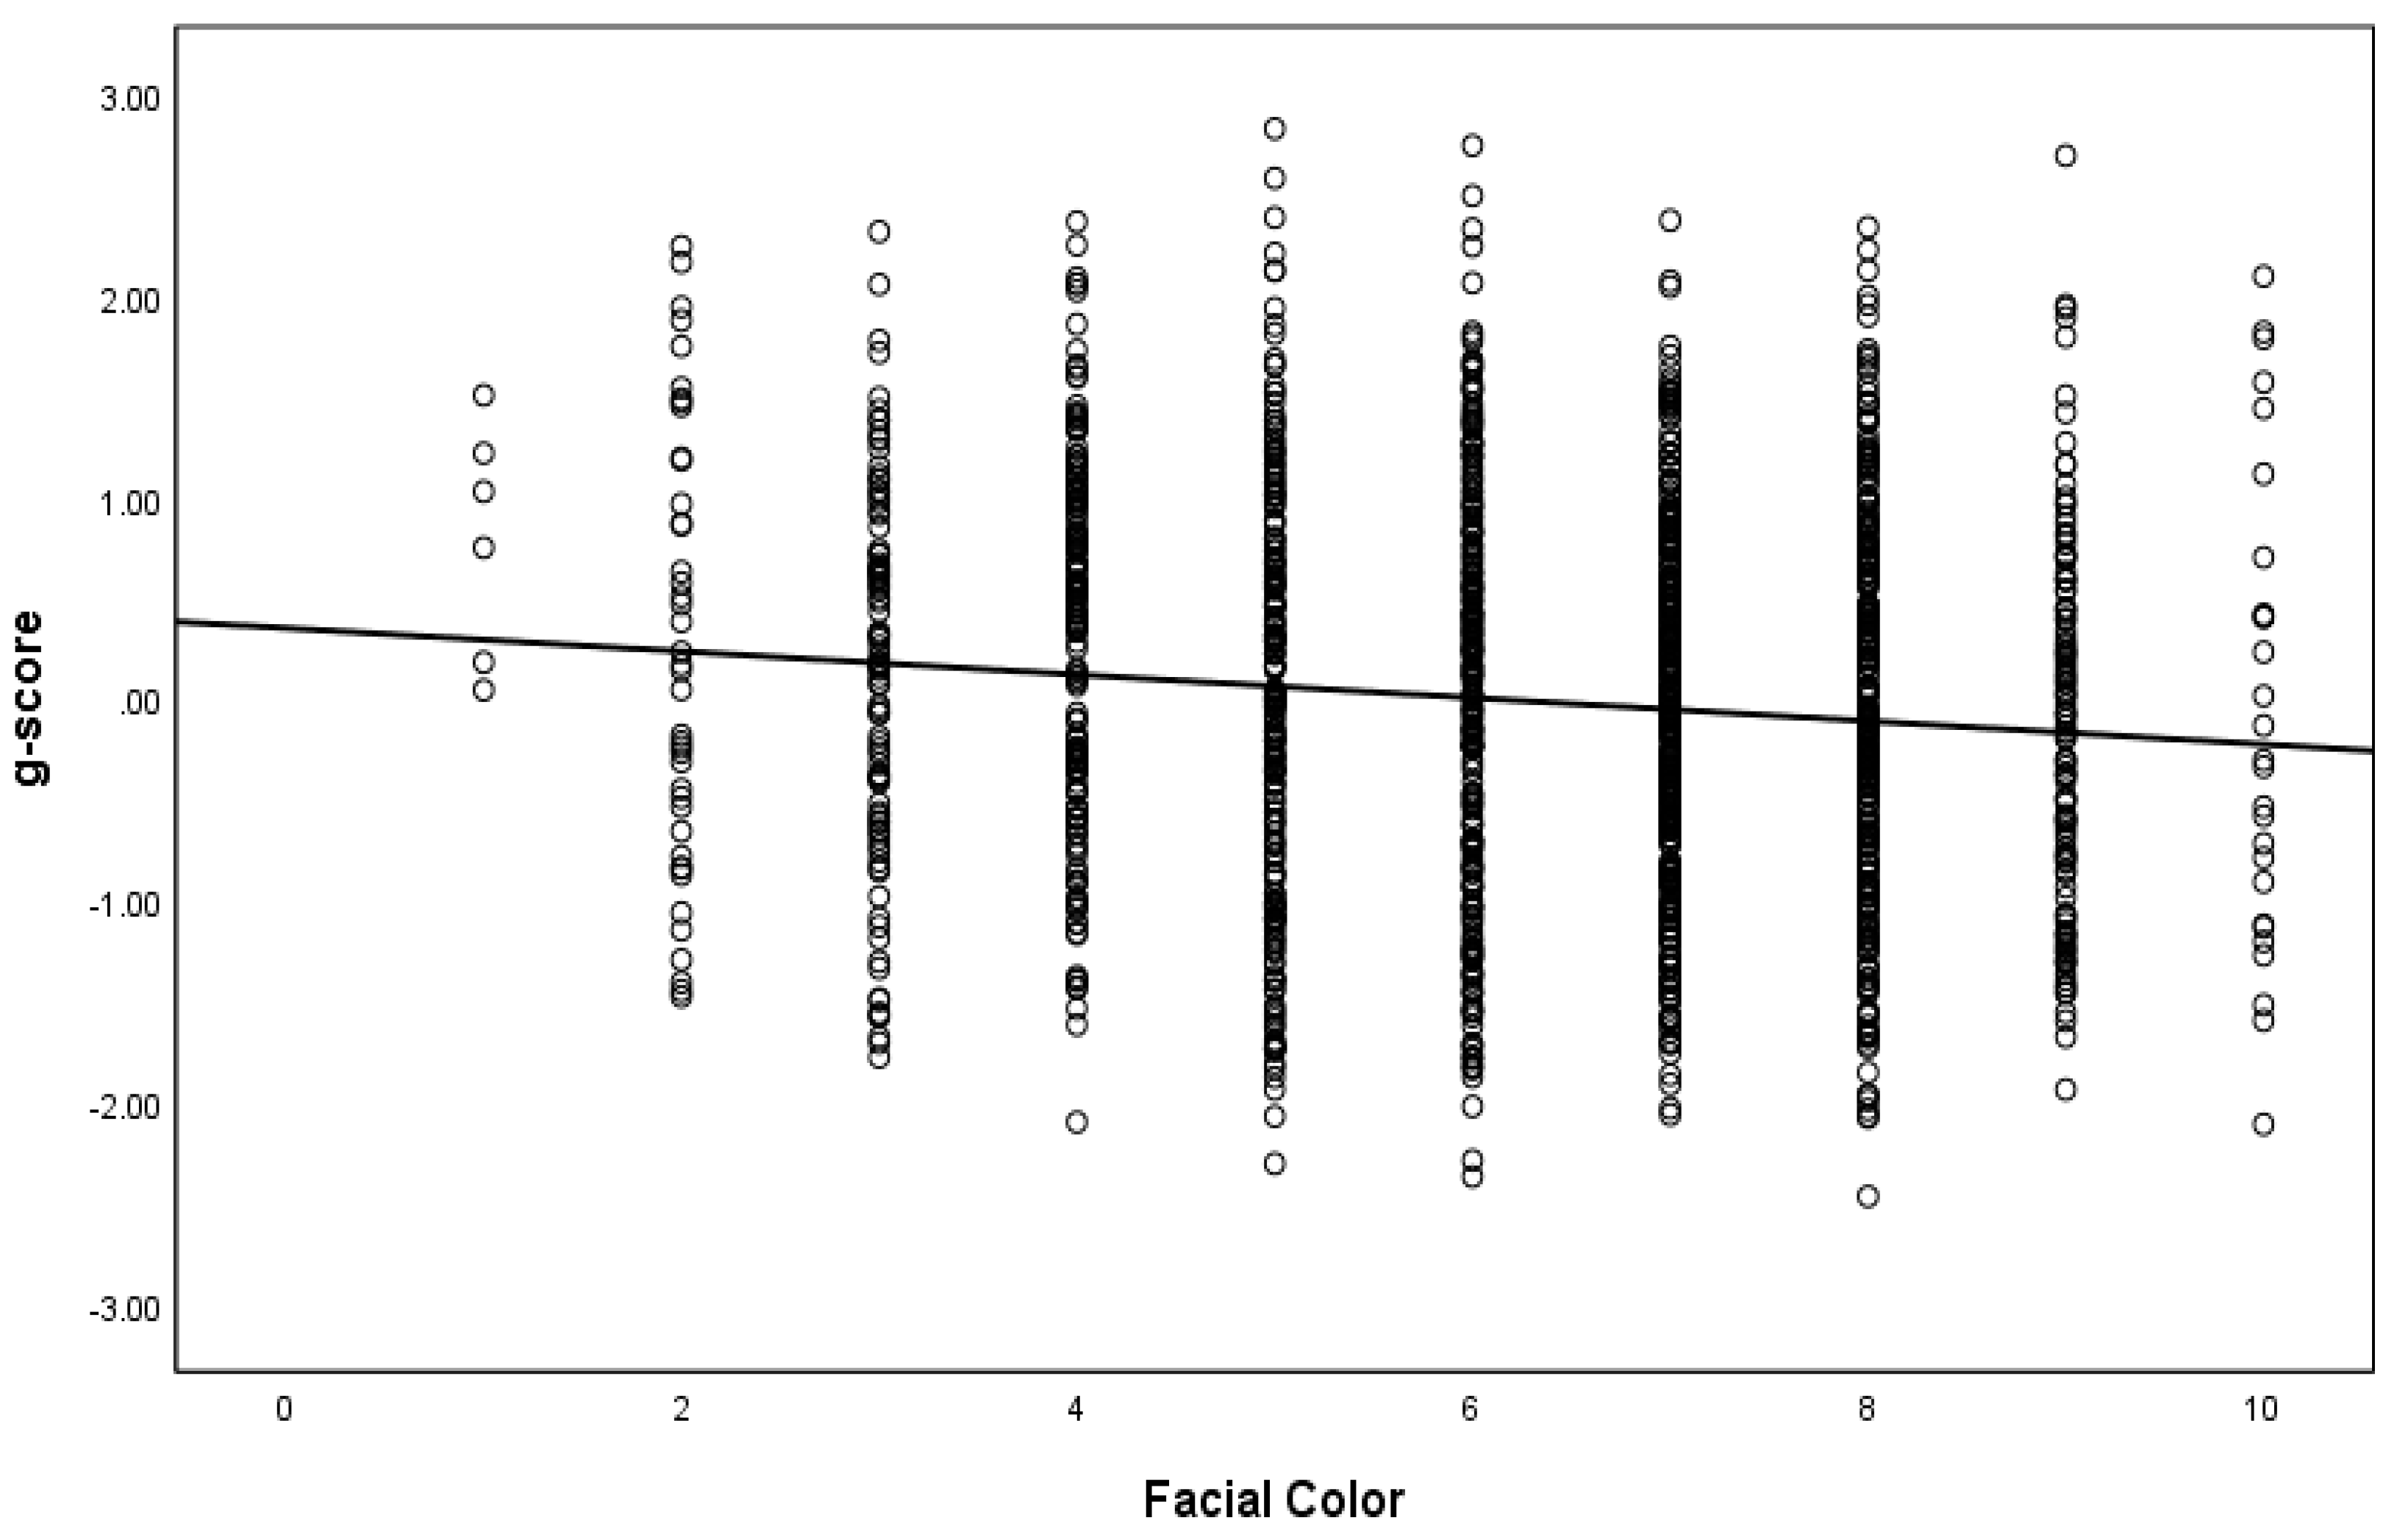
2.2. Color
2.3. Cognitive Ability
- General Science (Science/Technical): Knowledge of physical and biological sciences.
- Arithmetic Reasoning (Math): Ability to solve arithmetic word problems.
- Word Knowledge (Verbal): Ability to select the correct meaning of words presented in context and to identify the best synonym for a given word.
- Paragraph Comprehension (Verbal): Ability to obtain information from written passages.
- Numerical Operations (Speed): Ability to perform arithmetic computations.
- Coding Speed (Speed): Ability to use a key in assigning code numbers to words.
- Auto Information (Science/Technical): Knowledge of automobile technology.
- Shop Information (Science/Technical): Knowledge of tools and shop terminology and practices.
- Math Knowledge (Math): Knowledge of high school mathematics principles.
- Mechanical Comprehension (Science/Technical): Knowledge of mechanical and physical principles.
- Electronics Information (Science/Technical): Knowledge of electricity and electronics.
- Assembling Objects (Spatial): Ability to determine how an object will look when its parts are put together.
2.4. Sibling Relations
2.5. Demographic Controls in the Regression Analysis
3. Analytic Plan
3.1. Mean Differences
3.2. Method of Correlated Vectors
3.3. Full African American Sample Multivariate Analysis for Color and Cognitive Ability
3.4. Sibling Sample Multivariate Analysis for Color and Cognitive Ability
3.5. Differential Regression to the Mean
3.6. MGCFA Assessment of MI and Spearman’s Hypothesis
- Factor I (Technical): SI + AI + EI + MC + GS
- Factor II (Mathematical): NO + CS + MK
- Factor III (Verbal/Knowledge): PC + WK + GS
- Factor IV (Spatial): AR + AO + MC
3.7. Full Sibling Differences in Intraclass Correlations and Absolute Mean Differences
4. Results
4.1. Mean Differences
4.2. Multivariate Analysis for Color among Black Americans
4.3. Method of Correlated Vectors
4.4. Regression Analyses
4.5. Analysis of Full-Sibling Differential Regression to the Mean
4.6. Assessment of Measurement Invariance
4.7. Full Sibling Differences in Intraclass Correlations and Absolute Differences
5. Conclusions
Author Contributions
Funding
Conflicts of Interest
References
- Kirkegaard, E.O.W.; Wang, M.; Fuerst, J. Biogeographic Ancestry and Socioeconomic Outcomes in the Americas: A Meta-analysis. Mank. Q. 2017, 573, 398–427. [Google Scholar]
- Hunter, M. The Persistent Problem of Colorism: Skin Tone, Status, and Inequality. Sociol. Compass 2007, 1, 237–254. [Google Scholar] [CrossRef]
- Rushton, J.P.; Jensen, A.R. Thirty years of research on race differences in cognitive ability. Psychol. Public Policy Law 2005, 11, 235–294. [Google Scholar] [CrossRef]
- Walker, A. If the Present Looks Like the Past, What Does the Future Look Like? Heresies A Fem. Publ. Art Polit. 1983, 4, 56–59. [Google Scholar]
- Dixon, A.R.; Telles, E.E. Skin Color and Colorism: Global Research, Concepts, and Measurement. Annu. Rev. Sociol. 2017, 43, 405–424. [Google Scholar] [CrossRef]
- Marira, T.D.; Mitra, P. Colorism: Ubiquitous Yet Understudied. Ind. Organ. Psychol. 2013, 6, 103–107. [Google Scholar] [CrossRef]
- Monk, E.P., Jr. The Cost of Color: Skin Color, Discrimination, and Health among African-Americans. Am. J. Sociol. 2015, 121, 396–444. [Google Scholar] [CrossRef]
- Hailu, S. Skin-Tone and Academic Achievement Among 5-year-old Mexican Children. Master’s Thesis, Virginia Commonwealth University Richmond, Richmond, VA, USA, 2018. [Google Scholar]
- Conley, D.; Fletcher, J. What Both the Left and Right Get Wrong About Race. Nautilus, Issue 048. Available online: http://nautil.us/issue/48/chaos/what-both-the-left-and-right-getwrong-about-race (accessed on 3 March 2019).
- Fuerst, J.; Kirkegaard, E.O. Admixture in the Americas: Regional and National Differences. Mank. Q. 2016, 56, 255. [Google Scholar]
- Conley, D.; Fletcher, J. The Genome Factor: What the Social Genomics Revolution Reveals About Ourselves, Our History, and the Future; Princeton University Press: Princeton, NJ, USA, 2017. [Google Scholar]
- Fuerst, J.; Kirkegaard, E.O. The Genealogy of Differences in the Americas. Mank. Q. 2016, 56, 425. [Google Scholar]
- Huddleston, D.A.; Montgomery, L. A Scholarly Response to Shades of Black. In Black in America: A Scholarly Response to the CNN Documentary; Lewis, C., Jackson, J., Eds.; Center for African American Research and Policy: Madison, WI, USA, 2010; pp. 63–76. [Google Scholar]
- Averhart, C.J.; Bigler, R.S. Shades of Meaning: Skin Tone, Racial Attitudes, and Constructive Memory in African American Children. J. Exp. Child Psychol. 1997, 67, 363–388. [Google Scholar] [CrossRef]
- Lynn, R. Race Differences in Intelligence, Revised ed.; Washington Summit: Augusta, GA, USA, 2015. [Google Scholar]
- Kirkegaard, E.O.W.; Woodley of Menie, M.A.; Williams, R.; Fuerst, J.; Meisenberg, G. Biogeographic ancestry, cognitive ability, and socioeconomic outcomes. Psych 2019, 1, 1–25. [Google Scholar] [CrossRef]
- Warne, R. Genetic Ancestry and Cognitive Ability. 2019. Manuscript submitted for publication. [Google Scholar]
- Lynn, R. Skin Color and Intelligence in African Americans. Popul. Environ. 2002, 23, 365–375. [Google Scholar] [CrossRef]
- Fuerst, J.G.; Lynn, R.; Kirkegaard, E.O.W. The Effect of Biracial Status and Color on Crystallized Intelligence in the US-Born African–European American Population. Psych 2019, 1, 44–54. [Google Scholar] [CrossRef]
- Kreisman, D.; Rangel, M.A. On the Blurring of the Color Line: Wages and Employment for Black Males of Different Skin Tones. Rev. Econ. Stat. 2015, 97, 1–13. [Google Scholar] [CrossRef]
- Hannon, L.; DeFina, R. Reliability Concerns in Measuring Respondent Skin Tone by Interviewer Observation. Public Opin. Q. 2016, 80, 534–541. [Google Scholar] [CrossRef]
- Scarr, S. Race, Social Class, and Individual Differences in IQ: New Studies of Old Issues; Erlbaum: Hillsdale, NJ, USA, 1981. [Google Scholar]
- Massey, D.S.; Martin, J.A. The NIS Skin Color Scale; Office of Population Research, Princeton University: Princeton, NJ, USA, 2003. [Google Scholar]
- Moreno, K.E.; Segall, D.O. Reliability and Construct Validity of CAT-ASVAB. In Computerized Adaptive Testing: From Inquiry to Operation; Sands, W.A., Waters, B.K., McBride, J.R., Eds.; American Psychological Association: Washington, DC, USA, 1997; Chapter 17; pp. 169–174. [Google Scholar]
- Jensen, A.R. The G-Factor: The Science of Mental Ability; Praeger: Westport, CT, USA, 1998; Volume 648. [Google Scholar]
- Hartmann, P.; Kruuse, N.H.S.; Nyborg, H. Testing the Cross-racial Generality of Spearman’s Hypothesis in Two Samples. Intelligence 2007, 35, 47–57. [Google Scholar] [CrossRef]
- Jensen, A.R. Uses of Sibling Data in Educational and Psychological Research. Am. Educ. Res. J. 1980, 17, 153–170. [Google Scholar] [CrossRef]
- Jensen, A.R.; Johnson, F.W. Race and Sex Differences in Head Size and IQ. Intelligence 1994, 18, 309–333. [Google Scholar] [CrossRef]
- Schoenemann, P.T.; Budinger, T.F.; Sarich, V.M.; Wang, W.S.Y. Brain Size Does Not Predict General Cognitive Ability within Families. Proc. Natl. Acad. Sci. USA 2000, 97, 4932–4937. [Google Scholar] [CrossRef]
- Nagoshi, C.T.; Phillips, K.; Johnson, R.C. Between-Versus Within-Family Factor Analyses of Cognitive Abilities. Intelligence 1987, 11, 305–316. [Google Scholar] [CrossRef]
- Murray, C. The Secular Increase in IQ and Longitudinal Changes in the Magnitude of the Black-White Difference: Evidence from the NLSY. In Proceedings of the Behavior Genetics Association Meeting, Vancouver, BC, Canada, 4 July 1999. [Google Scholar]
- Van De Schoot, R.; Kluytmans, A.; Tummers, L.; Lugtig, P.; Hox, J.; Muthén, B. Facing off with Scylla and Charybdis: A Comparison of Scalar, Partial, and the Novel Possibility of Approximate Measurement Invariance. Front. Psychol. 2013, 4, 770. [Google Scholar] [CrossRef]
- Jensen, A.R. Spearman’s hypothesis. In Intelligence and Personality: Bridging the Gap in Theory and Measurement; Collis, J.M., Messick, S.J., Schiefele, U., Eds.; Erlbaum: Mahwah, NJ, USA, 2001. [Google Scholar]
- Dragt, J. Causes of Group Differences Studied with the Method of Correlated Vectors: A Psychometric Meta-analysis of Spearman’s Hypothesis. Master’s Thesis, University of Amsterdam, Amsterdam, The Netherlands, 2010. [Google Scholar]
- Frisby, C.L.; Beaujean, A.A. Testing Spearman’s Hypotheses Using a Bi-factor Model with WAIS-IV/WMS-IV Standardization Data. Intelligence 2015, 51, 79–97. [Google Scholar] [CrossRef]
- Bryc, K.; Durand, E.Y.; Macpherson, J.M.; Reich, D.; Mountain, J.L. The Genetic Ancestry of African American, Latinos, and European Americans across the United States. Am. J. Hum. Genet. 2015, 96, 37–53. [Google Scholar] [CrossRef]
- Becker, G. Correcting the Point-Biserial Correlation for Attenuation Owing to Unequal Sample Size. J. Exp. Educ. 1986, 55, 5–8. [Google Scholar] [CrossRef]
- Kittles, R.A.; Santos, E.R.; Oji-Njideka, N.S.; Bonilla, C. Race, Skin Color and Genetic Ancestry: Implications for Biomedical Research on Health Disparities. Calif. J. Health Promot. 2007, 5, 9–23. [Google Scholar]
- Jensen, A.R. The Nature of the Black–White Difference on Various Psychometric Tests: Spearman’s Hypothesis. Behav. Brain Sci. 1985, 8, 193–219. [Google Scholar] [CrossRef]
- Dolan, C.V. Investigating Spearman’s Hypothesis by Means of Multi-Group Confirmatory Factor Analysis. Multivar. Behav. Res. 2000, 35, 21–50. [Google Scholar] [CrossRef]
- Dolan, C.V.; Hamaker, E.L. Investigating Black–White Differences in Psychometric IQ: Multi-Group Confirmatory Factor Analyses of the WISC-R and K-ABC and a Critique of the Method of Correlated Vectors. Adv. Psychol. Res. 2001, 6, 31–59. [Google Scholar]
- Mardia, K.V. 9 Tests of Univariate and Multivariate Normality. Handb. Stat. 1980, 1, 279–320. [Google Scholar]
- Kankainen, A.; Taskinen, S.; Oja, H. On Mardia’s Tests of Multinormality. In Theory and Applications of Recent Robust Methods; Birkhäuser: Basel, Switzerland, 2004; pp. 153–164. [Google Scholar]
- Rosseel, Y. Lavaan: An R Package for Structural Equation Modeling. J. Stat. Softw. 2012, 48, 1–36. [Google Scholar] [CrossRef]
- Fan, X.; Sivo, S.A. Using Δ Goodness-of-Fit Indexes in Assessing Mean Structure Invariance. Struct. Equ. Model. A Multidiscip. J. 2009, 16, 54–69. [Google Scholar] [CrossRef]
- Hu, L.T.; Bentler, P.M. Fit Indices in Covariance Structure Modeling: Sensitivity to Underparameterized Model Misspecification. Psychol. Methods 1998, 3, 424. [Google Scholar] [CrossRef]
- Chen, F.F. Sensitivity of Goodness of Fit Indexes to Lack of Measurement Invariance. Struct. Equ. Model. A Multidiscip. J. 2007, 14, 464–504. [Google Scholar] [CrossRef]
- Khojasteh, J.; Lo, W.J. Investigating the Sensitivity of Goodness-of-Fit Indices to Detect Measurement Invariance in a Bifactor Model. Struct. Equ. Model. A Multidiscip. J. 2015, 22, 531–541. [Google Scholar] [CrossRef]
- West, S.G.; Finch, J.F.; Curran, P.J. Structural Equation Models with Nonnormal Variables: Problems and Remedies. In Structural Equation Modeling: Issues, Concepts, and Applications; Hoyle, R.H., Ed.; Sage: Newbury Park, CA, USA, 1995; pp. 56–75. [Google Scholar]
- Korkmaz, S.; Goksuluk, D.; Zararsiz, G. MVN: An R package for Assessing Multivariate Normality. R J. 2014, 6, 151–162. [Google Scholar] [CrossRef]
- Nyborg, H.; Jensen, A.R. Occupation and Income Related to Psychometric g. Intelligence 2001, 29, 45–55. [Google Scholar] [CrossRef]
- Flynn, J.R. Reservations about Rushton. Psych 2019, 1, 35–43. [Google Scholar] [CrossRef]
- Te Nijenhuis, J.; Jongeneel-Grimen, B.; Armstrong, E.L. Are Adoption Gains on the g-factor? A meta-analysis. Personal. Individ. Differ. 2015, 73, 56–60. [Google Scholar] [CrossRef]
- te Nijenhuis, J.; Jongeneel-Grimen, B.; Kirkegaard, E.O. Are Headstart Gains on the g-factor? A meta-analysis. Intelligence 2014, 46, 209–215. [Google Scholar] [CrossRef]
- Te Nijenhuis, J.; van Vianen, A.E.; van der Flier, H. Score Gains on g-loaded tests: No g. Intelligence 2007, 35, 283–300. [Google Scholar] [CrossRef]
- Te Nijenhuis, J.; Van Der Flier, H. Is the Flynn Effect on g?: A Meta-analysis. Intelligence 2013, 41, 802–807. [Google Scholar] [CrossRef]
- Woodley of Menie, M.A.; te Nijenhuis, J.; Shibaev, V.; Li, M.; Smit, J. Are the Effects of Lead Exposure Linked to the g Factor? A Meta-analysis. Personal. Individ. Differ. 2019, 137, 184–191. [Google Scholar] [CrossRef]
- Flynn, J.R.; te Nijenhuis, J.; Metzen, D. The g Beyond Spearman’s g: Flynn’s Paradoxes Resolved Using Four Exploratory Meta-analyses. Intelligence 2014, 44, 1–10. [Google Scholar] [CrossRef]
- Woodley of Menie, M.A.; Fernandes, H.B.; Hopkins, W.D. The More g-loaded, the More Heritable, Evolvable, and Phenotypically Variable: Homology with Humans in Chimpanzee Cognitive Abilities. Intelligence 2015, 50, 159–163. [Google Scholar] [CrossRef]
- Te Nijenhuis, J.; Choi, Y.Y.; van den Hoek, M.; Valueva, E.; Lee, K.H. Spearman’s hypothesis tested comparing Korean young adults with various other groups of young adults on the items of the Advanced Progressive Matrices. J. Biosoc. Sci. 2019, 1–38. [Google Scholar] [CrossRef] [PubMed]
- Lubke, G.H.; Dolan, C.V.; Kelderman, H.; Mellenbergh, G.J. On the Relationship between Sources of Within-and Between-Group Differences and Measurement Invariance in the Common Factor Model. Intelligence 2003, 31, 543–566. [Google Scholar] [CrossRef]
- Dalliard, M. The Elusive X-Factor: A Critique of JM Kaplan’s Model of Race and IQ. Open Differ. Psychol. 2014, 27. [Google Scholar] [CrossRef]
- Zou, J.Y.; Park, D.S.; Burchard, E.G.; Torgerson, D.G.; Pino-Yanes, M.; Song, Y.S.; Sankararaman, S.; Halperin, E.; Zaitlen, N. Genetic and Socioeconomic Study of Mate Choice in Latinos Reveals Novel Assortment Patterns. Proc. Natl. Acad. Sci. USA 2015, 112, 13621–13626. [Google Scholar] [CrossRef]
- Norris, E.T.; Rishishwar, L.; Wang, L.; Conley, A.B.; Chande, A.T.; Dabrowski, A.M.; Valderrama-Aguirre, A.E.; Jordan, I.K. Assortative Mating on Ancestry-Variant Traits in Admixed Latin American populations. Front. Genet. 2019, 10, 359. [Google Scholar] [CrossRef] [PubMed]


| Race | N | IQ-metric Score (AFQT Mean; SD) | N | White g | N | Black g | N | Color Mean |
|---|---|---|---|---|---|---|---|---|
| White, no Afr. Ancestry | 3634 | 100.0 (56.61; 27.60) | 3584 | 0.00 (0.97) | 3155 | 1.74 (0.97) | ||
| White w/ Afr. Ancestry | 20 | 91.5 (41.75; 25.88) | 19 | −0.51 (1.10) | 16 | 2.44 (1.63) | ||
| Black w/ Eur. Ancestry | 90 | 92.3 (43.14; 26.10) | 88 | 0.62 (0.98) | 80 | 5.13 (2.07) | ||
| Black, no Afr. Ancestry | 1717 | 83.7 (27.92; 23.43) | 1700 | −0.03 (0.96) | 1776 | 6.25 (1.90) | ||
| Among Blacks: | ||||||||
| Skin Color_1 | 6 | 95.2 (48.13; 15.35) | 6 | 0.79 (0.58) | ||||
| Skin Color_2 | 43 | 87.8 (35.28; 29.04) | 42 | 0.23 (1.08) | ||||
| Skin Color_3 | 95 | 85.2 (30.70; 24.39) | 94 | 0.11 (0.95) | ||||
| Skin Color_4 | 153 | 87.8 (35.18; 25.45) | 152 | 0.27 (0.93) | ||||
| Skin Color_5 | 214 | 84.3 (29.03; 24.81) | 210 | −0.02 (1.04) | ||||
| Skin Color_6 | 258 | 84.5 (29.37; 25.07) | 255 | −0.01 (1.03) | ||||
| Skin Color_7 | 297 | 82.4 (25.70; 21.86) | 296 | −0.09 (0.88) | ||||
| Skin Color_8 | 257 | 83.0 (26.77; 23.07) | 253 | −0.08 (0.98) | ||||
| Skin Color_9 | 122 | 81.5 (24.08; 21.27) | 120 | −0.15 (0.92) | ||||
| Skin Color_10 | 27 | 84.7 (29.80; 29.81) | 27 | −0.08 (1.16) |
| Variable | Mean | SD | N |
|---|---|---|---|
| g | 0.00 | 0.98 | 1455 |
| Color | 6.19 | 1.90 | 1455 |
| Age (in years and months) | 15.45 | 1.43 | 1455 |
| Sex (Male = 1) | 0.45 | 0.50 | 1455 |
| Region (South = 1) | 0.63 | 0.48 | 1455 |
| Interviewer (White = 1) | 0.72 | 0.45 | 1455 |
| Interviewer (Black = 1) | 0.37 | 0.48 | 1455 |
| Interviewer (non-Hispanic = 1) | 0.92 | 0.26 | 1455 |
| European Ancestry (Yes = 1) | 0.05 | 0.21 | 1455 |
| Variable | Model 1 | Model 2 | ||
|---|---|---|---|---|
| B (SE B) | β | B (SE B) | β | |
| (Constant) | 1.099 (0.300) | 1.056 (0.298) | ||
| Color | −0.061 (0.014) | −0.118 * | −0.053 (0.014) | −0.104 * |
| Age (in years and months) | −0.040 (0.018) | −0.059 * | −0.044 (0.018) | 0.064 * |
| Sex (Male = 1) | −0.174 (0.051) | −0.088 * | −0.176 (0.051) | −0.090 * |
| Region (South = 1) | −0.062 (0.054) | −0.031 | −0.044 (0.053) | −0.022 |
| Interviewer (White = 1) | 0.266 (0.078) | 0.121 * | 0.253 (0.078) | 0.115* |
| Interviewer (Black = 1) | −0.015 (0.066) | −0.007 | −0.004 (0.066) | −0.002 |
| Interviewer (non-Hispanic = 1) | −0.187 (0.126) | −0.050 | −0.162 (0.125) | −0.044 |
| White Ancestry | 0.552 (0.122) | 0.118 * | ||
| Observations | 1455 | 1455 |
| ASVAB Subtests | Rel. | Black g | White g | BW D | Afr. Ancestry (Whites) | Eu. Ancestry (Blacks) | Color r | Color β |
|---|---|---|---|---|---|---|---|---|
| General Science | 0.86 | 0.817 | 0.837 | 1.123 | −0.019 | 0.145 | −0.128 | −0.133 |
| Arithmetic Reasoning | 0.89 | 0.815 | 0.847 | 1.010 | −0.030 | 0.099 | −0.106 | −0.116 |
| Word Knowledge | 0.86 | 0.827 | 0.810 | 1.016 | −0.31 | 0.119 | −0.103 | −0.102 |
| Paragraph Comprehension | 0.67 | 0.839 | 0.834 | 0.871 | −0.035 | 0.119 | −0.094 | −0.103 |
| Numerical Operations | 0.79 | 0.681 | 0.603 | 0.405 | −0.027 | 0.056 | −0.047 | −0.061 |
| Coding Speed | 0.81 | 0.530 | 0.580 | 0.488 | −0.036 | 0.051 | −0.039 | −0.060 |
| Auto Information | 0.89 | 0.513 | 0.483 | 0.900 | 0.000 | 0.091 | −0.056 | −0.047 |
| Shop Information | 0.89 | 0.555 | 0.544 | 1.201 | −0.024 | 0.098 | −0.091 | −0.076 |
| Mathematics Knowledge | 0.92 | 0.843 | 0.831 | 0.861 | −0.033 | 0.117 | −0.075 | −0.087 |
| Mechanical Comprehension | 0.80 | 0.739 | 0.793 | 1.169 | −0.025 | 0.122 | −0.104 | −0.107 |
| Electronics Information | 0.74 | 0.778 | 0.742 | 0.928 | −0.031 | 0.104 | −0.115 | −0.105 |
| Assembling Objects | 0.82 | 0.623 | 0.673 | 0.865 | −0.039 | 0.116 | −0.056 | −0.065 |
| White g-Scores | −0.038 | |||||||
| Black g-Scores | 0.137 | −0.112 | −0.118 | |||||
| N | 1788 | 3603 | 3603 to 3667 | 1788 to 1856 | 1455 to 1479 | 1455 to 1479 |
| BW d | Afr. Ancestry (among Whites) | Eur. Ancestry (among Blacks) | Color r (among Blacks) | Color β (among Blacks) | |
|---|---|---|---|---|---|
| BW g | 0.405 | −0.572 | 0.717 * | −0.737 * | −0.877 * |
| White g | −0.593 * | ||||
| Black g | 0.679 * | −0.728 * | −0.850 * |
| Model 1 | Variable | Mean | SD |
|---|---|---|---|
| Between Family, Singleton | g | 0.12 | 0.98 |
| Color | 6.08 | 1.94 | |
| Age | 15.46 | 1.44 | |
| Sex (Male = 1) | 0.43 | 0.50 | |
| Interviewer Race (White = 1) | 0.72 | 0.45 | |
| Model 2 | Variable | Mean | SD |
| Between Family, Full Sibling | g (Average) | −0.16 | 0.89 |
| Color (Average) | 6.24 | 1.63 | |
| Age (Average in years and months) | 15.45 | 0.88 | |
| Sex (Both Male = 1) | 0.26 | 0.44 | |
| Sex (Both Female = 1) | 0.30 | 0.46 | |
| Interviewer (Both White = 1) | 0.65 | 0.48 | |
| Interviewer (Both non-White = 1) | 0.21 | 0.41 | |
| Model 3 Within Family, Full Sibling | g (Difference) | 0.17 | 0.98 |
| Color (Difference) | −0.16 | 1.97 | |
| Age (Difference in years and months) | 1.76 | 1.26 | |
| Sex (Same Sex = 1) | 0.56 | 0.50 | |
| Interviewer (Same race = 1) | 0.86 | 0.35 |
| Variable | Model 1 (Between) | |
|---|---|---|
| B (SE B) | β | |
| (Constant) | 0.592 (0.387) | |
| Color | −0.077 (0.018) | −0.153 * |
| Age (in years and months) | −0.014 (0.024) | −0.020 |
| Sex (Male = 1) | 0.034 (0.069) | 0.017 |
| Interviewer Race (White = 1) | 0.265 (0.077) | 0.121 * |
| Observations | 814 |
| Variable | Model 2 (Between, Full Sibling) | Model 3 (Within, Full Sibling) | ||
|---|---|---|---|---|
| B (SE B) | β | B (SE B) | β | |
| (Constant) | 0.673 (1.072) | |||
| Color (average) | −0.097 (0.037) | −0.176 * | ||
| Age (average) | −0.018 (0.067) | −0.018 | ||
| Sex (Both Male = 1) | 0.083 (0.147) | 0.041 | ||
| Sex (Both Female = 1) | 0.153 (0.142) | 0.079 | ||
| Interviewer Race (Both White = 1) | 0.029 (0.175) | 0.016 | ||
| Interviewer Race (Both non-White = 1) | −0.202 (0.206) | −0.092 | ||
| (Constant) | 0.015 (0.213) | |||
| Color (difference) | 0.013 (0.033) | 0.027 | ||
| Age (difference) | 0.009 (0.053) | 0.011 | ||
| Sex (Same Sex = 1) | 0.114 (0.134) | 0.058 | ||
| Interviewer Race (Same Race = 1) | 0.088 (0.190) | 0.032 | ||
| Observations | 225 | 225 |
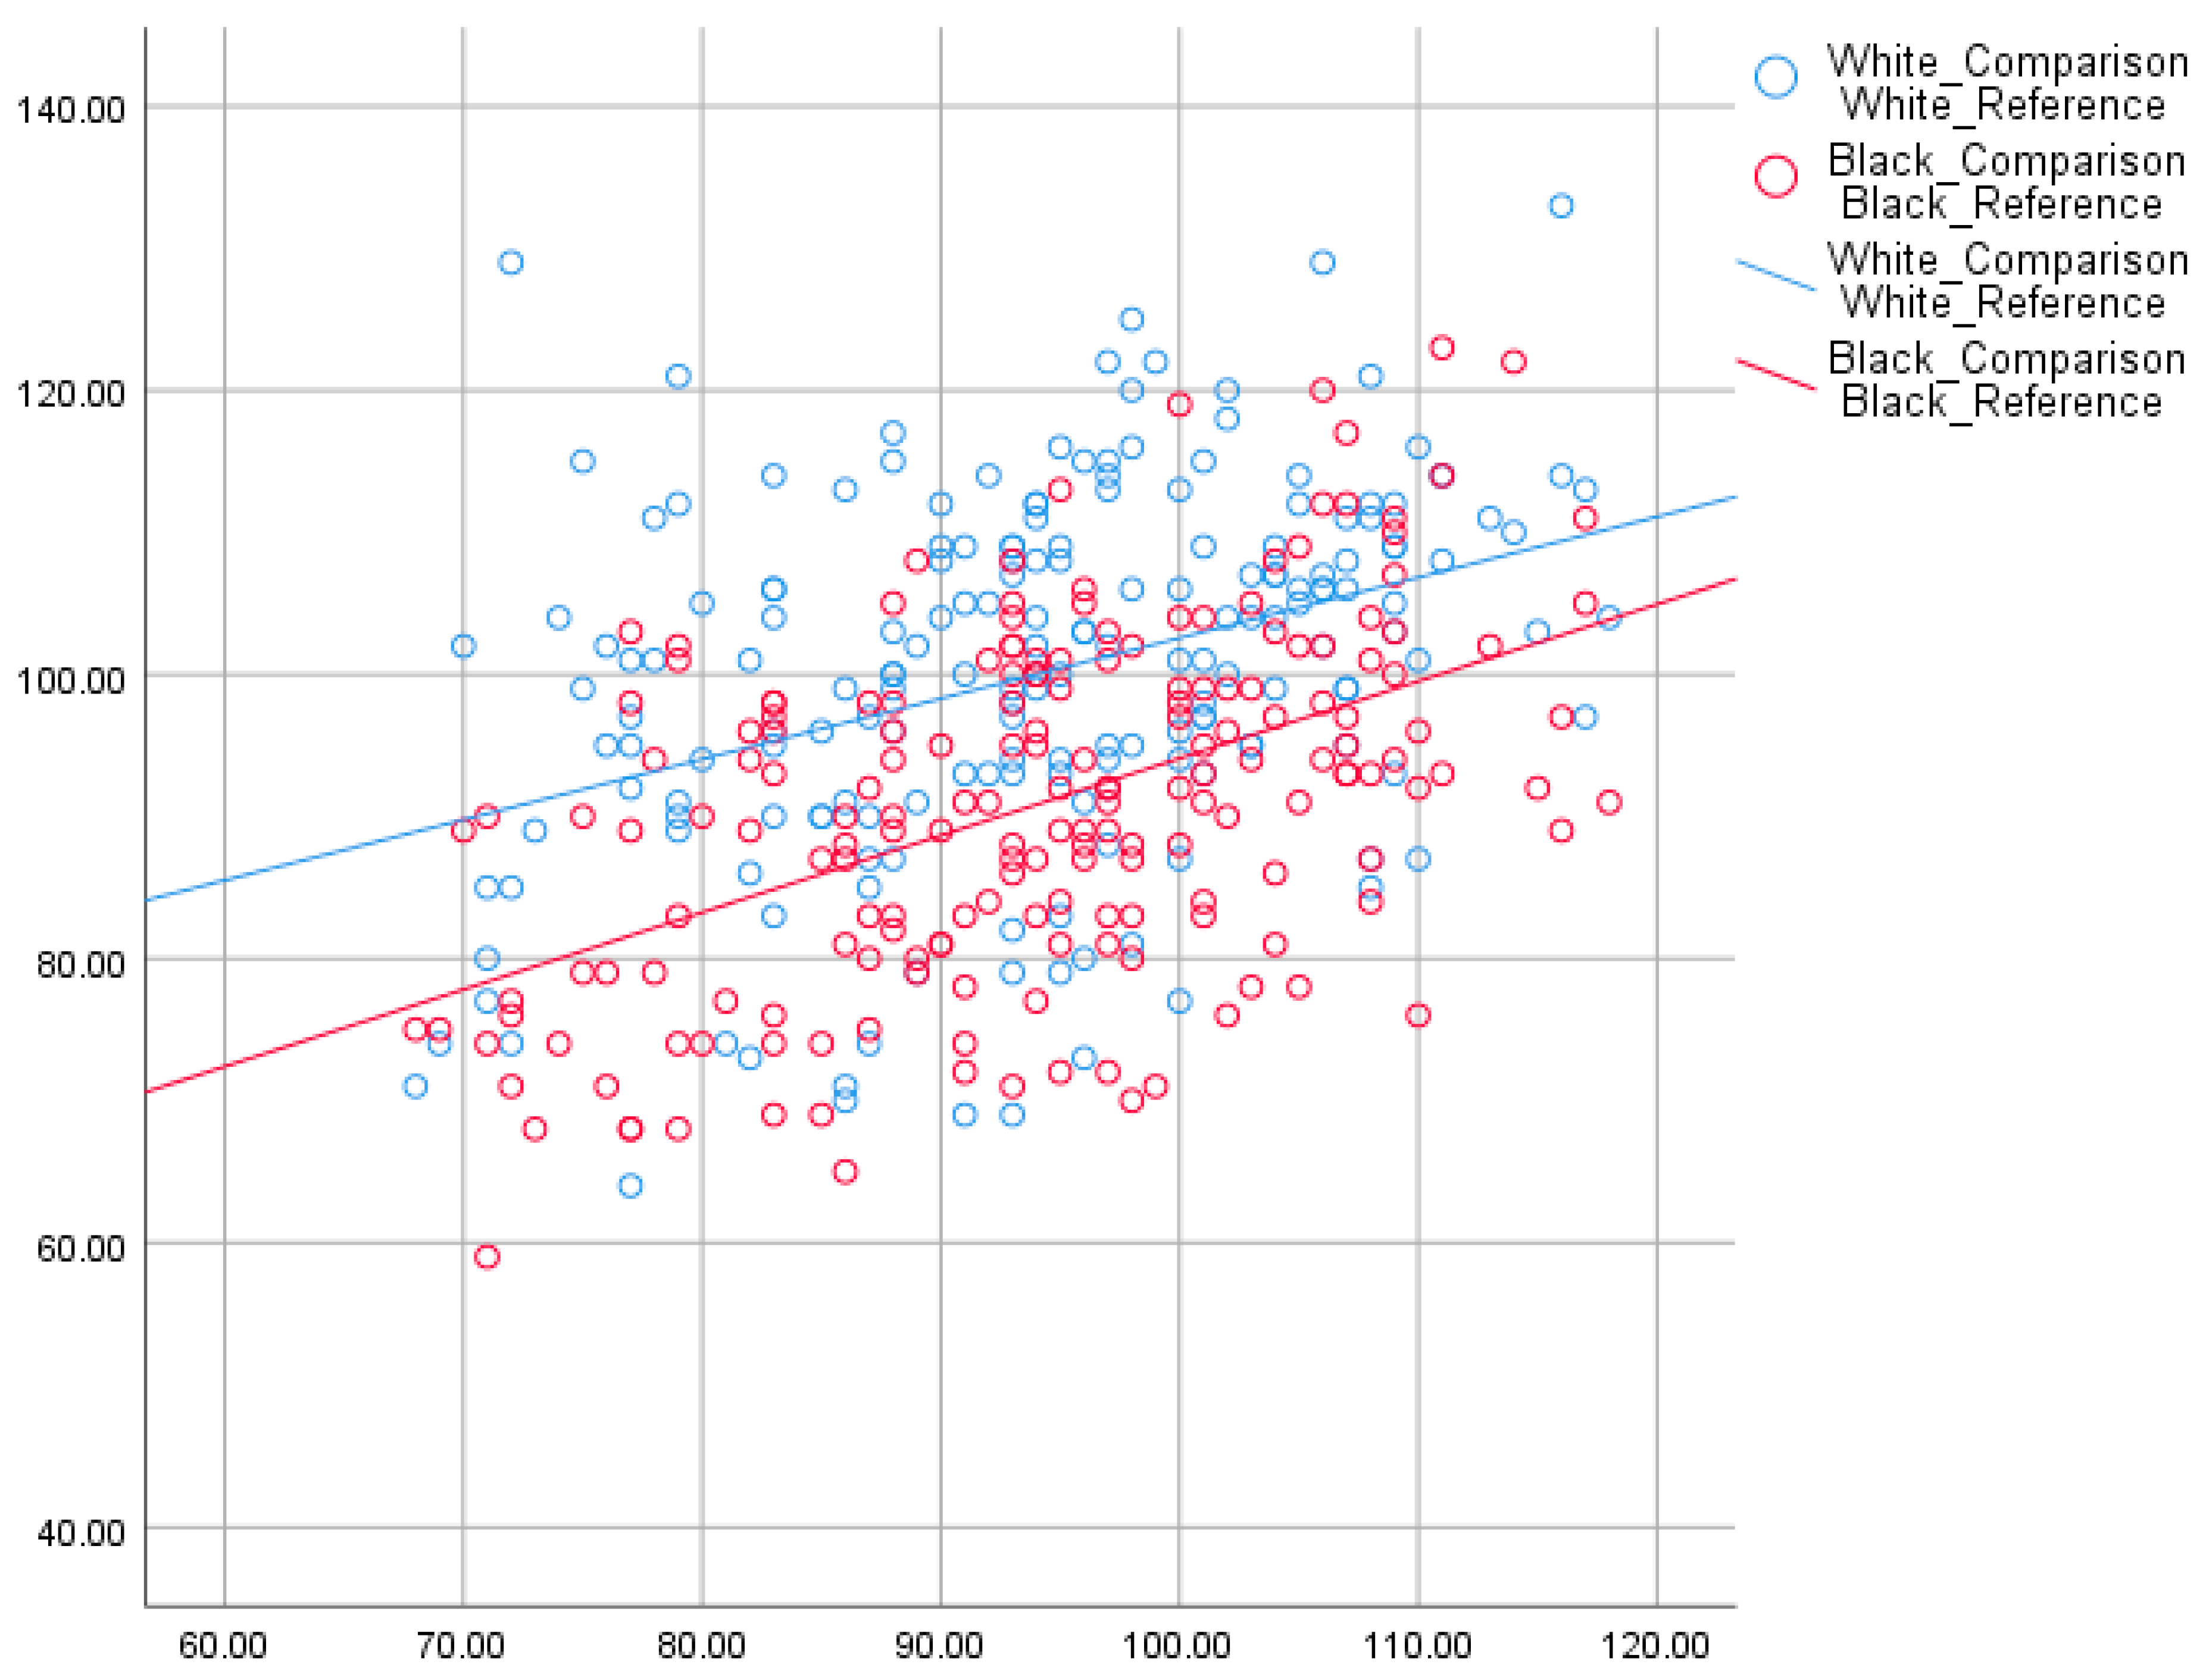
| Sample | N | Reference Sibling | Comparison Sibling | ||||
|---|---|---|---|---|---|---|---|
| White | Black | Difference | White | Black | Difference | ||
| Total Sibling Sample | 694 (w) | 105.6 | 88.2 | 17.3 | 105.6 | 88.1 | 17.5 |
| 301 (b) | |||||||
| Sample Matched for g | 194 | 94.0 | 94.0 | 0 | 100.0 | 90.9 | 9.2 |
| Variable | Model 1 (Between) | ||
|---|---|---|---|
| B (SE B) | β | P-value | |
| (Constant) | 39.855 (6.799) | 0.000 | |
| Reference_Sibling | 0.542 (0.072) | 0.460 | 0.000 |
| Race | 20.067 (9.615) | 0.745 | 0.038 |
| Reference_Sibling* Race | −0.116 (0.102) | −0.411 | 0.254 |
| Model | Description | χ2/df | CFI | TLI | RMSEA | Mc | Gamma |
|---|---|---|---|---|---|---|---|
| B | Baseline, 4 Stratum II factors | 15.493 | 0.969 | 0.947 | 0.046 | 0.908 | 0.969 |
| M1 | Configural | 15.687 | 0.977 | 0.954 | 0.043 | 0.929 | 0.976 |
| M2 | Metric | 11.355 | 0.977 | 0.964 | 0.038 | 0.930 | 0.976 |
| M3 | Scalar | 12.271 | 0.973 | 0.961 | 0.040 | 0.919 | 0.972 |
| M4 | Strict | 12.138 | 0.970 | 0.961 | 0.040 | 0.910 | 0.970 |
| M5 | Latent Variances | 12.841 | 0.966 | 0.963 | 0.047 | 0.880 | 0.966 |
| M6 | All Latent Means | 35.881 | 0.896 | 0.890 | 0.080 | 0.669 | 0.903 |
| M6A | Latent Means Group Factors | 18.305 | 0.949 | 0.943 | 0.056 | 0.833 | 0.950 |
| M6B | Latent Mean Spatial | 12.803 | 0.966 | 0.963 | 0.047 | 0.879 | 0.966 |
| M6C | Latent Mean Spatial and g | 22.039 | 0.939 | 0.929 | 0.061 | 0.806 | 0.941 |
| Factor | Estimate | SE | 95% CI | |
|---|---|---|---|---|
| Lower | Upper | |||
| G | 1.13 | 0.03 | 1.06 | 1.19 |
| Technical | 1.03 | 0.07 | 0.9 | 1.17 |
| Mathematical | −0.46 | 0.05 | −0.35 | −0.58 |
| Verbal | 0.21 | 0.06 | 0.11 | 0.3 |
| Spatial | 0 | -- | -- | -- |
© 2019 by the authors. Licensee MDPI, Basel, Switzerland. This article is an open access article distributed under the terms and conditions of the Creative Commons Attribution (CC BY) license (http://creativecommons.org/licenses/by/4.0/).
Share and Cite
Hu, M.; Lasker, J.; Kirkegaard, E.O.W.; Fuerst, J.G.R. Filling in the Gaps: The Association between Intelligence and Both Color and Parent-Reported Ancestry in the National Longitudinal Survey of Youth 1997. Psych 2019, 1, 240-261. https://doi.org/10.3390/psych1010017
Hu M, Lasker J, Kirkegaard EOW, Fuerst JGR. Filling in the Gaps: The Association between Intelligence and Both Color and Parent-Reported Ancestry in the National Longitudinal Survey of Youth 1997. Psych. 2019; 1(1):240-261. https://doi.org/10.3390/psych1010017
Chicago/Turabian StyleHu, Meng, Jordan Lasker, Emil O.W. Kirkegaard, and John G.R. Fuerst. 2019. "Filling in the Gaps: The Association between Intelligence and Both Color and Parent-Reported Ancestry in the National Longitudinal Survey of Youth 1997" Psych 1, no. 1: 240-261. https://doi.org/10.3390/psych1010017
APA StyleHu, M., Lasker, J., Kirkegaard, E. O. W., & Fuerst, J. G. R. (2019). Filling in the Gaps: The Association between Intelligence and Both Color and Parent-Reported Ancestry in the National Longitudinal Survey of Youth 1997. Psych, 1(1), 240-261. https://doi.org/10.3390/psych1010017