Article

From SARS to MERS and SARS-CoV-2: Comparative Spike Protein Remodeling and Ligand-Binding Hot-Spots Revealed by Multiscale Simulations

by
Gianfranco Cavallaro
1,
Giuseppe Forte
2,
Carmela Bonaccorso
1,
Milena Nicolosi
2,
Federica Sipala
2,
Giulia Varrica
1,
Cosimo Gianluca Fortuna
1,* and
Simone Ronsisvalle
2,*
1
Dipartimento di Scienze Chimiche, Università di Catania, I-95125 Catania, Italy
2
Dipartimento di Scienze del Farmaco e della Salute, Università di Catania, I-95125 Catania, Italy
*
Authors to whom correspondence should be addressed.
Chemistry 2025, 7(4), 132; https://doi.org/10.3390/chemistry7040132
Submission received: 23 June 2025 / Revised: 31 July 2025 / Accepted: 13 August 2025 / Published: 19 August 2025
(This article belongs to the Section Medicinal Chemistry)

Abstract

The COVID-19 pandemic has prompted the scientific community to develop new weapons against the SARS-CoV-2 spike protein. The study of its mutations is important to understand how it interacts with human receptors and how to prevent a future pandemic. In this study, four mutations of the Omega variant, along with those from the SARS-CoV-1 and MERS variants, were analyzed in complex with the angiotensin-converting enzyme 2 (ACE2) receptor. In silico studies were carried out to demonstrate that these mutations affect the interaction with the compounds under investigation. The ligands studied are heterocyclic compounds previously considered as potential inhibitors. Our results show that these compounds interact well with the spike protein and provide insights into how mutations, especially in the RBD region, can lead to perturbations in ligand–protein interactions.

Graphical Abstract

1. Introduction

In recent years, a growing body of research has adopted molecular modelling approaches to investigate the Coronaviridae family, also known as Coronaviruses, which has been associated with various diseases. These viruses can result in a spectrum of respiratory ailments in humans, encompassing the common cold, severe acute respiratory syndrome (SARS), Middle East respiratory syndrome (MERS), and coronavirus disease 2019 (COVID-19), which is triggered by the SARS-CoV-2 coronavirus [1].
Coronaviruses have a distinctive crown-like morphology, due to the presence of spike proteins observable under an electron microscope [2]. These viruses are characterized by their single-stranded positive-sense RNA genome and are classified within the family Coronaviridae and the order Nidovirales [3].
Among the coronaviruses that infect humans, the best known before the COVID-19 pandemic were SARS-CoV (Severe Acute Respiratory Syndrome Coronavirus), which emerged in China in 2002 and spread to several countries around the world, causing a SARS epidemic with relatively high mortality [4]; and MERS-CoV (Middle East Respiratory Syndrome Coronavirus), first identified in Saudi Arabia in 2012, which caused sporadic outbreaks of severe respiratory illness, with higher mortality than SARS [5]. SARS-CoV-2, the virus responsible for COVID-19, was first identified in late 2019 [6].
Understanding viruses is of paramount importance for numerous reasons, particularly in public health. It is essential to comprehend how viruses spread and interact with host organisms to prevent and manage viral diseases, as well as to develop effective control strategies, such as drugs and vaccines. However, structural and molecular-level understanding plays a pivotal role in these processes. Molecular modelling techniques have increasingly enabled the scientific community to dissect virus–host interactions at atomic resolution, supporting the development of both prophylactic and therapeutic agents. In the field of medicine, accurately identifying the responsible virus and treating it requires a thorough understanding of symptomatology. Furthermore, the investigation of viruses has significantly enhanced our comprehension of biological processes, including cell replication, genetic transmission, and evolution [7].
Due to the pandemic impact of SARS-CoV-2 and the emergence of its numerous variants, there is now an urgent need for structurally driven comparative studies, not only among the different SARS-CoV-2 lineages, but also across related coronaviruses such as SARS and MERS. These comparisons are essential to assess how genetic mutations impact transmissibility, disease severity, reinfection risk, immune response, vaccine efficacy, and drug susceptibility [8].
In addition, the study of different coronaviruses provides a broad perspective on receptor recognition, cell entry, and viral replication mechanisms. Molecular modelling enables the visualization and simulation of these phenomena, offering predictive insights into conformational changes of viral proteins and their binding affinities with ligands or receptors [9].
Middle East Respiratory Syndrome (MERS) is a respiratory illness first identified in 2012 in Saudi Arabia. It affects the respiratory system and can cause fever, cough, and shortness of breath. In severe cases, it may lead to pneumonia, kidney failure, and even death. The World Health Organization (WHO) reports that MERS likely originated in bats and was transmitted to humans through camels. Although not highly contagious between humans, it can be transmitted through close contact with infected individuals [10]. While MERS symptoms are comparable in severity to those of SARS-CoV-2, it has not triggered global epidemics.
SARS is a viral respiratory disease caused by the SARS coronavirus (SARS-CoV). The 2002–2003 outbreak originated in China and rapidly spread via international travel. It can be transmitted through airborne droplets and contaminated surfaces (https://www.who.int/health-topics/severe-acute-respiratory-syndrome#tab=tab_1, accessed on 12 August 2025). Symptoms include fever, chills, muscle aches, and respiratory distress, and in severe cases, pneumonia and respiratory failure. Mortality rates were relatively high, especially among older adults and those with comorbidities (https://www.ecdc.europa.eu/en/severe-acute-respiratory-syndrome, accessed on 12 August 2025). The outbreak was eventually controlled through strict public health measures, including quarantine, isolation, and travel restrictions.
The structural investigation of viral proteins, particularly the spike glycoprotein, is essential in identifying molecular targets for antiviral drugs and vaccine development. The comparison across variants and strains allows researchers to highlight mutation hot-spots and regions of structural conservation. In this study, advanced molecular modelling techniques were employed to examine the structural evolution of the spike protein in various SARS-CoV-2 variants and related viruses such as MERS and SARS-CoV-1.
Ligands previously identified for their promising interactions with SARS-CoV-2 [11] spike protein were re-evaluated through virtual screening, molecular dynamics (MD) simulations, and quantum mechanical (QM) analyses. The class of compounds investigated comprises push–pull heterocyclic molecules (Figure 1), selected for their electronic properties and predicted binding profiles.
The variants analyzed include SARS-CoV-2 lineages BA.2.75, CH.1.1, EG.5, and XBB.1.16, as well as MERS and SARS-CoV-1. The Omicron variant, isolated in late 2020 [12], exhibits 37 mutations compared to the Wild Type, with 15 located in the receptor-binding domain (RBD) [12]. Despite its lower virulence, its rapid global spread and high mutational capacity make it a continuing object of study [12]. Subvariants analyzed include the following:
-
XBB.1.16: emerged mid-2023, widely disseminated, and outcompeted other Omicron subvariants, showing comparable ACE2 affinity [13].
-
BA.2.75: detected in Singapore and India, shows mutations likely responsible for immune escape and high transmissibility [14].
-
EG.5 (“Eris”): derivative of XBB with spike protein alterations, contributed significantly to global case increases [15].
-
CH.1.1: identified in Southeast Asia, shares mutations with Delta and BA subvariants, notably L452R, enhancing transmissibility and RBD interaction [16].
This structural and modelling-based comparative approach provides key insights into spike–ligand dynamics and supports the identification of molecular determinants that could be exploited for antiviral drug design.

2. Materials and Methods

2.1. In Silico Mutagenesis and System Preparation

The crystal structure of the S1 spike section of SARS-CoV-2 bound to the ACE2 receptor was retrieved from the protein data bank (PDB code: 6M0J, resolution 2.45 Å) [17]. Preparation of the different variants of SARS-CoV-2 was performed in accordance with the methodology described in our previous research [11].
The crystal structure of the SARS-CoV-1 receptor binding domain (RBD) bound to the antibody SARS VHH-72 and the structure of the MERS-CoV RBD bound by the neutralizing single-domain antibody MERS VHH-55 were obtained from the protein data bank (PDB code 6WAQ, resolution 2.20 Å) (PDB code 6WAR, resolution 3.40 Å) [18]. The accessory parts of the antibody strains were removed using Flare™, 9.0 (Cresset®, Litlington, Cambridgeshire, UK; https://www.cresset-group.com/flare/, accessed on 12 August 2025) [19,20,21]. The “superpose” function from Flare software 8.0 was utilized to align and overlay the RBD of SARS-CoV-1, SARS-CoV-2, and MERS, and the complex with ACE was subsequently constructed.

2.2. Binding Site Identification and Molecular Docking Studies

All virtual screening docking studies were conducted utilizing FLAP 2.2.2 software (Molecular Discovery Ltd., Borehamwood, UK; www.moldiscovery.com (accessed on 13 January 2023)) [22]. FLAP characterizes small molecules and protein binding sites, referred to as pockets, through the utilization of four-point pharmacophoric fingerprints derived from molecular interaction fields (MIFs) computed by GRID [23]. Initially, the interaction cavities (pockets) of the crystallographic protein were computed employing FLAP. These pockets were identified both automatically and manually. Automatic identification of pockets was facilitated by the software’s “search by pocket” function, while the “search by residue” function allowed the operator to select amino acid residues of interest to obtain a pocket not automatically obtained by the software. Additionally, FLAP software operated in the “structure-based” mode (SBVS), which aims to generate all possible binding poses of a ligand within a pocket (binding site). This process relies on identifying similarities between the GRID fields of the ligand and the binding site [23,24]. GRID MIFs were generated utilizing four molecular probes: H (shape and steric effects), DRY (hydrophobic interactions), N1 (hydrogen bond donor), and O (hydrogen bond acceptor) interactions. The SBVS function superimposes and scores the grids; values were extrapolated for each compound, resulting in a total of 19 different scores, representing individual probes and combinations thereof. Additionally, the function provides three other key scores for interaction evaluation: Glob-Sum, Glob-Prod, and Distance. Glob-Sum and Glob-Prod represent the summation and production of interactions, respectively. The Distance score reflects overall similarity derived from a combination of overlap between the individual probes (H, DRY, O, and N1) of the MIFs, calculated for each candidate ligand and binding site. The SBVS function was conducted using X-ray crystal structures of the S1-CTD portion of the spike protein. Glob-Sum served as a reference score for quantifying the degree of interaction between ligand and protein active site due to its provision of more indicative and reliable data compared to Glob-Prod. All structures were analyzed using this method. A higher GLOB-SUM score is associated with a potentially stronger interaction with the binding pocket. Three-dimensional and two-dimensional poses were obtained by optimizing them for the GLOB-SUM score. The 3D poses are necessary to visualize how the ligands could fit into the studied pockets. Two-dimensional binding poses are fundamental to understanding interaction areas and the amino acid residues most involved. Under identical conditions, screening was performed on known compounds (methylene blue and DRI-C23041) to validate and compare results and interaction scores [25].

2.3. Molecular Dynamic Simulations

The structures of BCC-1, BCC-2, and BCC-3 molecules were obtained from the molecular docking studies, and their energy was minimized using a “Flare preparation ligand”. For the molecular dynamics simulations, the most favorable poses from the molecular docking studies were selected and employed. Specifically, the dynamics were performed using Flare 8.0 software. The force field used for proteins is AMBER FF14SB, and for ligands AMBER GAFF2 [26]. A tLeap water box (TIP3PBOX) was produced. The water-protein system was minimized for the SARS-CoV-2-ACE2 complex (grid size: 65 × 58 × 70 Å), for the MERS-ACE2 complex (grid size: 56 × 54 × 89 Å), and for the SARS-CoV-1-ACE2 complex (grid size: 89 × 62 × 83 Å). Five simulations lasting 30 ns were conducted, and the results shown are the average of the five repetitions made for each calculation. The results of the 30 ns dynamic analysis and RMSD evaluation revealed no substantial alterations. The analysis of the dynamic files was carried out using Flare 8.0 software, while the Molecular Mechanics/Generalized Born Surface Area (MM/GBSA) method was employed to determine the binding free energies of the examined ligan–protein complexes.

2.4. Quantum Mechanical Studies

The initial geometries of the complexes were derived from molecular dynamics simulations. Specifically, four of the geometries correspond to interactions between the BCC-3 ligand and the Omicron variants BA, CH, EG, and XBB. One geometry represents the complex formed between BCC-2 and MERS, while the sixth structure describes the interaction between SARS-CoV-1 and BCC-1.
All complexes were fully optimized without constraints using the ONIOM (CAM-B3LYP/6-311+G(d,p): AMBER) method. In accordance with the ONIOM scheme [27], the molecular systems were partitioned into two layers, each treated with a different level of theory. The high layer, which included the ligand and all receptor atoms within 0.6 nm of the ligand, was modeled using density functional theory (DFT). The low layer was described using the AMBER force field. According to this approach, the total ONIOM energy, EONIOM, is defined as
EONIOM = Elow (R) + Ehigh (SM) − Elow (SM)
where Elow (R) represents the energy of the real system computed using the AMBER force field, and Ehigh (SM) and Elow (SM) correspond to the energies of the model system evaluated at the DFT and AMBER levels of theory, respectively. To accurately capture short-range interactions at the DFT level, atoms in close proximity to the ligand were included in the high layer. In this framework, σ-bonds between atoms X and Y (where X = C and Y = C, N, or O) were cleaved and capped with hydrogen link atoms to satisfy valency and avoid dangling bonds in the model system. Solvation effects were modeled using the polarizable continuum model [28].
Before the QM/MM study, a preliminary molecular mechanics optimization step was carried out using an optimization protocol with the CVFF force field [29,30]. All QM/MM calculations were performed with the Gaussian 16 software package [31].
The electronic interaction energies (ΔE) are reported in Table 6 and were calculated as follows:
∆E = Eligand−receptor − (Eligand + Ereceptor)

2.5. Cross-Validation Across Computational Tiers

Plotting GLOB-SUM versus MM/GBSA ΔG for all 24 complex/ligand pairs (not shown) yields a linear correlation (R2 = 0.71), confirming that high-throughput docking is a reliable first-pass filter. Per-residue energy decomposition of the MD trajectories maps almost one-to-one onto the residues highlighted in the 2D interaction diagrams, validating that static pharmacophore fingerprints capture the dominant hot-spots later observed under dynamic conditions. Finally, ONIOM refinement on six representative complexes reproduces the MM/GBSA ranking and dissects the subtle electrostatic complementarity that distinguishes CH.1.1 from EG.5, or BCC-1 from BCC-2, at an atomistic level unreachable by classical force-fields.

3. Results

3.1. Molecular Docking Studies

FLAP automatically identified three pockets for the four Omicron variants (XBB, BA, CH, and EG), four pockets for SARS-CoV-1, and five pockets for MERS (Figure 2). The three pockets of the Omicron variants consistently occupy the same positions across all four variants. Two of these are situated within the RBD positions, while one is distant from the RBD. In SARS-CoV-1, pocket 1 is located far from the RBD, whereas the others are within the RBD zone. In the MERS variant, the pockets identified by the software are far from the RBD zone; this is certainly due to the different protein structure. Therefore, two additional pockets were manually selected within the RBD zone using the FLAP function ‘search by residues’. For all these variants, except for MERS, only pockets near the RBD zone are considered for screenings; specifically, every pocket 2 for all Spike variants is chosen due to good dynamics and docking scores screening. Mutations observed in the four Omega variants are summarized in Table 1. Despite the high similarity of pockets highlighted in the Omicron variants (Table 2), the software confirms the presence of these mutations.
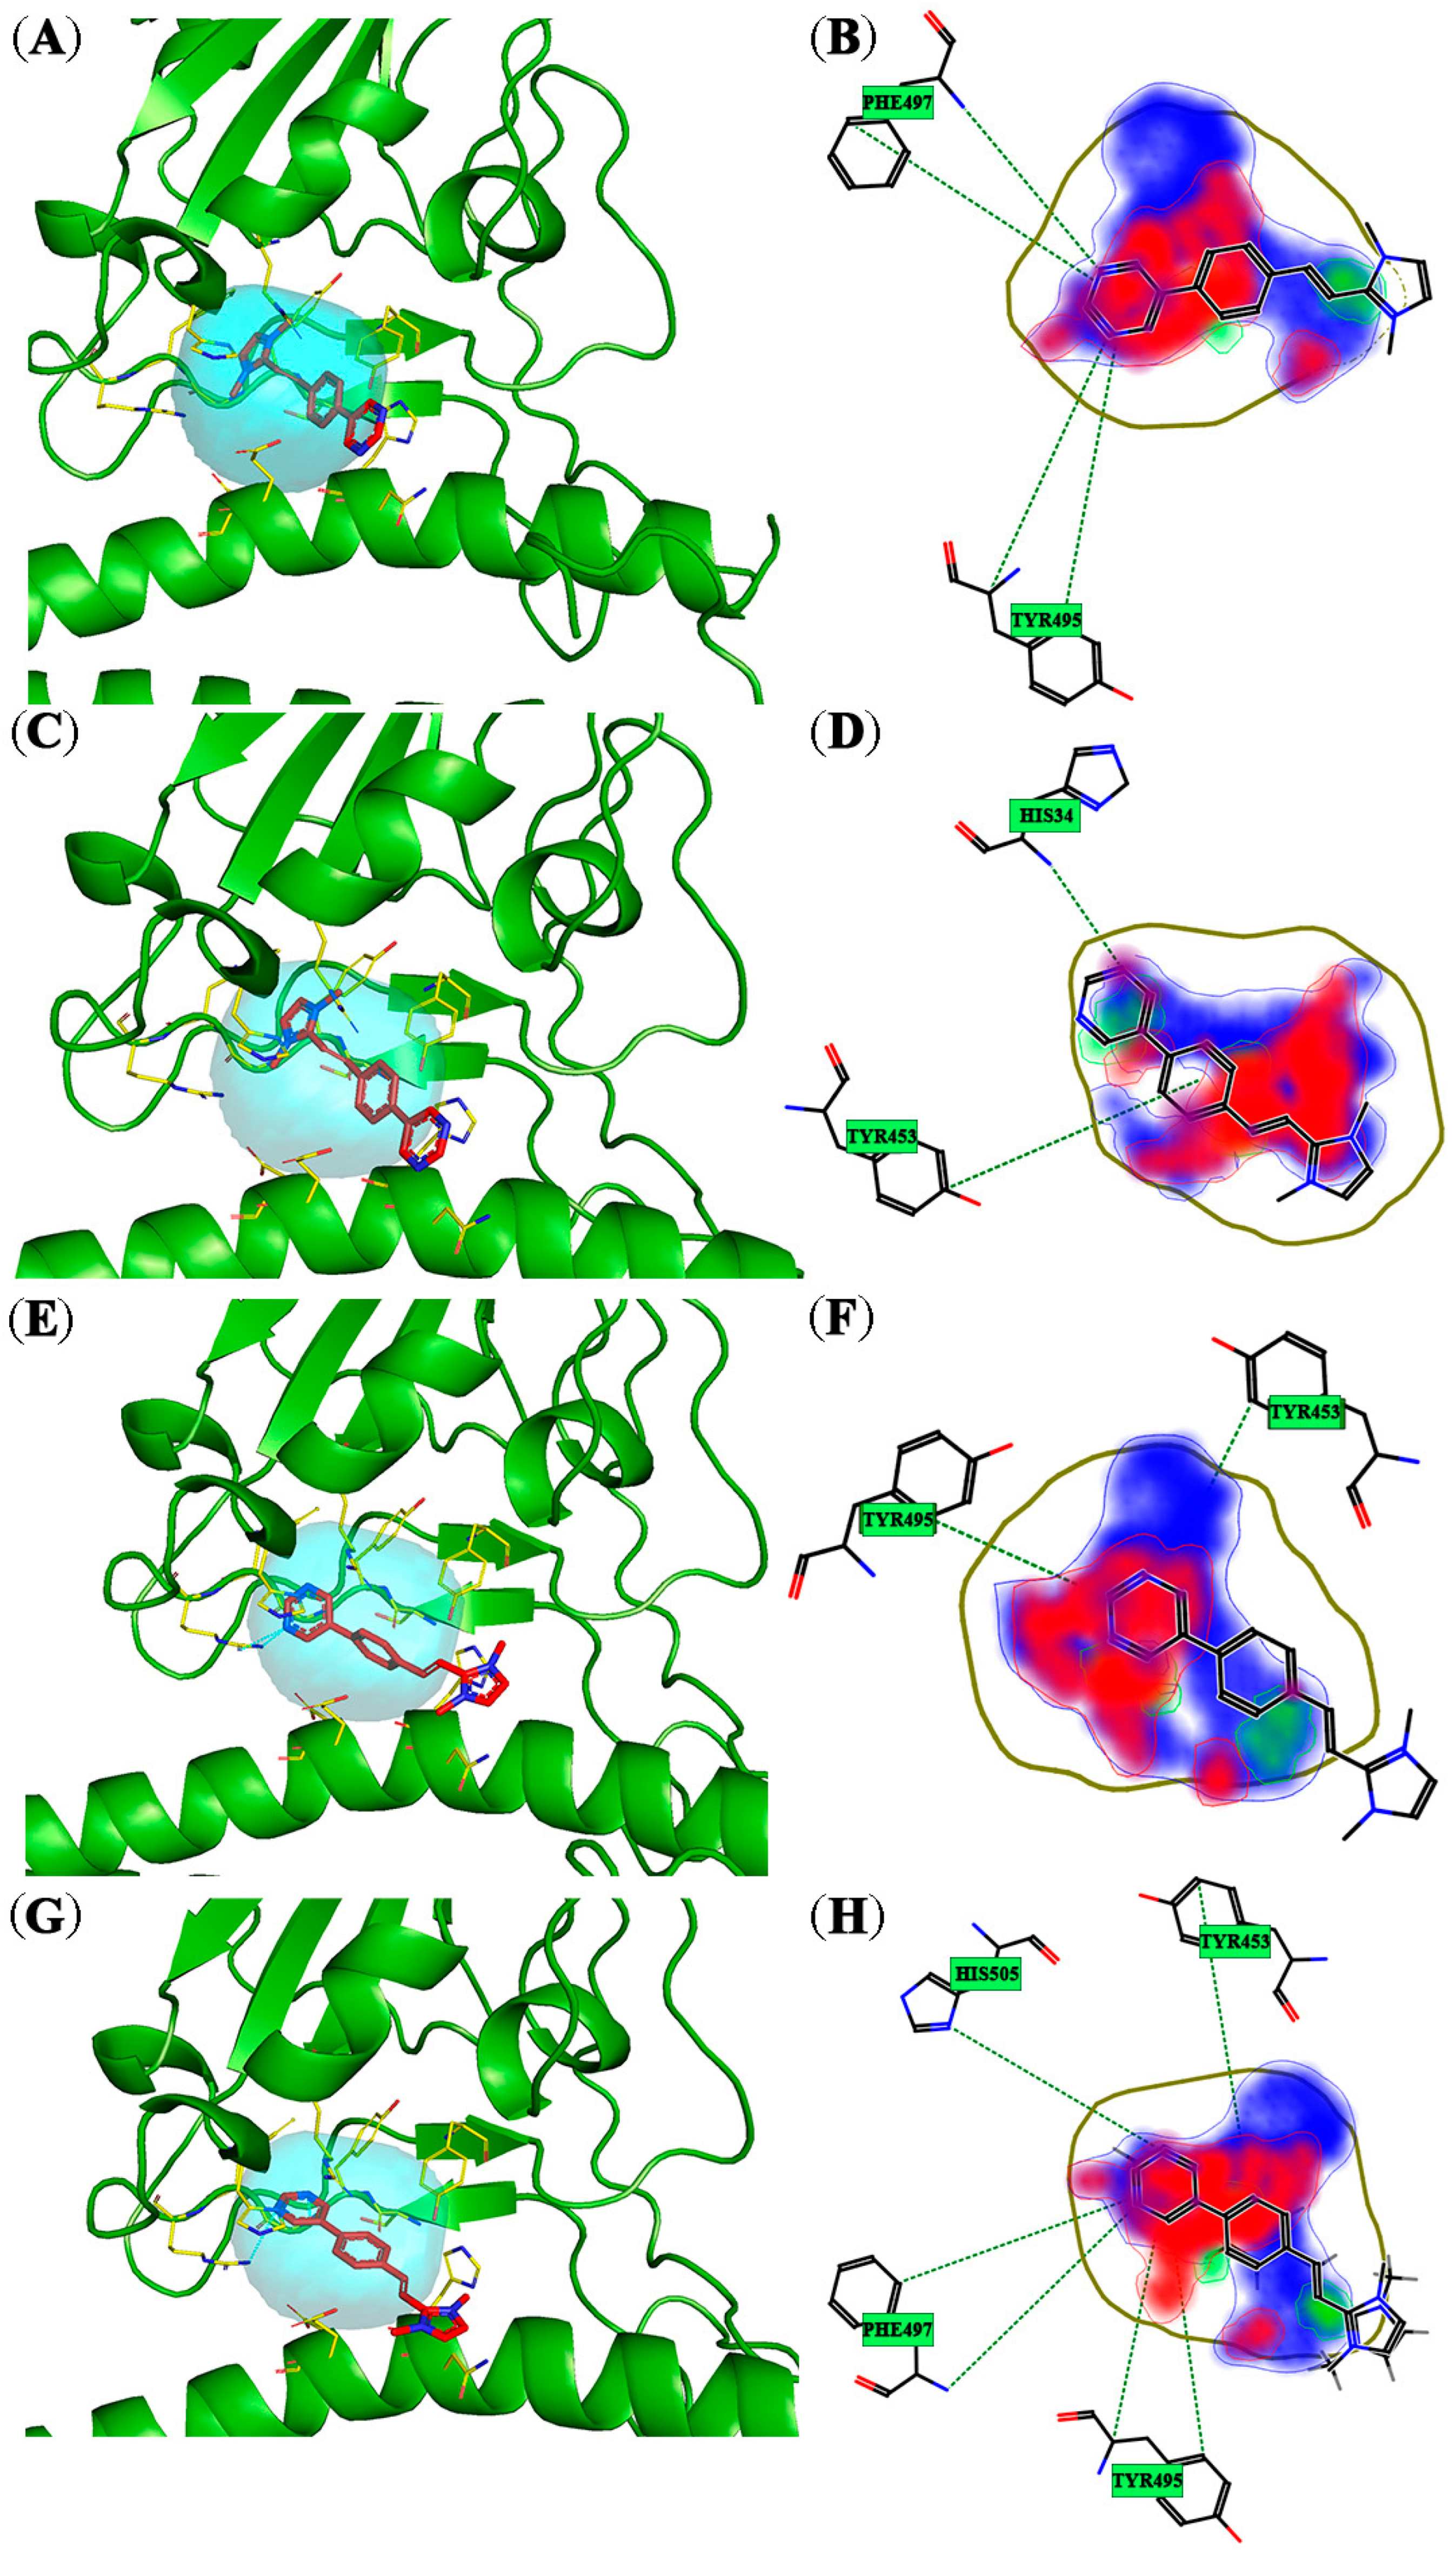
BCC-3, the compound with the highest GLOB-SUM score in all four Omega variants (Table 3), is located in a very similar way for XBB and BA variants (Figure 3) compared to the CH and EG variants (Figure 3); in fact, for these, the 3D pose shows that the entire ligand structure is within pocket 2 except for the imidazole group (Figure 3). Instead, for the other two variants (XBB and BA), the 3D pose shows that only the pyrimidine ring is out of the pocket. The only thing in common between all variants is that BCC-3 is located horizontally inside the pocket. Another common point that can be noted in Figure 3 is that the functional group mostly involved in the interactions is the pyrimidine ring, where in all four variants studied, it presents important hydrogen bond acceptor/donor interactions (blue and red areas). EG is the variant that shows the biggest interaction areas with BCC-3, as also seen from the numerous residues involved compared to the other variants. Interactions between Tyr495, Tyr453, and BCC-3 are common in all four variants. Only XBB and EG show interactions between BCC-3 and Phe497. In all cases, these residues interact with the pyrimidine ring.
Pocket 2 of the SARS-CoV-1 variant was selected because it exhibits excellent GLOB-SUM scores with compounds under investigation (Table 4). According to FLAP, the most promising ligand, even outperforming the reference compound, is BCC-1 (Table 4). Pocket 2 is in the RBD zone on the right-hand side. This pocket is larger compared to previous variants (Omicron variants) and fully accommodates the push–pull heterocyclic system. The ligand is oriented horizontally within the pocket. The 2D screening highlights hydrophobic interactions involving the pyridine ring, due to strong π-π interactions with the aromatic group of the Tyr491 residue. CH-π interactions are observed between the methyl group of the pyridine ring and the aromatic ring of Tyr41, a residue of ACE2. Donor/acceptor hydrogen bonding interaction areas are present in the bicyclic system of the ligand.
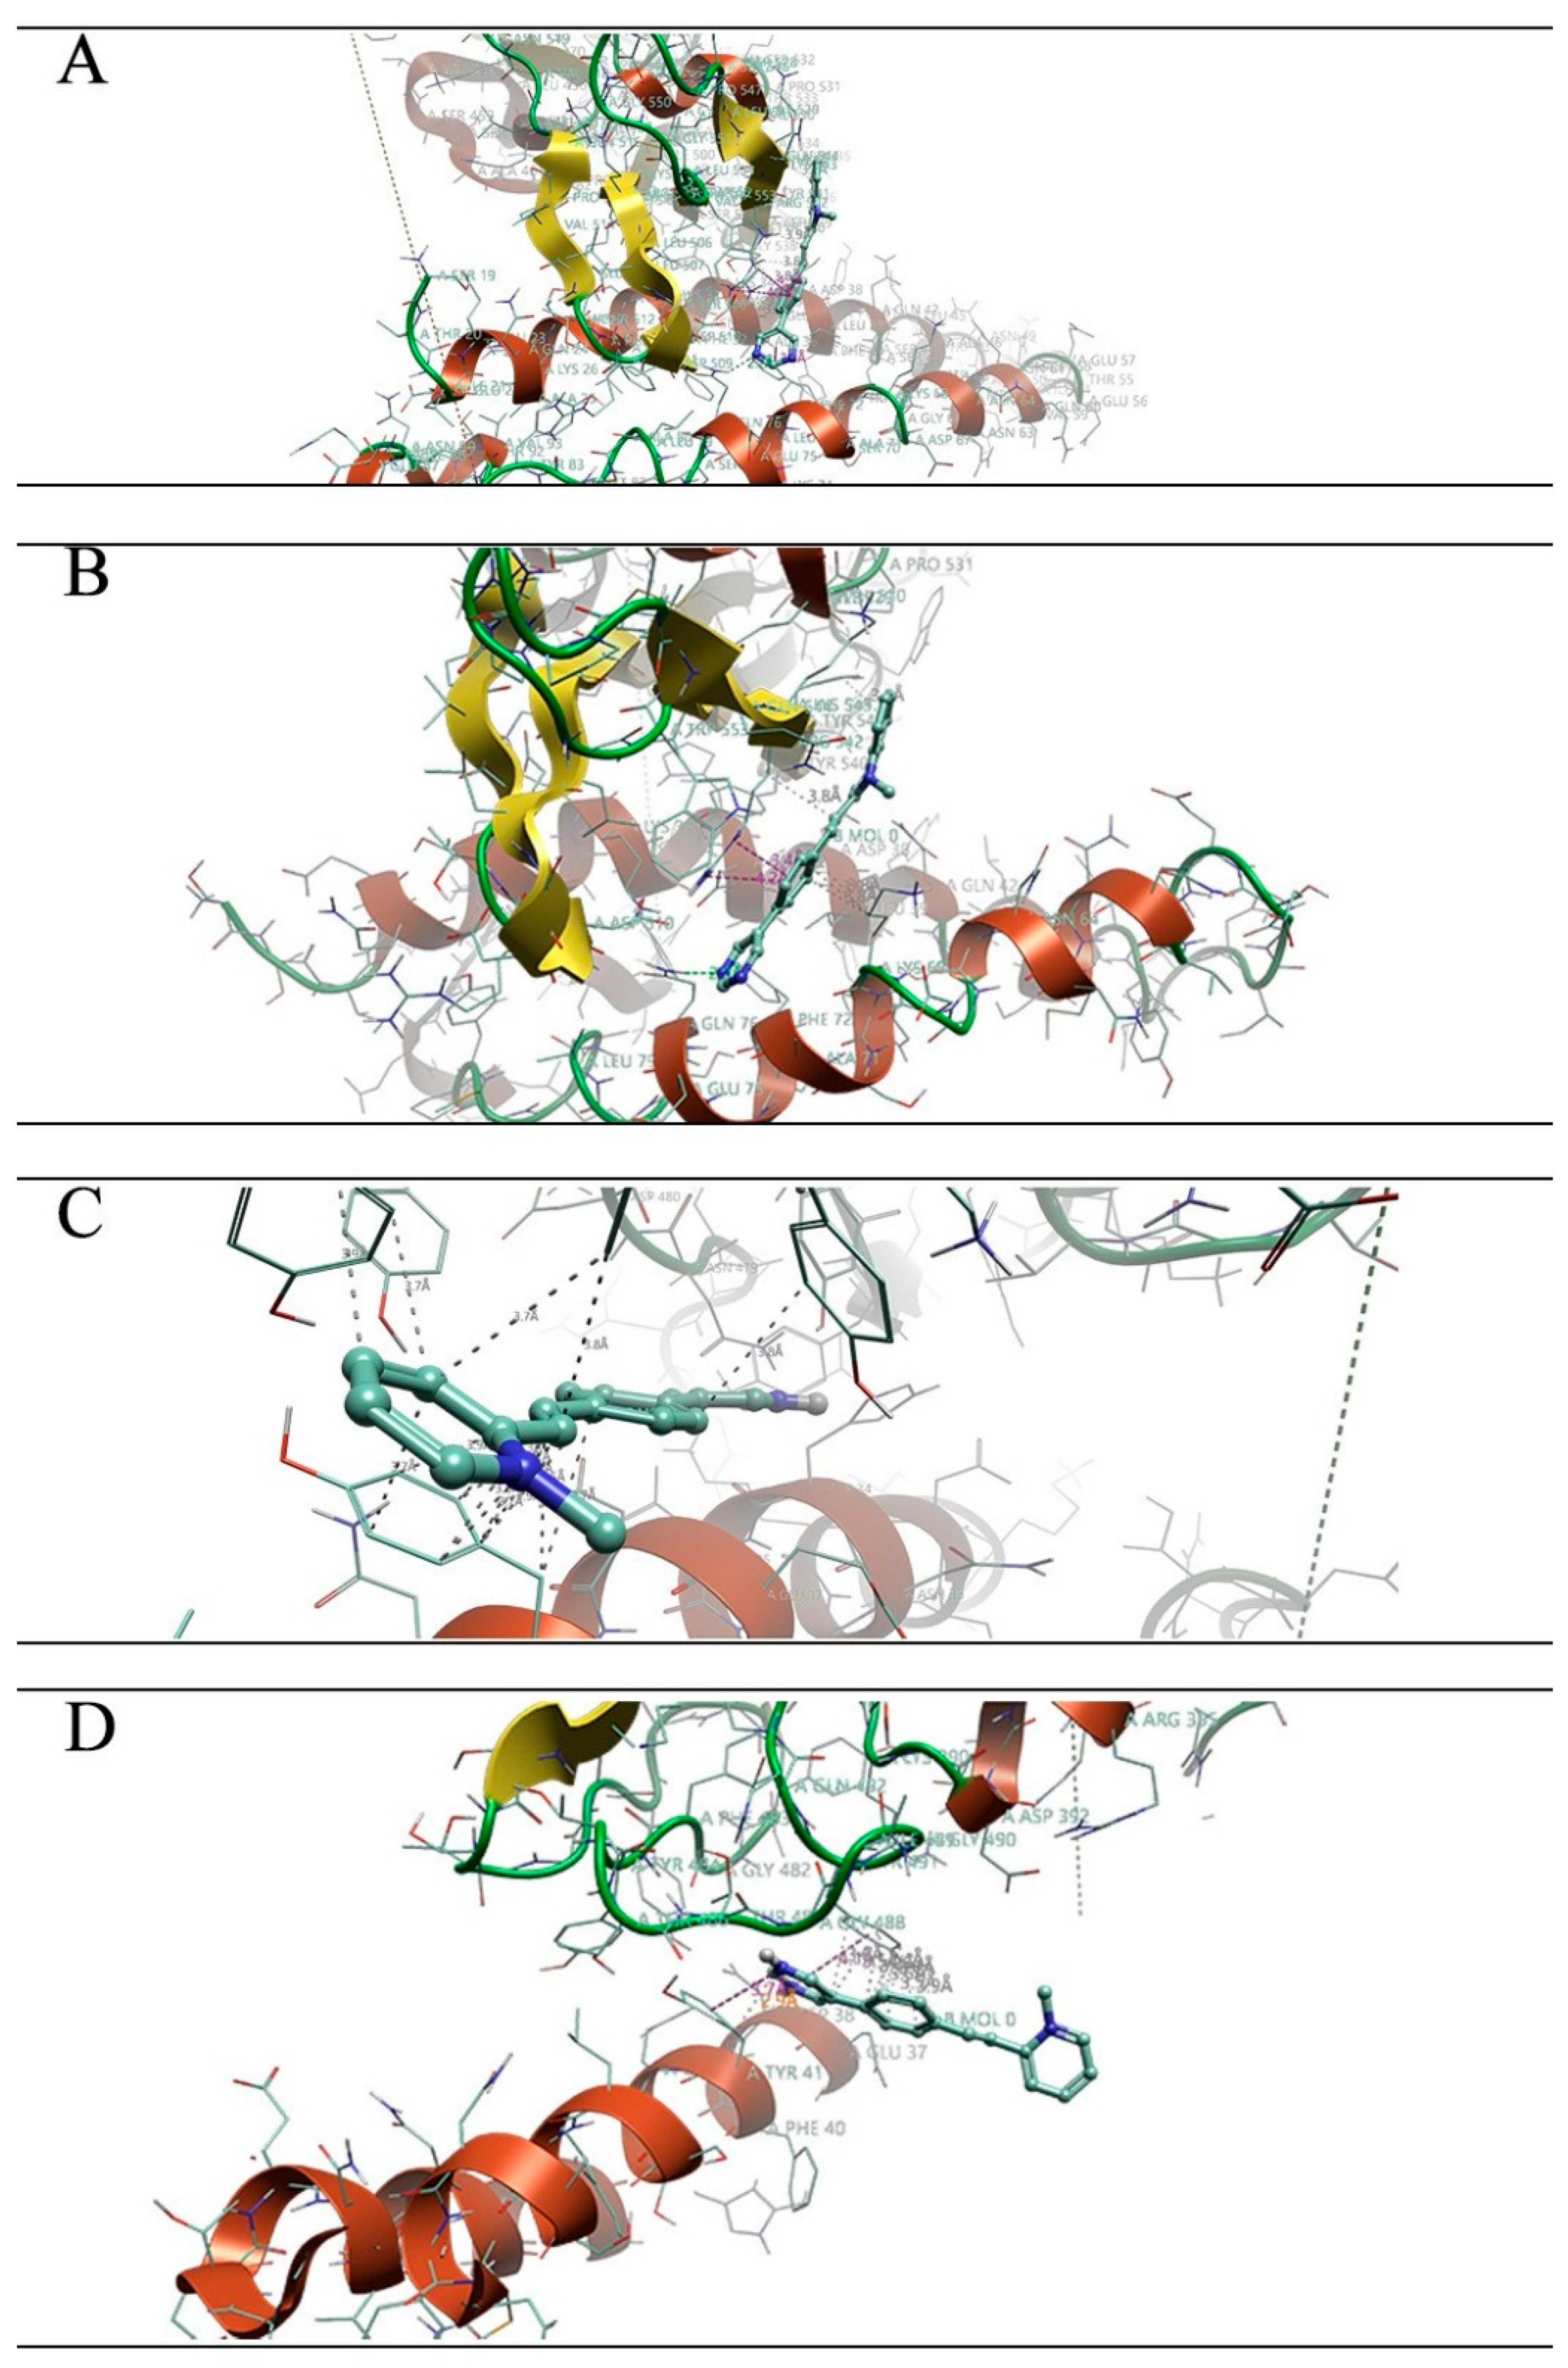
The two RBD pockets exhibit excellent interaction scores with the BCC-2 ligand (Table 4). The two pockets, generated in FLAP using the “search by residues” mode, are large in size. The BCC-2 ligand is vertically positioned within the RBD1 pocket (Figure 4C), while it occupies the upper region of the RBD2 pocket (Figure 4E). In both cases, the ligand is fully enclosed within the pocket.
With RBD1, the ligand engages in strong hydrophobic interactions between the quinolinium group and the Trp535 residue, while the other two functional groups are involved in donor/acceptor hydrogen bonding interactions (Figure 4D).
Within the RBD2 pocket, BCC-2 interacts with the residues Leu554, Leu507, and Ser19, the latter belonging to the ACE2 receptor region. Leu554 shows CH-π interactions with the quinolinium group, which is also involved in donor/acceptor hydrogen bonding interactions. Leu507 and Ser19 interact with the pyrimidine ring through CH-π interactions and hydrogen bonding, respectively.

3.2. Molecular Dynamics Simulations

The evaluation of molecular dynamics results was conducted for pockets 2 and 3 of SARS-CoV-2 variants; pockets 1 and 2 of MERS; and pockets 2, 3, and 4 of SARS-CoV-1. The most promising outcomes for all SARS-CoV-2 variants and SARS-CoV-1 were observed in pocket 2, whereas pocket 1 was assessed for MERS. The pocket in question, numbered two for SARS and one for MERS, is situated at the junction of the RBD of the spike protein and ACE2. The following analysis presents the outcomes of dynamic simulations. For all variants of SARS-CoV-2, the BCC-3 ligand demonstrated the most effective outcomes, which aligns with the findings of the docking analysis (Figure 5).
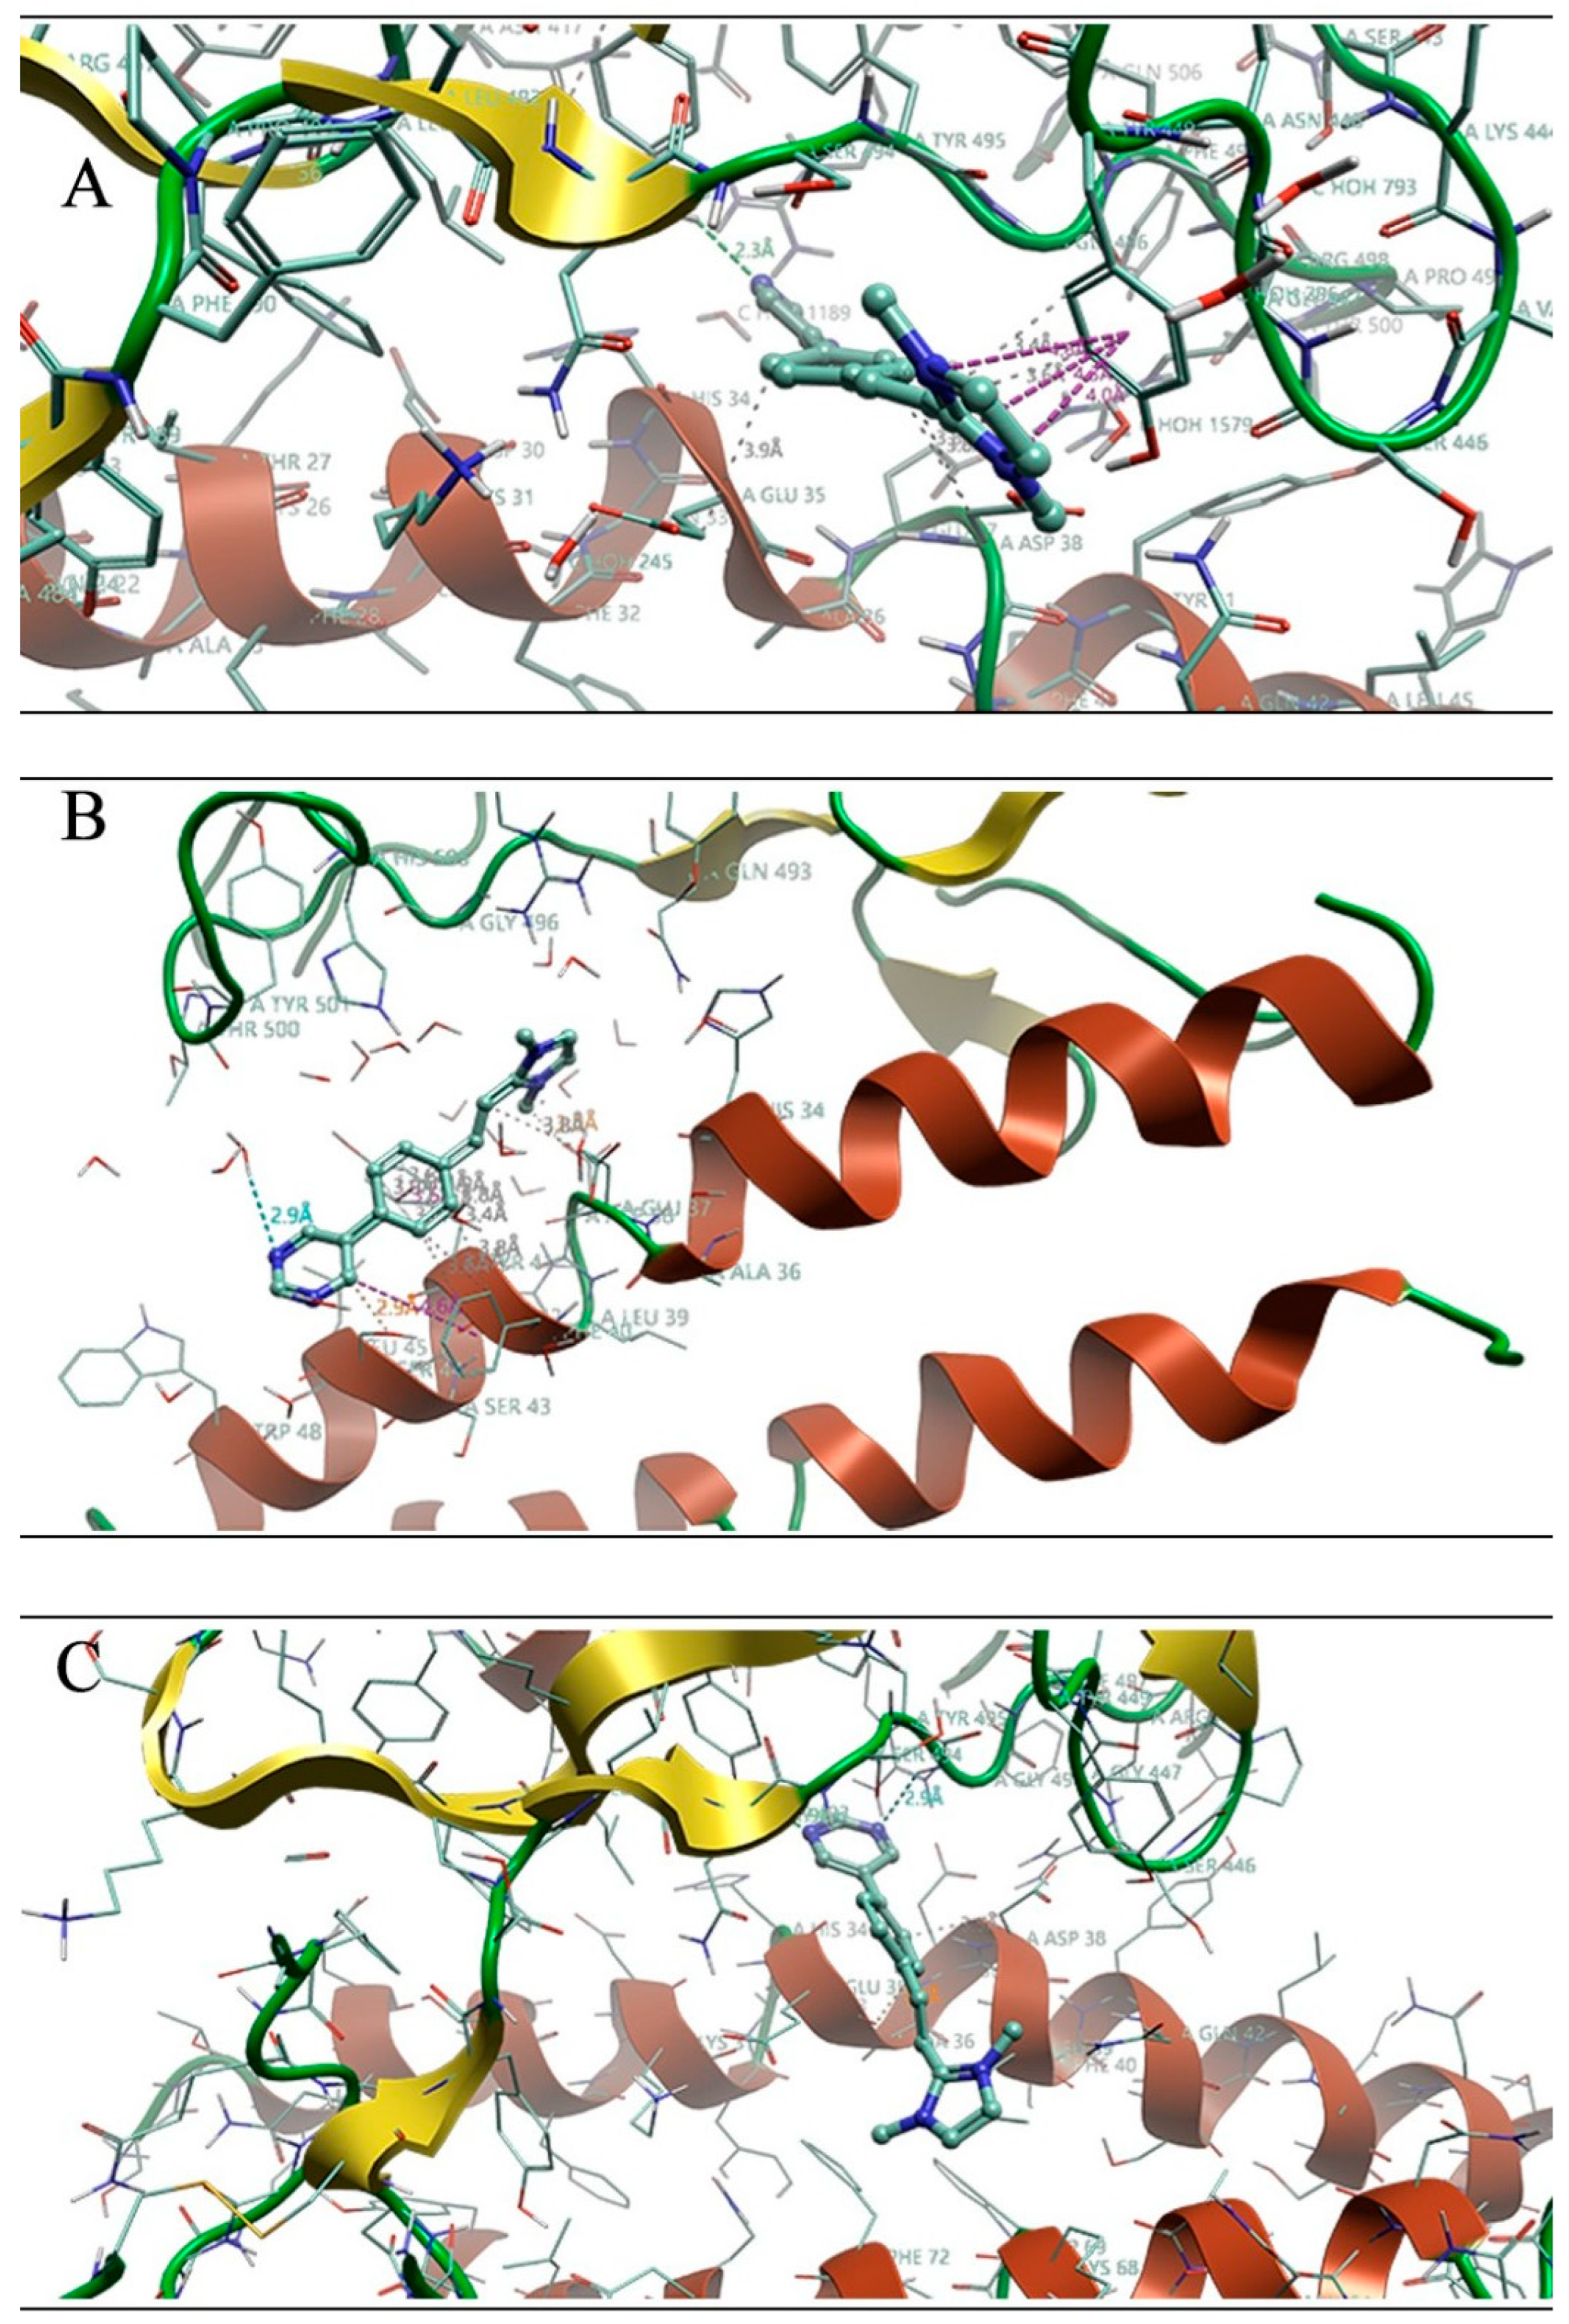
The dynamic simulation of the interaction between the BA.2.75 variant and the ACE2 receptor is characterized by the ligand being oriented perpendicular to the first loop of the receptor, with the bicyclic portion filling the central pocket and the imidazole ring occupying the outer portion of the pocket. The molecule initially remains in its initial position for approximately the first 10 ns of the simulation, establishing π-π interactions with the phenolic ring of Tyr449 of the spike (from 2 to 10 ns). Following this, it moves slightly towards the center of the pocket, simultaneously forming interactions with the second ring of the bicyclic moiety (H-π interaction with Arg498 from 8 ns to 15 ns and with Gly502 from 13 to 15 ns). At approximately 15 nanoseconds, a conformational change occurs in the molecule, resulting in its alignment parallel to the loop of ACE2, with the imidazole ring toward the center, establishing π-π interactions with the imidazole ring of His 505 (from 15 ns until the end of the dynamics), with the benzene of Phe40 (from 20 to 25 ns), and with the phenolic ring of Tyr41 of ACE2 (from 10 ns until the end of the dynamics). Through interactions with His505, the ligand is securely anchored and maintains stability during the subsequent dynamics, which commence at 15 ns and continue thereafter (Figure 6A,B and Figures S1–S3).
In the context of the CH.1.1 variant, the ligand BCC-3 demonstrated the most promising results. It was found to be optimally positioned at the interface between ACE2 and the spike for the initial two nanoseconds, acting as an intercalant by occupying a position that is perpendicular to the loop of ACE2. The ligand subsequently undergoes a process of seeking stability, which lasts approximately 8 nanoseconds. Following this, it relocates itself to the center of the interface between the spike and ACE2, remaining in this position for an additional 10 nanoseconds. The stabilization phase involves the formation of brief weak interactions with His 34, Glu 35, Gln 42, Ala 65, and Glu75 of ACE2, as well as π-π interactions with Tyr449, Tyr453, Gly496, Tyr 501, and His505 of the spike protein (Figure 6C and Figures S4–S6).
From 10 ns, the molecule is positioned vertically at the interface, with the imidazole ring oriented towards the outer portion of the pocket, and the bicyclic portion directed towards the center. At 10 ns, interactions such as the hydrogen bond between the N of the ring and Ser490 are established and persist throughout the dynamics. Additionally, a π-π interaction between the phenolic ring of Tyr489 and the system persists for the duration of the dynamics.
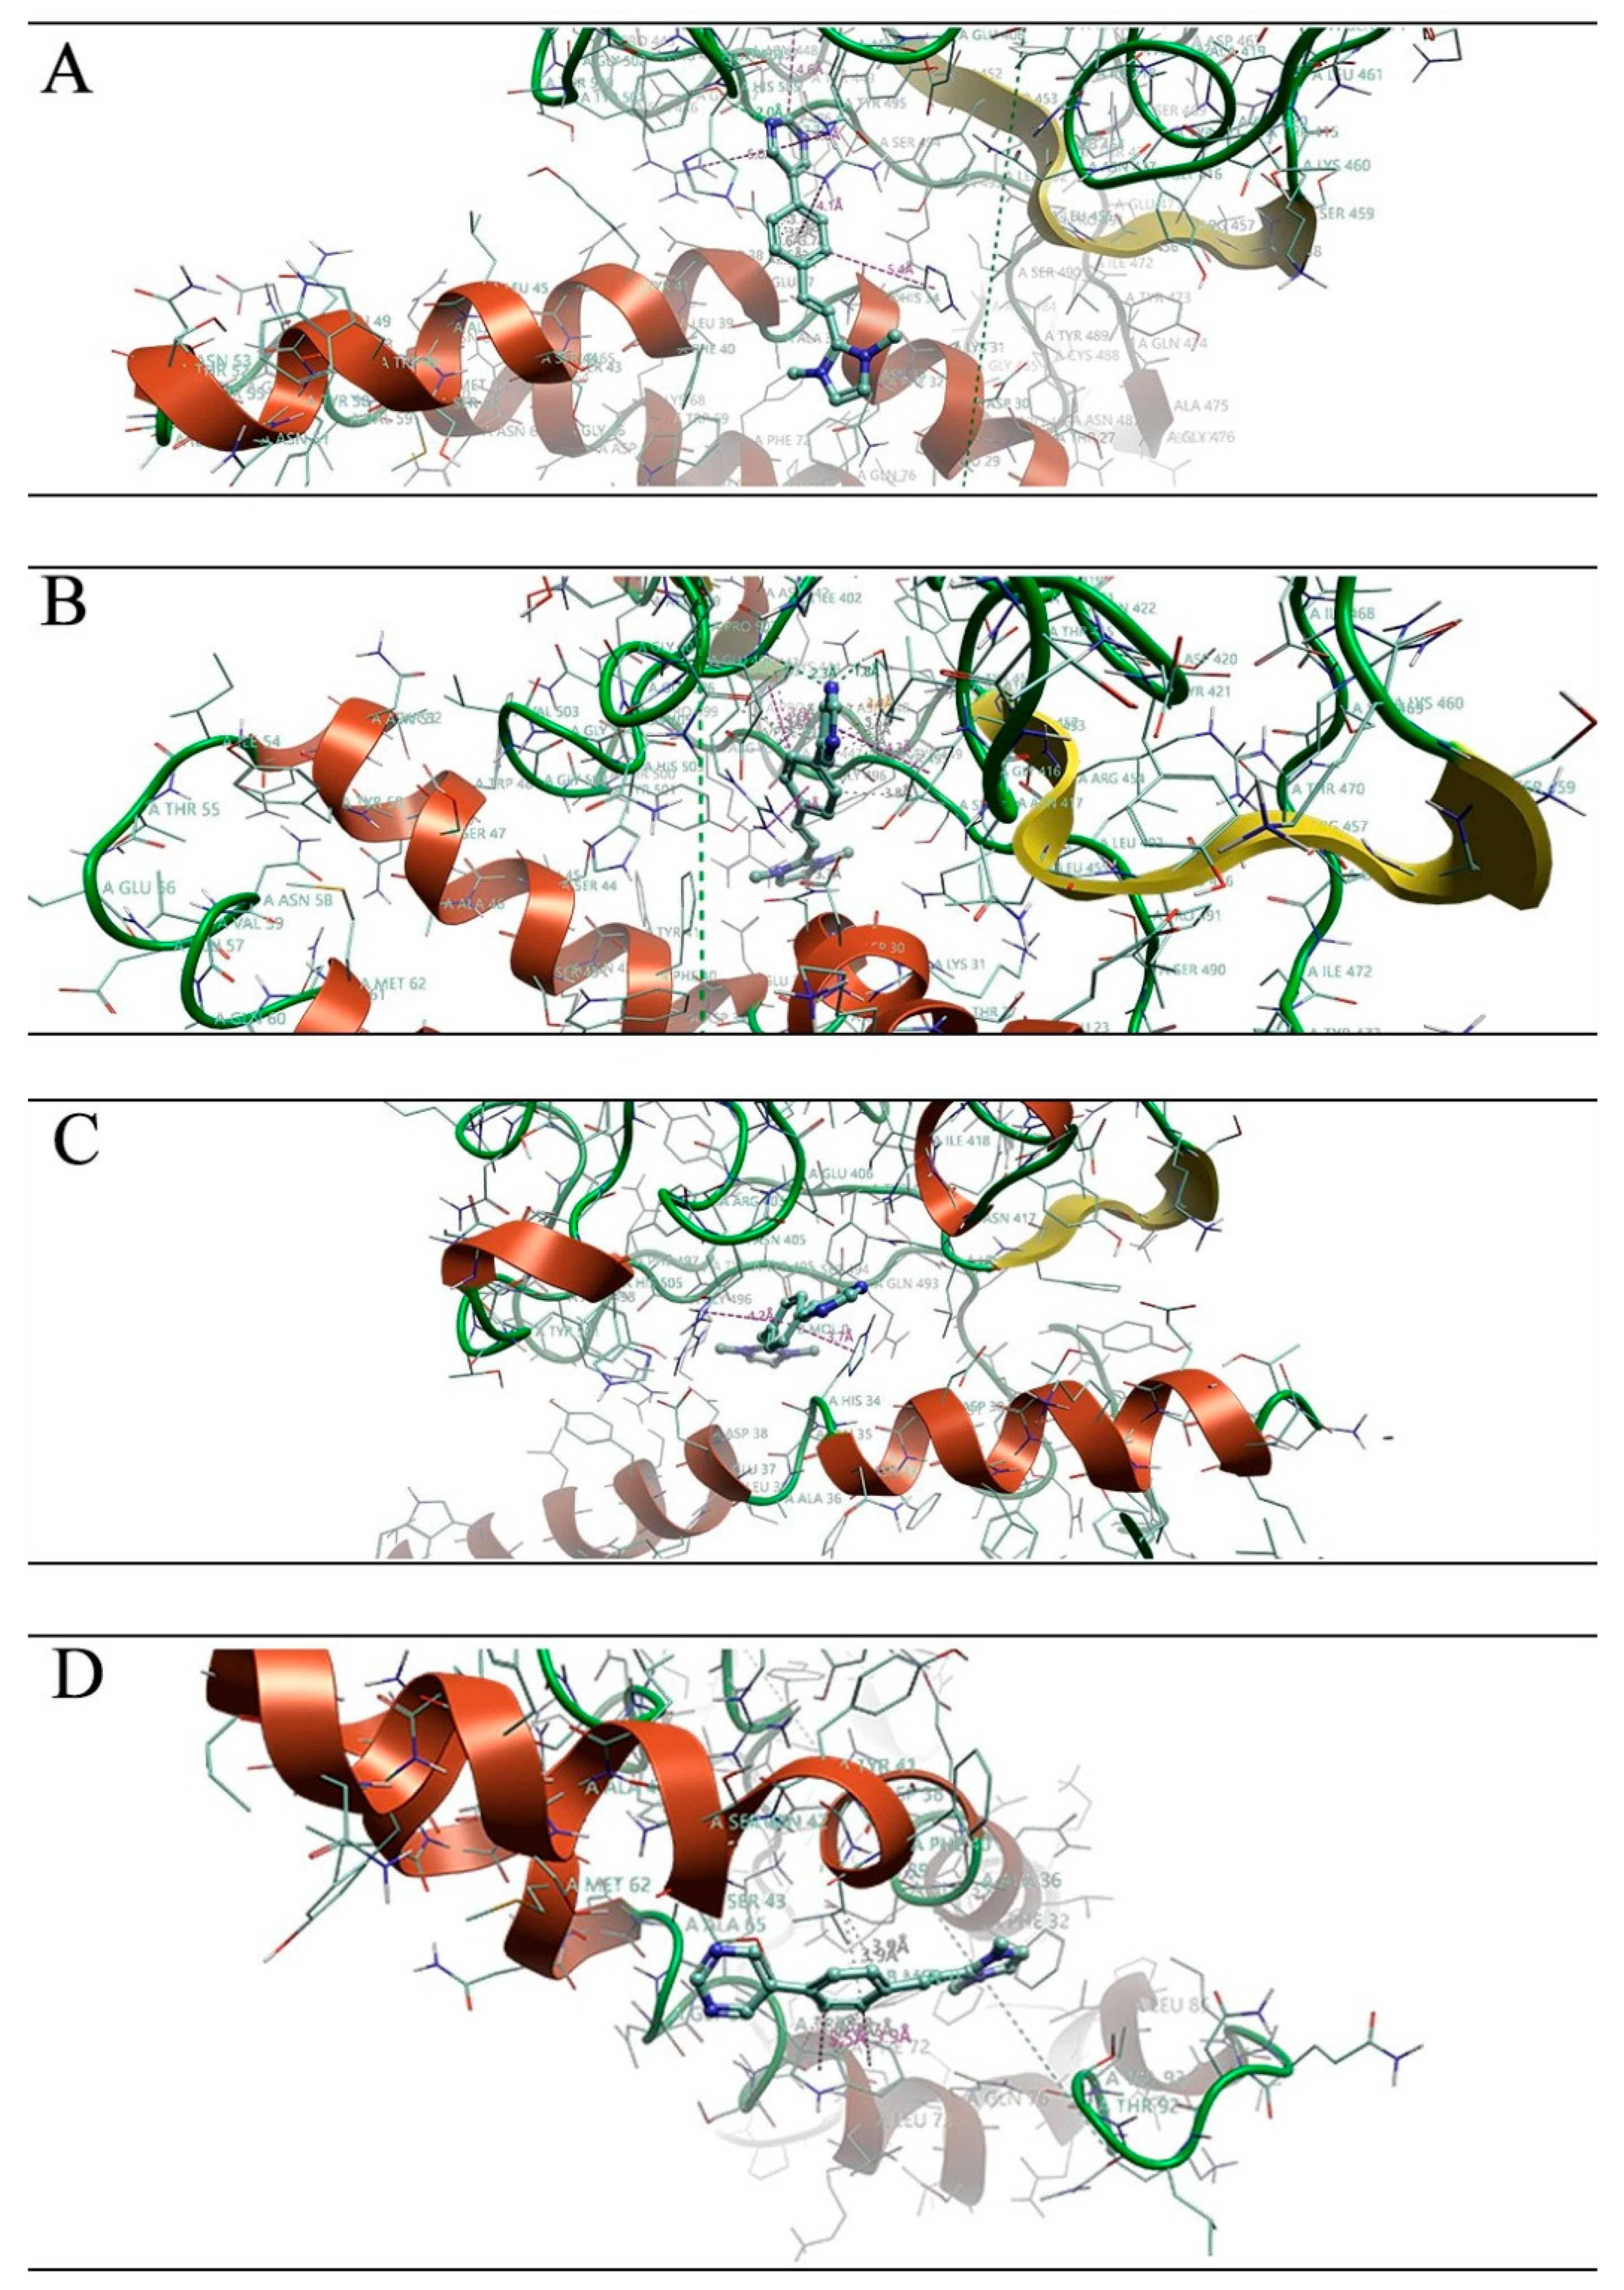
The results obtained during the simulation involving the EG.5 variant and BCC-3 ligand were the most interesting. Initially, the molecule is positioned vertically within the pocket for the first 5 ns of simulation. However, at 5 ns, it begins to orient itself perpendicularly at the interface, adopting a stable configuration throughout the simulation, as evidenced by the Root Mean Square Deviation (RMSD) (Figures S7–S10). This stability becomes apparent after 5 ns (Figure 7A). During this period, the molecule engages in aromatic interactions with the pyrimidine ring of the bicyclic portion and the benzene ring of Phe497 for the entire duration, and with the phenolic ring of Tyr453 for the entire duration. Additionally, the molecule interacts with Arg403 for the entire duration of the dynamics (Figure 7B). Notably, the benzene ring of the bicyclic portion establishes interactions with the phenolic rings of Tyr449 and Tyr495 for about 15 ns of the entire duration. The pyrimidine ring establishes hydrogen bonds with Arg403 and Gly496 from about 5 ns throughout the dynamics. Ultimately, the imidazole ring engages in an H-π interaction with Phe40 of the ACE2 domain.
In the simulation involving the XBB.1.16 variant, the BCC-3 ligand demonstrated the most favorable outcomes. The molecule was positioned at the interface between the spike and ACE, perpendicularly, serving as an intercalant. The molecule exhibits stability from the outset, as demonstrated by the Root Mean Square Deviation (RMSD) (Figures S10–S12) and maintains these interactions with His34 of the ACE2 portion and with Arg403 and His505 for approximately 22 ns, establishing π-π and H-π interactions (Figure 7C). The bicyclic portion of the molecule is characterized by the presence of a pyrimidine ring, which occasionally forms hydrogen bonds with Asn405 and Asn417 between 4 and 15 nanoseconds (Figure 7C,D). The loss of these interactions that contribute to stability results in a closer proximity to the ACE2 portion for the remainder of the dynamics. During this part of the simulation, brief interactions are established with various amino acids of the ACE2 region, including Trp69, Phe32, Glu37, Leu39, Phe40, and Trp69.
The most effective ligand for interacting with the MERS virus is BCC-2, according to the observation of the dynamics simulations. Throughout the entirety of the simulation, the ligand was observed to be positioned at the interface between the spike and ACE2. At the beginning of its interaction, the molecule seeks to establish stability, as evidenced by its root mean square deviation (RMSD) (Figure 8A,B and Figures S13–S15). Subsequently, it settles into its final position at the interface, aligning itself almost parallel to the ACE2 loop, occupying the entire pocket horizontally. The pyrimidine ring of the bicyclic portion faces towards the center of the pocket, while the quinoline portion orients towards the outside. The pyrimidine ring of the bicyclic portion establishes H-bond interactions with Gln76 occasionally throughout the dynamics. The benzene ring of the bicyclic portion establishes H-π and π-π interactions with Arg542, Tyr540 of the spike protein, and with Lys68 and Leu39 throughout the dynamics. Finally, the quinolinic portion establishes H-π and π-π interactions throughout the dynamics with Arg542 and Tyr541.
In contrast, dynamics performed on the SARS-CoV1 protein at the interface with ACE2 showed interesting results for the BCC-1 ligand (Figure 8C,D and Figures S16–S18). The ligand occupies a position at the interface between the spike and ACE2, functioning as an intercalant throughout the dynamics. Specifically, the ligand remains anchored to the pocket by the pyrimidine ring of the bicyclic portion, instead exposing the pyridine portion to the outside of the pocket. In the course of molecular dynamics simulations, the pyrimidine moiety engages in π-π interactions with Tyr491 and Tyr484. These interactions persist for roughly 9 nanoseconds and 3–8 nanoseconds, respectively, as observed during the simulations. The pyrimidine moiety also establishes an H-bond with Asn479 during the initial 8 ns of the dynamics. The benzene ring establishes interactions with Glu37, Tyr41, and Tyr491 alternating throughout the duration of the dynamics. Finally, the pyridine portion establishes initial rapid interactions during the first 2 ns of the dynamics with Tyr491 and Tyr484 during the first 4 ns of the dynamics.
Ultimately, the MMBGSA calculations were conducted for each pocket in combination with each ligand to determine free energy values. According to the results of docking and molecular dynamics simulations, the following pocket had a lower ΔG value and an improved binding. Pocket 2 from BA.2.75, CH.1.1, EG.5, and XBB.1.16 variants of SARS-CoV-2 displayed the best results. For SARS-CoV-1, the binding of BCC-1 with pocket 2 was observed to be the most favorable, while BCC-2 with pocket 1 for MERS virus was the most promising binding (Table 5).
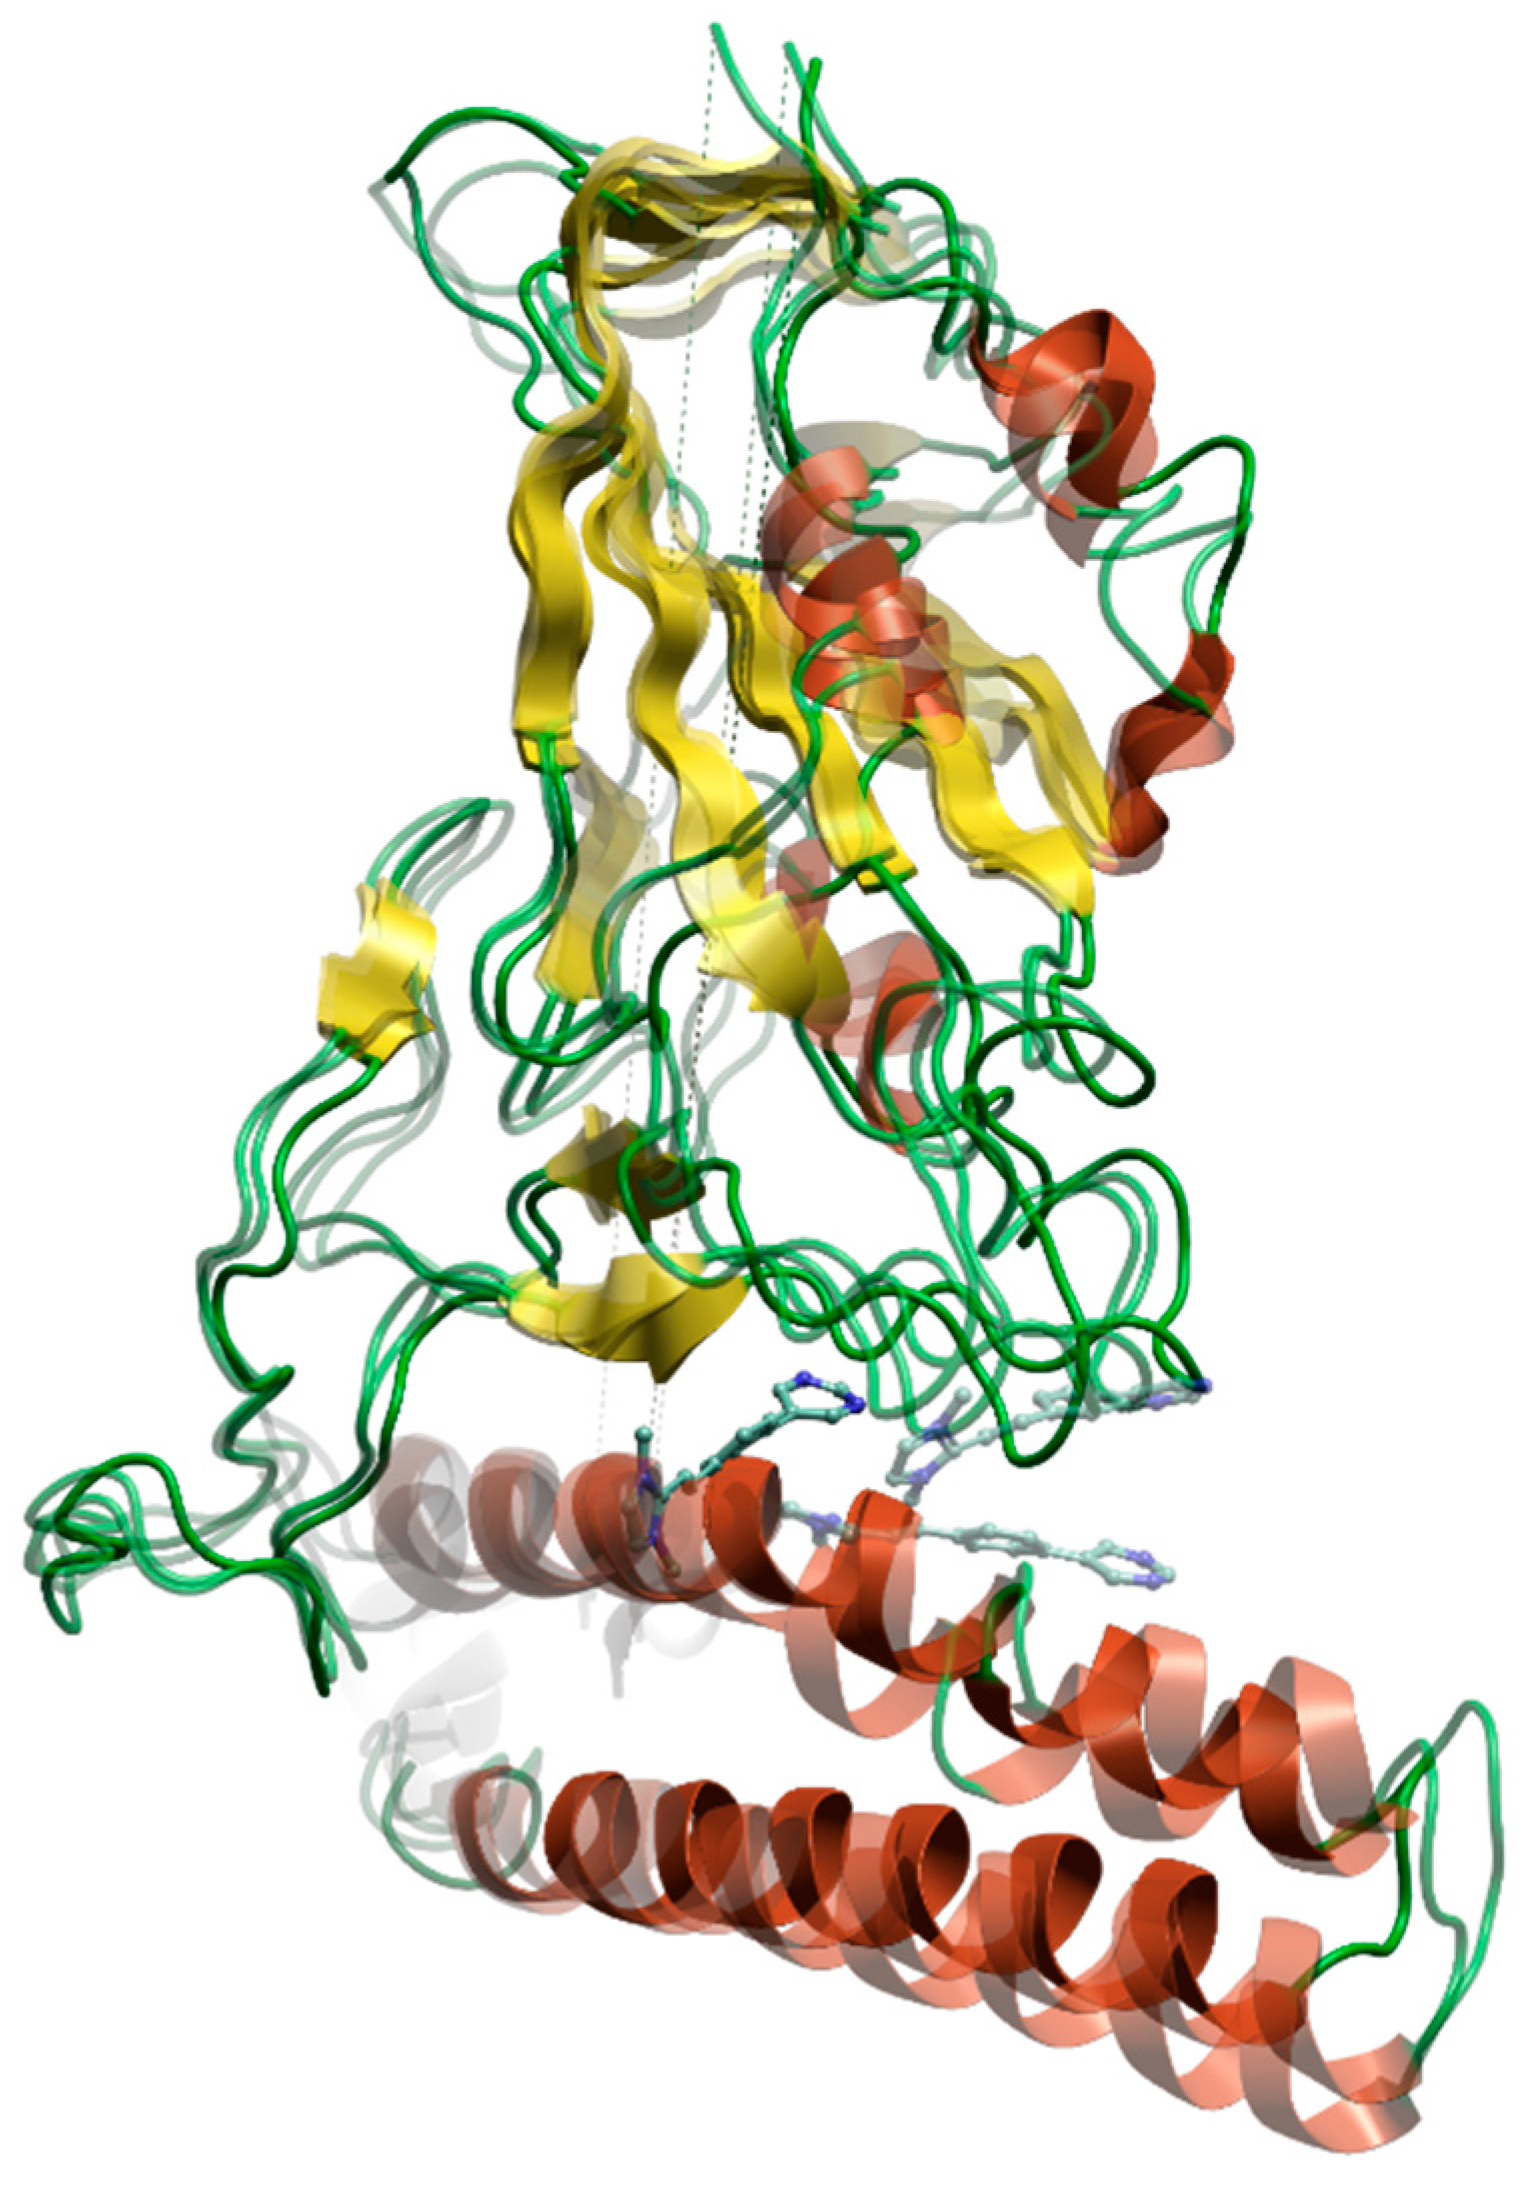
Figure 9A illustrates the superimposition of the MERS virus (depicted in blue) and the Omicron variant of SARS-CoV-2 (depicted in magenta). The two structures exhibit similarities; however, they demonstrate diversity at the terminus of the chain, where the MERS virus possesses a longer amino acid sequence, as evidenced by the figure. The same phenomenon is also demonstrated in Figure 9B, which illustrates the superimposition between SARS-CoV-1 (depicted in green) and the MERS virus. Figure 9C demonstrates a high degree of structural similarity between SARS-CoV-1 and SARS-CoV-2, which exhibit highly comparable amino acid sequences, as evidenced by the tertiary structure of the two proteins. Furthermore, Figure 10 illustrates the protein alignment, facilitating the identification of protein sequences and their homology. Notably, within the amino acid range associated with the evaluated pockets for all three viruses, SARS-CoV-2 and SARS-CoV-1 exhibit multiple identical amino acids in their respective sequences (Figure 10).

3.3. Quantum Mechanical Studies

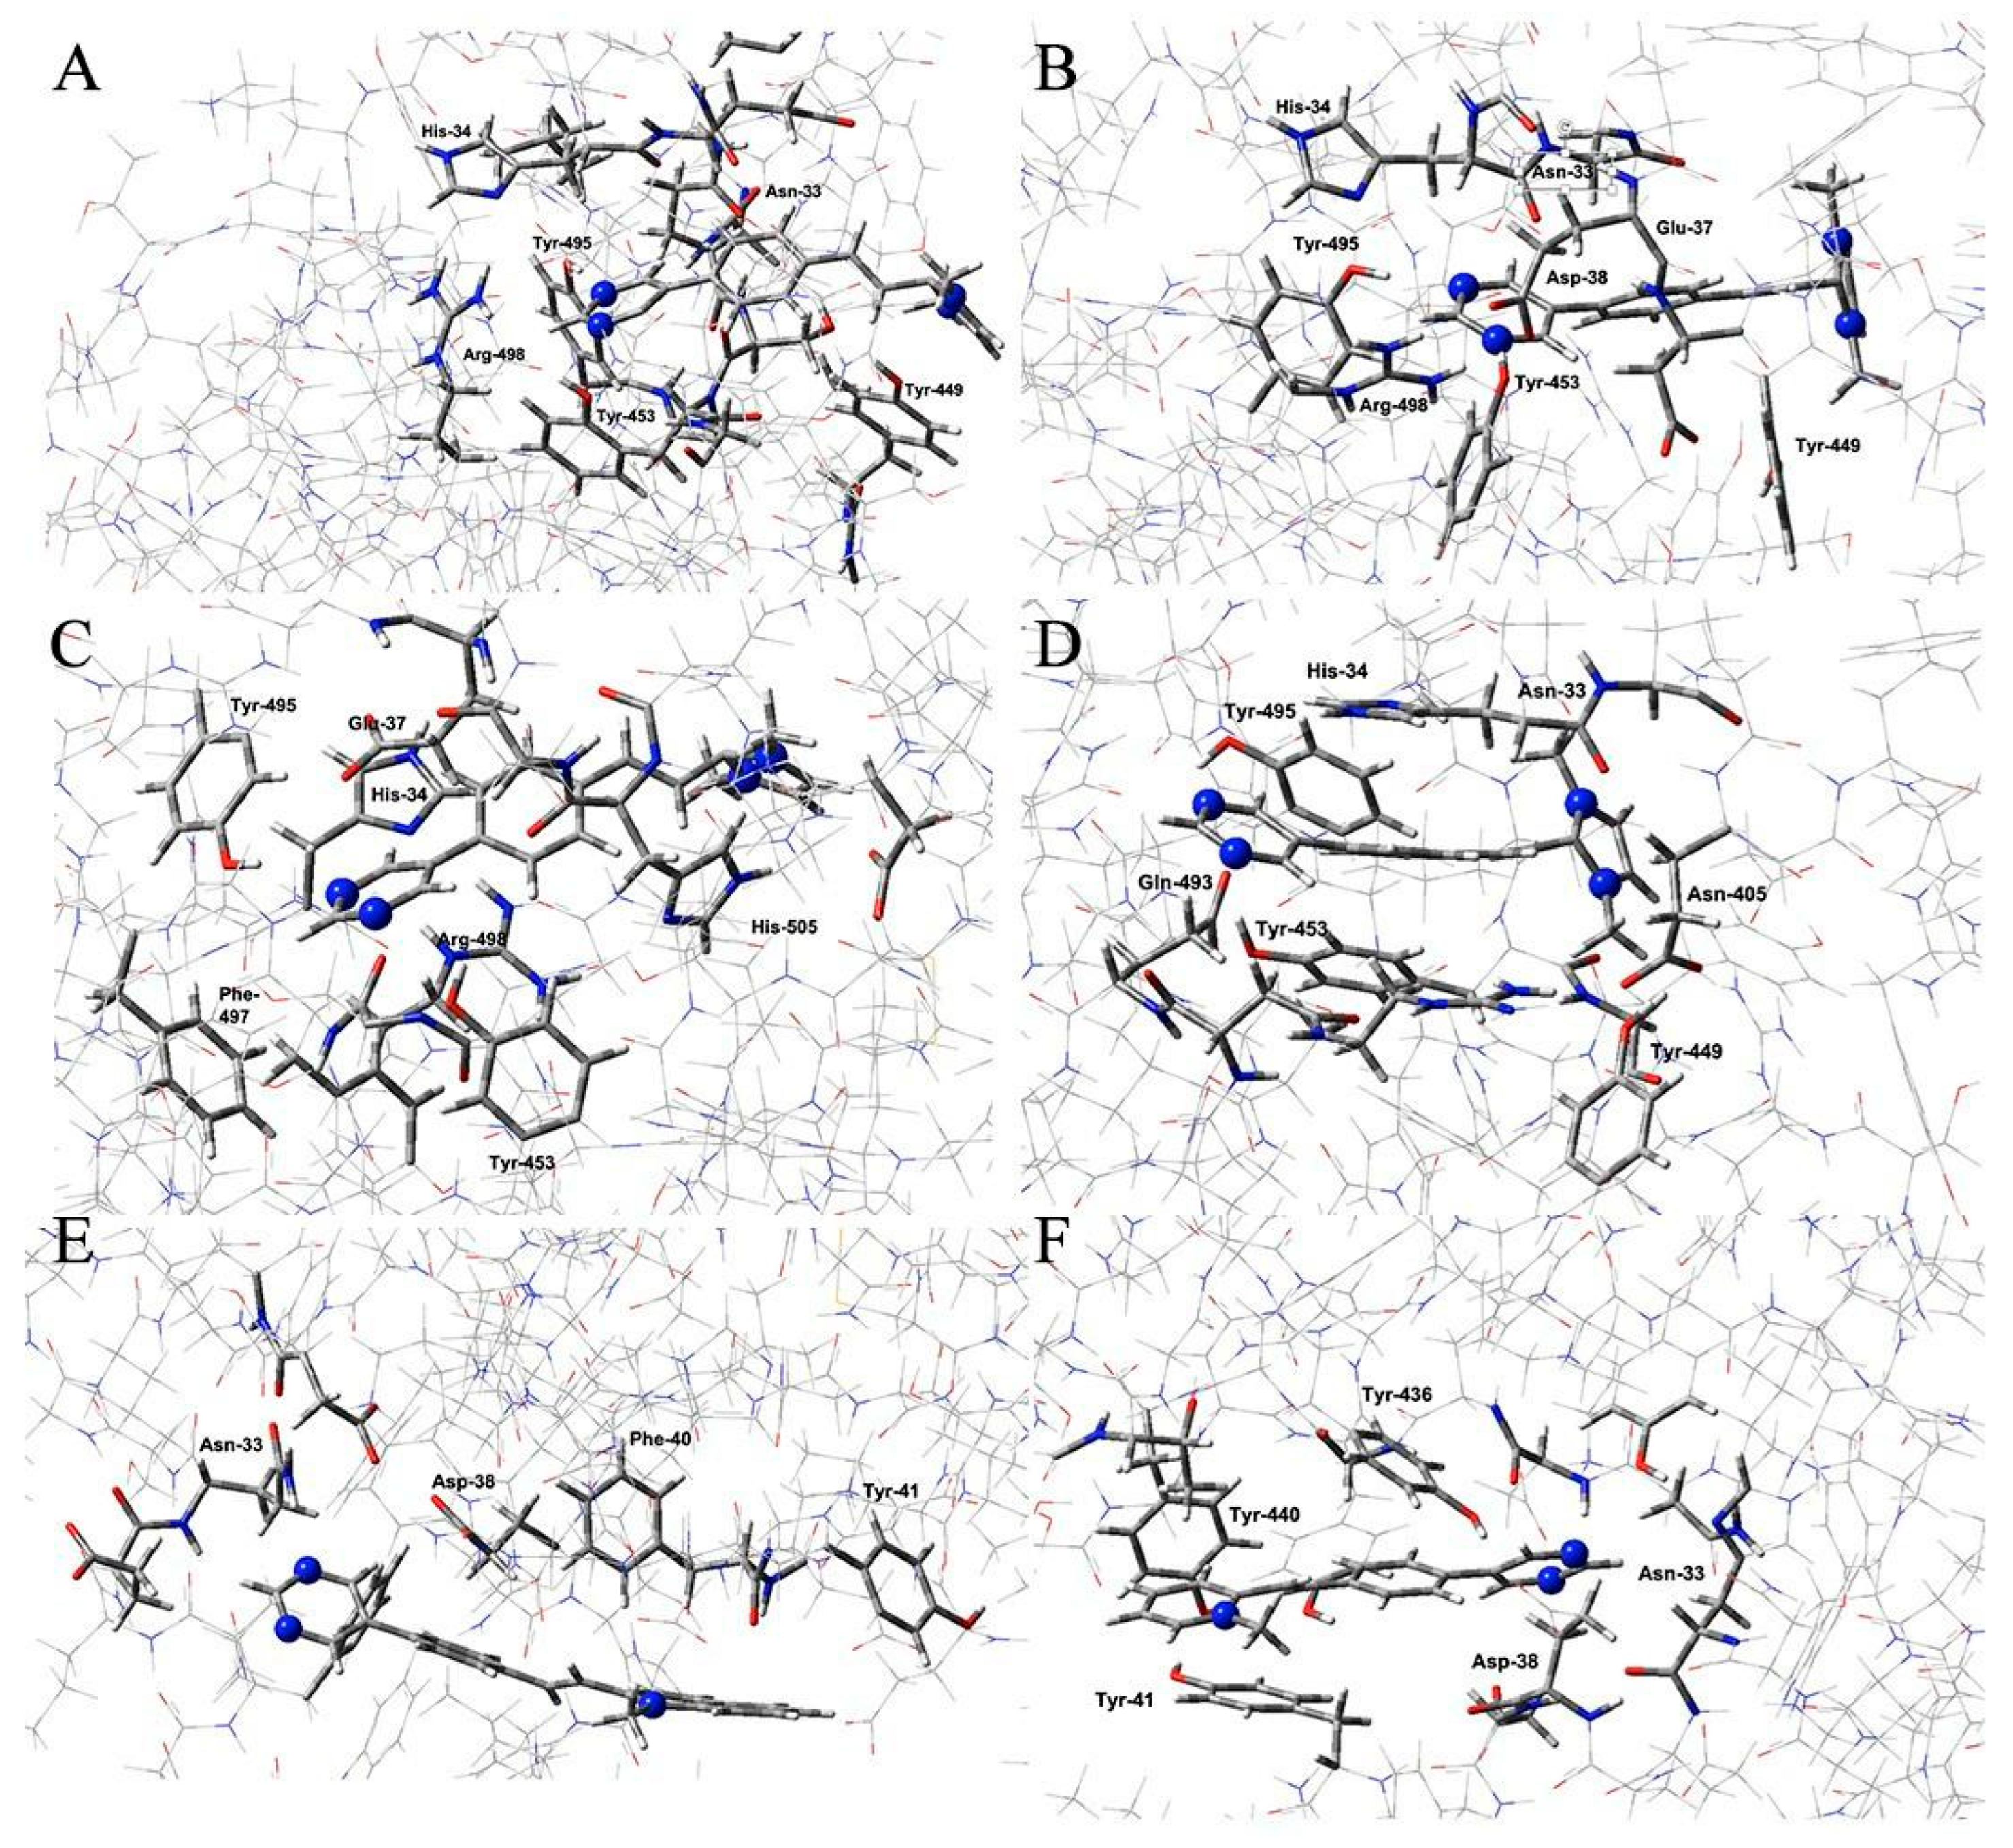
ONIOM calculations performed on the ligand BCC-3 positioned in pocket 2 for both Omicron variants and SARS-CoV-1 have indicated that the most favorable interactions in these configurations arise from weak attractive forces acting in the vicinity of the ligand, which contribute to the overall stabilization of the complex. In all cases, the study confirms the involvement of interactions between the tyrosine residues Tyr453 and Tyr495 and the pyrimidine moiety of the ligand. Additionally, this moiety exhibits a relevant interaction with the His34 residue (see Figure 7).
A significant stabilizing contribution is provided by the Arg498 residue in the BA, CH, and EG Omicron variants, while in the XBB variant, Gln493 plays a predominant role. Notably, the Asn33 residue contributes to stabilization in all cases except for the EG variant. Furthermore, interactions involving aspartic and glutamic acid residues result in the lowest binding energy for the ligand-CH complex (see Table 6). For SARS-CoV-1, the interaction between pocket 2 and ligand BCC-1 was analyzed, while in the case of MERS, the interaction between ligand BCC-2 and RBD pocket 1 was examined. In SARS-CoV-1, the amino acid residues interacting with the ligand differ from those observed in Omicron variants, with only Asn33 being commonly involved. More broadly, residues Tyr41, Tyr436, and Tyr440 contribute to the stabilization of the complex. Finally, regarding the BCC-2-MERS interaction, although favorable—as evidenced by the energy values reported in Table 6—the number of amino acids participating in the interaction is limited. In this case as well, the role of the asparagine residue is noteworthy, along with contributions from phenylalanine and tyrosine residues, which contain aromatic rings (Figure 11A–E).
Table 6. Target–ligand interaction energies and amino acid residues within a distance of 0.6 nm.
TargetΔE (kcal/mol)Interacting Residues
BA−16.41Asn33, His34, Tyr449, Tyr453, Tyr495, Arg498
CH−25.33Asn33, His34, Glu37, Asp38, Tyr449, Tyr453, Tyr495, Arg498
EG−20.54His34, Glu37, Tyr453, Tyr495, Phe497, Arg498, His505
XBB−19.72Asn33, His34, Asn405, Tyr449, Tyr453, Gln493, Tyr495,
Mers−9.28Asn33, Asp38, Phe40, Tyr41
SARS-CoV-1−12.60Asn33, Asp38, Tyr41, Tyr436, Tyr440

4. Discussion

The multiscale in silico workflow used here—pocket mapping with FLAP, structure-based docking, 30 ns all-atom MD simulations, MM/GBSA end-point free-energy calculations, and ONIOM (QM/MM) refinement—links sequence variation across the three betacoronavirus lineages to the ligand preferences of their spike-protein receptor-binding domains (RBDs). Docking scores (Table 3), binding-free energies (Table 3 and Table 4), and 2-D/3-D interaction maps (Figure 3) converge on three overarching themes. The first is a conserved anchoring core that persists across lineages. Superposition of the SARS-CoV-2, SARS-CoV-1, and MERS RBD–ACE2 complexes reveals an invariant micro-environment—Asn33–His34–Glu37–Asp38 of ACE2 plus the juxtaposed viral residues—at the periphery of canonical “pocket 2” (or “RBD 1” in MERS). In every simulation, this pocket hooks at least one heteroatom of the push–pull ligands, pre-organizing the bicyclic scaffold for deeper insertion. ONIOM calculations show that removing any of these residues raises the interaction energy by 3–5 kcal mol−1, confirming their functional importance. The second is the lineage-dependent substitutions subtly remodel pocket contours, reshuffling ligand affinities. Mutations decorating the four Omicron sub-variants (Table 1) reshape pocket 2 (Y453–Y495–R498–H505) and modulate ligand ranking. CH.1.1’s K444T/L452R signature enlarges the hydrophobic sub-cavity flanking Y453; BCC-3 therefore adopts a fully buried pose with the most favorable ONIOM ΔE (−25.3 kcal mol−1) and MM/GBSA ΔG (−24.0 kcal mol−1). In XBB.1.16, the Q493R→Q493 reversion introduces a polar constraint, nudging BCC-3 toward ACE2 and weakening binding to −19.4 kcal mol−1. Despite these nuances, BCC-3 remains the best overall hit for every Omicron variant in both GLOB-SUM and free-energy terms, highlighting that small structural changes in the protein can fine-tune—but rarely overturn—the intrinsic fit of the push–pull scaffold. Finally, pocket plasticity explains the divergent behavior of SARS-CoV-1 and MERS. In SARS-CoV-1, pocket 2 retains the aromatic Tyr41–Tyr436–Tyr440 cluster absent from modern SARS-CoV-2 strains, creating an extended π-rich cradle. The planar pyridinium head of BCC-1 stacks in parallel with Tyr491 and Tyr484, yielding the highest GLOB-SUM (2.063) and a MM/GBSA ΔG of −19.9 kcal mol−1; QM/MM shows these π-contacts account for >60% of the stabilization. Conversely, the broader, more solvent-exposed MERS RBD, delineated by Trp535–Tyr540–Arg542, favors the bulkier quinolinium tail of BCC-2, which exploits hydrophobic and cation-π contacts inaccessible to the smaller ligands (GLOB-SUM = 2.376; ΔG = −22.3 kcal mol−1). However, the reduced number of direct contacts produces a shallower ONIOM energy well (−9.3 kcal mol−1), illustrating the enthalpy–entropy trade-off that accompanies binding to a flatter surface. Notably, FLAP fails to detect a well-defined pocket in the equivalent MERS region, mirroring the experimental observation that this area is more open and dynamic.

5. Conclusions

By integrating docking metrics, MD trajectories, MM/GBSA free-energy landscapes, and QM/MM interaction fingerprints, this study builds a coherent structure–activity framework for push–pull heterocycles as cross-variant coronavirus entry inhibitors. The combined protocol reconciles lineage-specific binding idiosyncrasies with conserved structural motifs and generates concrete signposts for the next optimization cycle. The distinctive behavior of the four Omicron sub-variants stems from the substitutions listed in Table 1, which subtly remodel pocket 2. Two-dimensional contact maps instantly reveal which ligand fragments engage which residues, acting as cartographic guides to the principal hot spots. Coupling those static pictures with MM/GBSA scores adds a quantitative axis: the more negative the ΔG, the firmer the predicted grip, allowing robust prioritization. Binding, however, never occurs in isolation. Structural superimposition of receptor-binding domains across SARS-CoV-2, SARS-CoV-1, and MERS uncovers an invariant anchoring kernel in the first two but a divergent C-terminal landscape in MERS, clarifying its weaker affinity for human ACE2 [32]. This broader view shows how local adjustments introduced by Omicron fine-tune affinity, whereas lineage-scale geometry dictates host tropism and pathogenic potential. Taken together, the contact maps, free-energy rankings, and cross-lineage overlays converge on a single narrative: Omicron mutations refine the local contacts that matter most, while larger-scale conformational shifts set the ceiling for binding efficiency. These insights point to hybrid chemotypes that marry the deep-buried pyridinium head of BCC-3 with the solvent-oriented quinolinium tail of BCC-2, aiming to span all three lineages without compromising target engagement. Future experimental validation, including surface plasmon resonance and live-virus neutralization assays, will be essential to translate these in silico predictions into clinical candidates safely and rapidly. Ultimately, the integrative strategy deployed here exemplifies how multiscale computation can rationally steer antiviral discovery, turning dispersed datasets into unified, actionable knowledge.

Supplementary Materials

The following supporting information can be downloaded at https://www.mdpi.com/article/10.3390/chemistry7040132/s1, Figure S1–Molecular dynamics (30 ns) RMSD graph of protein BA; Figure S2–Molecular dynamics (30 ns) RMSF of protein BA; Figure S3–Molecular dynamics (30 ns) Radius of Gyration of protein BA; Figure S4–Molecular dynamics (30 ns) RMSD graph of protein CH; Figure S5–Molecular dynamics (30 ns) RMSF graph of protein CH; Figure S6–Molecular dynamics (30 ns) Radius of Gyration graph of protein CH; Figure S7–Molecular dynamics (30 ns) RMSD graph of protein EG; Figure S8–Molecular dynamics (30 ns) RMSF graph of protein EG; Figure S9–Molecular dynamics (30 ns) Radius of Gyration graph of protein EG; Figure S10–Molecular dynamics (30 ns) RMSD graph of protein XBB; Figure S11–Molecular dynamics (30 ns) RMSF graph of protein XBB; Figure S12–Molecular dynamics (30 ns) Radius of Gyration graph of protein XBB; Figure S13–Molecular dynamics (30 ns) RMSD graph of protein MERS; Figure S14–Molecular dynamics (30 ns) RMSF graph of protein MERS; Figure S15–Molecular dynamics (30 ns) Radius of Gyration graph of protein MERS; Figure S16–Molecular dynamics (30 ns) RMSD graph of protein SARS1; Figure S17–Molecular dynamics (30 ns) RMSF graph of protein SARS1; Figure S18–Molecular dynamics (30 ns) Radius of Gyration graph of protein SARS1.

Author Contributions

Conceptualization, S.R., G.F., and C.G.F.; methodology S.R., F.S., and G.C.; validation, G.C., G.F., C.B., C.G.F., and S.R.; formal analysis, G.C., G.F., C.G.F., and S.R.; investigation, F.S., S.R., G.C., G.V., M.N., and G.F.; resources, S.R., G.F., and C.G.F.; writing—original draft preparation, S.R., G.F., and G.C.; writing—review and editing, G.C., G.F., G.V., C.G.F., and S.R.; funding acquisition, S.R. All authors have read and agreed to the published version of the manuscript.

Funding

“This work was supported by grants funded by the University of Catania (“GRABIO”, PI: Cristina Satriano, Co-PI: Simone Ronsisvalle). Progetto PRIN 2022, avviso di riferimento D.D. 104 del 02/02/2022, piano di riferimento PNRR, Missione 4, Componente 2, Investimento 1.1, Project Title: FRASTUCA−CUP: E53D2301006 0006–Code: 2022WYFST2, UPB: 51723152021. INF-ACT-ONE HEALTH BASIC and Translational Research Actions addressing Unmet Needs on Emerging Infectious Diseases” di cui all’avviso del Ministero dell’Università e della Ricerca n°341 del 15 Marzo 2022 a valere sul Programma M4C2, -dalla ricerca all’impresa, -Investimento 1.3: Creazione di “Paternariati estesi all’università, ai centri di ricerca, alle aziende, per il finanziamento di progetti di ricerca di base” finanziato dall’Unione Europea, Next Generation EU, CUP: E63C22002090006.

Conflicts of Interest

The authors declare no conflict of interest.

Abbreviations

The following abbreviations are used in this manuscript:
SARSsevere acute respiratory syndrome
MERSMiddle East respiratory syndrome
COVID-19coronavirus disease 2019
WHOWorld Health Organization
RBDreceptor-binding domain
SARS-CoVSevere Acute Respiratory Syndrome Coronavirus
MERS-CoVMiddle East Respiratory Syndrome Coronavirus
BCC1(E)-1-methyl-2-4-(pyrimidin-5-yl) styryl) pyridin-1-ium
BCC2(E)-1-methyl-2-4-(pyrimidin-5-yl) styryl) quinolin-1-ium
BCC3(E)-1,3-dimethyl-2-4-(pyrimidin-5-yl)styryl)-1-h-imidazol-3-ium

References

  1. Rabaan, A.A.; Al-Ahmed, S.H.; Haque, S.; Sah, R.; Tiwari, R.; Malik, Y.S.; Dhama, K.; Yatoo, M.I.; Bonilla-Aldana, D.K.; Rodriguez-Morales, A.J. SARS-CoV-2, SARS-CoV, and MERS-CoV: A comparative overview. Infez. Med. 2020, 28, 174–184. [Google Scholar]
  2. Huang, Y.; Yang, C.; Xu, X.F.; Xu, W.; Liu, S.W. Structural and functional properties of SARS-CoV-2 spike protein: Potential antivirus drug development for COVID-19. Acta Pharmacol. Sin. 2020, 41, 1141–1149. [Google Scholar] [CrossRef]
  3. Chen, Y.; Liu, Q.; Guo, D. Emerging coronaviruses: Genome structure, replication, and pathogenesis. J. Med. Virol. 2020, 92, 418–423. [Google Scholar] [CrossRef]
  4. Vijayanand, P.; Wilkins, E.; Woodhead, M. Severe acute respiratory syndrome (SARS): A review. Clin. Med. 2004, 4, 152–160. [Google Scholar] [CrossRef]
  5. Azhar, E.I.; Hui, D.S.C.; Memish, Z.A.; Drosten, C.; Zumla, A. The Middle East Respiratory Syndrome (MERS). Infect. Dis. Clin. N. Am. 2019, 33, 891–905. [Google Scholar] [CrossRef]
  6. Santos-López, G.; Cortés-Hernández, P.; Vallejo-Ruiz, V.; Reyes-Leyva, J. SARS-CoV-2: Basic concepts, origin and treatment advances. Gac. Med. Mex. 2021, 157, 84–89. [Google Scholar] [CrossRef]
  7. Sankaran, N.; Weiss, R.A. Viruses: Impact on Science and Society. In Encyclopedia of Virology; Elsevier: Amsterdam, The Netherlands, 2021; pp. 671–680. [Google Scholar] [CrossRef]
  8. Lundstrom, K.; Seyran, M.; Pizzol, D.; Adadi, P.; Mohamed Abd El-Aziz, T.; Hassan, S.S.; Soares, A.; Kandimalla, R.; Tambuwala, M.M.; Aljabali, A.A.A.; et al. The Importance of Research on the Origin of SARS-CoV-2. Viruses 2020, 12, 1203. [Google Scholar] [CrossRef]
  9. Weng, Y.L.; Naik, S.R.; Dingelstad, N.; Lugo, M.R.; Kalyaanamoorthy, S.; Ganesan, A. Molecular dynamics and in silico mutagenesis on the reversible inhibitor-bound SARS-CoV-2 main protease complexes reveal the role of lateral pocket in enhancing the ligand affinity. Sci. Rep. 2021, 11, 7429. [Google Scholar] [CrossRef]
  10. Widagdo, W.; Okba, N.M.A.; Raj, V.S.; Haagmans, B.L. MERS-coronavirus: From discovery to intervention. One Health 2017, 3, 11–16. [Google Scholar] [CrossRef]
  11. Sipala, F.; Cavallaro, G.; Forte, G.; Satriano, C.; Giuffrida, A.; Fraix, A.; Spadaro, A.; Petralia, S.; Bonaccorso, C.; Fortuna, C.G.; et al. Different In Silico Approaches Using Heterocyclic Derivatives against the Binding between Different Lineages of SARS-CoV-2 and ACE2. Molecules 2023, 28, 3908. [Google Scholar] [CrossRef]
  12. Brüssow, H. COVID-19: Omicron—The latest, the least virulent, but probably not the last variant of concern of SARS-CoV-2. Microb. Biotechnol. 2022, 15, 1927–1939. [Google Scholar] [CrossRef]
  13. Yamasoba, D.; Uriu, K.; Plianchaisuk, A.; Kosugi, Y.; Pan, L.; Zahradnik, J.; Ito, J.; Sato, K. Virological characteristics of the SARS-CoV-2 omicron XBB.1.16 variant. Lancet Infect. Dis. 2023, 23, 655–656. [Google Scholar] [CrossRef]
  14. Planas, D.; Bruel, T.; Staropoli, I.; Guivel-Benhassine, F.; Porrot, F.; Maes, P.; Grzelak, L.; Prot, M.; Mougari, S.; Planchais, C.; et al. Resistance of Omicron subvariants BA.2.75.2, BA.4.6, and BQ.1.1 to neutralizing antibodies. Nat. Commun. 2023, 14, 824. [Google Scholar] [CrossRef]
  15. Parums, D.V. Editorial: A Rapid Global Increase in COVID-19 is Due to the Emergence of the EG.5 (Eris) Subvariant of Omicron SARS-CoV-2. Med. Sci. Monit. 2023, 29, e942244. [Google Scholar] [CrossRef]
  16. Bazzani, L.; Imperia, E.; Scarpa, F.; Sanna, D.; Casu, M.; Borsetti, A.; Pascarella, S.; Petrosillo, N.; Cella, E.; Giovanetti, M.; et al. SARS-CoV CH.1.1 Variant: Genomic and Structural Insight. Infect. Dis. Rep. 2023, 15, 292–298. [Google Scholar] [CrossRef]
  17. Lan, J.; Ge, J.; Yu, J.; Shan, S.; Zhou, H.; Fan, S.; Zhang, Q.; Shi, X.; Wang, Q.; Zhang, L.; et al. Structure of the SARS-CoV-2 spike receptor-binding domain bound to the ACE2 receptor. Nature 2020, 581, 215–220. [Google Scholar] [CrossRef]
  18. Wrapp, D.; De Vlieger, D.; Corbett, K.S.; Torres, G.M.; Wang, N.; Van Breedam, W.; Roose, K.; van Schie, L.; Hoffmann, M.; Pöhlmann, S.; et al. Structural Basis for Potent Neutralization of Betacoronaviruses by Single-Domain Camelid Antibodies. Cell 2020, 181, 1004–1015.e15. [Google Scholar] [CrossRef]
  19. Kuhn, M.; Firth-Clark, S.; Tosco, P.; Mey, A.S.J.S.; Mackey, M.; Michel, J. Assessment of binding affinity via alchemical free-energy calculations. J. Chem. Inf. Model. 2020, 60, 3120–3130. [Google Scholar] [CrossRef]
  20. Bauer, M.R.; Mackey, M.D. Electrostatic complementarity as a fast and effective tool to optimize binding and selectivity of protein–ligand complexes. J. Med. Chem. 2019, 62, 3036–3050. [Google Scholar] [CrossRef]
  21. Cheeseright, T.; Mackey, M.; Rose, S.; Vinter, A. Molecular field extrema as descriptors of biological activity: Definition and validation. J. Chem. Inf. Model. 2006, 46, 665–676. [Google Scholar] [CrossRef]
  22. Baroni, M.; Cruciani, G.; Sciabola, S.; Perruccio, F.; Mason, J.S. A Common Reference Framework for Analyzing/Comparing Proteins and Ligands. Fingerprints for Ligands and Proteins (FLAP): Theory and Application. J. Chem. Inf. Model. 2007, 47, 279–294. [Google Scholar] [CrossRef]
  23. Carosati, E.; Sciabola, S.; Cruciani, G. Hydrogen Bonding Interactions of Covalently Bonded Fluorine Atoms: From Crystallographic Data to a New Angular Function in the GRID Force Field. J. Med. Chem. 2004, 47, 5114–5125. [Google Scholar] [CrossRef] [PubMed]
  24. Goodford, P.J. A Computational Procedure for Determining Energetically Favorable Binding Sites on Biologically Important Macromolecules. J. Med. Chem. 1985, 28, 849–857. [Google Scholar] [CrossRef] [PubMed]
  25. Bojadzic, D.; Alcazar, O.; Chen, J.; Chuang, S.T.; Condor Capcha, J.M.; Shehadeh, L.A.; Buchwald, P. Small-Molecule Inhibitors of the Coronavirus Spike: ACE2 Protein–Protein Interaction as Blockers of Viral Attachment and Entry for SARS-CoV-2. ACS Infect. Dis. 2021, 7, 1519–1534. [Google Scholar] [CrossRef]
  26. Case, D.A.; Babin, V.; Berryman, J.; Betz, R.M.; Cai, Q.; Cerutti, D.S.; Cheatham, T.E.; Darden, T.A.; Duke, R.E.; Gohlke, H.; et al. AMBER 14; University of California: San Francisco, CA, USA, 2014; pp. 1–826. [Google Scholar]
  27. Dapprich, S.; Komáromi, I.; Byun, K.S.; Morokuma, K.; Frisch, M.J. A new ONIOM implementation in Gaussian98. Part I. The calculation of energies, gradients, vibrational frequencies and electric field derivatives. J. Mol. Struct. THEOCHEM 1999, 461–462, 1–21. [Google Scholar] [CrossRef]
  28. Chung, L.W.; Sameera, W.M.C.; Ramozzi, R.; Page, A.J.; Hatanaka, M.; Petrova, G.P.; Harris, T.V.; Li, X.; Ke, Z.; Liu, F.; et al. The ONIOM Method and Its Applications. Chem. Rev. 2015, 115, 5678–5796. [Google Scholar] [CrossRef] [PubMed]
  29. Dauber-Osguthorpe, P.; Roberts, V.A.; Osguthorpe, D.J.; Wolff, J.; Genest, M.; Hagler, A.T. Structure and energetics of ligand binding to proteins: Escherichia coli dihydrofolate reductase-trimethoprim, a drug-receptor system. Proteins 1988, 4, 31–47. [Google Scholar] [CrossRef]
  30. Forte, G.; Grassi, A.; Marletta, G. Molecular modeling of oligopeptide adsorption onto functionalized quartz surfaces. J. Phys. Chem. B 2007, 111, 11237–11243. [Google Scholar] [CrossRef]
  31. Frisch, M.J.; Trucks, G.W.; Schlegel, H.B.; Scuseria, G.E.; Robb, M.A.; Cheeseman, J.R.; Scalmani, G.; Barone, V.; Petersson, G.A.; Nakatsuji, H.; et al. Gaussian 16 Revision C.01; Gaussian Inc.: Wallingford, CT, USA, 2016. [Google Scholar]
  32. Xiong, Q.; Cao, L.; Ma, C.; Tortorici, M.A.; Liu, C.; Si, J.; Liu, P.; Gu, M.; Walls, A.C.; Wang, C.; et al. Close relatives of MERS-CoV in bats use ACE2 as their functional receptors. Nature 2022, 612, 748–757. [Google Scholar] [CrossRef]
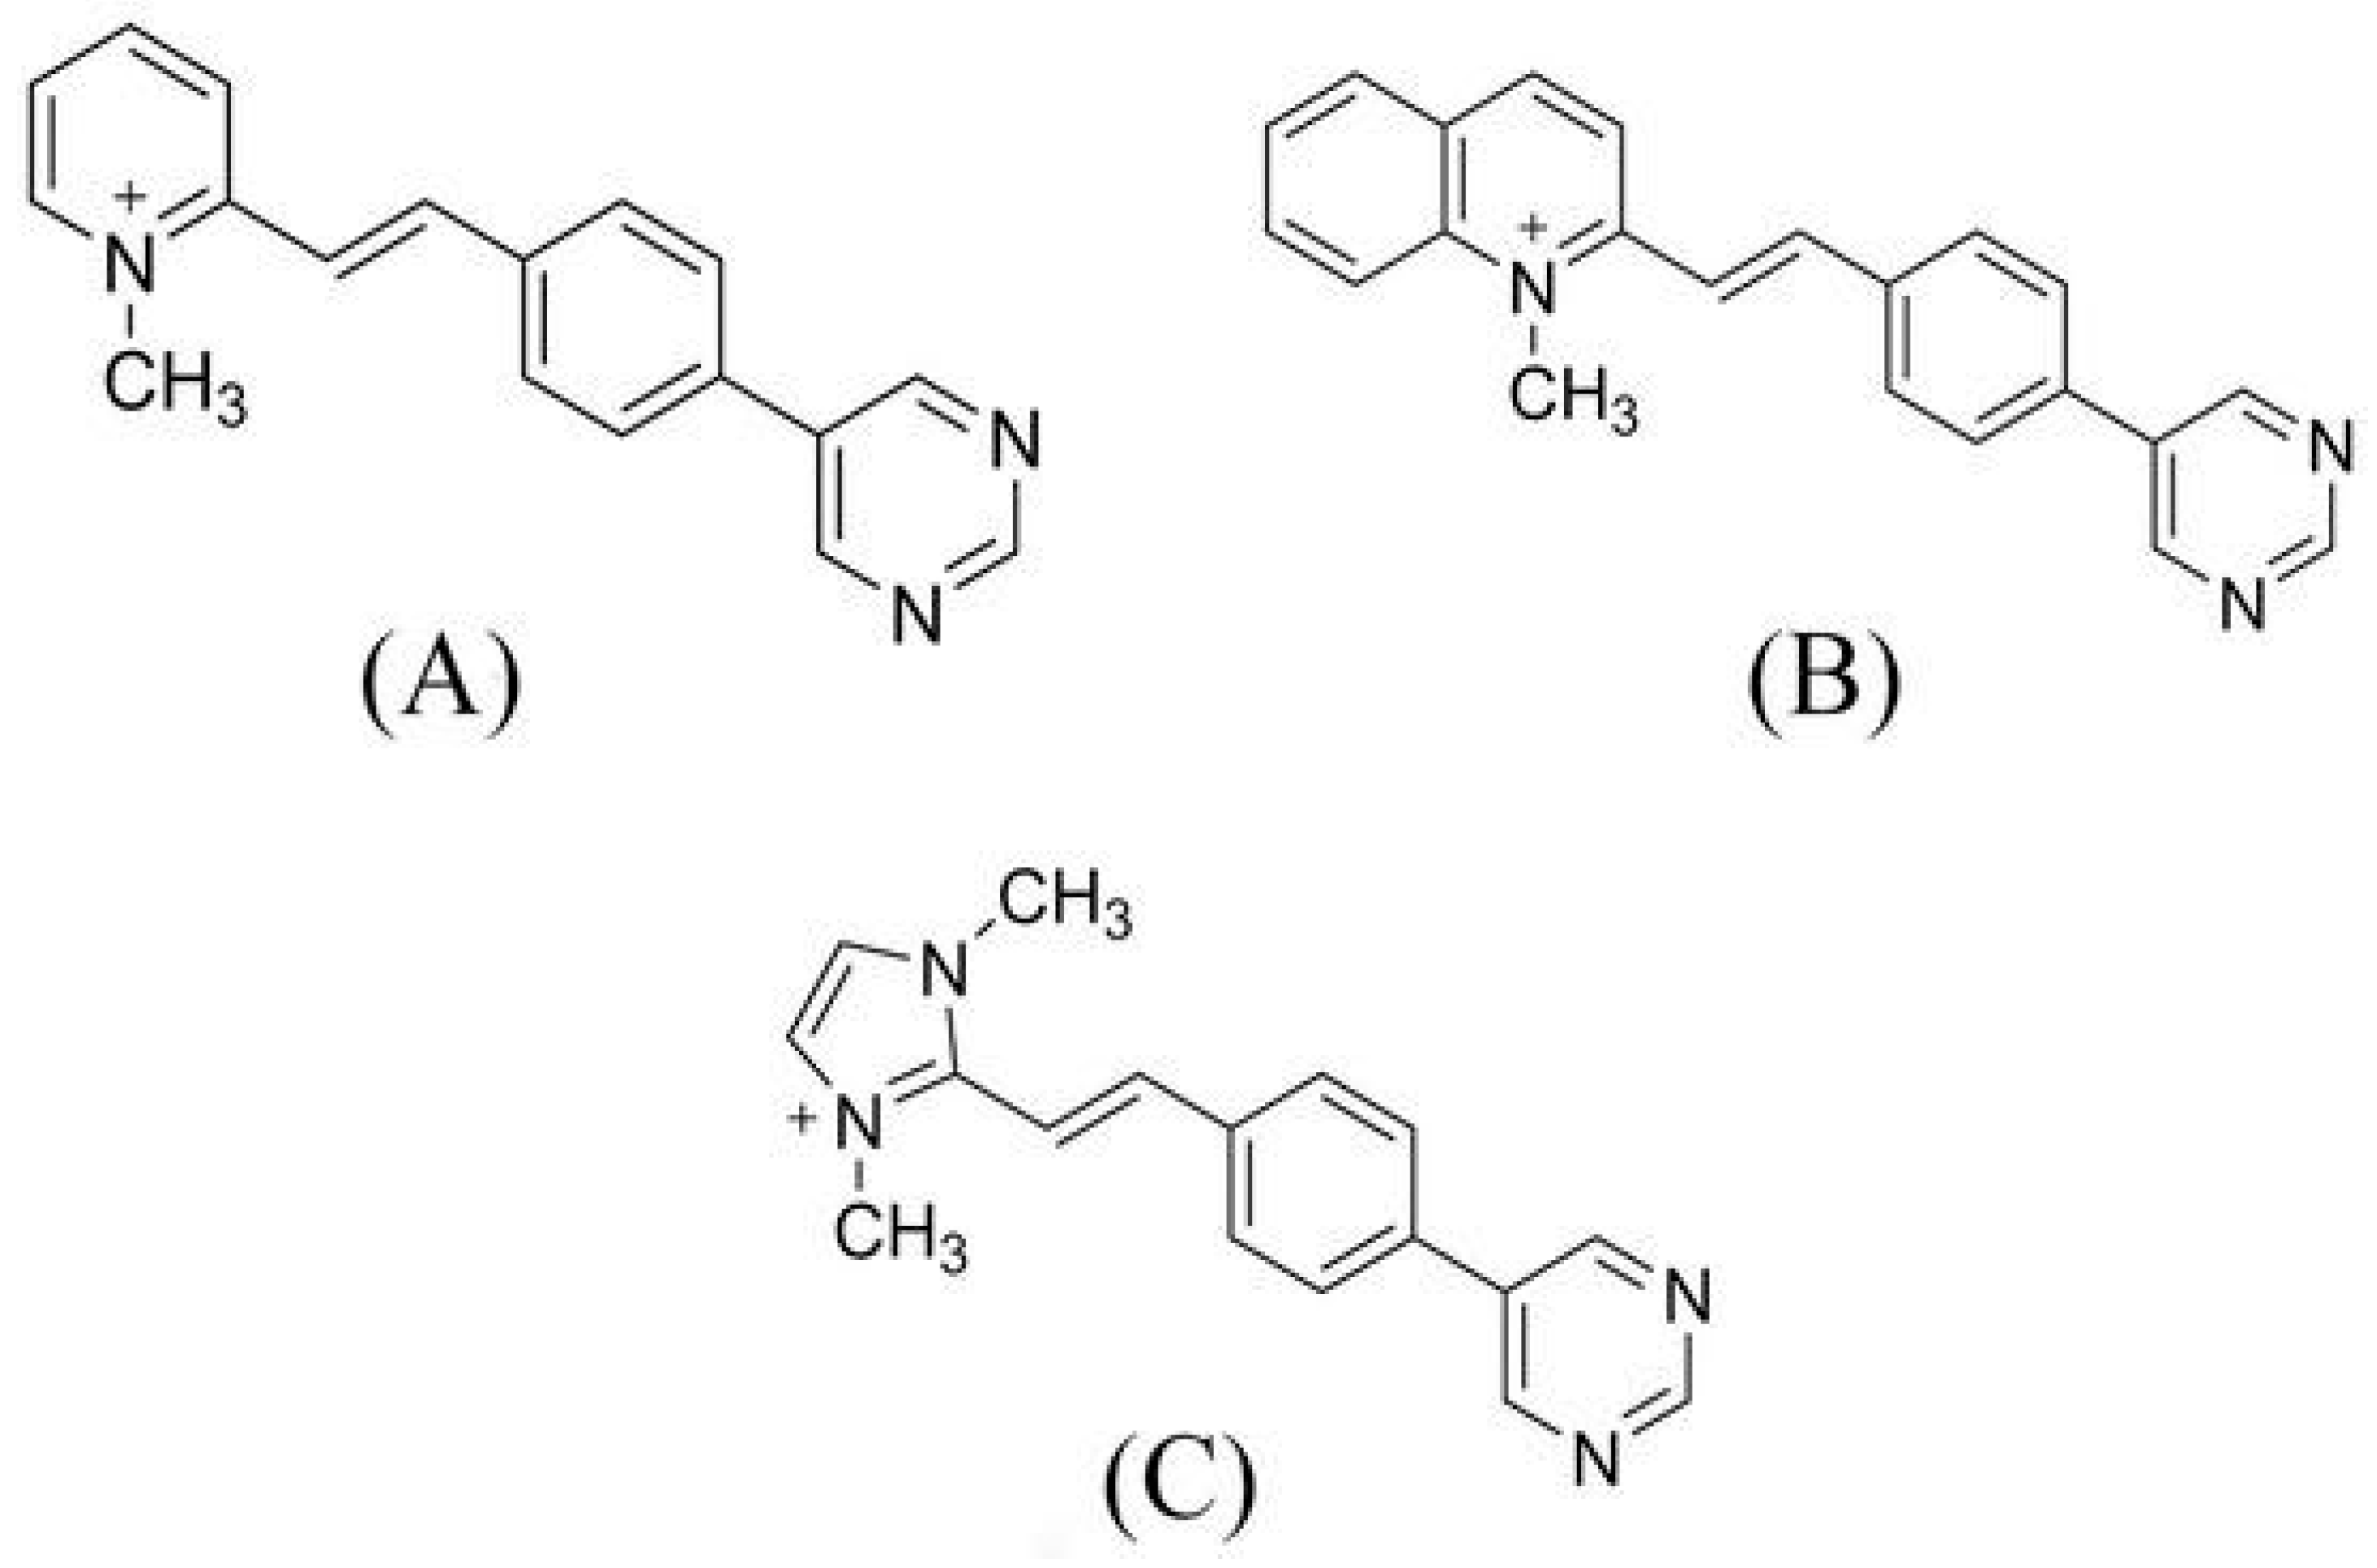
Figure 1. Push–pull compounds structures: (A) (E)-1-methyl-2-4-(pyrimidin-5-yl)styryl) pyridin-1-ium (BCC-1), (B) (E)-1-methyl-2-4-(pyrimidin-5-yl)styryl) quinolin-1-ium (BCC-2), and (C) (E)-1,3-dimethyl-2-4-(pyrimidin-5-yl)styryl)-1-h-imidazol-3-ium (BCC-3).
Chemistry 07 00132 g001
Figure 2. (A) Omicron XBB: pocket 1 (blue), pocket 2 (red), and pocket 3 (yellow); (B) Omicron BA: pocket 1 (blue), pocket 2 (red), and pocket 3 (yellow); (C) Omicron CH: pocket 1 (blue), pocket 2 (red), and pocket 3 (yellow); (D) Omicron EG: pocket 1 (blue), pocket 2 (red), and pocket 3 (yellow); (E) SARS-CoV-1: pocket 1 (light blue), pocket 2 (red), pocket 3 (blue), pocket 4 (yellow); and (F) MERS: pocket 1 (light blue), pocket 2 (red), pocket 3 (blue), pocket 4 (yellow), pocket 5 (dark red), RBD pocket 1 (violet), RBD pocket 2 (orange). Water and the accessory parts of the spike protein and ACE2 receptor were omitted for clarity.
Chemistry 07 00132 g002
Figure 3. The 3D and 2D docking between Omicron variant and BCC-3: (A) 3D XBB pocket 2 with BCC-3; (B) 2D XBB pocket 2 with BCC-3; (C) 3D BA pocket 2 with BCC-3; (D) 2D BA pocket 2 with BCC-3; (E) 3D CH pocket 2 with BCC-3; and (F) 2D CH pocket 2 with BCC-3; (G) 3D EG pocket 2 with BCC-3; and (H) 2D EG pocket 2 with BCC-3. Water and the accessory parts of the spike protein and ACE2 receptor were omitted for clarity. The text in the green square of the image describes the amino acids involved in interaction with the ligand.
Chemistry 07 00132 g003
Figure 4. The 3D and 2D docking SARS-CoV-1 and MERS: (A) 3D SARS-CoV-1 pocket 2 with BCC-1; (B) 2D SARS-CoV-1 pocket 2 with BCC-1; (C) 3D MERS RBD pocket 1 with BCC-2; (D) 2D RBD pocket 1 with BCC-2; (E) 3D RBD pocket 2 with BCC-2; and (F) 2D RBD pocket 2 with BCC-2. Water and the accessory parts of the spike protein and ACE2 receptor were omitted for clarity. The text in the green square of the image describes the amino acids involved in interaction with the ligand.
Chemistry 07 00132 g004
Figure 5. Overlay of ligand–protein complexes from MD simulations for SARS-CoV-2 (pocket 2), MERS-CoV (pocket 1), and SARS-CoV-1 (pocket 2), all bound to BCC-3. The ligand consistently occupies the RBD–ACE2 interface pocket, confirming docking predictions.
Chemistry 07 00132 g005
Figure 6. The 3D images of protein BA and CH (A) 3D BA pocket 2 with BCC-3 at 2 ns; (B) 3D BA pocket 2 with BCC-3 at 18 ns; (C) 3D BA pocket 2 with CH at 15 ns. Water and the accessory parts of the spike protein and ACE2 receptor were omitted for clarity. The text in the green square of the image describes the amino acids involved in interaction with the ligand.
Chemistry 07 00132 g006
Figure 7. The 3D images of protein EG and XBB (A) 3D EG pocket 2 with BCC-3 at 2 ns; (B) 3D EG pocket 2 with BCC-3 at 18 ns; (C) 3D BA pocket 2 with XBB at 2 ns; (D) 3D XBB pocket 2 with BCC-3 at 18 ns. Water and the accessory parts of the spike protein and ACE2 receptor were omitted for clarity. The text in the green square of the image describes the amino acids involved in interaction with the ligand.
Chemistry 07 00132 g007
Figure 8. The 3D images of protein MERS and SARS-CoV1 (A) 3D MERS pocket 2 with BCC-2 at 2 ns; (B) 3D MERS pocket 2 with BCC-2 at 18 ns; (C) 3D SARS pocket 2 with BCC-1 at 2 ns; (D) 3D SARS pocket 2 with BCC-1 at 18 ns. Water and the accessory parts of the spike protein and ACE2 receptor were omitted for clarity. The text in the green square of the image describes the amino acids involved in interaction with the ligand.
Chemistry 07 00132 g008
Figure 9. Superimposition of proteins. (A) superimposition of MERS protein (in blue) and SARS-CoV-1 protein (in magenta). (B) superimposition of MERS protein and SARS-CoV-2 protein (in green). (C) Superimposition of SARS-CoV-1 and SARS-CoV-2 proteins. Water and accessory parts of the spike protein and ACE2 were omitted for clarity.
Chemistry 07 00132 g009
Figure 10. Alignment of SARS-CoV-1, SARS-CoV-2, and MERS proteins.
Chemistry 07 00132 g010
Figure 11. ONIOM-optimized geometries of BA-BCC-3 complex (A), CH-BCC-3 complex (B), EG-BCC-3 complex (C), XBB-BCC-3 complex (D), MERS-BCC-2 complex (E), SARS-Cov-1-BCC-1 complex (F).
Chemistry 07 00132 g011
Table 1. Summary of mutations in the four Omicron variants compared to the wild-type spike protein.
Omicron XBBOmicron EGOmicron CHOmicron BA
D405ND405ND405ND405N
K417NK417NK417NK417N
Q498RQ498RQ498RQ498R
N501YN501YN501YN501Y
Y505HY505HY505HY505H
////////////////////K444TK444T
V445PV445P////////////////////
////////////////////L452RL452R
//////////F456L////////////////////
F486PF486P////////////////////
////////////////////F486S//////////
F490SF490S////////////////////
Table 2. Summary of amino acid residues of the selected pockets.
VariantsAmino Acids Residues
Omicron VariantsXBBPocket 2Asn33, His34, Glu37, Asp38, Arg403, Tyr453, Ser494, Tyr495, Gly496, Phe497, Arg498, His505
BA
CH
EG
Other Virus StrainsSARS-CoV-1Pocket 2Asn33, His34, Glu37, Asp38, Tyr41, Lys390, Tyr436, Tyr440, Asn479, Asp480, Tyr481, Gly482, Phe483, Tyr484, Thr487, Tyr491
MERSRBD Pocket 1Asn33, His34, Glu35, Ala36, Glu37, Asp38, Leu39, Phe40, Tyr41, Gln42, Ser43, Leu45, Asn64, Ala65, Lys68, Trp69, Phe72, Lys496, Trp535, Glu536, Asp537, Gly538, Asp539, Tyr540, Tyr541, Ser537, Gly558, Ser559, Thr560
RBD Pocket 2Ser19, Thr20, Glu23, Gln24, Lys26, Thr27, Cys503, Ser504, Arg505, Leu506, Leu507, Ser508, Asp509, Asp510, Arg511, Thr512, Glu513, Val514, Pro515, Gln516, Pro525, Leu545, Ser546, Pro547, Leu548, Glu549, Gly550, Gly551, Gly552, Trp553, Leu554
Table 3. Summary of FLAP’s score for pocket 2 detected in Omicron variants.
TargetCandidateGlob-SumDistanceGlob-ProdHDRYON1
XBB
(Pocket 2)
BCC-31.25212.8590.5300.7040.5610.2120.000
BCC-11.18313.1130.4810.6760.5130.2440.000
BCC-21.16513.6680.4820.5000.4370.2320.000
DRI-C230411.06012.3740.3840.4820.4920.4430.207
BA
(Pocket 2)
BCC-31.25212.8590.5300.7040.5610.2120.000
DRI-C230411.22112.2790.4170.4820.4920.4430.211
BCC-11.18613.0000.5090.5130.5130.2440.000
BCC-21.17313.4220.5060.4370.4370.2320.000
CH
(Pocket 2)
BCC-31.28012.8620.5270.7570.5610.1920.000
BCC-11.18513.1520.5000.6760.5130.1960.000
DRI-C230411.09612.3850.4030.4820.4780.4320.211
BCC-21.02513.7290.4430.6020.3420.2660.000
EG
(Pocket 2)
BCC-31.32312.6950.5550.7780.5610.2120.000
BCC-11.18613.0000.5090.7100.5130.2440.000
BCC-21.17313.4220.5060.5970.4370.2330.000
DRI-C230411.14812.4270.3890.4820.4920.4400.174
Table 4. Summary of FLAP’s score for the best pockets detected in SARS-CoV-1 and MERS.
TargetCandidateGlob-SumDistanceGlob-ProdHDRYON1
SARS-CoV-1
(Pocket 2)
BCC-12.06310.2520.7130.9471.2010.2720.000
BCC-31.91410.4540.7240.9420.9380.3140.000
BCC-21.98010.4990.7030.8771.2330.2630.000
DRI-C230411.7559.9040.4870.9351.1610.4100.220
MERS
(RBD Pocket)
BCC-22.37610.2680.6460.9831.5960.1160.000
BCC-12.26610.1910.6690.9641.4650.1700.000
BCC-32.20310.7300.5950.9681.2860.1720.000
DRI-C230412.1388.8050.5140.8551.4870.2400.222
MERS
(RBD Pocket 2)
BCC-21.82411.2680.6780.9600.8020.1850.000
DRI-C230411.7569.3280.5460.9310.8310.2970.235
BCC-31.65411.7050.6540.9800.6760.1620.000
BCC-11.59711.5700.6270.9880.7360.1900.000
Table 5. MMBGSA calculation results for all the identified pockets and variants under investigation.
VariantPocketLigandΔG (kcal/mol)
BA.2.752BCC-3−22.47
3BCC-1−19.79
CH.1.12BCC-3−19.46
3BCC-1−17.28
EG.52BCC-3−24.96
3BCC-1−22.65
XBB.1.162BCC-3−19.36
3BCC-1−17.07
SARS-CoV-12BCC-1−19.91
3BCC-3−10.01
4BCC-2−14.63
MERS1BCC-2−22.31
2BCC-2−13.05
Disclaimer/Publisher’s Note: The statements, opinions and data contained in all publications are solely those of the individual author(s) and contributor(s) and not of MDPI and/or the editor(s). MDPI and/or the editor(s) disclaim responsibility for any injury to people or property resulting from any ideas, methods, instructions or products referred to in the content.