Abstract
Metal complexes have potential applications in drug discovery due to their unique properties. For example, zinc(II) ions (ZnII) exhibit a high affinity for DNA and have been used as active centers in artificial protein/small-molecule metallonucleases. In this study, we designed a series of ligands containing a biaryl moiety as a photosensitizer to synthesize ZnII complexes with enhanced DNA affinity for use as DNA photocleavage reagents. The DNA photocleavage activity of these complexes was evaluated using the pUC19 plasmid, revealing that the ZnII complex bearing the 4′-biphenyl-bpa (bpa = bis(2-picolyl)amine) ligand L1 exhibited the strongest DNA photocleavage activity. Further analysis of the biological activity of the ZnII complex of L1 in the human pancreatic cancer cell line MIA PaCa-II demonstrated that its cytotoxic activity increased in a UV irradiation time-dependent manner, with an IC50 value of 14.2 μM. Fluorescence staining revealed that the ZnII complex of L1 generates reactive oxygen species in cells, leading to DNA double-strand breaks upon UV irradiation and ultimately resulting in necrotic cell death. These findings highlight the potential of the ZnII complex of L1 as a photochemotherapeutic agent for pancreatic cancer.
1. Introduction
Nucleases refer to molecules that cleave nucleic acids and enable gene editing and repair [1,2,3]. In genome engineering, protein-based artificial nucleases, including zinc finger nucleases [4,5], transcription activator-like effector nucleases [6,7], and CRISPR-associated nucleases such as Cas9 [8,9], have revolutionized molecular biology by enabling precise genetic manipulation [10]. However, these protein-based tools face challenges such as off-target effects and complex preparation [10]. Conversely, small-molecule nucleases offer advantages, including higher stability in solution, better cell membrane permeability, and simpler synthesis, making them promising candidates for therapeutic applications [11,12]. Notably, the impaired DNA repair mechanisms in cancer cells make small-molecule nucleases particularly attractive as potential anticancer agents [13,14,15].
Transition metal ion complexes have been widely studied as artificial nucleases due to their ability to mediate nucleic acid hydrolysis via Lewis acid activation [12,16,17,18]. Although natural metallonucleases predominantly utilize magnesium(II) [19,20], artificial nucleases incorporating platinum(II) and ruthenium(II) have been extensively investigated [17,18,21,22,23]. Zinc(II) (ZnII), an essential trace element with high biocompatibility and nucleic acid affinity [23,24,25], represents a promising alternative. ZnII is nontoxic to normal cells compared with other metals and participates in diverse ligand exchange reactions [26]. However, despite these advantages, ZnII-based small-molecule nucleases remain underexplored in anticancer drug development [27,28,29].
Building on our previous work with small-molecule metallonucleases [30,31], we designed ZnII complexes with photosensitizing ligands for light-activated nucleic acid cleavage [32], a promising approach in photodynamic therapy. Considering the low toxicity and strong nucleic acid affinity of ZnII, we synthesized ligands L1–L5 with biphenyl, a scaffold widely used in artificial nucleobase design [33,34] and photosensitizers [35]. Using bis(2-picolyl)amine (bpa) as the ZnII-chelating moiety, we designed ligands incorporating regioisomeric biphenyls, a 2-cyanobiphenyl derivative (a precursor of the sartan class of antihypertensives) [36], and a 1H-pyrazol-1-ylbenzyl derivative (a motif found in antibiotics) [37]. The ZnII complexes of L1–L5 were systematically evaluated for DNA photocleavage and in vitro anticancer activity, providing insight into their therapeutic potential.
2. Materials and Methods
2.1. Synthesis
2.1.1. Apparatus
Unless otherwise noted, reagents and solvents were obtained from commercial suppliers and used without further purification. Thin-layer chromatography (TLC) and column chromatography were performed using glass TLC plates (Silicagel 70 F254 TLC Plate-Wako and NH2 Silica Gel 60 F254 Plate-Wako) and Wakogel® 50NH2 (amino-functionalized silica gel), respectively (FUJIFILM Wako Pure Chemical, Osaka, Japan). Medium-pressure preparative liquid chromatography was conducted using a W-Prep 2XY medium-pressure preparative liquid chromatograph (Yamazen, Osaka, Japan). 1H NMR spectra were recorded on a JEOL ECZ-400S (400 MHz) spectrometer (JEOL, Tokyo, Japan) in chloroform-d (CDCl3) with tetramethylsilane as the internal standard (0 ppm). High-resolution mass spectra of the final products were obtained using a JEOL AccuTOF mass spectrometer (JEOL, Tokyo, Japan).
2.1.2. Procedures for Synthesizing L1 and L4
L1 [38] and L4 were synthesized using 4′-bromomethylbiphenyl and 4′-bromomethyl-2-cyanobiphenyl as starting materials, respectively.
4′-Bromomethylbiphenyl (3.3 mmol) for L1 or 4′-bromomethyl-2-cyanobiphenyl for L4 was dissolved in chloroform (15 mL), followed by adding bpa (3.0 mmol) and triethylamine (TEA) (3.3 mmol). The reaction mixture was refluxed for 16 h. The solvent was removed in vacuo, and the crude product was purified via flash chromatography using amino-functionalized silica gel, resulting in yields of 82% for L1 and 84% for L4.
1-([1,1′-Biphenyl]-4-yl)-N,N-bis(pyridin-2-ylmethyl)methanamine (L1): 1H NMR (CDCl3, 400 MHz): δ 3.74 (2H, s), 3.84 (4H, s), 7.15 (2H, td, J = 5.0 and 1.4 Hz), 7.33 (1H, tt, J = 7.3 and 1.3 Hz), 7.43 (2H, t, J = 7.3 Hz), 7.49 (2H, d, J = 8.4 Hz), 7.52–7.60 (4H, m), 7.62 (2H, d, J = 7.8 Hz), 7.43 (2H, td, J = 7.3 and 1.8 Hz), 8.53 (2H, d, J = 5.0 Hz). 13C NMR (CDCl3, 100 MHz): δ 58.1, 59.8, 122.0, 122.8, 126.9, 127.0, 127.0, 128.6, 129.1, 136.5, 137.8, 139.8, 140.8, 148.8, 159.5. HRMS (ESI); m/z calcd for C25H24N3 [M + H]+, 366.19702; found, 366.19605.
4′-((Bis(pyridin-2-ylmethyl)amino)methyl)-[1,1′-biphenyl]-2-carbonitrile (L4): 1H NMR (CDCl3, 400 MHz): δ 3.76 (2H, s), 3.86 (4H, s), 7.16 (2H, td, J = 4.9 and 1.4 Hz), 7.43 (1H, td, J = 7.7 and 1.3 Hz), 7.48–7.57 (5H, m), 7.60–7.66 (3H, m), 7.69 (2H, td, J = 7.7 and 1.8 Hz), 7.75 (1H, dd, J = 7.7 and 1.4 Hz), 8.53 (2H, d, J = 4.9 Hz). 13C NMR (CDCl3, 100 MHz): δ 58.1, 60.1, 111.0, 118.8, 122.0, 122.8, 127.4, 128.7, 129.0, 130.0, 132.8, 133.7, 136.5, 136.8, 139.7, 145.2, 148.9, 159.5. HRMS (ESI); m/z calcd for C26H23N4 [M + H]+, 391.19227; found, 391.19186.
2.1.3. Procedures for Synthesizing L2, L3, and L5
Biphenyl-3-carboxylic acid, biphenyl-2-carboxylic acid, and 4-(1H-pyrazol-1-yl)benzoic acid were used as starting materials for L2, L3, and L5, respectively. For L2, under an Ar atmosphere, a dry THF solution (30 mL) of biphenyl-2-carboxylic acid (5.0 mmol) was slowly added to a suspension of lithium aluminum hydride (21 mmol) in dry THF (20 mL). After refluxing for 16 h, the reaction mixture was allowed to cool, quenched by adding H2O (50 mL), and filtered through Celite. The product was extracted from the filtrate using EtOAc (30 mL × 2), and the organic solvent was dried over Na2SO4, then removed in vacuo to obtain crude biphenyl-2-methanol, which was used in the next reaction without further purification.
Under an Ar atmosphere, crude biphenyl-2-methanol was dissolved in dry benzene (20 mL), and PCl5 (5.0 mmol) was added. The reaction mixture was refluxed for 1 h. The solvent was removed in vacuo, and the crude product was purified via flash chromatography. The obtained (2-chloromethyl)biphenyl was used in the next reaction without further purification. It was then reacted with bpa using the method described in Section 2.1.2, furnishing L2 with a total yield of 42%.
L3 and L5 were obtained with 62% and 67% total yields, respectively, following a similar procedure.
1-([1,1′-Biphenyl]-3-yl)-N,N-bis(pyridin-2-ylmethyl)methanamine (L2): 1H NMR (CDCl3, 400 MHz): δ 3.77 (2H, s), 3.86 (4H, s), 7.15 (2H, td, J = 6.0 and 1.4 Hz), 7.35 (1H, tt, J = 7.3 and 1.3 Hz), 7.43 (2H, t, J = 7.3 Hz), 7.38–7.49 (5H, m), 7.56–7.65 (5H, m), 7.67 (2H, dd, J = 7.8 and 1.8 Hz), 8.53 (2H, ddd, J = 4.9, 1.8, and 0.92 Hz). 13C NMR (CDCl3, 100 MHz): δ 58.5, 59.9, 122.0, 122.7, 125.9, 127.1, 127.2, 127.5, 127.7, 128.7, 128.7, 136.5, 139.3, 141.1, 141.1, 148.8, 159.5. HRMS (ESI); m/z calcd for C25H24N3 [M + H]+, 366.19702; found, 366.19686.
1-([1,1′-Biphenyl]-2-yl)-N,N-bis(pyridin-2-ylmethyl)methanamine (L3): 1H NMR (CDCl3, 400 MHz): δ 3.68 (6H, s), 7.12 (2H, t, J = 6.1 Hz), 7.22 (2H, td, J = 7.6 and 1.5 Hz), 7.28 (2H, td, J = 7.6 and 1.5 Hz), 7.32–7.42 (4H, m), 7.45 (2H, d, J = 7.9 Hz), 7.62 (2H, td, J = 7.7 and 1.7 Hz), 7.81 (1H, d, J = 7.7 Hz), 8.47 (2H, ddd, J = 4.9, 1.8, and 0.92 Hz). 13C NMR (CDCl3, 100 MHz): δ 55.7, 60.1, 121.8, 122.5, 126.7, 126.9, 127.4, 128.0, 129.3, 129.3, 130.1, 136.3, 136.4, 141.1, 142.4, 148.8, 159.7. HRMS (ESI); m/z calcd for C25H24N3 [M + H]+, 366.19702; found, 366.19607.
N-(4-(1H-pyrazol-1-yl)benzyl)-1-(pyridin-2-yl)-N-(pyridin-2-ylmethyl)methanamine (L5): 1H NMR (CDCl3, 400 MHz): δ 3.72 (2H, s), 3.82 (4H, s), 6.43–6.48 (1H, m), 7.15 (2H, t, J = 6.2 Hz), 7.49 (2H, d, J = 8.3 Hz), 7.57 (2H, d, J = 7.9 Hz), 7.61–7.74 (5H, m), 7.90 (1H, d, J = 2.4 Hz), 8.53 (2H, d, J = 4.9 Hz). 13C NMR (CDCl3, 100 MHz): δ 57.7, 59.7, 107.4, 119.0, 122.0, 122.8, 126.6, 129.8, 136.4, 137.0, 139.1, 140.8, 148.8, 159.2. HRMS (ESI); m/z calcd for C22H22N5 [M + H]+, 356.18752; found, 356.18660.
2.2. Circular Dichroism (CD) Spectroscopy
CD spectra were recorded on a JASCO J-1100 spectropolarimeter using a rectangular quartz cuvette with a path length of 0.2 cm. The CD profiles were obtained with a scan speed of 100 nm/min, and appropriate baseline corrections were applied using a solvent buffer solution. The experiments were performed at 298 K under N2 conditions. The final spectra were averaged over two acquisitions.
Calf thymus DNA (ctDNA) was stored in a salt solution, and the ctDNA solution was prepared just before use as follows. ctDNA was dissolved in 50 mM NaCl/5 mM Tris-HCl (pH 7.1) buffer (buffer I) at approximately 1 mg/mL and allowed to stand at room 298 K for at least 16 h to ensure complete dissolution. This high-concentration ctDNA solution was then diluted to 50 μg/mL (as double-stranded DNA) with buffer I, and its purity was assessed by measuring the A260/A280 absorbance ratio, which was found to be over 1.8 (1.90), confirming the absence of protein contamination. The reagents were added to the diluted ctDNA solution at the concentrations indicated in the relevant figure, and the mixture was incubated in the dark for 24 h before measuring the CD spectrum.
2.3. DNA Photocleavage Activity
Following the general protocol for DNA cleavage, reaction mixtures containing pUC19 DNA (0.48 μg) in 50 mM Tris-borate buffer (pH 8.1), Zn(NO3)2·6H2O (final concentration = 200 μM), and ligands (final concentration = 200 μM) were prepared in MeOH. The reactions were conducted under continuous light irradiation (λ = 365 nm) using a handy UV lamp (SLUV-8, AS ONE). Ethylenediaminetetraacetic acid (EDTA) and loading buffer were added to stop the reactions. The samples were then electrophoresed in a 1% agarose gel containing 0.5 mg/mL ethidium bromide at 100 V for 60 min. The fluorescence intensity of ethidium bromide was measured using a densitometer (AE-6900M, ATTO Co., Tokyo, Japan).
2.4. DNA Binding Study
The binding constants of ZnII complexes with ctDNA were determined using UV–Vis absorption titration following a standard protocol [39,40]. UV–Vis spectra were recorded on a UV-2600i Plus spectrophotometer using a rectangular quartz cuvette (1.0 cm path length). Baseline corrections were applied using the appropriate solvent buffer, and all experiments were conducted at 298 K.
ctDNA, stored in a salt solution, was freshly prepared before use as follows. First, ctDNA was dissolved in buffer I at approximately 250 μg/mL and equilibrated at 298 K for at least 16 h to ensure complete dissolution. This concentrated ctDNA solution was then diluted with buffer I to yield a final concentration of 2–10 μmol/L. DNA concentration was determined by measuring the absorption at 260 nm using a molar absorption coefficient of 6600 L mol−1cm−1. The purity of the DNA solution was confirmed by an A260/A280 ratio between 1.92 and 1.96, indicating negligible protein contamination. A fixed concentration of the ZnII complex (50 μM final concentration) was added to each ctDNA solution, and the mixtures were allowed to equilibrate for 10 min. A reference cell containing DNA and solvent at the same concentrations as in the sample was used to nullify the intrinsic DNA absorbance at the measured wavelength. The binding constant (Kb) of the ZnII complexes with ctDNA was determined using the Wolfe–Shimer equation [41] as follows:
where [DNA] is the ctDNA concentration, εa, εf, and εb represent the extinction coefficients of the complex at a given absorbance, the free ZnII complex, and the fully bound complex, respectively. Plotting [DNA]/(εa − εf) versus [DNA] yields a straight line, from which Kb is determined as the ratio of the slope to the intercept.
[DNA]/(εa − εf) = [DNA]/(εb − εf) + (εb − εf)/Kb,
2.5. Cancer Cell Viability
A cell suspension (104 cells/well) was seeded into 96-well microplates and incubated for 24 h at 37 °C in a humidified atmosphere with 5% CO2. The cells were then treated with L1 (with or without 1.0 eq. of Zn(NO3)2·6H2O) at concentrations of 0, 1, 3, 10, 20, 30, and 100 μM (n = 4). After incubation for 4 h in the dark, the samples were irradiated with UV light (λ = 365 nm) and incubated for an additional 20 h. The reagents were then removed by washing twice with phosphate-buffered saline (PBS). A 10-fold diluted alamarBlue® reagent solution in culture medium was added to each well and incubated for an additional 3–4 h. Relative cell viability was determined by measuring absorbance at 570 and 600 nm using a microplate reader.
2.6. Cell Fluorescence Staining
2.6.1. Reactive Oxygen Species (ROS)
ROS in MIA PaCa-II cells after treatment were detected using the ROS Assay Kit-Photooxidation Resistant DCFH-DA (DOJINDO, Kumamoto, Japan) according to the manufacturer’s protocol. Briefly, 5.5 × 10⁴ living cells were seeded into a 24-well microplate. After 24 h of incubation, the growth medium was removed, and the cells were washed twice with PBS. The cells were then treated with L1 (with or without 1.0 eq. of Zn(NO3)2·6H2O) at concentrations of 10 and 20 μM. After incubation for 4 h in the dark, the samples were irradiated with UV light (λ = 365 nm), and the cells were washed twice with medium. Following a 30 min incubation at 37 °C with the prepared working solution, fluorescence in each group was detected using a ZOE™ Fluorescence Cell Imager (Bio-Rad, Hercules, CA, USA).
2.6.2. γH2AX
DNA double-strand breaks (DSBs) in MIA PaCa-II cells after treatment were detected using the DNA Damage Detection Kit-γH2AX-Red (DOJINDO, Kumamoto, Japan) according to the manufacturer’s protocol. Briefly, 5.5 × 10⁴ living cells were seeded into a 24-well microplate. After 24 h of incubation, the growth medium was removed, and the cells were washed twice with PBS. The cells were then treated with L1 (with or without 1.0 eq. of Zn(NO3)2·6H2O) at concentrations of 10 and 20 μM. After incubation for 4 h in the dark, the samples were irradiated with UV light (λ = 365 nm) and incubated for an additional 2 h. The cells were then immobilized and reacted with an anti-γH2AX antibody, followed by incubation with a goat anti-mouse antibody. Fluorescence in each group was detected using a ZOE™ Fluorescence Cell Imager (Bio-Rad, Hercules, CA, USA).
2.6.3. Apoptosis
Apoptosis induction in MIA PaCa-II cells after treatment was detected using the Annexin V-FITC Apoptosis Detection Kit (NACALAI TESQUE, Kyoto, Japan) combined with Hoechst 33342. Briefly, 5.5 × 10⁴ living cells were seeded into a 24-well microplate. After incubation for 4 h, the growth medium was removed, and the cells were washed twice with PBS. The cells were then treated with L1 (with or without 1.0 eq. of Zn(NO3)2·6H2O) at concentrations of 10 and 20 μM. After 4 h of incubation, the samples were irradiated with UV light (λ = 365 nm) and incubated for an additional 16 h. Following treatment, the cells were detached with trypsin-EDTA, washed with PBS, and suspended in the appropriate buffer at a concentration of 1.0 × 10⁶ cells/mL. After incubation with the prepared working solution at 37 °C for 15 min, fluorescence in each group was detected using a ZOE™ Fluorescence Cell Imager (Bio-Rad, Hercules, CA, USA).
3. Results and Discussion
3.1. Preparation
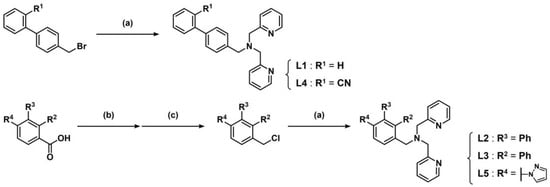
To develop a DNA photocleavage reagent, we designed and synthesized biaryl–bpa derivatives (L1–L5) by reacting commercially available bpa with biaryl–methyl halides, which were either purchased or synthesized from the corresponding carboxylic acids under basic conditions. Specifically, L1 and L4 were synthesized from 4-bromomethylbiphenyl and 4′-bromomethyl-2-cyanobiphenyl, respectively, whereas L2, L3, and L5 were synthesized from biphenyl-3-carboxylic acid, biphenyl-2-carboxylic acid, and 4-(1H-pyrazol-1-yl)benzoic acid, respectively (Scheme 1). The carboxylic acids were reduced with LiAlH4, and the resulting alcohols were halogenated with PCl5 before being used in the reaction with bpa. PCl5 can be substituted with SOCl2 or PBr3. The synthesized biaryl–bpa ligands were purified via amino-functionalized silica gel column chromatography and subsequently used for biological experiments.
Scheme 1.
Synthesis of L1–L5. Reagents and reaction conditions; (a) bpa, triethylamine, CHCl3, reflux, 16 h; (b) LiAlH4, dry THF, reflux, 16 h; (c) PCl5, dry benzene, reflux, 1 h.
3.2. DNA Photocleavage Activity
To evaluate the biological activity of the synthesized ligands, we performed several in vitro assays. First, the DNA photocleavage activities of L1–L5 were assessed using pUC19 plasmid DNA. The experimental conditions were adapted from our previous study [32]. Briefly, a reaction solution containing pUC19 plasmid DNA (0.48 μg), the ligand (final concentration: 200 μM), and the metal ion (final concentration: 200 μM) was prepared in Tris-borate buffer. After irradiation at 365 nm using a handy UV lamp, the separated DNA was analyzed via electrophoresis. The results are shown in Figure 1.
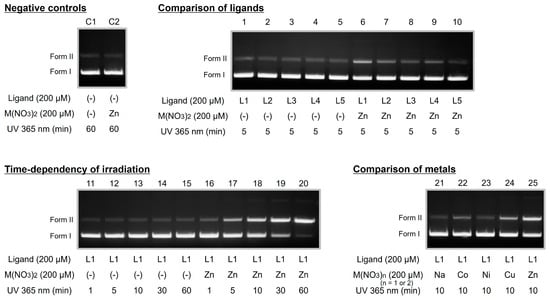
Figure 1.
DNA photocleavage activity of L1–L5. Reactants: pUC19 plasmid DNA (0.48 μg), metal nitrate (final concentration: 200 μM), and ligand (final concentration: 200 μM). Reaction conditions: The reactants were dissolved in 50 mM Tris-borate buffer (pH 8.4) at 20 °C under atmospheric conditions. For photoreactive DNA cleavage, the solution was continuously irradiated with 365 nm light using a handy UV lamp for 10 min.
In our previous work on a ligand containing the bpa moiety as a metal-chelating structure, we found that DNA photocleavage activity was enhanced by the addition of ZnII [32,33,34]. Therefore, we first examined the DNA photocleavage activity of L1–L5 in the absence and presence of ZnII. When the DNA solution containing L1–L5 was irradiated with UV light for a short time in the absence of ZnII, a small amount of nicked circular DNA (Form II) was observed (Figure 1, lanes 1–5). In the case of L1–L4, more bands corresponding to Form II were observed in the presence of ZnII than in its absence (Figure 1, lanes 6–10). Among L2–L4, L2 exhibited the highest and L3 the lowest DNA photocleavage activity (Figure 1, lanes 7–9). L5 showed little DNA photocleavage activity regardless of ZnII addition (Figure 1, lanes 5 and 10). Based on these results, L1 was selected for further studies.
Next, we examined the dependence of L1’s DNA photocleavage activity on UV irradiation time by analyzing the reaction solution after 1, 5, 10, 30, and 60 min of UV exposure. In the absence of ZnII, Form II bands were barely observed even after 60 min of UV irradiation (Figure 1, lanes 11–15). However, in the presence of ZnII, Form II bands appeared after 5 min of UV exposure (Figure 1, lanes 16 and 17). Furthermore, the Form I band visibly weakened after 30 min of UV irradiation (Figure 1, lanes 18 and 19). When the irradiation time was extended to 60 min, the Form I band nearly disappeared. These results indicate that L1 exhibits UV irradiation time-dependent DNA cleavage activity in the presence of ZnII.
The bpa metal-chelate structure of L1 coordinates transition metal ions, including ZnII, but has a very low coordination affinity for sodium ions. Consequently, few Form II bands were detected upon the addition of NaNO3, similar to the absence of metal ions (Figure 1, lanes 13 and 21). Meanwhile, DNA photocleavage activity in the presence of cobalt(II) (CoII), nickel(II) (NiII), and copper(II) (CuII) ions, which form chelates with bpa, was weaker than in the presence of ZnII (Figure 1, lanes 22–25), indicating that DNA photocleavage activity follows the order ZnII > CuII > CoII > NiII. Although the underlying mechanism remains unclear, Tabrizi et al. reported that the DNA cleavage activity of lapachol complexes varied with the central metal, following the order CuII > CoII > NiII [42], suggesting that differences in metal ion affinity to DNA influence cleavage activity. We previously reported cases where ZnII complexes exhibited higher DNA cleavage activity than CoII complexes [34]. Unlike CuII, CoII, and NiII, ZnII has also been reported to recruit transcription factors to DNA [43]. Taken together, these findings suggest that ZnII enhances DNA affinity, making ZnII complexes promising tools for the development of DNA-selective agents.
3.3. Analysis of Interactions with DNA
We investigated the interaction of L1–L5 and their ZnII complexes with DNA via CD spectroscopy of ctDNA. The intercalation of small molecules, such as anthracene, perturbs the secondary structure of DNA [44], leading to changes in its intrinsic CD spectra. Conversely, electrostatic interactions have little effect on the CD profile of DNA [45]. The CD spectra of ctDNA treated with L1–L5 and their ZnII complexes are shown in Figure 2, along with that of the control group (without ligand or ZnII). The control spectrum (black line in Figure 2A–C) exhibits a negative peak around 245 nm and a positive peak around 275 nm, characteristics of the right-handed B-type DNA structure, which arises from nucleobase stacking and the helical structure of polynucleotides.
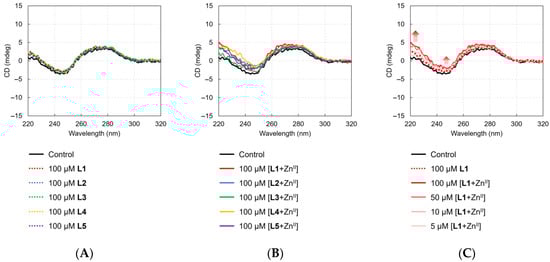
Figure 2.
CD spectra of calf thymus DNA (ctDNA) at different concentrations of L1–L5 and their ZnII complexes. [ctDNA] = 50 μg/mL (as double-stranded DNA). (A) Representative CD spectra of ctDNA with L1–L5 in the absence of ZnII. (B) Representative CD spectra of ctDNA with L1–L5 in the presence of ZnII (1.0 eq.). (C) Representative CD spectra of ctDNA with varying concentrations of L1 in the presence of ZnII (1.0 eq.).
Identical spectral features were observed upon the addition of 100 μM L1–L5 (Figure 2A). Conversely, the addition of ZnII complexes of L1–L5 resulted in slight changes in the 220–260 nm region (Figure 2B), which were concentration-dependent in the case of ZnII-chelated L1 (Figure 2C). These results suggest that the ZnII-chelated structure, rather than the biaryl moiety of biaryl–bpa, is primarily involved in the interaction with DNA. The strongest DNA photocleavage activity of L1 among the L1–L5 series (Figure 1, lanes 6–10) can be attributed to the lower steric hindrance around ZnII in ZnII-chelated L1, allowing it to access the DNA chain more easily and interact with it more stably than ZnII-chelated L2 and ZnII-chelated L3. Additionally, L5 exhibited almost no DNA cleavage activity even as a ZnII complex, likely due to the formation of a ZnII–pyrazole complex, which weakens the interaction between ZnII and DNA.
To quantify the binding affinity between the ZnII complexes and ctDNA, the Kb value of the DNA was determined by monitoring absorbance changes upon incremental additions of ctDNA at the appropriate wavelength. Because ZnII in these complexes has a d10 outer electronic configuration, no d–d transitions occur in the visible region. Therefore, a reference cell containing only DNA and solvent was measured simultaneously to cancel out any absorbance due to the DNA itself. The UV absorption band, centered at approximately 260 nm, was used to monitor the interaction (Figure 3 and Supplementary Information).
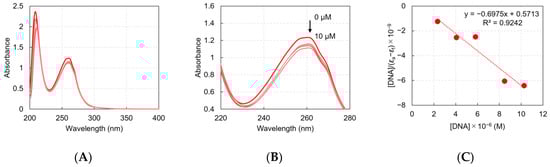
Figure 3.
UV–Visible absorption spectra of ZnII-chelated L1 in the absence and presence of increasing concentrations of ctDNA. (A) UV–Vis absorption spectra of ZnII-chelated L1 with stepwise additions of ctDNA (0–10 μM) in the range of 200–400 nm. (B) UV–Vis absorption spectra of ZnII-chelated L1 with stepwise additions of ctDNA (0–10 μM) in the range of 220–280 nm. (C) Plot of [DNA]/(εa−εf) versus [DNA] for the titration of the ZnII-chelated L1 with ctDNA.
As the ctDNA concentration increased, the absorption intensity of the ZnII complex decreased, confirming an interaction between the complex and ctDNA. The determined Kb values for L1–L5 were 1.22 × 10⁶, 3.00 × 10⁵, 3.55 × 10⁵, 7.06 × 10⁴, and 8.33 × 10⁵ M−1, respectively (Table 1). For comparison, a structurally related ZnII complex, ZnII–bpea (bpea = N,N-bis(2-picolyl)ethylamine), has been reported to exhibit a Kb value of 2.72 × 10⁴ M−1 [46]. These findings indicate that the ZnII-chelated L1–L5 complexes exhibit significantly higher affinities for ctDNA. Among L1–L5 complexes, ZnII-chelated L1 exhibited the strongest binding affinity, with a Kb value comparable to that of ethidium bromide, a chemical dye that is commonly used to stain DNA, (Kb = 1.40 × 10⁶ M−1) [47]. The superior DNA-binding affinity of ZnII-chelated L1 likely contributed to its enhanced DNA photocleavage activity compared with L2–L5.

Table 1.
Binding constant (Kb) values for the ZnII-chelated complexes L1–L5 with ctDNA.
3.4. Anticancer Activity
3.4.1. Cell Proliferation
We investigated L1, which exhibited the most potent DNA photocleavage activity, for its cytotoxicity against the human pancreatic cancer cell line, MIA PaCa-II, and its mechanism of action. To evaluate the anticancer activity of ZnII-chelated L1 under UV irradiation, we designed the experiment shown in Figure 4. Cells were seeded at a density of 1 × 10⁴ living cells/34 mm2 (96-well microplate: 34 mm2/well; 24-well microplate: 186 mm2/well) and cultured for 24 h. The test reagent was then added, and the cells were incubated for 4 h before being irradiated with UV for 10 min, following the same conditions as the DNA cleavage experiment. Garai et al. reported that after administering the iron complex of Ant-bpa to HeLa and MCF-7 cancer cells, >85% of the complex migrated into the cells within 4 h [48]. In the present study, ROS, DNA damage, and apoptosis were detected at 30 min, 2 h, and 16 h, respectively, followed by a cell viability assay at 20 h.
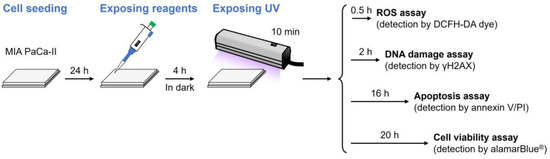
Figure 4.
In vitro assay workflow to evaluate the anticancer activity of the L1–L5 ligands and their ZnII complexes.
The cytotoxic activity of L1 and its ZnII complex were evaluated using the alamarBlue® assay [49]. The proliferation curves are shown in Figure 5, and the 50% proliferation inhibitory concentrations (IC50 values) are summarized in Table 2. When ZnII was administered alone, the IC50 values remained above 100 μM even after UV irradiation, indicating no cytotoxicity. Interestingly, even without ZnII, L1 inhibited MIA PaCa-II cell proliferation at high concentrations. The IC50 values of L1 were 47.8 and 49.9 μM under UV irradiation and dark conditions, respectively (Table 2). The cytotoxic activity of L1 was stronger in the presence of ZnII than in its absence, and UV irradiation further enhanced its cytotoxic effect. The IC50 values of L1 + ZnII were 14.2 and 22.9 μM under UV irradiation and dark conditions, respectively (Table 2). The enhancement of L1’s cytotoxicity by ZnII and UV irradiation was consistent with the DNA photocleavage activity results. However, the cytotoxic activity of L1 in the absence of ZnII was unexpected based on DNA cleavage data. In other words, high-dose L1 exhibited cytotoxic activity regardless of DNA cleavage and UV irradiation. These findings suggest that the potential cytotoxicity of L1 in normal tissues should be carefully evaluated in future studies. Next, we investigated the mechanism of L1-induced cytotoxicity in the presence of ZnII using fluorescence staining assays.
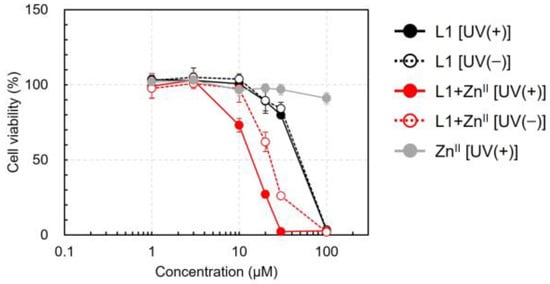
Figure 5.
Photoinduced cytotoxicity of L1 and its ZnII complex toward MIA PaCa-II cells. Experimental conditions are listed in the figure legend. The cells (1 × 10⁴ living cells) were incubated for 24 h, and the reagent was added at a final CH3OH concentration of 1.0% v/v. After incubation for 4 h in the dark, the samples were irradiated with UV light (λ = 365 nm) and further incubated for an additional 16 h. Cell viability was evaluated using the alamarBlue® reagent.
Table 2.
IC50 values of L1 and its ZnII complex in MIA PaCa-II cells.
3.4.2. Cell Fluorescence Staining
Fluorescence staining was used to detect ROS, DNA DSBs, and apoptosis in MIA PaCa-II cells using the corresponding assay kits. The treatment groups included 10 μM L1, 10 μM L1 + 10 μM ZnII, and 20 μM L1 + 20 μM ZnII. All groups, including a control group without L1 or ZnII, were UV-irradiated. Under the same conditions, cell viability was determined using the alamarBlue® assay and calculated as 100.6% ± 3.5%, 73.1% ± 4.5%, and 27.0% ± 2.5% for 10 μM L1, 10 μM L1 + 10 μM ZnII, and 20 μM L1 + 20 μM ZnII, respectively.
2′,7′-Dichlorodihydrofluorescein diacetate (DCFH-DA), a cell-permeable fluorogenic dye, was used to detect ROS [50]. The amount of ROS produced is reflected in fluorescence intensity; therefore, intracellular ROS levels can be evaluated via fluorescence microscopy. Cells in the different treatment groups were treated with DCFH-DA immediately after UV irradiation and incubated for 30 min to compare fluorescence emission. As shown in Figure 6A, almost no fluorescence was detected in the control group or the 10 μM L1 group. However, when L1 and ZnII were added simultaneously, DCF-derived fluorescence was detected in a concentration-dependent manner: weak fluorescence was observed in approximately half of the cells at low concentrations (10 μM), whereas strong fluorescence was observed in most cells at high concentrations (20 μM). These results indicate that the ZnII complex of L1 induces ROS production in cells upon UV irradiation.
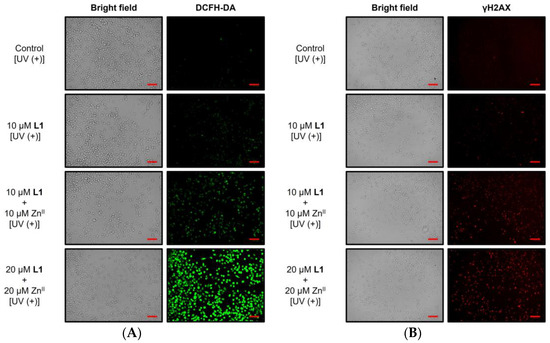
Figure 6.
Fluorescence microscopy images of MIA PaCa-II cells stained with (A) 2′,7′-dichlorodihydrofluorescein diacetate (DCFH-DA) for detecting ROS and (B) anti-γH2AX for detecting DNA double-strand breaks under various treatment conditions (scale bar: 100 μm).
Next, to detect DSBs, we used γH2AX staining. γH2AX is generated via phosphorylation of the histone protein H2AX at DSB sites. When DSBs form in cells, histone H2AX undergoes phosphorylation, leading to the accumulation of phosphorylated H2AX (γH2AX) [51]. Therefore, intracellular DSBs can be evaluated using an anti-γH2AX antibody and a fluorescently labeled secondary antibody that emits red fluorescence at an excitation wavelength of 550 nm. Temporarily generated ROS in cells are known to induce DSBs [52]. Therefore, cells were fixed 2 h after UV irradiation, and γH2AX-derived fluorescence was compared. The results are shown in Figure 6B. Almost no fluorescence was detected in the control group or in the group treated with L1 alone. However, when L1 and ZnII were added simultaneously, fluorescence was observed in a concentration-dependent manner. The detection of red fluorescence indicates the occurrence of DSBs within the cells. These results align with the ROS-inducing effect of the ZnII complex of L1.
Finally, to detect apoptosis induction—one of the key mechanisms of action of anticancer agents—we used fluorescein isothiocyanate (FITC)-labeled annexin V (annexin V-FITC). Annexin V has an affinity for phosphatidylserine (PS) on the cell membrane surface. In normal cells, PS is located on the cytoplasmic side of the membrane but becomes exposed on the cell surface during early apoptosis. Therefore, fluorescently labeled annexin V enables the identification of apoptotic cells. In this study, in addition to annexin V-FITC, we assessed apoptosis progression using Hoechst 33342 and propidium iodide (PI) staining. Hoechst 33342 stains the nuclei of both living and dead cells, whereas PI stains only the nuclei of dead cells. Thus, living cells without apoptosis induction would be stained only with Hoechst 33342, whereas cells in late-stage apoptosis would exhibit triple staining. Cells were collected 16 h after UV irradiation to assess apoptosis induction. The results are shown in Figure 7. In the control and L1 monotherapy groups, most cells were stained only with Hoechst 33342. However, when L1 and ZnII were administered simultaneously, cells exhibited triple staining with Hoechst 33342, annexin V, and PI. The proportion of triple-stained cells increased with increasing ZnII complex concentration, and these cells eventually underwent complete cell death. The results of the alamarBlue® assay indicate that conditions associated with higher cytotoxic activity correspond to a higher proportion of triple-stained cells. Meanwhile, across all conditions, almost no cells were found to be in early apoptosis (Hoechst 33342 (+), annexin V (+), PI (−)), even when treated with low concentrations of the ZnII complex. This suggests that the triple-stained cells were not in the late-apoptotic stage but were instead undergoing a necrotic process. Future studies will focus on elucidating the detailed mechanism of cell death induction, for example, by analyzing the expression levels of cell death-related proteins.
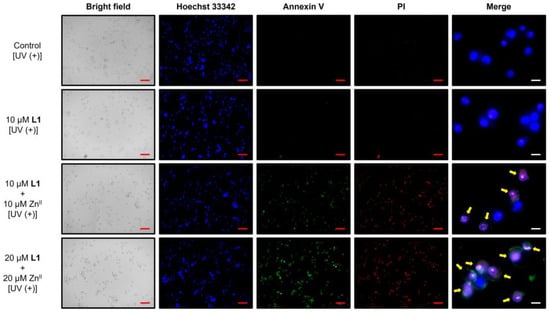
Figure 7.
Fluorescence microscopy images of Hoechst 33342-, annexin V-FITC-, and propidium iodide (PI)-stained MIA PaCa-II cells subjected to various treatments (red scale bar: 100 μm; white scale bar: 15 μm). Yellow arrows indicate triple-stained cells.
4. Conclusions
We evaluated the DNA photodamage and anticancer activities of ZnII complexes of biaryl–bpa ligands L1–L5. L1 exhibited UV irradiation time-dependent DNA cleavage activity in the presence of 1.0 equivalent of ZnII. CD analysis ruled out an intercalative binding mode, suggesting that the ZnII complex could interact with DNA via electrostatic interactions. ZnII-chelated L1 showed enhanced cytotoxic activity against the MIA PaCa-II human pancreatic cancer cell line upon UV irradiation. Fluorescence staining indicated that ZnII-chelated L1 generates ROS in cells upon UV irradiation, leading to DNA DSBs and ultimately resulting in necrotic cell death. These findings highlight the anticancer potential of ZnII complexes bearing a 4′-biphenyl moiety as a photosensitizer. We anticipate that this study will contribute to the development of artificial nucleases based on small-molecule metal complexes and their application in cancer chemotherapy.
Supplementary Materials
The following supporting information can be downloaded at: https://www.mdpi.com/article/10.3390/chemistry7020041/s1 and includes 1H NMR and 13C NMR spectra for compounds L1–L5, electronic absorption spectra, and the plots of [DNA]/(εa − εf) versus [DNA] for the titration.
Author Contributions
Conceptualization, Y.I.; data curation, Y.I.; formal analysis, D.E. and K.K. (Kazuaki Katakawa); funding acquisition, Y.I. and H.K. (Hiromasa Kurosaki); investigation, Y.I. and K.K. (Koichi Kato); methodology, Y.I., K.K. (Koichi Kato) and H.K. (Hiromasa Kurosaki); project administration, Y.I.; resources, K.K. (Koichi Kato); supervision, M.K. and H.K. (Hiromasa Kurosaki); validation, Y.I.; visualization, Y.I.; writing—original draft, Y.I.; writing—review and editing, K.K. (Koichi Kato), K.S., D.E., H.K. (Hideaki Kato), K.K. (Kazuaki Katakawa), W.J., M.K. and H.K. (Hiromasa Kurosaki). All authors will be updated at each stage of manuscript processing, including submission, revision, and revision reminder, via emails from our system or the assigned Assistant Editor. All authors have read and agreed to the published version of the manuscript.
Funding
This research was funded by Japan Society for the Promotion of Science (JSPS), grant number JSPS KAKENHI Grants JP23K14339.
Data Availability Statement
Data are contained within the article.
Conflicts of Interest
The authors declare no conflicts of interest.
References
- Fragkos, M.; Ganier, O.; Coulombe, P.; Méchali, M. DNA replication origin activation in space and time. Nat. Rev. Mol. Cell Biol. 2015, 16, 360–374. [Google Scholar] [CrossRef] [PubMed]
- Hanawalt, P.; Spivak, G. Transcription-coupled DNA repair: Two decades of progress and surprises. Nat. Rev. Mol. Cell Biol. 2008, 9, 958–970. [Google Scholar] [CrossRef] [PubMed]
- Yang, W. Nucleases: Diversity of structure, function and mechanism. Q. Rev. Biophys. 2011, 44, 1–93. [Google Scholar] [CrossRef] [PubMed]
- Kim, Y.G.; Cha, J.; Chandrasegaran, S. Hybrid restriction enzymes: Zinc finger fusions to Fok I cleavage domain. Proc. Natl. Acad. Sci. USA 1996, 93, 1156–1160. [Google Scholar] [CrossRef]
- Urnov, F.D.; Rebar, E.J.; Holmes, M.C.; Zhang, H.S.; Gregory, P.D. Genome editing with engineered zinc finger nucleases. Nat. Rev. Genet. 2010, 11, 636–646. [Google Scholar] [CrossRef]
- Boch, J. TALEs of genome targeting. Nat. Biotechnol. 2011, 29, 135–136. [Google Scholar] [CrossRef]
- Boissel, S.; Jarjour, J.; Astrakhan, A.; Adey, A.; Gouble, A.; Duchateau, P.; Shendure, J.; Stoddard, B.L.; Certo, M.T.; Baker, D.; et al. megaTALs: A rare-cleaving nuclease architecture for therapeutic genome engineering. Nucleic Acids Res. 2014, 42, 2591–2601. [Google Scholar] [CrossRef]
- Deltcheva, E.; Chylinski, K.; Sharma, C.M.; Gonzales, K.; Chao, Y.; Pirzada, Z.A.; Eckert, M.R.; Vogel, J.; Charpentier, E. CRISPR RNA maturation by trans-encoded small RNA and host factor RNase III. Nature 2011, 471, 602–607. [Google Scholar] [CrossRef]
- Jinek, M.; Jiang, F.; Taylor, D.W.; Sternberg, S.H.; Kaya, E.; Ma, E.; Anders, C.; Hauer, M.; Zhou, K.; Lin, S.; et al. Structures of Cas9 endonucleases reveal RNA-mediated conformational activation. Science 2014, 343, 1247997. [Google Scholar] [CrossRef]
- Gupta, R.M.; Musunuru, K. Expanding the genetic editing tool kit: ZFNs, TALENs, and CRISPR-Cas9. J. Clin. Invest. 2014, 124, 4154–4161. [Google Scholar] [CrossRef]
- Zhen, Y.; Cowan, J.A. Metal complexes promoting catalytic cleavage of nucleic acids-biochemical tools and therapeutics. Curr. Opin. Chem. Biol. 2018, 43, 37–42. [Google Scholar] [CrossRef]
- Shahraki, S. Schiff base compounds as artificial metalloenzymes. Colloids Surf. B Biointerfaces 2022, 218, 112727. [Google Scholar] [CrossRef] [PubMed]
- Helleday, T.; Petermann, E.; Lundin, C.; Hdgson, B.; Sharma, R.A. DNA repair pathways as targets for cancer therapy. Nat. Rev. Cancer 2008, 8, 193–204. [Google Scholar] [CrossRef] [PubMed]
- Torgovnick, A.; Schumacher, B. DNA repair mechanisms in cancer development and therapy. Front. Genet. 2015, 6, 157. [Google Scholar] [CrossRef] [PubMed]
- Groelly, F.J.; Fawkes, M.; Dagg, R.A.; Blackford, A.N.; Tarsounas, M. Targeting DNA damage response pathways in cancer. Nat. Rev. Cancer 2023, 23, 78–94. [Google Scholar] [CrossRef]
- Chitrapriya, N.; Shin, J.H.; Hwang, I.H.; Kim, Y.; Kim, C.; Kim, S.K. Synthesis, DNA binding profile and DNA cleavage pathway of divalent metal complexes. RSC Adv. 2015, 5, 68067–68075. [Google Scholar] [CrossRef]
- Corral, E.; Hotze, A.C.G.; den Dulk, H.; Leczkowska, A.; Rodger, A.; Hannon, M.J.; Reedijk, J. Ruthenium polypyridyl complexes and their modes of interaction with DNA: Is there a correlation between these interactions and the antitumor activity of the compounds? J. Biol. Inorg. Chem. 2009, 14, 439–448. [Google Scholar] [CrossRef]
- Neves, A.P.; Pereira, M.X.G.; Peterson, E.J.; Kipping, R.; Vargas, M.D.; Silva, F.P., Jr.; Carneiro, J.W.M.; Farrell, N.P. Exploring the DNA binding/cleavage, cellular accumulation and topoisomerase inhibition of 2-hydroxy-3-(aminomethyl)-1,4-naphthoquinone Mannich bases and their platinum(II) complexes. J. Inorg. Biochem. 2013, 119, 54–64. [Google Scholar] [CrossRef] [PubMed]
- Cowan, J.A. Magnesium activation of nuclease enzymes—The importance of water. Inorganica Chim. Acta. 1998, 275–276, 24–27. [Google Scholar] [CrossRef]
- Miller, M.D.; Cai, J.; Krause, K.L. The active site of Serratia endonuclease contains a conserved magnesium-water cluster. J. Mol. Biol. 1999, 288, 975–987. [Google Scholar] [CrossRef]
- Gill, M.R.; Harun, S.N.; Halder, S.; Boghozian, R.A.; Ramadan, K.; Ahmad, H.; Vallis, K.A. A ruthenium polypyridyl intercalator stalls DNA replication forks, radiosensitizes human cancer cells and is enhanced by Chk1 inhibition. Sci. Rep. 2016, 6, 31973. [Google Scholar] [CrossRef]
- Gabr, M.T.; Pigge, F.C. Expanding the toolbox for label-free enzyme assays: A dinuclear platinum(II) complex/DNA ensemble with switchable near-IR emission. Molecules 2019, 24, 4390. [Google Scholar] [CrossRef]
- Mancin, F.; Scrimina, P.; Tecilla, P. Progress in artificial metallonucleases. Chem. Commun. 2012, 48, 5545–5559. [Google Scholar] [CrossRef] [PubMed]
- Xhafa, S.; Nicola, C.D.; Tombesi, A.; Pettinari, R.; Pettinari, C.; Scarpelli, F.; Crispini, A.; Deda, M.L.; Candreva, A.; Garufi, A.; et al. Pyrazolone-based Zn(II) complexes display antitumor effects in mutant p53-carrying cancer cells. J. Med. Chem. 2024, 67, 15676–15690. [Google Scholar] [CrossRef]
- Nejdl, L.; Ruttkay-Nedecky, B.; Kudr, J.; Krizkova, S.; Smerkova, K.; Dostalova, S.; Vaculovicova, M.; Kopel, P.; Zehnalek, J.; Trnkova, L.; et al. DNA interaction with zinc(II) ions. Int. J. Biol. Macromol. 2014, 64, 281–287. [Google Scholar] [CrossRef]
- Pellei, M.; Bello, F.D.; Porchia, M.; Santini, C. Zinc coordination complexes as anticancer agents. Coord. Chem. Rev. 2021, 445, 214088. [Google Scholar] [CrossRef]
- Mohammadlou, F.; Mansouri-Torshizi, H.; Dehghanian, E.; Eslami-Moghadam, M.; Dusek, M.; Eigner, V. A new zinc(II) complex of 2-benzoimidazoledisulfide ligand: Synthesis, X-ray crystallographic structure, investigation of CT-DNA and BSA interaction by spectroscopic techniques and molecular docking. J. Photochem. Photobiol. A Chem. 2023, 443, 114830. [Google Scholar] [CrossRef]
- Kaya, B.; Yılmaz, Z.K.; Şahin, O.; Aslim, B.; Ülküseven, B. Structural characterization of new zinc(ii) complexes with N2O2 chelating thiosemicarbazidato ligands; investigation of the relationship between their DNA interaction and in vitro antiproliferative activity towards human cancer cells. New J. Chem. 2020, 44, 9313–9320. [Google Scholar] [CrossRef]
- Parveen, S.; Arjmand, F.; Mohapatra, D.K. Zinc(II) complexes of Pro-Gly and Pro-Leu dipeptides: Synthesis, characterization, in vitro DNA binding and cleavage studies. J. Photoch. Photob. B Bio. 2013, 126, 78–86. [Google Scholar] [CrossRef]
- Ichimaru, Y.; Kato, K.; Okuno, Y.; Yamaguchi, Y.; Jin, W.; Fujita, M.; Otsuka, M.; Imai, M.; Kurosaki, H. Design and synthesis of an anthranyl bridged optically active dinuclear iron(II)-ligand and evaluation of DNA-cleaving activity. Bioorg. Med. Chem. Lett. 2021, 35, 127782. [Google Scholar] [CrossRef]
- Kato, K.; Ichimaru, Y.; Okuno, Y.; Yamaguchi, Y.; Jin, W.; Fujita, M.; Otsuka, M.; Imai, M.; Kurosaki, H. DNA-cleavage activity of the iron(II) complex with optically active ligands, meta- and para-xylyl-linked N′,N′-dipyridylmethyl-cyclohexane-1,2-diamine. Bioorg. Med. Chem. Lett. 2021, 36, 127834. [Google Scholar] [CrossRef]
- Ichimaru, Y.; Kato, K.; Nakatani, R.; Isomura, R.; Sugiura, K.; Yamaguchi, Y.; Jin, W.; Mizutani, H.; Imai, M.; Kurihara, M.; et al. Structural characterization of zinc(II)/cobalt(II) complexes of chiral N-(anthracen-9-yl)methyl-N,N-bis(2-picolyl)amine and evaluation of DNA photocleavage activity. Chem. Pharm. Bull. 2023, 71, 545–551. [Google Scholar] [CrossRef] [PubMed]
- Röthlisberger, P.; Levi-Acobas, F.; Leumann, C.J.; Hollenstei, M. Enzymatic synthesis of biphenyl-DNA oligonucleotides. Bioorg. Med. Chem. 2020, 28, 115487. [Google Scholar] [CrossRef]
- Du, Y.; Kanamori, T.; Yaginuma, Y.; Yoshida, N.; Kaneko, S.; Yuasa, H. Diffusion of 1O2 along the PNA backbone diminishes the efficiency of photooxidation of PNA/DNA duplexes by biphenyl photosensitizer. Bioorg. Med. Chem. Lett. 2024, 114, 129988. [Google Scholar] [CrossRef] [PubMed]
- Kanamori, T.; Kaneko, S.; Hamamoto, K.; Yuasa, H. Mapping the diffusion pattern of 1O2 along DNA duplex by guanine photooxidation with an appended biphenyl photosensitizer. Sci. Rep. 2023, 13, 288. [Google Scholar] [CrossRef]
- Vardanyan, R.; Hruby, V. Synthesis of Best-Seller Drugs; Vardanyan, R., Hruby, V., Eds.; Elsevier: Amsterdam, The Netherlands, 2016; Chapter 22; pp. 329–356. [Google Scholar] [CrossRef]
- Hansa, R.K.; Khan, M.M.K.; Frangie, M.M.; Gilmore, D.F.; Shelton, R.S.; Savenka, A.V.; Basnakian, A.G.; Shuttleworth, S.L.; Smeltzer, M.S.; Alam, M.A. 4-4-(Anilinomethyl)-3-[4-(trifluoromethyl)phenyl] -1H-pyrazol-1-ylbenzoic acid derivatives as potent anti-gram-positive bacterial agents. Eur. J. Med. Chem. 2021, 219, 113402. [Google Scholar] [CrossRef] [PubMed]
- Goforth, S.K.; Walroth, R.C.; Brannaka, J.A.; Angerhofer, A.; McElwee-White, L. Heterobimetallic complexes of polypyridyl ligands containing paramagnetic centers: Synthesis and characterization by IR and EPR. Inorg. Chem. 2013, 52, 14116–14123. [Google Scholar] [CrossRef]
- Movahedi, E.; Rezvan, A.R. New silver(I) complex with diazafluorene based ligand: Synthesis, characterization, investigation of in vitro DNA binding and antimicrobial studies. J. Mol. Struct. 2017, 1139, 407–417. [Google Scholar] [CrossRef]
- Pinchaipat, B.; Chotima, R.; Promkatkaew, M.; Kitjaruwankul, S.; Chainok, K.; Khudkham, T. Experimental and theoretical studies on DNA binding and anticancer activity of nickel(II) and zinc(II) complexes with N–(8–quinolyl) salicylaldimine Schiff base ligands. Chemistry 2024, 6, 618–639. [Google Scholar] [CrossRef]
- Wolfe, A.; Shimer, G.H.; Meehan, T., Jr. Polycyclic aromatic hydrocarbons physically intercalate into duplex regions of denatured DNA. Biochemistry 1987, 26, 6392–6396. [Google Scholar] [CrossRef]
- Tabrizi, L.; Talaie, F.; Chiniforoshan, H. Copper(II), cobalt(II) and nickel(II) complexes of lapachol: Synthesis, DNA interaction, and cytotoxicity. J. Biomol. Struct. Dyn. 2016, 35, 3330–3341. [Google Scholar] [CrossRef]
- Bittel, D.; Dalton, T.; Samson, S.L.-A.; Gedamu, L.; Andrews, G.K. The DNA binding activity of metal response element-binding transcription factor-1 is activated in vivo and in Vitro by zinc, but not by other transition metals. J. Biol. Chem. 1998, 273, 7127–7133. [Google Scholar] [CrossRef] [PubMed]
- Safiarian, M.S.; Sawoo, S.; Mapp, C.T.; Williams, D.E.; Gude, L.; Fernández, M.-J.; Lorente, A.; Grant, K.B. Aminomethylanthracene dyes as high-ionic-strength DNA-photocleaving agents: Two rings are better than one. ChemistrySelect 2018, 3, 4897–4910. [Google Scholar] [CrossRef]
- Li, Z.; Hitomi, N.; Tanaka, H.; Ohmagari, H.; Nakamura, K.; Hasegawa, M.; Kobayashi, N. Induced chiroptical properties of helical Eu(iii) complex by electrostatic interaction with DNA. Mater. Adv. 2024, 5, 1897–1902. [Google Scholar] [CrossRef]
- Qian, J.; Wang, L.-P.; Gu, W.; Liu, X.; Tian, J.-L.; Yan, S.-P. Synthesis, crystal structure, DNA binding, and DNA cleavage of a zinc complex containing N,N-bis(2-pyridylmethyl)amine. J. Coord. Chem. 2011, 64, 2480–2488. [Google Scholar] [CrossRef]
- Lepecq, J.-B.; Paoletti, C. A fluorescent complex between ethidium bromide and nucleic acids: Physical—Chemical characterization. J. Mol. Biol. 1967, 27, 87–106. [Google Scholar] [CrossRef]
- Garai, A.; Pant, I.; Kondaiah, P.; Chakravarty, A.R. Iron(III) salicylates of dipicolylamine bases showing photo-induced anticancer activity and cytosolic localization. Polyhedron 2015, 102, 668–676. [Google Scholar] [CrossRef]
- Voytik-Harbin, S.L.; Brightman, A.O.; Waisner, B.; Lamar, C.H.; Badylak, S.F. Application and evaluation of the alamarBlue assay for cell growth and survival of fibroblasts. In Vitro Cell. Dev. Biol. Anim. 1998, 34, 239–246. [Google Scholar] [CrossRef] [PubMed]
- Okazaki, S.; Umene, K.; Yamasaki, J.; Suina, K.; Otsuki, Y.; Yoshikawa, M.; Minami, Y.; Masuko, T.; Kawaguchi, S.; Nakayama, H.; et al. Glutaminolysis-related genes determine sensitivity to xCT-targeted therapy in head and neck squamous cell carcinoma. Cancer Sci. 2019, 110, 3453–3463. [Google Scholar] [CrossRef]
- Mah, L.-J.; El-Osta, A.; Karagiannis, T.C. gammaH2AX: A sensitive molecular marker of DNA damage and repair. Leukemia. 2010, 24, 679–686. [Google Scholar] [CrossRef]
- Srinivas, U.S.; Tan, B.W.Q.; Vellayappan, B.A.; Jeyasekharan, A.D. ROS and the DNA damage response in cancer. Redox Biol. 2019, 25, 101084. [Google Scholar] [CrossRef] [PubMed]
Disclaimer/Publisher’s Note: The statements, opinions and data contained in all publications are solely those of the individual author(s) and contributor(s) and not of MDPI and/or the editor(s). MDPI and/or the editor(s) disclaim responsibility for any injury to people or property resulting from any ideas, methods, instructions or products referred to in the content. |
© 2025 by the authors. Licensee MDPI, Basel, Switzerland. This article is an open access article distributed under the terms and conditions of the Creative Commons Attribution (CC BY) license (https://creativecommons.org/licenses/by/4.0/).