1. Introduction
A basic and undisputed fact underlying the global warming issue is that the two major components of greenhouse gases, CO
2 and water, are both essential for life on earth, and only their impact on potentially rapid changes in the Earth’s surface temperature may be undesirable. We previously reviewed the water cycle in relation to the Earth’s climate and showed that the existential threat assumption violates well-established physical laws of thermodynamics and the principles of closing mass and energy balances [
1,
2]. In the present contribution, we focus on the other major component of greenhouse gases, CO
2.
“Global” climate change is required to make carbon dioxide (CO
2) a global issue, and yet most of the evidence of climate change is mainly at regional and local rather than global scales [
1]. Changes in climate activity are found only in the troposphere [
3], which contains about 75% of the mass of the atmosphere and only reaches an altitude of ~12 km above the surface, which is only about 0.2% of the Earth’s radius of about 6400 km. The average depth of the oceans is about 3.7 km [
4] or about 0.06% of the radius (maximum depth in the Mariana Trench is about 10.9 km). Life in the air is limited, while no life on land can survive at temperatures of about 80 °C, which is usually found at a depth of 3 to 5 km below the surface (assuming an average geothermal gradient of 25 to 30 °C/km of depth in the upper crust). As such, at a planetary scale, the biosphere is limited to a thin film that represents less than 0.25% of the Earth’s radius.
However, as a thin film, not all areas of the film are the same, and differences in the biosphere properties become increasingly more granular as the scale decreases from global to regional to local to lab scales and ultimately to the atomic level. These changes in granularity generate much of the uncertainty in models used for climate predictions, where one calculation block may represent an entire river basin or the path of a hurricane.
Chemistry, including the requisite mass and energy balances, plays a very significant role within the biosphere. Among all of the elements in the Periodic Table, life is generally more impacted by the elements carbon (C), oxygen (O), and hydrogen (H), in various combinations forming DNA, carbohydrates, proteins, hydrocarbons, carbon dioxide (CO
2), and water (H
2O). The authors have been studying the relative potential impacts of CO
2 and H
2O on the climate to assess how the two mechanisms, (a) GHG warming and (b) human water emissions, can or cannot explain the observed trends of warming and precipitation reported in the physical science basis reports of the IPCC [
5,
6,
7]. Our analyses mainly focused on the assumed vs. actual distribution of water vapor in the atmosphere based on the Clausius–Clapeyron equation [
2] and on high-level water mass and energy balances [
1]. Together, it emerged that a scenario in which small CO
2-induced warming leads to uncontrollable runaway “global” warming (the “existential threat”) due to the positive water vapor feedback from the oceans, commonly assumed in contemporary climate models, is highly unlikely. The current article extends our thoughts on other human impacts on biosphere changes, which have been attributed to GHG-related warming of the atmosphere or oceans. The grand challenges we outline in the present contribution fall within the domain of chemistry, where the effects observed can be investigated by chemists around the globe to determine if there are other potential drivers of change, human or natural, that may inform the science by assessing the most likely cause and effect impacts.
2. The Carbon Cycle
“Although widely distributed in nature, carbon is not particularly plentiful—it makes up only about 0.025% of the Earth’s crust—yet it forms more compounds than all the other elements combined” [
8].
The carbon cycle is one of the most talked about issues in climate science, yet not all of the issues related to it are being discussed equally. Our main purpose in this section is to highlight aspects of the atmospheric carbon balance, such as (a) the historical CO2 levels through time and over different timescales, (b) how much CO2 is building up compared to expectations, and (c) where the “missing carbon” (carbon emitted from fossil fuel sources but not staying in the atmosphere) is going.
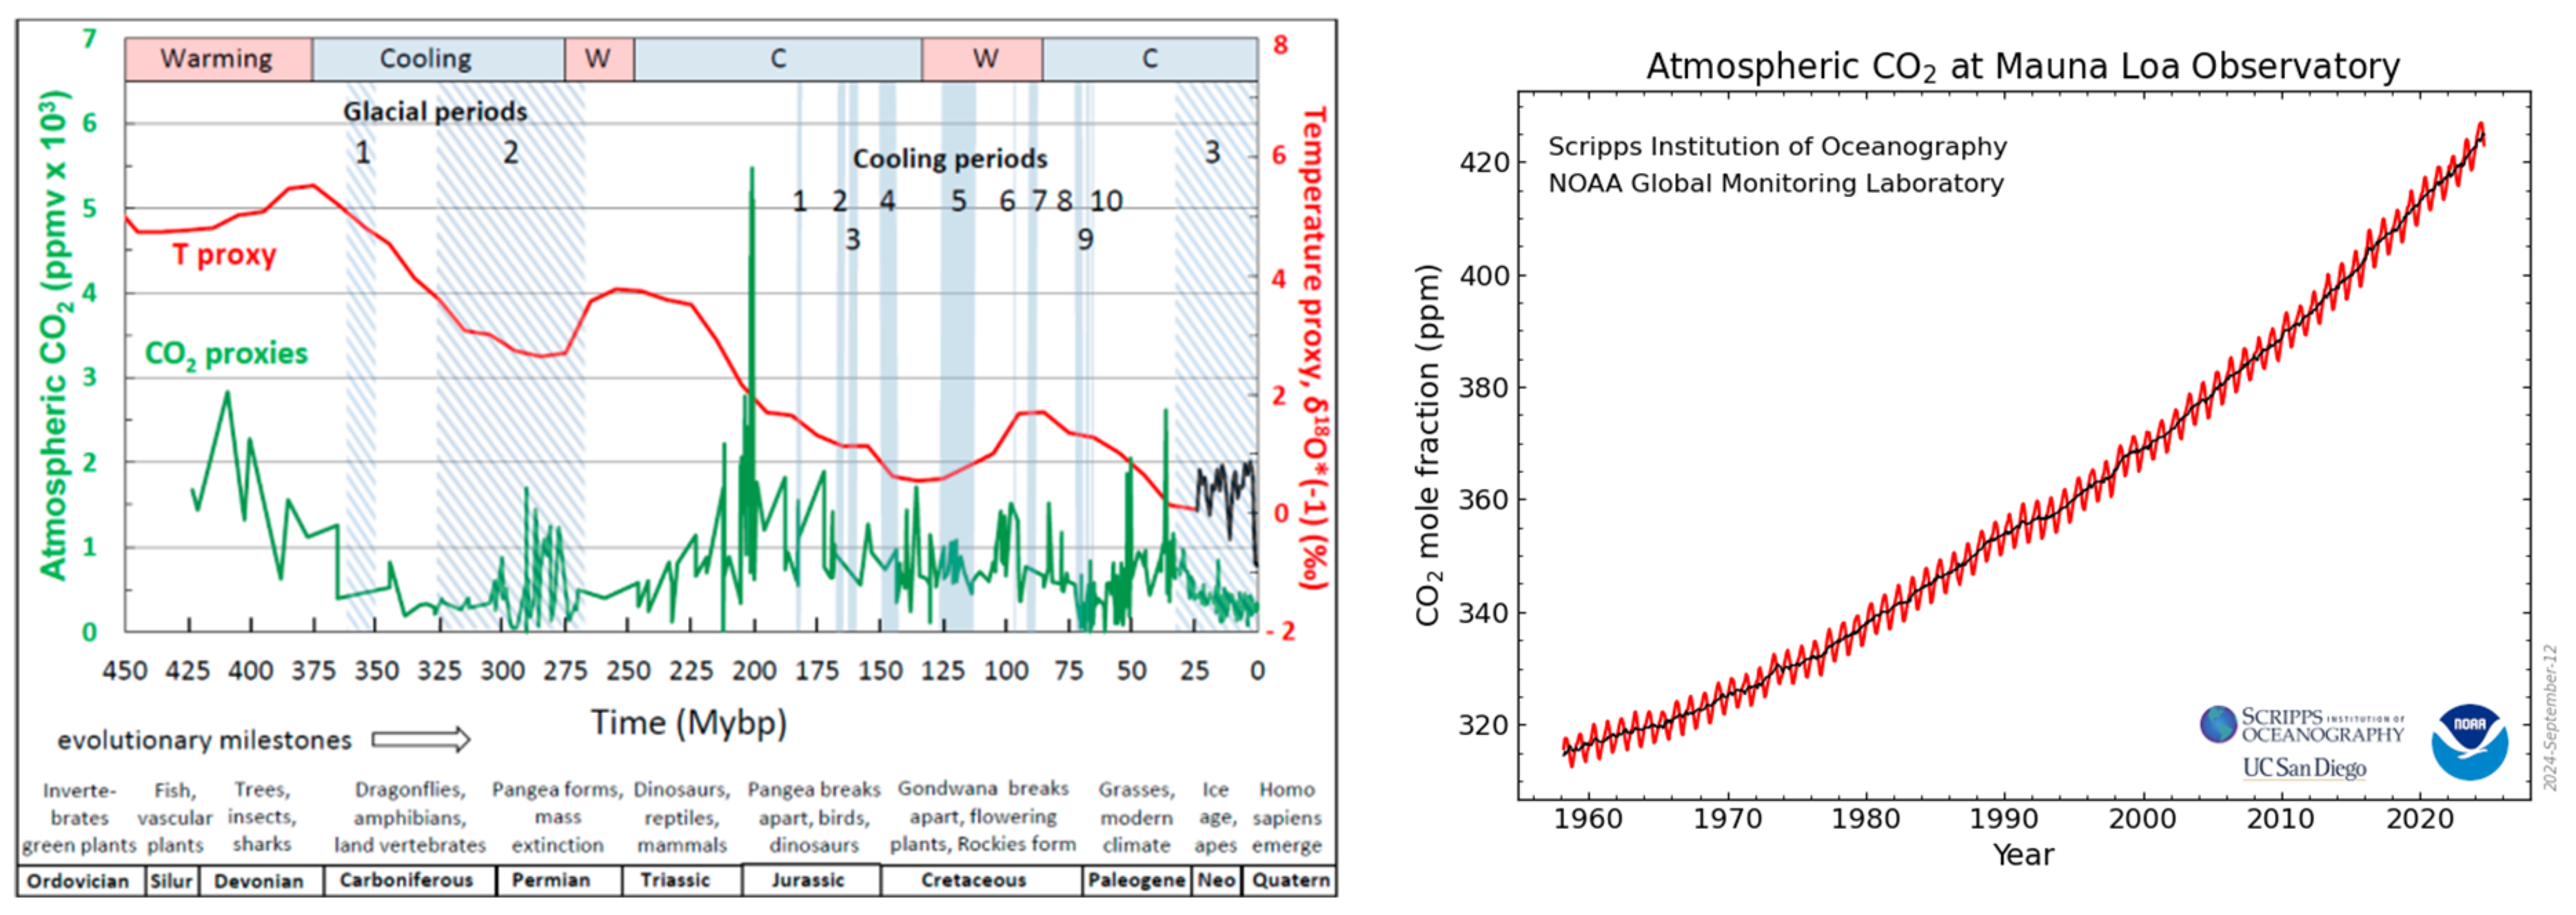
For the first item, there has been discussion over the relevant timescales that should be used to discuss carbon balances. Two example graphs used in various publications are shown in
Figure 1. The first chart is over a geologic timescale of 100s of millions of years, which shows that the current CO
2 level in the Earth’s atmosphere is actually at a low point [
9]. Interestingly, the surface temperature and the atmospheric CO
2 concentrations did not correlate over much of geologic time [
10] (even though apparent correlations may be inferred for much shorter timescales [
11]). The second chart is over the last 65 years, which shows a continual rise in CO
2 with seasonal variability over a very narrow concentration range of between 300 and 400 ppm. A comparison of the two charts shows that these types of rises and falls can be seen in the older data and that such changes are not unique to recent decades.
In relation to carbon buildup expectations, initially, the expectation was that all human CO
2 emissions would stay in the atmosphere and build up over time. The relevant data, as shown in
Figure 2 below [
12], shows the challenge in that the Earth is adapting to increased carbon availability, just as it has in the geologic past. The carbon cycle is the energy engine for life processes, so the more carbon there is available, the more biomass can be generated [
13]. Recent papers on carbon sinks focus on proposing linear carbon sink models to reflect that as CO
2 emissions increase, other processes increase to absorb more [
12]. The papers also indicate some ongoing challenges in identifying the exact processes and drivers that impact where the carbon goes [
12].
In the graph above, the focus is on carbon in the form of CO2; however, in a full carbon cycle, there are other places and ways for the extra CO2 to be absorbed into the planetary “biosphere” that are not based on the initial assumption of a static natural state. A few candidates for sinks include (a) being absorbed by oceans as CO2, where it may be converted to carbohydrates by phytoplankton; (b) going into the oceans as other carbon compounds (carbohydrates from sewage, increases in sediments in runoff from the land, or other carbon-containing materials from industry or agriculture), which will eventually be stored in sediments and enter a longer carbon cycle where they may be converted back into hydrocarbons but not in the form of CO2; and (c) being stored as carbohydrates in long-term storage “reservoirs”, such as landfills, books in libraries, and buildings.
Grand challenges for chemists about the carbon cycle are to look further into the carbon cycle for chemical evidence and develop mass balances to see if there are other mass or energy signals that can track the path of surplus carbon into these potential sinks.
(a) Carbon Dioxide into Oceans—CO2 must be absorbed over the whole ocean area, as the lower atmosphere is relatively well mixed with respect to CO2, so changes in surface water pH and phytoplankton growth should be relatively consistent over the ocean’s surface. Are there chemical indications of this, or are pH or biological activity changes limited to certain waters where other mechanisms could be at work? For example, changes in fresh water inflows from river systems may cause a pH change as a result of dilution effects and also seem to be a source of increased algal growth due to nutrients. River water flows to oceans are declining from rivers in hot temperate regions due to human activities, such as dam building and use of water for irrigation, while it has been reported that most river flows to the north are increasing in volume due to increased rainfall between 30° and 60° N latitude as reported by the IPCC. As we will discuss later in a discussion of the oxygen cycle, this mode of CO2 simply dissolving into the oceans would also result in a more rapid loss of oxygen atoms from the atmosphere, whereas the uptake of carbon through biological processes might not impact atmospheric oxygen. What is the proportion of dissolution vs. reaction or bioconversion of CO2?
(b)
Land Runoff—Increases in the volumes of carbohydrates and hydrocarbons going into the oceans in the form of sewage, enhanced stormwater runoff, or carbon-rich industrial or agricultural sources would mean localized changes in the composition and the rate of deposition of carbon sediments at sewage and river outlets off heavily human-impacted land areas. As of the early 2000s, at least 40% of the Earth’s population lives within 100 km of a marine coastal area [
14]. Even larger percentages live near large water bodies (e.g., Great Lakes) or on large river systems that flow into the oceans (e.g., Mississippi, Nile, Yellow, Rhine). Their resource use, land changes, and industrial or agricultural activities should result in localized increases in carbon to oceans, lakes, and rivers, yet waste streams and “sewage pollution” and their impacts are poorly understood [
15]. A general study of the chemistry of these wastes would be a challenge for chemists, especially with the inclusion of growing volumes of plastics, fibers, and drugs (other forms of carbon) following these routes into water bodies.
(c)
Land Storage of Carbon—Initial work on carbon sinks did not discuss landfills as potential carbon sinks as, at the time, waste management practices did not leave much carbon in the ground. Most landfills prior to the 1950s and 1960s (when
Figure 2 shows the CO
2 spread beginning to increase) were burned to minimize the volume of the landfills by reducing the volume of wood and other bulky materials. Burning off was reduced as new composite materials in electronics and other products began to introduce toxins into the emissions given off during waste combustion. Later still, the design of landfills changed to ensure landfills were capped and kept dry to minimize bioactivity and methane generation. Even though most countries now have alternative waste management practices, such as recycling, composting, and burning some waste materials for energy [
16], the volumetric growth of landfills continues to increase globally. In the U.S., for example, about 50% of their Municipal Solid Waste (MSE) goes to landfills, which are regulated to be lined so as to exclude water and prevent anaerobic decomposition of organic material, thus leaving the carbon effectively sequestered.
Figure 3 below shows a standard representation of a simplified carbon cycle from NASA. To fully understand the impact of anthropogenic CO
2 emissions on the planet’s biosphere, for good or bad, a better understanding of the fate of incremental carbon emissions is needed. A balance must explain or hypothesize and test options for where the ~5 Gt/yr of incremental carbon removed from the atmosphere is going and whether this represents permanent sequestration. An assumption that CO
2 is being absorbed and causing acidification would require a buildup of dissolved CO
2 in the oceans, while the balance shown in the reference would indicate no buildup and that incremental CO
2 entering the oceans is exactly balanced by ocean sedimentation.
3. The Oxygen Cycle
“Oxygen makes up 46% of the Earth’s crust, largely as silicates, compounds of oxygen and silicon. Oxygen also comprises around 21% of the atmosphere as molecular oxygen and ozone” [
17].
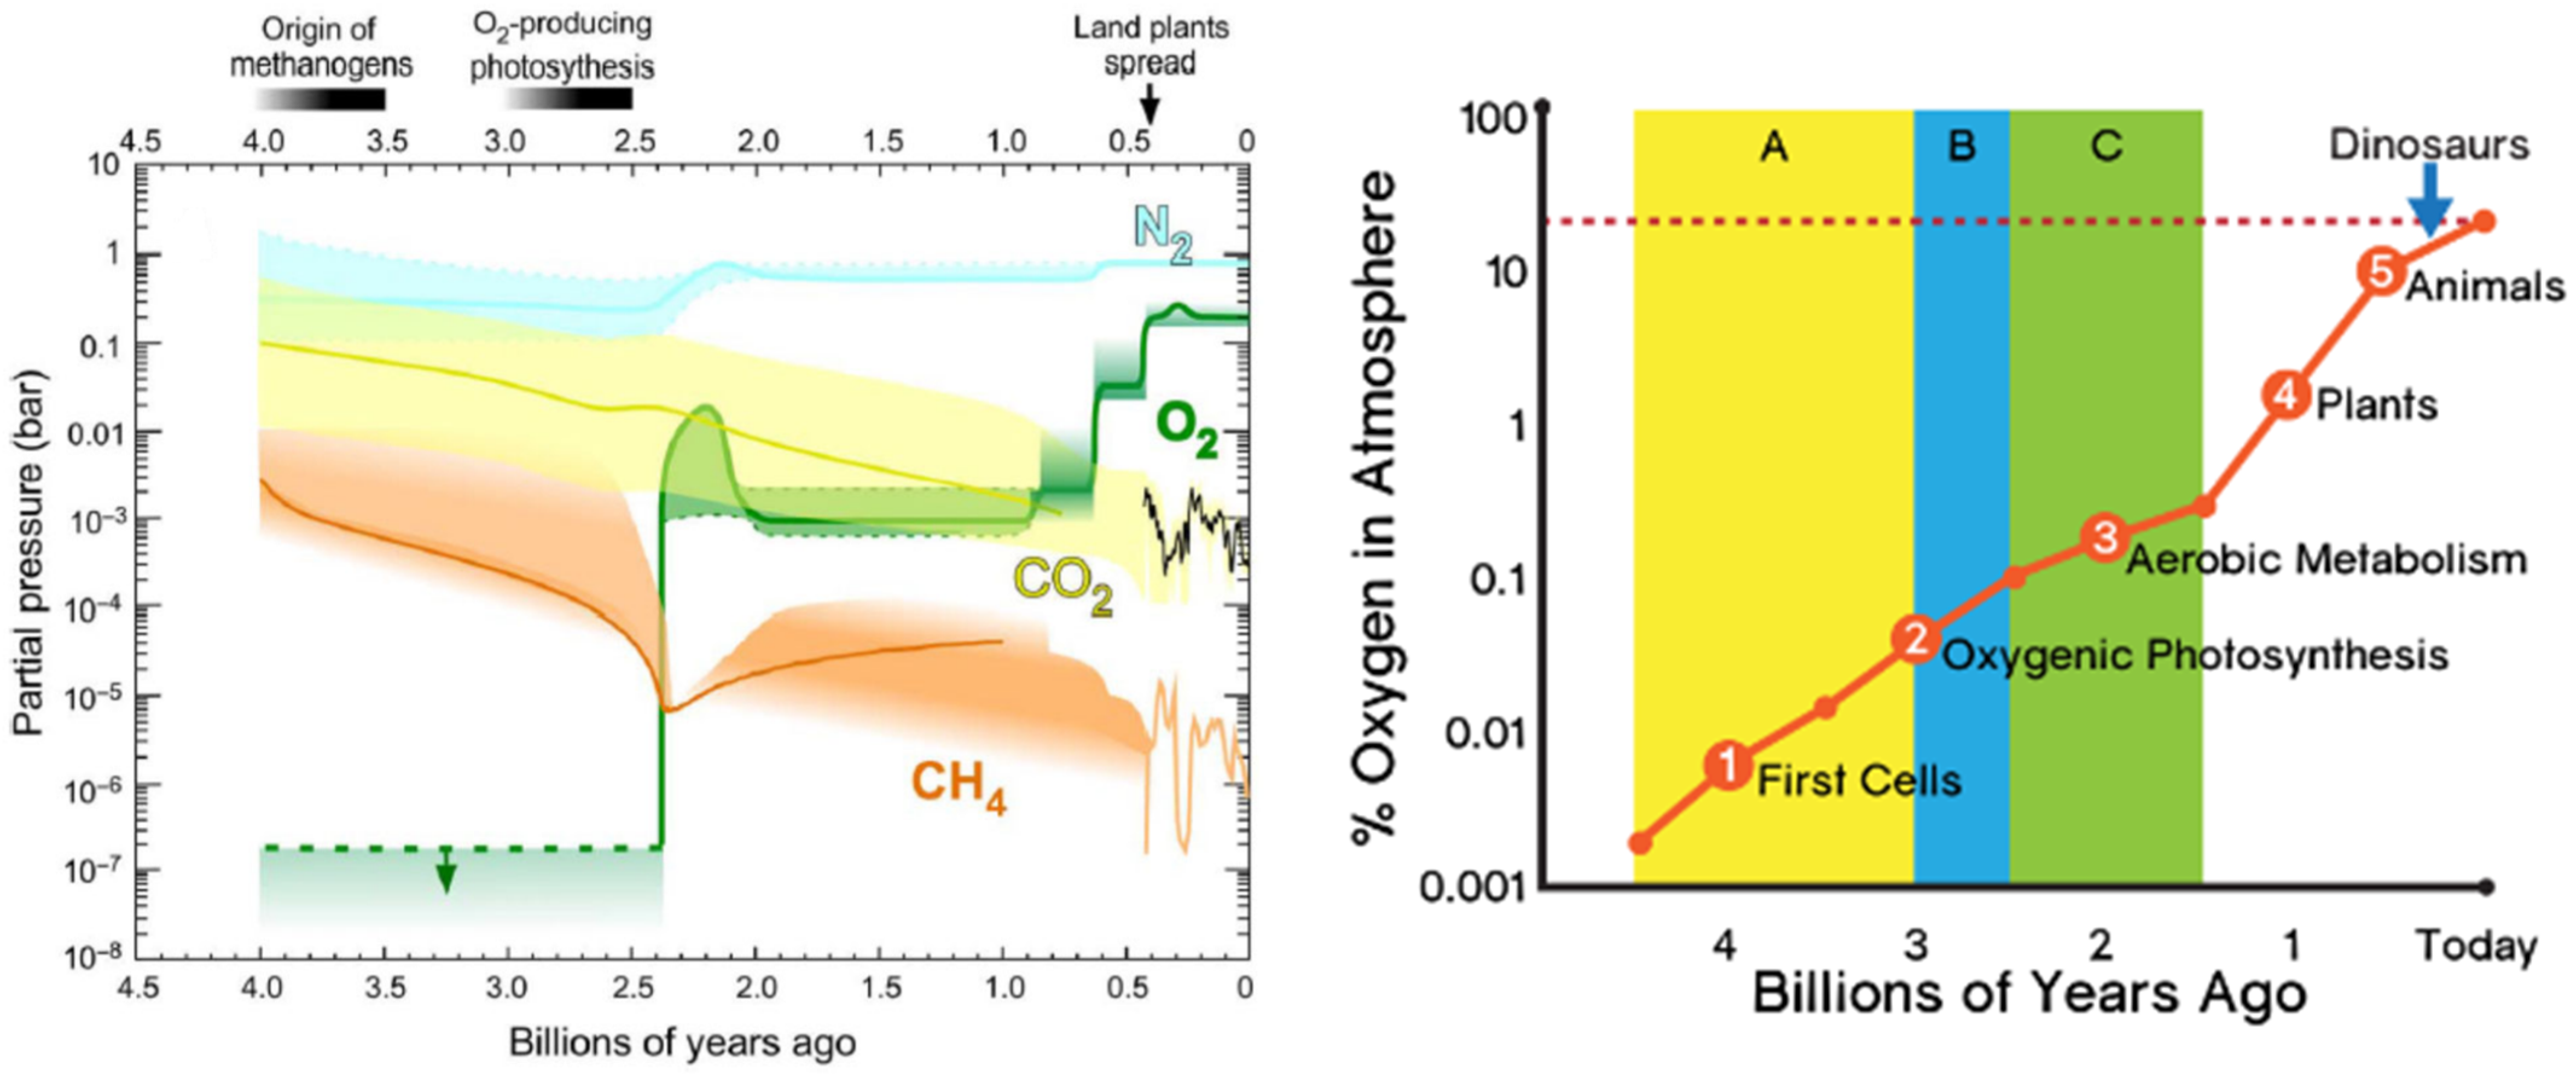
The oxygen cycle is closely tied to the carbon cycle. The original atmosphere of the Earth contained only trace amounts of free oxygen (
Figure 4). All of the oxygen in the atmosphere now came from the oxygenic photosynthesis of plants over billions of years. Much of the oxygen and carbon contained in the primordial Earth atmosphere is no longer available as large masses of the initial atmospheric free oxygen were consumed for oxidizing the minerals on the surface of the Earth. Consequently, most of the initial atmospheric free oxygen has been tied up as inorganic mineral oxides and inorganic carbonate rocks produced by corals and other creatures over the early history of the earth.
Other than O2, green plants also produced carbohydrates from CO2 and H2O, which, over time, were deposited in marine or lake sediments. Some of these were then converted, through thermogenic or biogenic processes, into hydrocarbons (fossil fuels). Natural processes provide a balance between carbon, oxygen, and hydrocarbons; however, this balance has been constantly changing over geologic time as solar energy availability, conditions suitable for biological growth in the oceans and the land, or other factors, such as the capture of oxygen in oxides and the availability of nutrients, change.
The chemistry-based challenge for discussions on the impacts of climate change on oxygen fluxes is to understand the impacts of human activities on these fluxes. While the mass of oxygen in the Earth’s crust is large, a greater understanding is needed wherever oxygen concentrations appear to be changing in oxygen-poor environments to understand what specific human or natural processes are impacting oxygen levels so that appropriate measures are taken to mitigate or manage the impacts of changes on the environment.
4. Combustion Processes
The fast oxygen and carbon cycles are driven by two equations. The oxygenic photosynthesis reaction, which creates hydrocarbons from CO
2 and water with energy input from the sun, is as follows:
The combustion reaction of hydrocarbons (including breathing) is as follows:
The combustion of fossil fuels by humans and, to a lesser extent, breathing by animals is increasing the amount of carbon available in the atmosphere, which has the effect of increasing the solar energy that can be captured by photosynthesis through Equation (1). At the same time, combustion is depleting some of the available oxygen in the atmosphere through Equation (2) to form CO
2 and H
2O. The net result observed in the atmosphere is that for every 1 ppm of CO
2 concentration increase in the atmosphere due to fossil fuel combustion, oxygen concentrations decrease by ~2.15 ppm [
20], which is what should be expected from the stoichiometric combustion equation.
Challenges for chemists about the interaction of combustion processes and the atmospheric oxygen balance are as follows:
(a)
CO2 Absorption by the Oceans—If the reduction in the atmospheric O
2 concentration is directly related to the increase in the CO
2 remaining in the atmosphere, then how can there be enough absorption of CO
2 by the oceans to cause ocean acidification, especially since the oceans are highly buffered chemically?
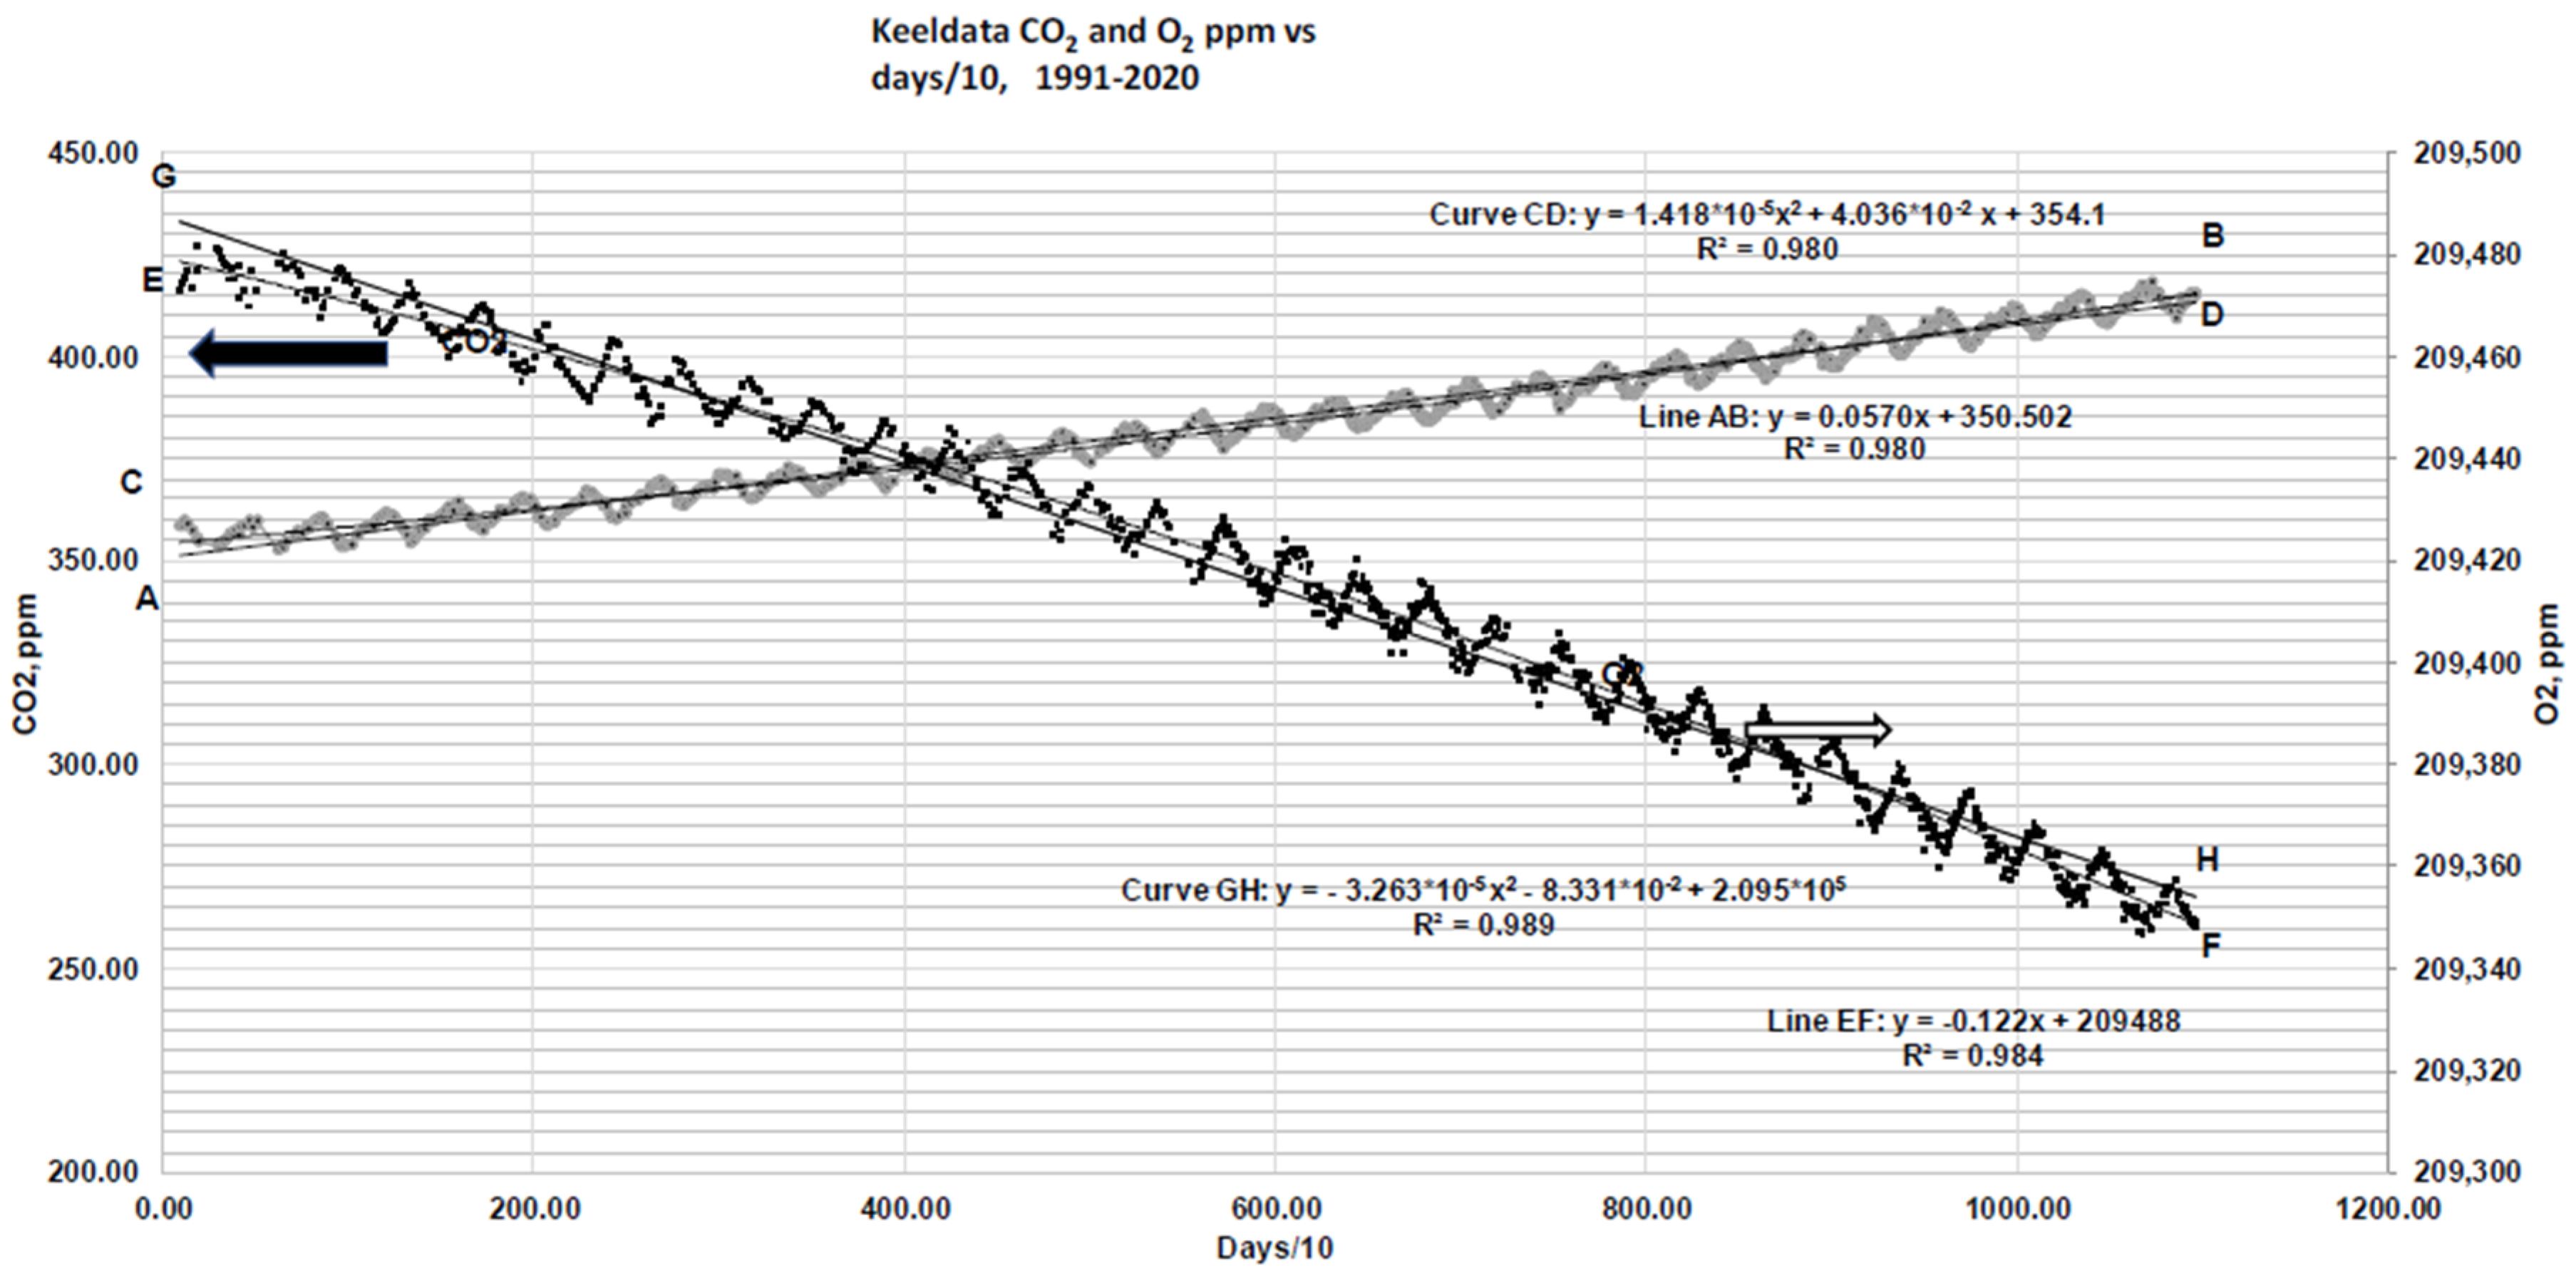
Figure 5 shows [O
2] dropping by ~130 ppm while [CO
2] increases by about 50 ppm over 20 years [
21]. If the observed reduction in the atmospheric O
2 concentration is accounted for by the observed increase in the atmospheric CO
2 concentration, as expected as a result of combustion, then where does the extra CO
2 come from that can cause ocean acidification? Over a geological timescale, past warming degassed CO
2 from the oceans. Did the oceanic pH rise because of such warming (and degassing) in the geological past? Is there any way to measure or estimate the pH of the ocean when the atmospheric concentration of CO
2 was 7000 ppm?
(b)
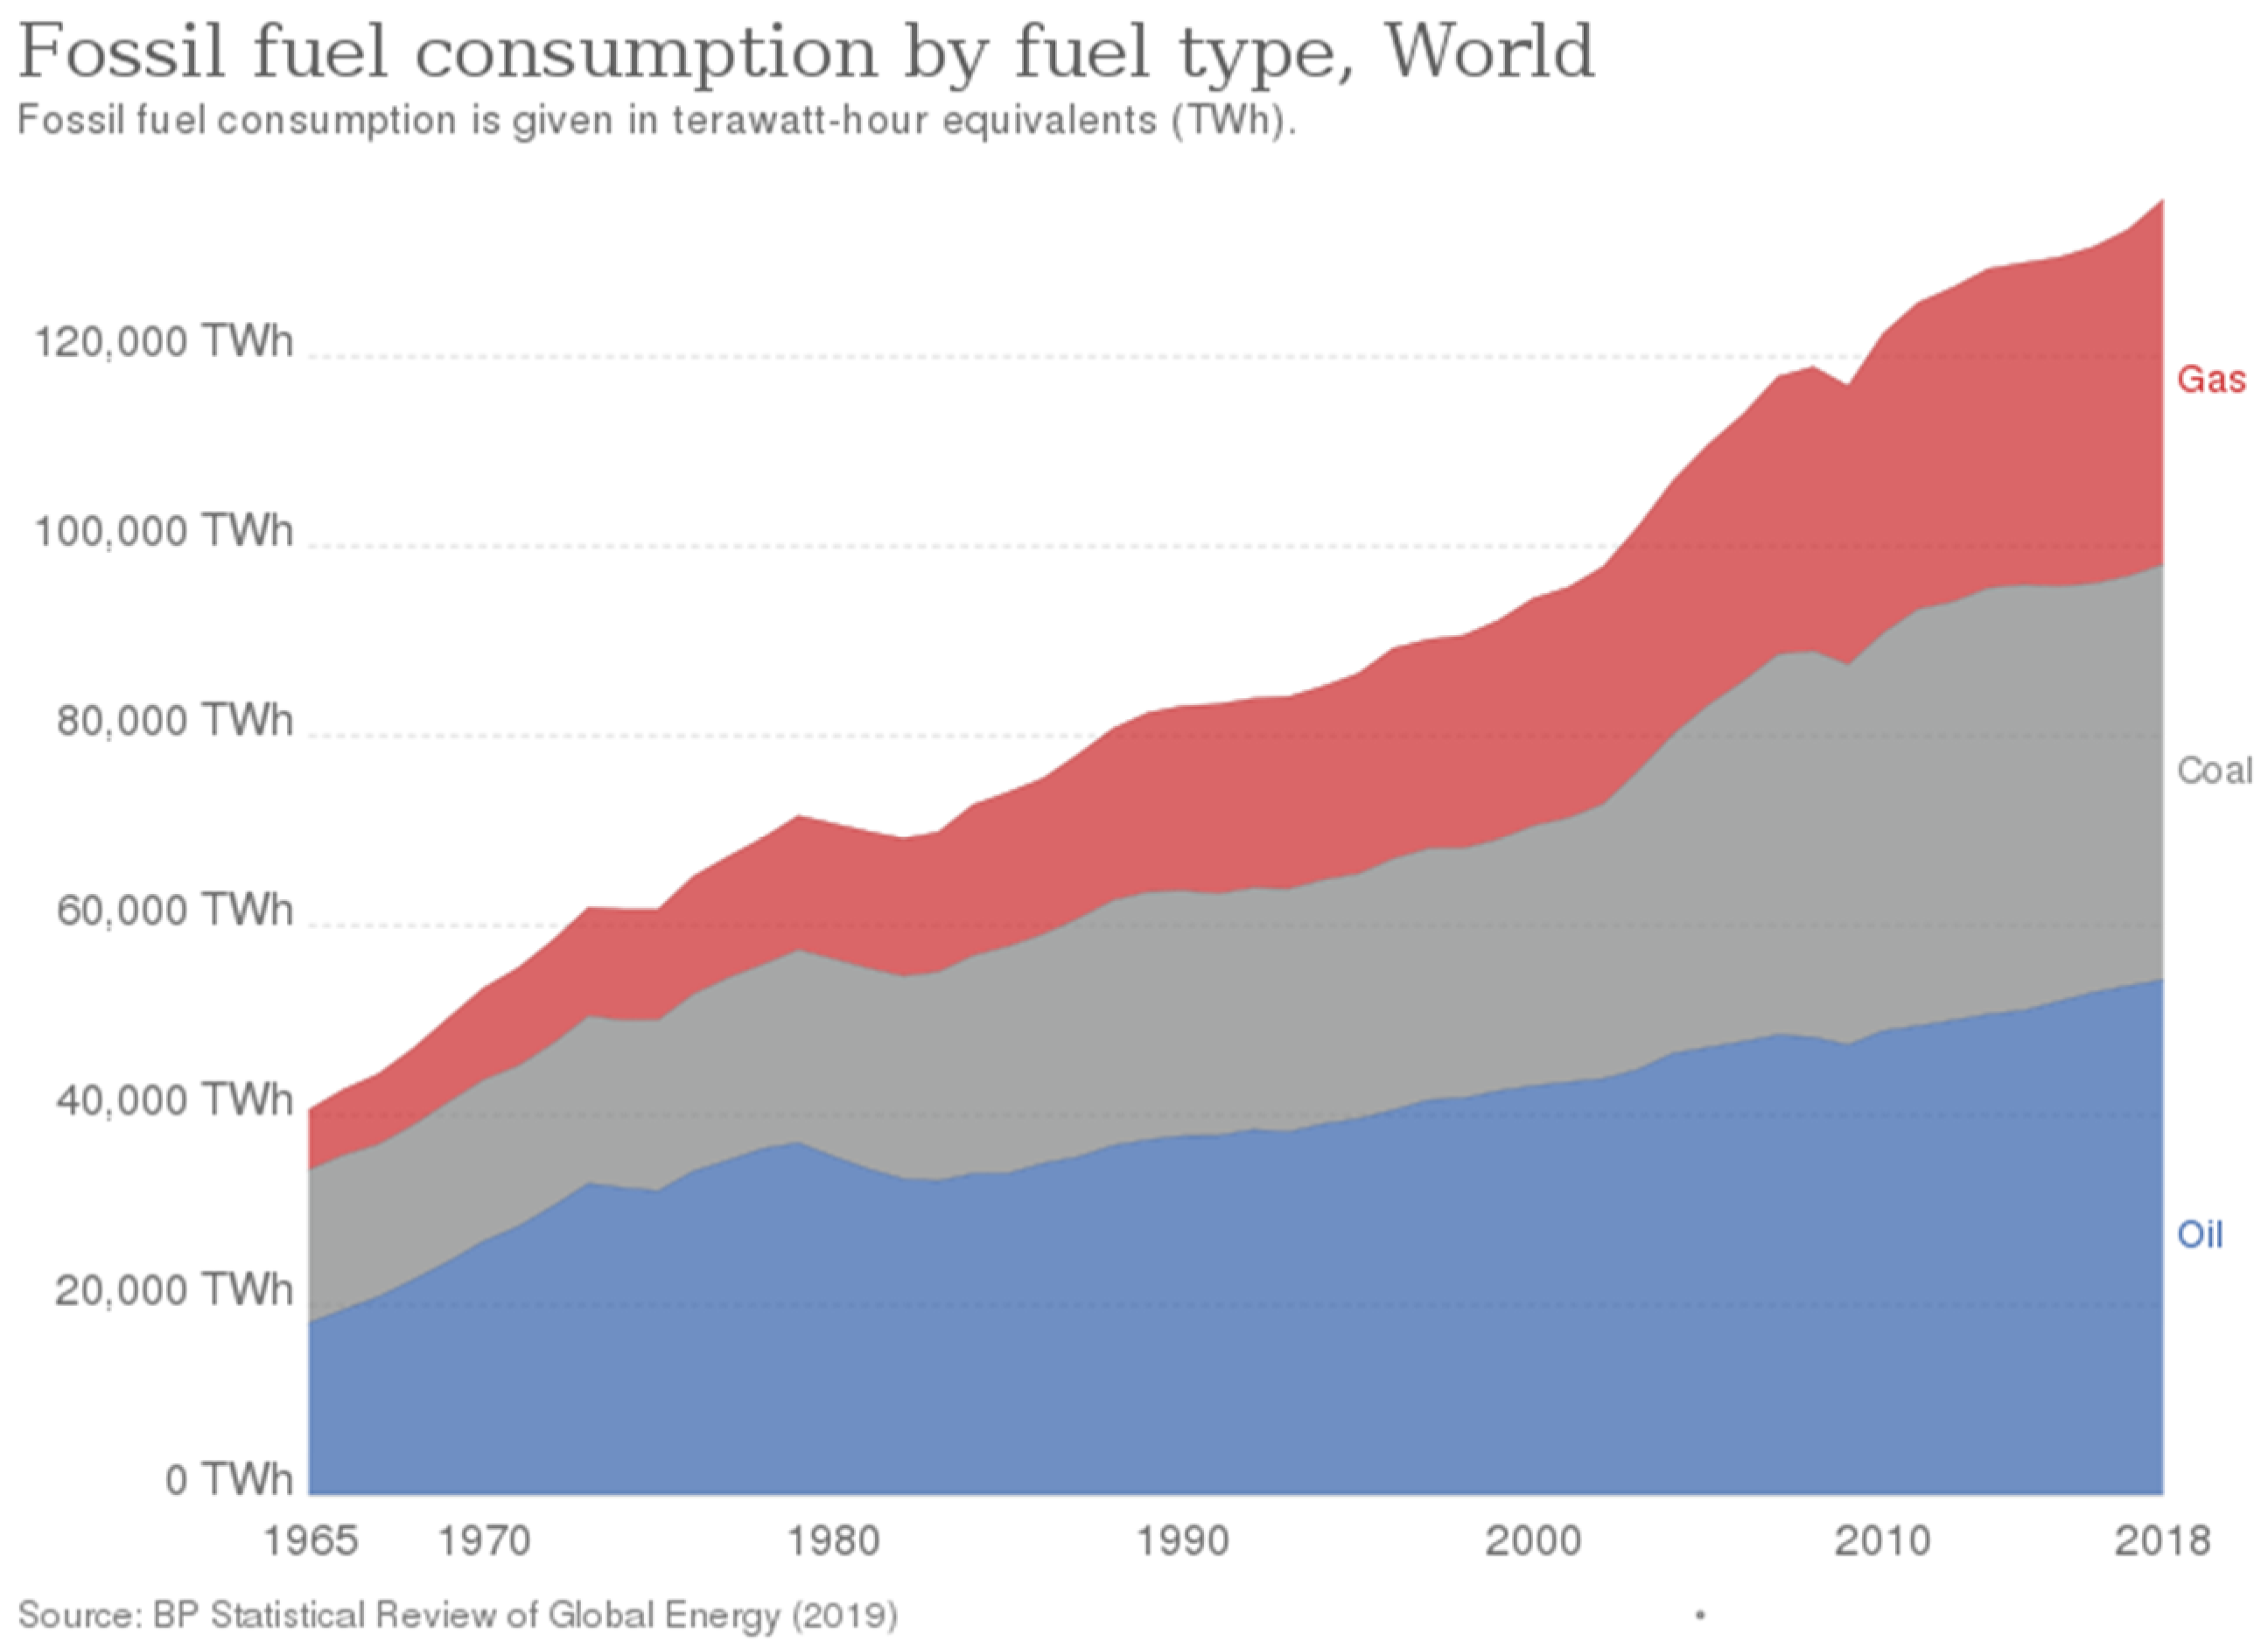
Impact of Changing Fossil Fuel Mix—Historically, the fuel consumption by humans has consistently been shifting from carbon-rich sources to progressively hydrogen-rich ones, from burning wood to charcoal to coal to petroleum to natural gas (
Figure 6). The relative changes in the O
2 concentration and the CO
2 concentration in the past should reflect this shift because progressively more water vapor and less CO
2 have been emitted for a given amount of O
2 consumption with this shift. Can this signature be detected in the relative changes of [CO
2] and [O
2] in the atmosphere over time?
(c) Oceanic Oxygen Balance—While there are reports of local anoxic events, which have been attributed by some to warmer oceans outgassing oxygen, there are other potential causes, including excess nutrients and microbial activity absorbing more oxygen. If oxygen outgassing due to ocean warming was the cause, then there should be an increase in the [O2] in the atmosphere, and the changes in oxygen concentrations in the oceans would tend to be more global and less regional in nature. Can a better understanding of the anoxic events be found and validated through biochemical investigations?
(e)
Oceanic Photosynthesis—Since the ocean is the producer of 50% to over 80% of oxygen [
22,
23], understanding oceanic photosynthesis should be a key objective of biochemical research. The issue is complex as it is a function of the availability of energy, nutrients, CO
2, and temperature. While considerable work seems to have been conducted on photosynthesis on land, the same processes appear to be less certain for ocean areas, leaving considerable opportunities for future research.
5. Carbon Capture and Storage (CCS)
The “Net Zero Response” to the global warming issue has been to capture and dispose of the CO2 underground. But what will happen to the oxygen cycle when the CO2 is sent underground to “Carbon Capture and Storage” schemes (CCS)? A short answer is that oxygen levels will be depleted as the oxygen atoms will be tied up forever as part of CO2 and H2O.
If the purpose of CCS is to reduce the atmospheric concentration of CO2, it is important to ascertain that one can reasonably expect that CCS will reduce the atmospheric concentration of CO2. However, it is not at all clear if this is indeed the case. The crux of the issue is that, unlike photosynthesis by plants, perfect sequestration of CO2 will not magically release the O2 that has effectively been “sequestered” in the CO2 and H2O molecules produced by combustion. A simplified “thought experiment” might help here.
Suppose there is a power plant or a factory that consumes O2 from the atmosphere and emits CO2 and water vapor back into the atmosphere. Suppose one installs a CCS system and captures 100% of the CO2 that comes out of the plant and that the CO2 can be sequestered perfectly and permanently.
If the fuel were made of pure carbon, then the net result in the composition of the atmosphere would be a slight reduction in the O2 concentration (basically a 1:1 O2 to CO2 injected ratio) and a slight concomitant increase in the CO2 concentration due to the slight shrinking of the denominator. If the fuel is not pure carbon but hydrocarbons, then the process will still result in a slightly lower O2 concentration in the atmosphere and, with the CO2 captured and sequestered, an increase in the relative concentration of water vapor replacing oxygen in the atmosphere. Given that the construction/installation/commissioning of a CCS system will consume additional materials, energy, water, and O2 in the atmosphere, CCS will not reduce the atmospheric concentration of CO2 at all.
A recent study indicates that to meet Paris targets for 2100, CCS is required to meet most scenarios to limit impact to 1.5 to 2 degrees of warming (based on “ensembles” of models). Cumulative CO
2 injection over the next 80 years would have to be a minimum of 1000 Gt (in contrast, only about 0.1 Gt has been sequestered by all projects initiated and operating to date) [
24]. However, the ultimate requirement could be as high as 2700 Gt by 2100 [
24], which would sequester about 0.35% of atmospheric oxygen by 2100. In short, CCS will reduce the atmospheric concentration of oxygen, will not reduce the atmospheric concentration of CO
2, and will increase the atmospheric concentration of water vapor, which is a potent greenhouse gas.
Worse, the water produced by the combustion of hydrocarbons cannot be turned back into hydrocarbons without CO2 (photosynthesis by plants). Then, the sea level would incrementally rise as a result of having more water than before, as well as through the displacement of brine from subsurface aquifers by the CO2 injected. Given that the two major components of the greenhouse gases, CO2 and water, are both essential for life on earth, and only their impact on potentially rapid changes in the Earth’s surface climate may be undesirable, it raises a question as to whether CCS is worth carrying out at all.


