Article

A Ratiometric Fluorescent Probe for pH Measurement over a Wide Range Composed of Three Types of Fluorophores Assembled on a DNA Scaffold

Institute of Advanced Energy, Kyoto University, Kyoto 611-0011, Japan
*
Author to whom correspondence should be addressed.
Chemistry 2023, 5(3), 1832-1842; https://doi.org/10.3390/chemistry5030125
Submission received: 30 June 2023 / Revised: 10 August 2023 / Accepted: 14 August 2023 / Published: 17 August 2023

Abstract

:
The desirable properties of the sophisticated fluorescent pH probe are ratiometric detection properties and a wide detection range. In this study, three types of fluorophores with different fluorescence properties were assembled on a DNA origami nanostructure. DNA nanostructure has the advantage of being a scaffold that can assemble different types of fluorophores with control over their number and position. The defined number of three different fluorophores, i.e., pH-sensitive fluorescein (CF) and Oregon Green (OG), and pH-insensitive tetramethylrhodamine (CR), assembled on the DNA scaffold provided a ratiometric fluorescent pH probe with a wide pH detection range that could cover the variation of intracellular pH.

Graphical Abstract

1. Introduction

Spatial and temporal observation of intracellular pH changes is crucial for understanding the regulatory mechanisms of various cellular physiological functions [1,2]. Among the various methods available for pH determination, such as the use of microelectrodes and NMR, optical methods such as fluorescence spectrometry have distinct advantages, including a fast response time, a high signal-to-noise ratio, non-invasiveness, and excellent pH sensitivity [3,4]. Various types of small molecule-based fluorescent pH probes have been developed [5,6], and some of them have been successfully applied to monitor changes in intracellular pH [7,8,9,10]. For example, the role of fluctuations in intracellular pH during the course of endocytic events has been investigated by using these probes [11,12,13,14].
Several desirable properties of the sophisticated fluorescent pH probe are its ratiometric detection property and wide detection range. Compared with the fluorescent pH probe that depends on the intensity change of single fluorescence emission, the ratiometric fluorescent pH probe usually offers the advantage of showing less influence of errors associated with probe concentration, photobleaching, instrument sensitivity, and so on [15,16,17,18,19,20]. Thus, the ratiometric fluorescent pH probe is useful for the quantitative determination of pH change. Another important point is that intracellular pH varies in a wide range, e.g., cytosol pH 7.2, mitochondria pH 8, and endosomal pH ranges from 6.5 to 4.5 in the early endosome to the lysosome [21,22,23]. Therefore, it is usually difficult to cover such pH changes with a single component fluorescent pH probe [5,6,15,20,21]. Combining the fluorophores, which have different fluorescence properties over pH change, is useful to improve the function of fluorescent pH probes, such as ratiometric properties and the expansion of the detection pH range.
Previously, we reported two types of fluorophores assembled on a DNA origami scaffold as a ratiometric fluorescent pH probe [24]. 2D and 3D DNA nanostructures, such as DNA origami [25], are ideal scaffolds for spatially organizing a defined number of functional molecules, including fluorophores, with nanometer precision by taking advantage of their sequence-driven programmability [26,27,28,29,30,31]. The brightness and properties of multiple fluorophores assembled on a single DNA scaffold have been tuned by controlling the number and types of the fluorophores [24,32,33]. For example, fluorescein (CF), a pH-sensitive fluorophore with decreasing fluorescence intensity with decreasing pH (pKa = 6.5) [5], and tetramethylrhodamine (CR), a pH-insensitive fluorophore as a reference, allowed ratiometric pH analysis by calculating the ratio of the fluorescence intensities of CF and CR. By complexing with the macropinocytosis-inducible peptide [34], the defined number of CF- and CR-assembled DNA origami scaffolds (named rec-CF5/CR5) successfully monitored the local pH change during the process of macropinocytosis in a ratiometric manner [24]. However, the system has difficulty performing accurate pH analysis in the acidic pH range (<5.5). Therefore, a wider pH detection range is urgently needed to track intracellular pH changes [21,22,23].
Here, we report a ratiometric fluorescent pH probe prepared by assembling three types of fluorophores on a DNA nanostructure. Oregon Green (OG), which has a pKa of 4.8 [5], was adapted for combination with CF and CR as previously developed [24]. First, the optical responses of OG assembled on DNA nanostructures were investigated, and the optimal number ratio of OG and CF was simulated based on the actual fluorescence response. Furthermore, the optical fluorescence response of CF, OG, and CR assembled on the DNA nanostructure was verified as a ratiometric pH probe with a wider pH detection range compared to two fluorophores assembled on the DNA nanostructure.

2. Materials and Methods

2.1. Materials

The single-stranded M13mp18 viral DNA (7249) was purchased from Guild Biosciences. Purified DNA origami staple strands and all other oligonucleotides, including fluorophore-modified oligonucleotides (CF-ODN1 and CR-ODN2), were purchased from Sigma-Aldrich (St. Louis, MO, USA), Japan Bio Services Co., Ltd. (Saitama, Japan), or Thermo Fisher Scientific (Tokyo, Japan). Oregon GreenTM 488 carboxylic acid, succinimidyl ester, 5-isomer (OG-NHS), and CR-dex (70 kDa) (dextran, tetramethylrhodamine, 70,000 MW) were purchased from Thermo Fisher Scientific (Tokyo, Japan). Sephacryl S-400 was purchased from GE Healthcare Japan Inc. (Tokyo, Japan). The SEP-PAK light C18 cartridge was purchased from Waters Co., Ltd. (Tokyo, Japan). The Ultrafree-MC-DV column was purchased from Merck Millipore (Darmstadt, Germany). A low-binding microtube (BT-150L, 1.5 mL, non-pyrogenic, and RNase-/DNase-free) was purchased from Ina OptikaCo., Ltd. (Osaka, Japan).

2.2. Synthesis of OG-Modified DNA (OG-ODN3) and OG-AE

Amino-modified DNA oligonucleotides (100 μM) were reacted with OG-NHS (1.5 mM) in 50 mM phosphate buffer (pH 8.0) at 30 °C for 2 days. The reaction mixture was purified by reverse-phase HPLC on a Cosmosil 5C18-MSII column (4.6 × 150 mm, eluted with 0.1 M TEAA (triethylammonium acetate) buffer, pH 7.0, with a liner gradient from 5 to 50% acetonitrile over 30 min at a flow rate of 1.0 mL·min−1) and characterized by MALDI-TOF mass spectrometry (AXIMA-LNR, Shimadzu, HPA matrix), OG-ODN3: m/z calcd. 6749, observed 6749).
OG-NHS (10 mM) in DMSO was reacted with an excess amount of 2-aminoethanol (100 mM) at 30 °C for 1 h. The reaction mixture was then filtered through a SEP-PAK light C18 cartridge for separation. The collected fraction containing OG-AE was further purified by reverse-phase HPLC on an Ultoron VX-ODC (4.6 × 150 mm, eluted with 0.05% TFA containing water with a liner gradient from 12.5 to 50% acetonitrile over 30 min at a flow rate of 1.0 mL·min−1) and characterized by ESI-TOF mass spectrometry (JMS-T100LP, JEOL, Tokyo, Japan), OG-AE: m/z calcd. 455.08, observed 455.02).

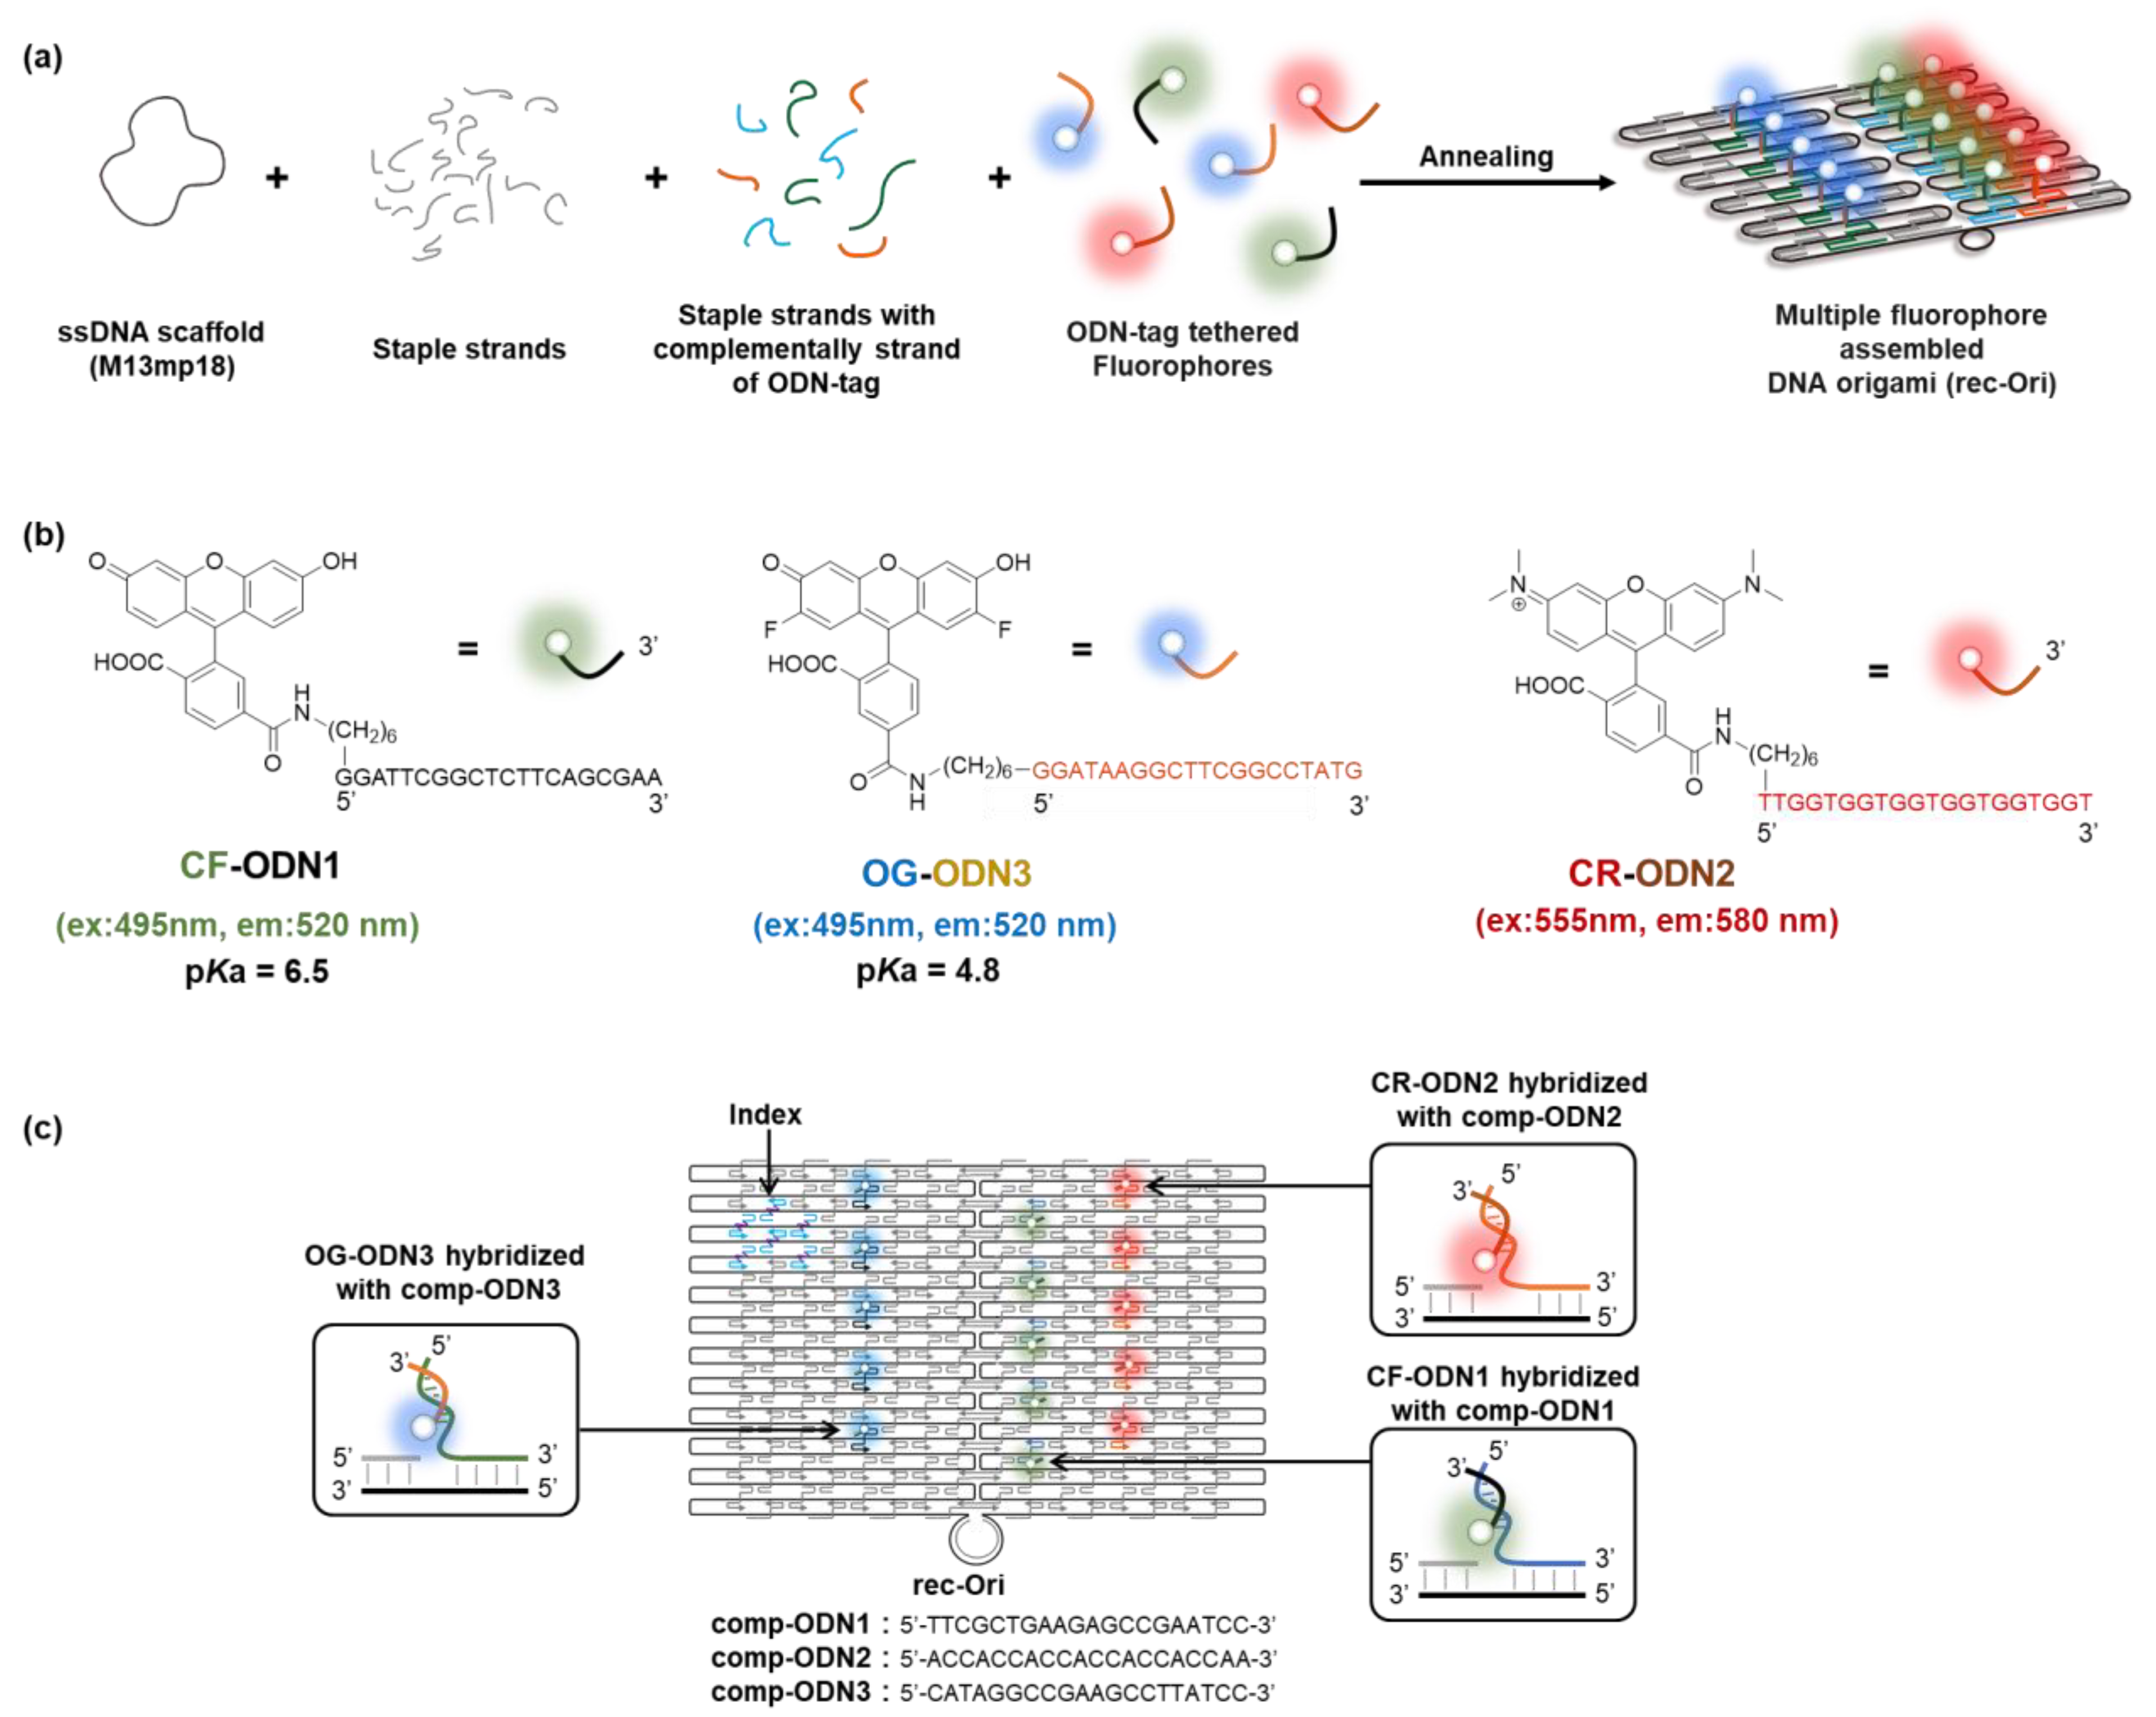
2.3. Preparation of Fluorophore-Assembled DNA Origami Scaffold (rec-Ori)

A solution (50 μL) containing M13mp18 single-stranded DNA (20 nM) and staple DNA strands (see Tables S1 and S2) (5 equiv. for scaffold ssDNA, 100 nM) with fluorophore-modified ODN-tags (see Table 1 and Table S2) (1 equiv. for each comp-ODN-attached staple DNA strand, e.g., rec-CF5/OG5/CR5: CF-ODN1 500 nM, OG-ODN3 500 nM, and CR-ODN2 500 nM) in 1× DNA origami buffer (40 mM Tris-HCl, 20 mM acetic acid, 12.5 mM MgCl2, pH 7.6) was heated at 95 °C for 1 min, annealed at 53 °C for 30 min, and held at 4 °C in a C1000 Thermal cycler (Bio-Rad, Hercules, CA, USA). Excess staple strands in the samples were removed by size exclusion chromatography (500 μL of Sephacryl S-400 (GE Healthcare, Chicago, USA) in an Ultrafree-MC-DV centrifugal unit (Merck Millipore, Darmstadt, Germany) was equilibrated with a 1× DNA origami buffer (pH 7.6) containing 40 mM Tris-HCl, 20 mM acetic acid, and 12.5 mM MgCl2). The designed rec-Ori (Figure S1, Supplementary Material) (rec-OG5/CR5 or rec-CF5/OG5/CR5) was prepared and purified as described, and the characterization of the purified rec-Ori was performed by agarose gel electrophoresis and AFM imaging (rec-OG5/CR5: Figure S3, rec-CF5/OG5/CR5: Figure S4).
To estimate the concentration of each oligonucleotide or rec-Ori, the absorbance at 260 nm was measured using a Nanodrop 2000 spectrophotometer (Thermo Scientific, Tokyo, Japan). The theoretical molar extinction coefficients used to estimate them were calculated using the value provided by OligoAnalyzer (Integrated DNA Technologies, https://sg.idtdna.com/calc/analyzer (accessed on 29 June 2023)). For example, a theoretical molar extinction coefficient of 1.169 × 10⁸ M−1cm−1 was used to calculate the concentration of DNA scaffolds (rec-Ori).

2.4. Agarose Gel Electrophoresis Analysis

All of the samples were mixed with an 6× Orange G DNA loading dye in a 3:1 ratio. Furthermore, 6 μL of 1kb DNA ladders and 8 μl of samples were loaded onto the 1.0% agarose gel (in 1 × TAE buffer) and run at 50 V for 1.5 h in the refrigerator at 4 °C. Prior to ethidium bromide (EtBr) staining to visualize DNA, the gel was scanned in fluorophore channels (CF and/or OG: excitation wavelength at 488 nm, emission wavelength at 530 nm; CR: excitation wavelength at 555 nm, emission wavelength at 585 nm) by using the Molecular Imager Pharos FX (Bio-Rad, Hercules, CA, USA). The gel was then scanned in the EtBr channel after staining with 0.5 μg/mL EtBr for 30 min with gentle shaking. Images were analyzed using Image Lab software (Bio-Rad, Hercules, CA, USA).

2.5. AFM Imaging

The purified sample (2 μl) was dropped onto a freshly cleaved mica surface (1.5 mm in diameter) and adsorbed for 5 min at room temperature. The surface was then gently washed three times with the 1× DNA buffer (pH 7.6, 40 mM Tris-HCl, 20 mM acetic acid, 12.5 mM MgCl2). The sample was scanned in solution in tapping mode using a high-speed atomic force microscope (HS-AFM) system (Nano Live Vision, RIBM Co. Ltd., Ibaraki, Japan) with a silicon nitride cantilever (Olympus BL-AC10DS-A2 (Tokyo, Japan) or NanoWorld USC-F1.2-k0.15 (Neuchatel, Switzerland)). At least two independent preparations of each sample were analyzed by HS-AFM, and multiple images were taken from different regions of the mica surface. The images were analyzed using SPIPTM software (ver. 6.2.8, Image Metrology, Lyngby, Denmark).

2.6. Fluorescence Spectra Measurement and pH Titration

Fluorescence spectra were measured with TECAN Infinite M Nano+ (Tecan Group Ltd., Mannedorf, Switzerland) by excitation at 480 nm for CF and OG and 530 nm for CR in a 40 mM acetate (pH 3.0 to 5.5), MES (pH 6.0 to 6.5), HEPES (pH 7.0 to 8.0), or CHES (pH 8.5 to 10.0) buffer containing 12.5 mM MgCl2. Fluorescence measurements were performed in the 96-well plate (Greiner Microplate, 655906, 96-well, PS, F-bottom (chimney well) µCLEAR®, black, non-binding)(Greiner Bio-One, Kremsmunster, Austria). The pKa values of the fluorophore derivatives were determined from the fluorescence data to follow a sigmoidal function described by:
R = R m i n + R m a x R m i n 1 + 10 p K a p H
where R is the fluorescence intensities (520 nm) (Figure S2) or the ratio of fluorescence intensities (520 nm/580 nm) excited at 480 nm and 530 nm, Rmin is the value of the fully protonated form under acidic conditions, Rmax is the value of the fully deprotonated form under basic conditions, and pKa is the specific pKa value of the fluorophore derivatives. The three types of fluorophores assembled on the DNA scaffold were analyzed using the following equation (Equation (2)) [35,36,37,38,39,40]:
R = R 0 + R 1 1 + 10 p K a 1 p H + R 2 1 + 10 p K a 2 p H
where R is the ratio of fluorescence intensities (520 nm/580 nm) excited at 480 nm and 530 nm, and R0 = Rmin, (R0 + R1 +R2) = Rmax, and pKa1 and pKa2 are the specific pKa values and the value of the fully deprotonated form of the two pH-sensitive fluorophores (OG and CF in this study), respectively.

2.7. Measurement of UV-vis Absorption Spectra

The UV-vis absorption spectra of rec-CR15, CR-dex (70 kDa) (eight molecules of CR on a 70 kDa dextran), CR-ODN2, and CR-AE [24] were measured with a UV spectrometer (UV-2700i, Shimadzu, Kyoto, Japan) in 40 mM MES buffer (pH 7.0). The molar extinction coefficient of 89,000 M−1cm−1 was used to calculate the concentration of tetramethylrhodamine derivatives.

3. Results

3.1. Design of Fluorophore-Assembled DNA Scaffolds

A two-dimensional (2D) rectangular DNA origami consisting of 24 parallel DNA double helices with dimensions of 90 × 60 nm (rec-Ori) was adapted as a scaffold to assemble fluorophores (Figure 1 and Figure S1) as in our previous study. [24] Briefly, a long single-stranded DNA (7249 nt of ssDNA scaffold) is folded with over 200 short ssDNA (staple strands: 202 staple strands were used in this study) into programmable shapes in DNA origami (Figure 1a). The staple strands for both short sides (24 staple strands in total) in the original design [25] (Figure S1a) were removed to prevent the intramolecular interaction between the folded rec-Ori. The staple strands of the middle position were hybridized with each other to increase the stability of rec-Ori (Figure S1b). Each staple strand has a defined sequence that hybridizes to a unique location on the ssDNA scaffold to fold it into a designed shape. A fluorophore was modified at the 5′-end of a specific single-stranded DNA (ODN-tag) that hybridizes to the complementary sequence of the ODN-tag (comp-tag) (Figure 1b,c). The comp-tag attached to the 5′-end of the staple strand was adapted in this study to attach a fluorophore to the DNA scaffold (Figure 1c). The position of each fluorophore was designed to ensure enough distance (more than 15 nm) to avoid possible steric or optical interference between each other (Figure S1) because the interference of the fluorophores, such as intermolecular FRET (Förster resonance energy transfer), must be in close proximity (typically within 10 nm) [41]. In this study, two types of pH-sensitive fluorophores, 6-carboxyfluorescein (CF) (pKa = 6.5) [5] and 5-carboxyoregon green (OG) (pKa = 4.8) [5], which have the same excitation and emission wavelengths (excitation maxima: 495 nm, emission maxima: 520 nm) but different pKa, and the pH-insensitive fluorophore 6-carboxytetramethylrhodamine (CR) (excitation maxima: 555 nm, emission maxima: 580 nm) were chosen to construct a ratiometric pH probe on the DNA scaffold (Figure 1b). CF, OG, and CR were labeled at the 5′-ends of orthogonal 20-nt ODN-tags, termed ODN1-tag, ODN3-tag, and ODN2-tag, respectively (Figure 1c and Table 1). The fluorophore-modified rec-Ori were synthesized, purified, and characterized as described in Section 2. For example, rec-Ori-CF5/OG5/CR5 indicated that five molecules each of CF, OG, and CR were assembled on rec-Ori. The absorption spectra of rec-CR15, CR-dex, CR-ODN2, and CR-AE were measured to compare the states of fluorophore (CR: tetramethylrhodamine) on the different scaffolds (Figure S6).
Table 1. Sequence of ODN-tag and comp-ODN for the assembly of fluorophores at the designated position of rec-Ori.
Combination of ODN-tag and Comp-ODN
FluorophoreDNA Sequence
CF-ODN1CF at 5′ of ODN15′-GGATTCGGCTCTTCAGCGAA-3′
comp-ODN13′-CCTAAGCCGAGAAGTCGCTT-5′
OG-ODN3OG at 5′ of ODN35′-GGATAAGGCTTCGGCCTATG-3′
comp-ODN33′-CCTATTCCGAAGCCGGATAC-5′
CR-ODN2CR at 5′ of ODN25′-TTGGTGGTGGTGGTGGTGGT-3′
comp-ODN23′-AACCACCACCACCACCACCA-5′

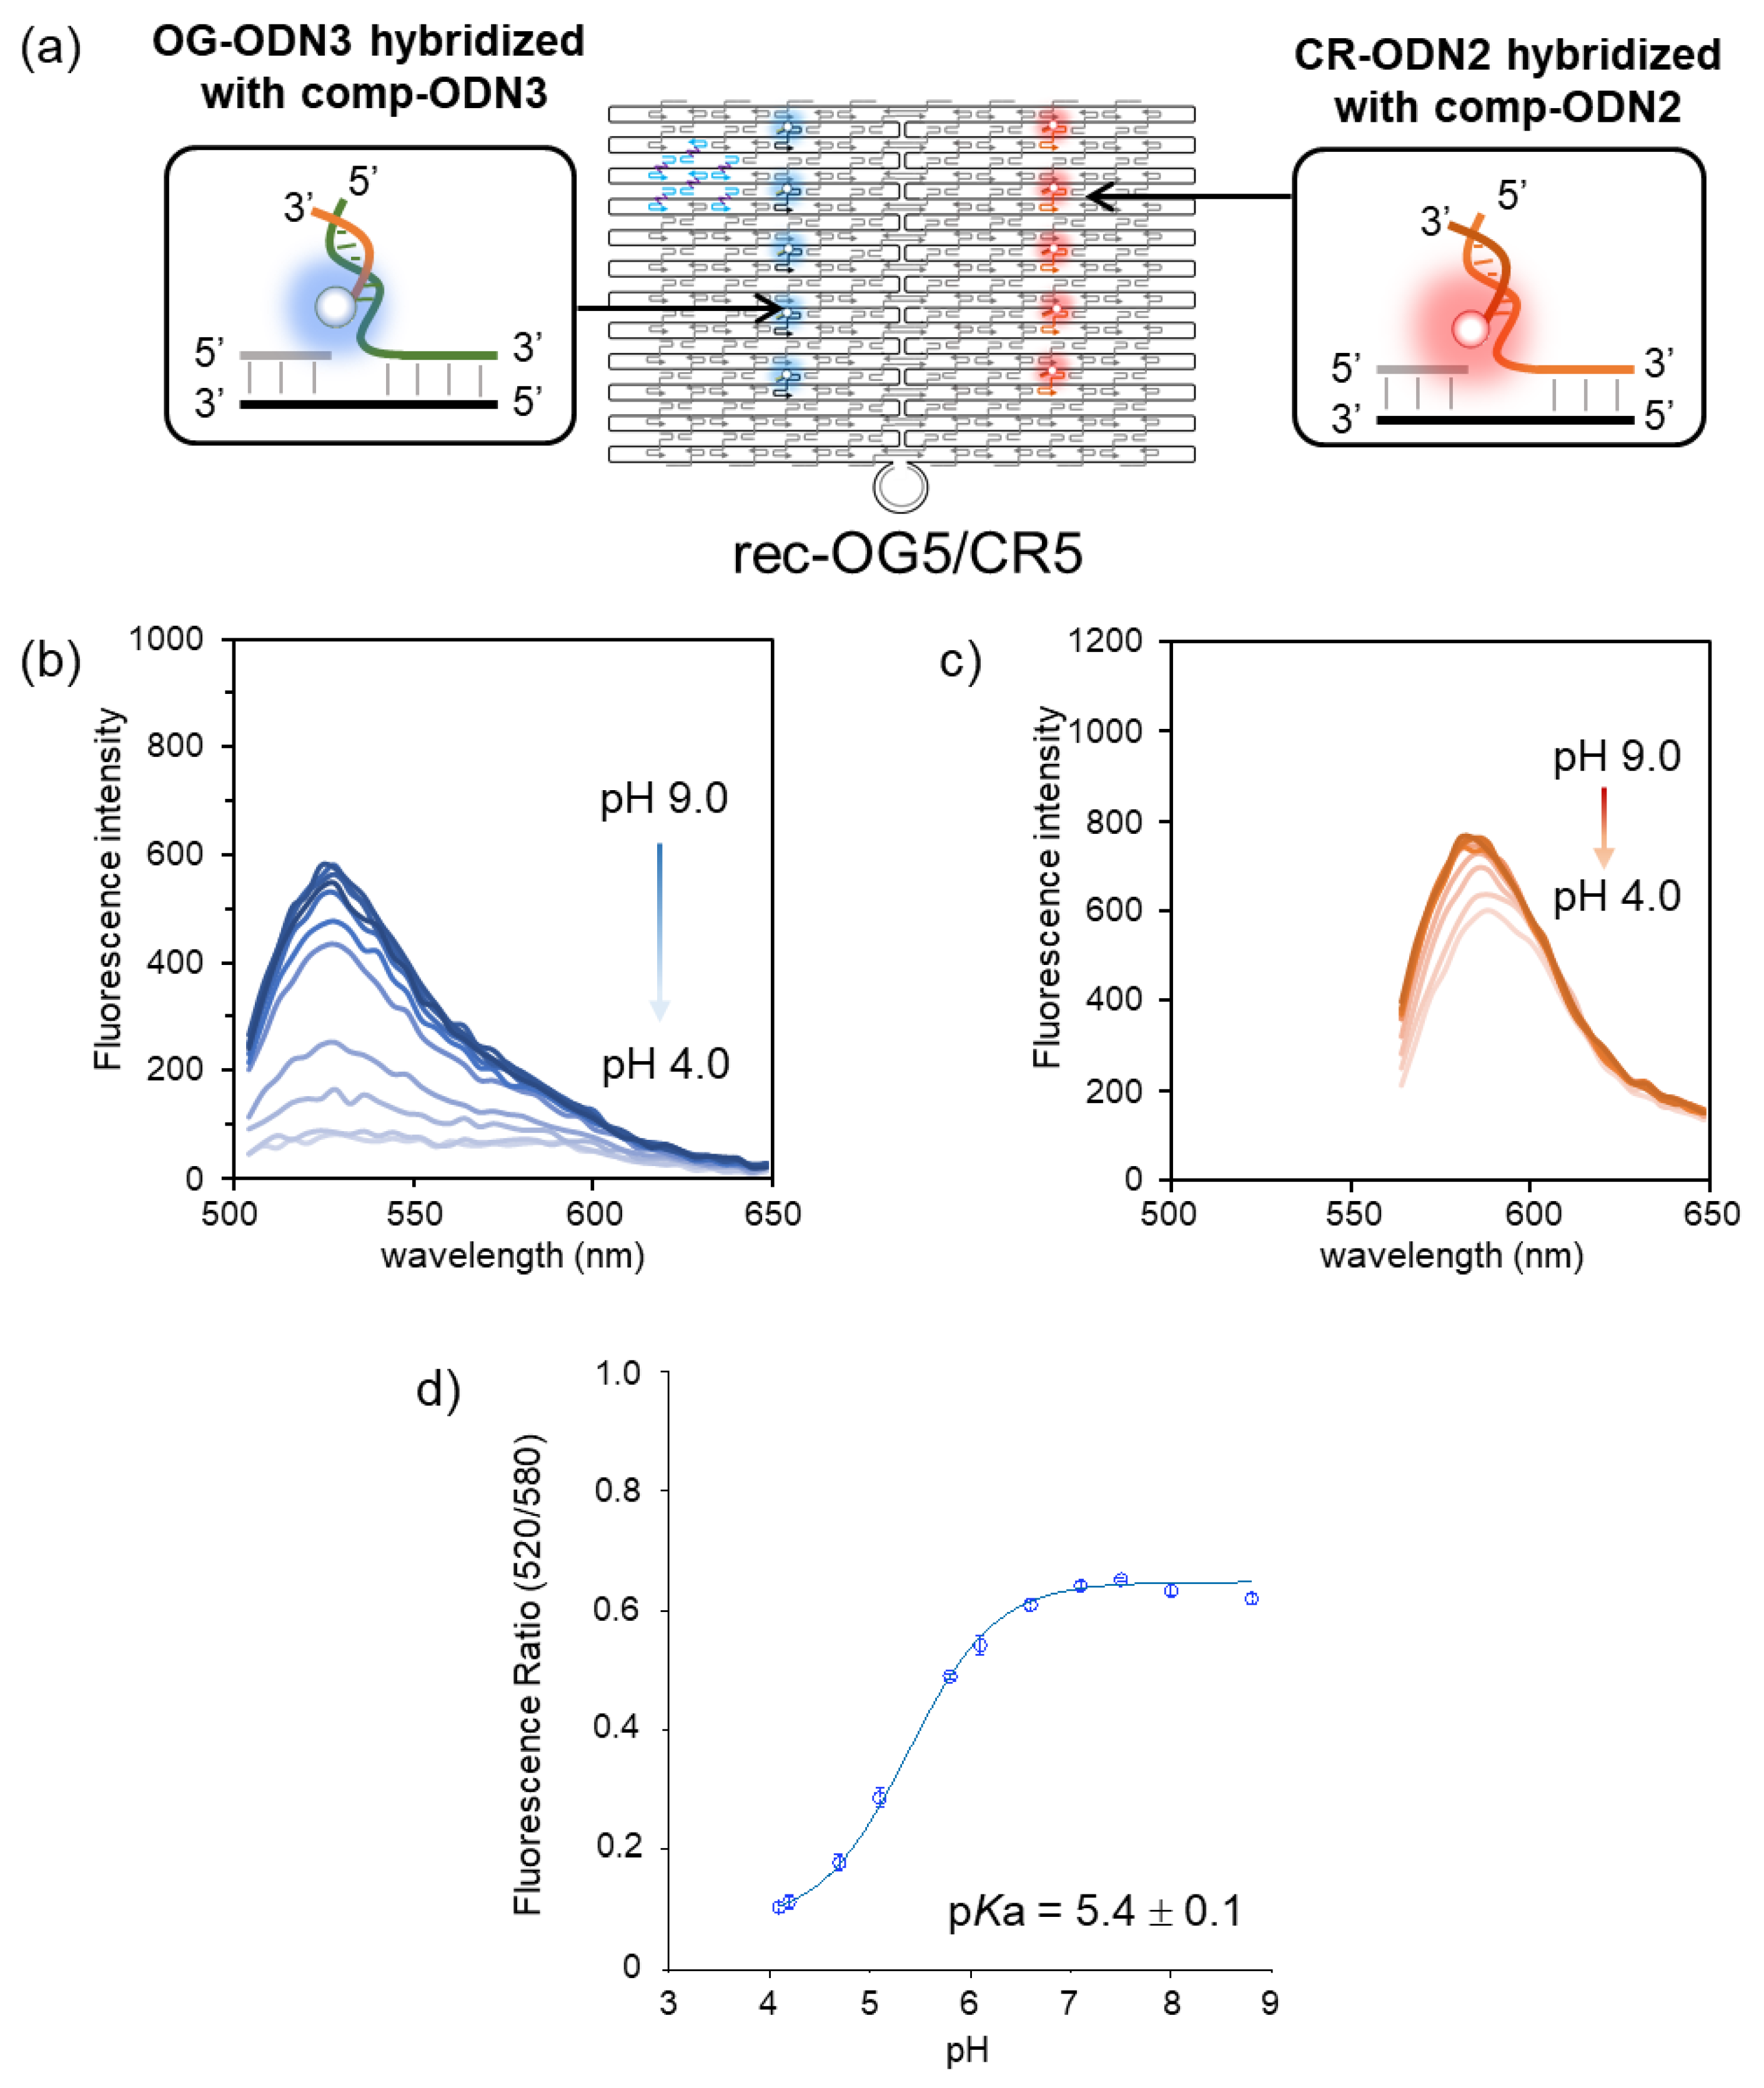
3.2. Ratiometric Detection of pH Changes by Rec-Ori Assembled with OG and CR

The fluorescence property of OG-assembled rec-Ori was first investigated at various pH values. The pH-insensitive CR was co-assembled on rec-Ori as an internal standard for OG to realize the ratiometric detection of pH. Five molecules each of OG and CR were assembled on rec-Ori (rec-OG5/CR5, Figure 2a). The characterization of rec-OG5/CR5 was performed by agarose gel electrophoresis and AFM imaging, as shown in Figure S3. After the size exclusion chromatography purification, excess staple strands and fluorophore-modified ODNs were removed, as shown in Figure S3b,c. AFM imaging of rec-OG5/CR5 (Figure S3d) indicated that fluorophore-modified ODNs could assemble at the desired positions of rec-Ori. Next, the fluorescence emission intensities of OG and CR on rec-OG5/CR5 were measured at different pH values ranging from pH 4 to 9 (Figure 2b,c). The fluorescence emission of OG (excited at 470 nm) showed a gradual decrease in intensity at the emission maxima as pH decreased from 9 to 4 (Figure 2b). On the other hand, that of CR (excited at 530 nm) was almost constant in this pH range (Figure 2c). A plot of the ratio of the emission intensity of rec-OG5/CR5 (the fluorescence intensity at 520 nm of OG and 580 nm of CR) at each pH was shown in Figure 2d. From the plot, the pKa for OG on rec-OG5/CR5 was estimated to be 5.4 ± 0.1. To compare the pKa of the OG derivatives, the pKa of OG-modified single-stranded DNA (OG-ODN3) (pKa of 5.0 ± 0.1), the duplex form of OG-ODN3 with comp-ODN3 (OG-dODN3) (pKa of 5.4 ± 0.1), and 2-aminoethanol-modified OG (OG-AE) (pKa of 4.5 ± 0.1) were determined (Figure S2). The estimated pKa of OG on rec-OG5/CR5 was consistent with the pKa of OG-ODN3 and OG-dODN3, although these values were shifted to the basic side as compared to OG-AE. The observed pKa shift is similar to the pKa shift of CF previously reported by us [24]. This means that it is the result of the destabilization of the dianionic form of OG by the negative charge of the DNA phosphate backbone.

3.3. Estimation of the Ratio of Fluorescence Emission Intensities of CF, OG, and CR Assembled on Rec-Ori with Different Numbers of CF and OG

The pKa value of CF on rec-CF5/CR5 was previously determined to be 7.1 ± 0.1 (Figure S5a). [24] We simulated the pH titration curves by changing the number of CF and OG based on the actual pH titration curves of rec-OG5/CR5 and rec-CF5/CR5, as shown in Figure S5b. The fluorescence intensity ratios at pH 9 and pH 4 of rec-OG5/CR5 and rec-CF5/CR5 were set to 1 and 0, respectively. Furthermore, the normalized fluorescence intensity ratios of different numbers of OG and CF were calculated as shown in Figure S5b. Based on the simulation data, we speculated that the linearity of the pH titration curve between pH 4 and pH 9 was greatly changed when the number of OG and CF on rec-Ori was changed. To prove the speculation, we next demonstrated the determination of the pH titration curve by constructing rec-CF5/OG5/CR5.

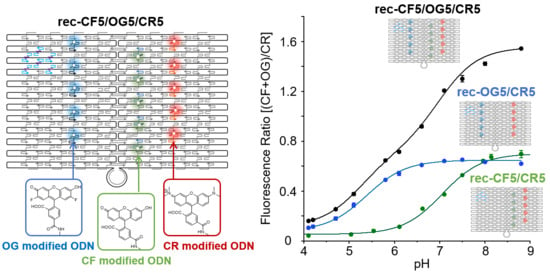
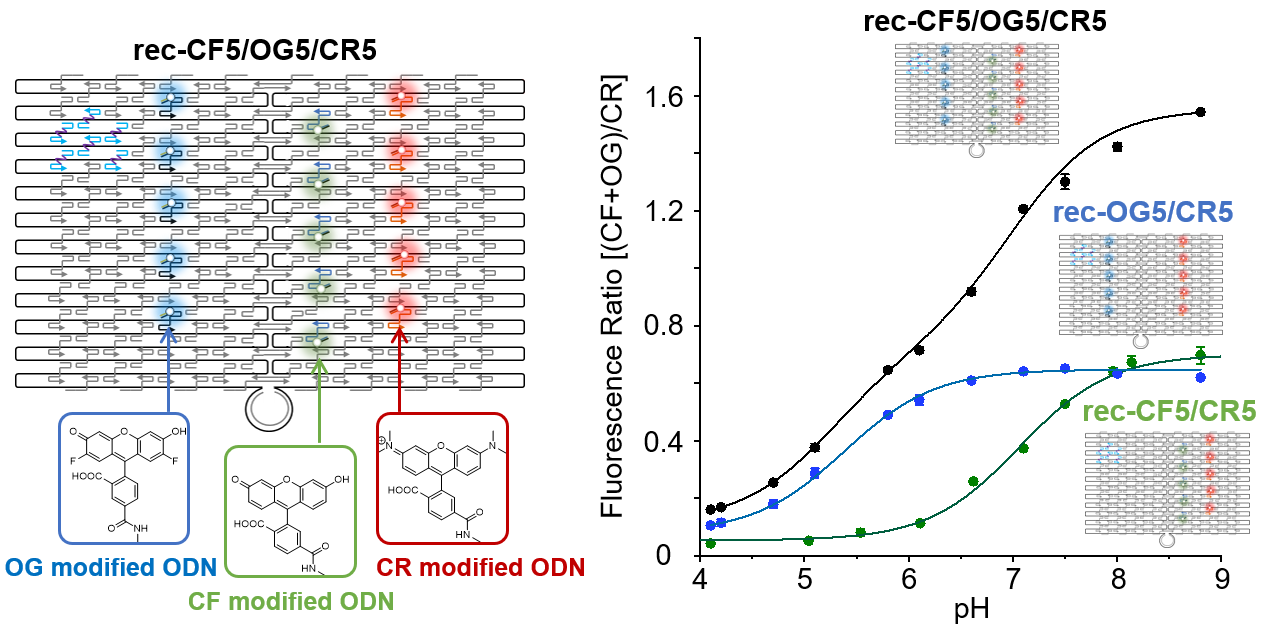
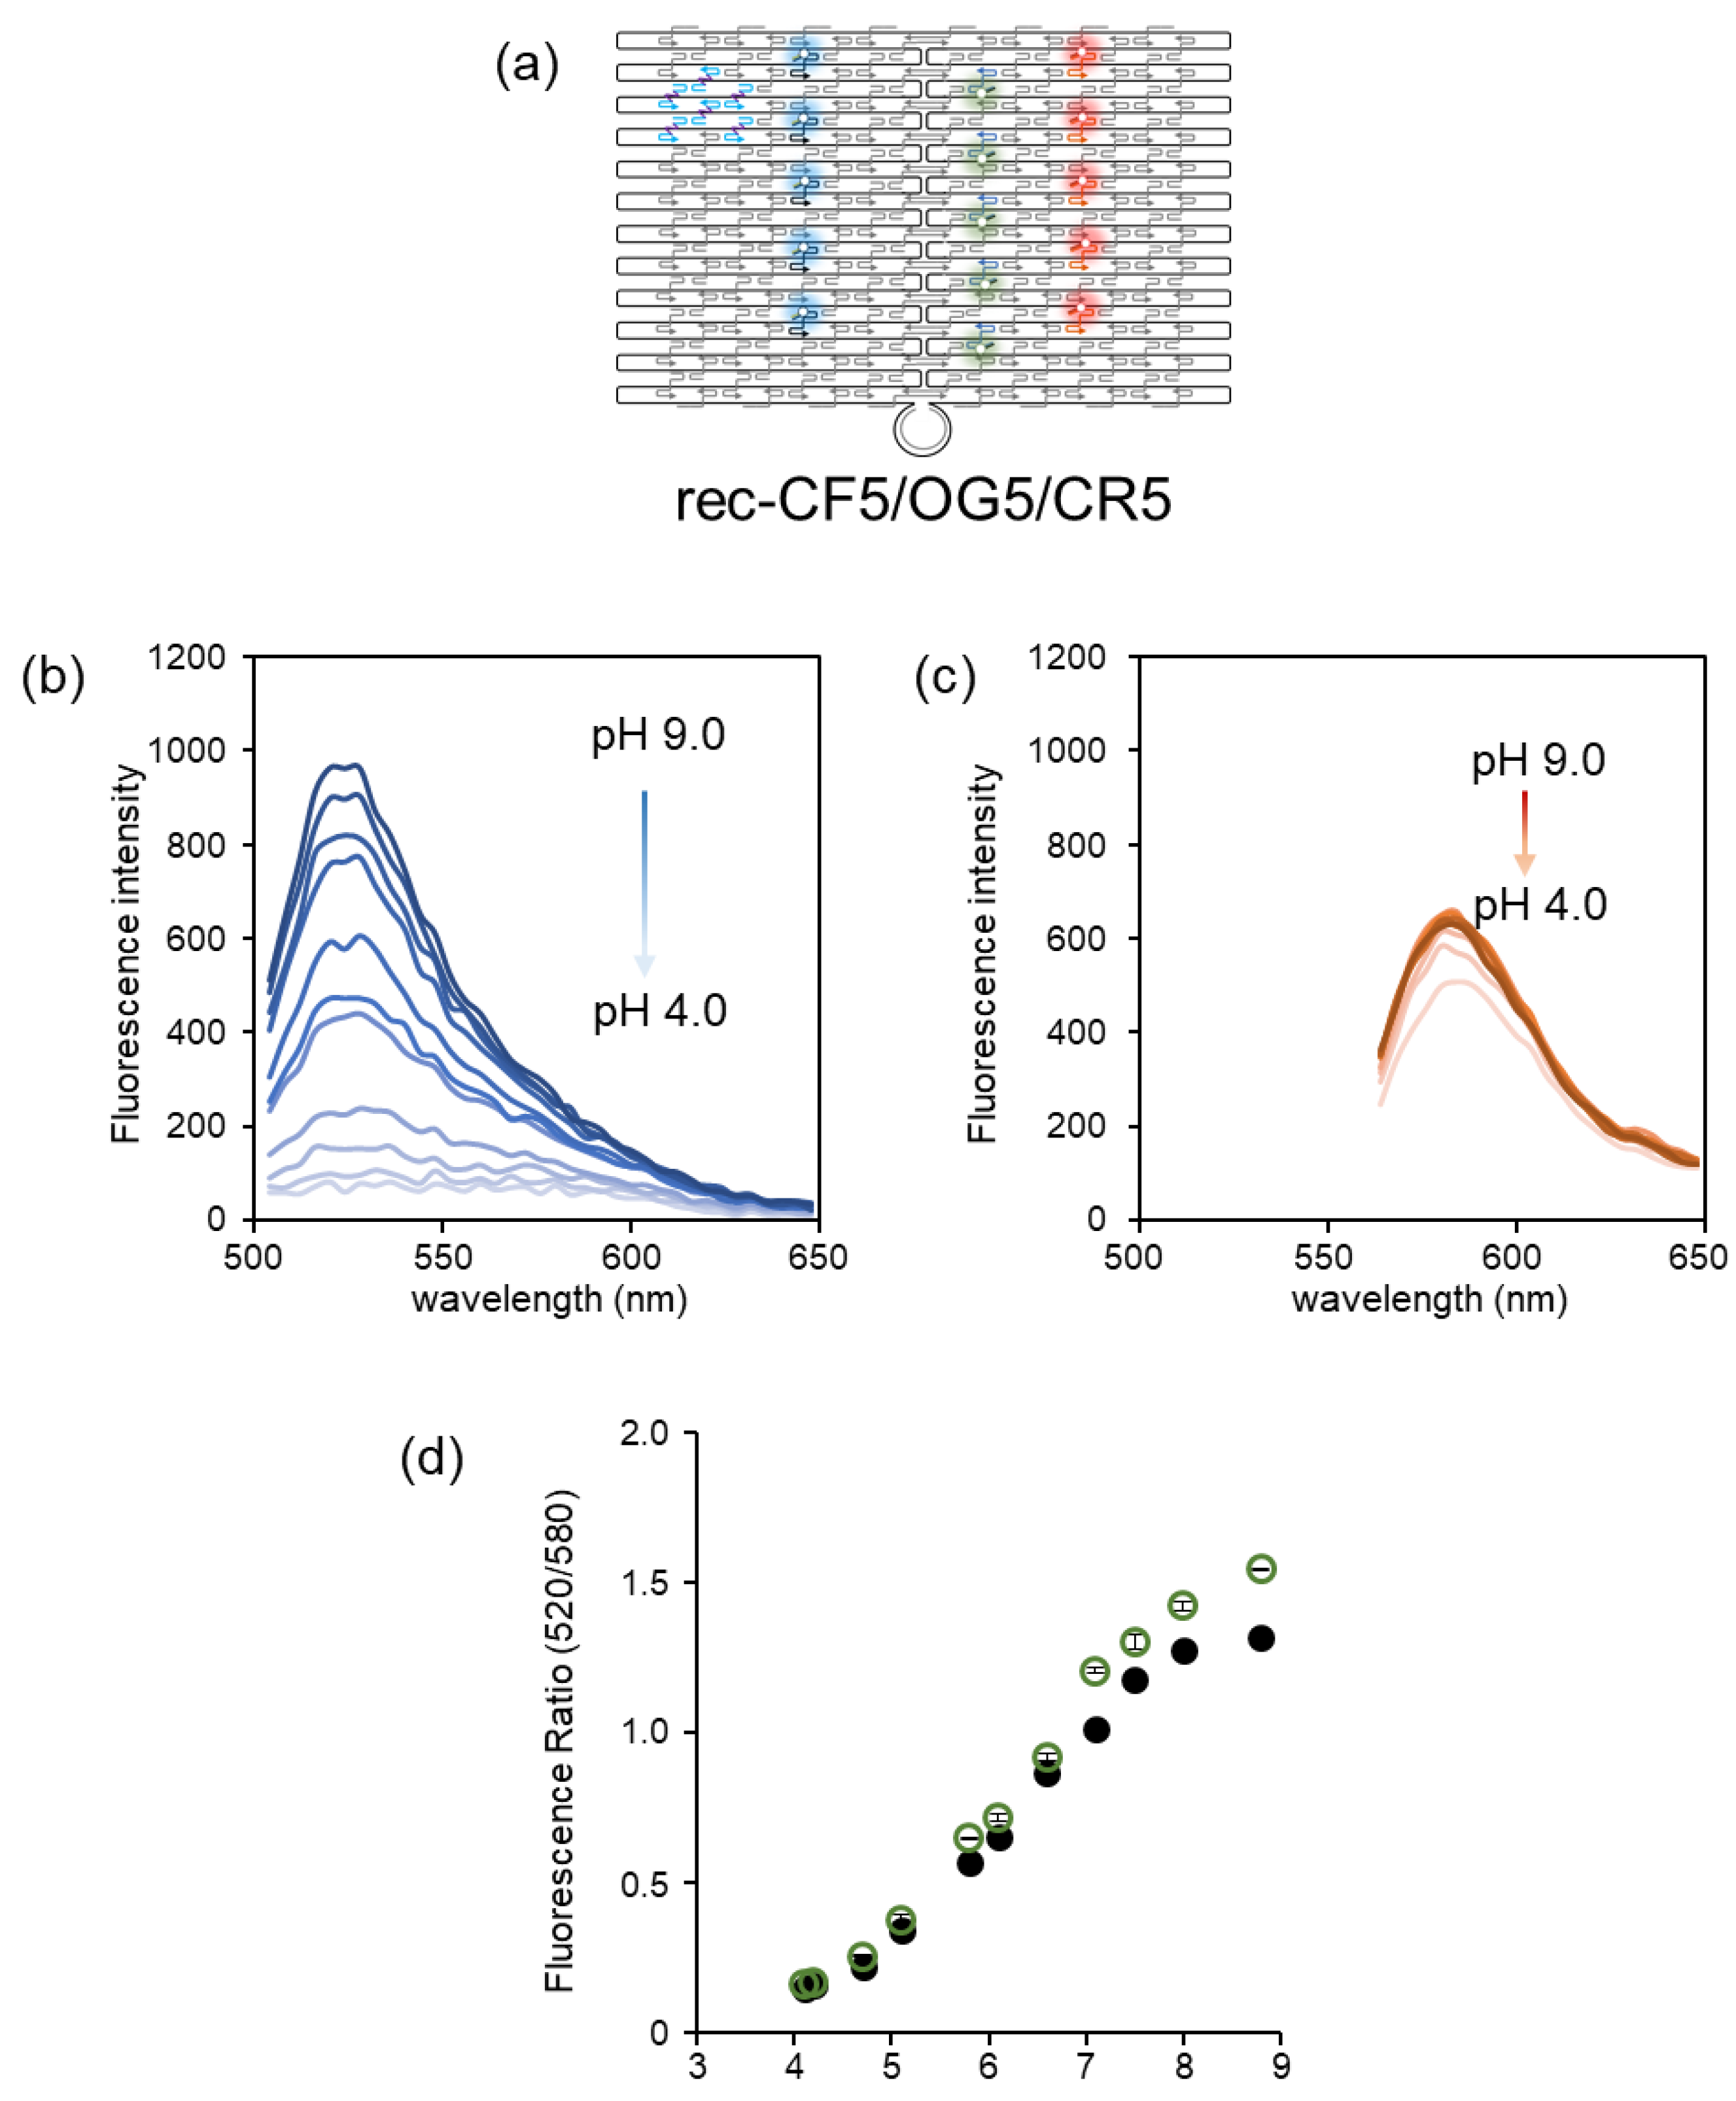
3.4. Ratiometric Detection of pH Changes by Rec-Ori Assembled with CF, OG, and CR

Rec-CF5/OG5/CR5, on which five molecules each of CF, OG, and CR were assembled, was synthesized and characterized as shown in Figure S4. The characterization of rec-CF5/OG5/CR5 was performed by agarose gel electrophoresis and AFM imaging, as shown in Figure S4. After the size exclusion chromatography purification, excess numbers of staple strands and fluorophore-modified ODNs were removed, as shown in Figure S4b,c. AFM imaging of rec-CF5/OG5/CR5 showed that fluorophore-modified ODNs could assemble at the desired positions of rec-Ori (Figure S4d). Next, The fluorescence emission intensities of CF, OG, and CR on rec-CF5/OG5/CR5 were measured at different pH values ranging from pH 4 to 9 (Figure 3b,c). The fluorescence emission of CF and OG (excited at 470 nm) showed a gradual decrease in intensity at the emission maxima as pH decreased from 9 to 4 (Figure 3b), whereas that of CR (excited at 530 nm) was almost constant (Figure 3c). This result was in agreement with rec-OG5/CR5 and rec-CF5/CR5 [24]. A plot of the ratio of the emission intensity of rec-CF5/OG5/CR5 (the fluorescence intensity at 520 nm of CF and/or OG and 580 nm of CR) at each pH was shown in Figure 3d. The plot allowed the estimation of two pKa values due to OG and CF on rec-CF5/OG5/CR5 as pKa1 of 5.2 ± 0.1 and pKa2 of 7.0 ± 0.1, respectively, i.e., the detectable pH of rec-CF5/OG5/CR5 ranged from 4.2 to 8.0 with good linearity. These two pKa values were consistent with the pKa of OG on rec-OG5/CR5 (5.4 ± 0.1) and CF on rec-CF5/CR5 (7.1 ± 0.1). In addition, the experimental plots of rec-CF5/OG5/CR5 at each pH were consistent with the estimated plots calculated from the plots of rec-OG5/CR5 and rec-CF5/CR5 (Figure 3d).

4. Discussion

Two different fluorophores, pH-sensitive and pH-insensitive, co-assembled DNA nanostructures, such as rec-CF5/CR5 and rec-OG5/CR5, could function as ratiometric fluorescent pH probes. However, the pH detection range of the pH-sensitive fluorophore, which has different fluorescence properties between the protonation and deprotonation forms of the fluorophore, is usually considered to be pKa ± 1 [5,41]. Thus, the detectable pH of rec-CF5/CR5 (pKa of 7.1 ± 0.1) (Figure S5) and rec-OG5/CR5 (pKa of 5.4 ± 0.1) (Figure 2d) ranged from 8.1 to 6.1 and from 6.4 to 4.4, respectively. The range could not cover the variation in intracellular pH from pH 8 to pH 4.5 [21,22,23]. On the other hand, rec-CF5/OG5/CR5 (pKa1 of 5.2 ± 0.1 and pKa2 of 7.0 ± 0.1) as three different fluorophores co-assembled DNA nanostructure has an almost linear pH response from 4.2 to 8.0 (Figure 3d), which could cover the intracellular pH variation [21,22,23]. For example, if rec-CF5/OG5/CR5 is applied to cellular pH monitoring by complexation with the macropinocytosis-inducible peptide SN21-LK15 as described previously, the intracellular pH change by macropinocytosis can be monitored within the pH range of 4.4 to 8.1. This means that the acidic pH change of macropinosomes can be monitored more efficiently than rec-CF/CR [24]. Moreover, it should be noted that the fluorophores on the DNA nanostructure, such as rec-Ori, could assemble by preventing interference with each other due to the characteristics of the DNA nanostructure, which could strictly control the number and spatial organization of the fluorophores [24,25,26,27,28,29,30,31,32,33]. In this case, the fluorophores were assembled on rec-Ori with enough distance (more than 15 nm) to avoid possible optical or steric interferences such as intermolecular FRET (appeared within 10 nm distance) between each other [5,41] or aggregation causing quenching by H-type dimer (H-dimer) formation [19,42,43,44]. To clarify the advantage, the states of the fluorophores, tetramethylrhodamine (CR), on the different scaffolds (DNA origami scaffold and dextran) were compared by measuring absorption spectra (Figure S6). Tetramethylrhodamine, a type of xanthene fluorophore, is known to form an H-type dimer, resulting in fluorescence quenching [42,43,44]. The absorption spectra of CR-assembled scaffolds (rec-CR15 or CR-dex (70 kDa)) or monomeric states of CR (CR-ODN2, CR-AE) were measured (Figure S6). The spectra of CR-dex (70 kDa) showed H-dimer formation with the appearance of a blue-shifted peak; the shifted peak could not be observed in the cases of rec-CR15, CR-ODN2, and CR-AE (the detail was discussed in the note below Figure S6). The result clearly indicated that CR on rec-CR15 could assemble by preventing steric interferences such as H-dimer formation. Based on this property, the fluorescence response of the different numbers of fluorophores assembled on the DNA nanostructure could be simulated and speculated on, as shown in Figures S3d and S5. Indeed, the fluorescence response of the assembled rec-CF5/OG5/CR5 was consistent with the estimated fluorescence response of rec-CF5/CR5 and OG5/CR5, as shown in Figure 3d. Although polyacrylamide-based nanoparticles combined with CF, OG, and CR have been previously reported as ratiometric fluorescent pH probes [35,36,37,38,39], it is difficult to control the number of fluorophores due to the characteristics of the nanoparticle [5,6,15,40]. In this regard, DNA nanostructure is advantageous as a scaffold for the assembly of different types of fluorophores with control over their number and position. Since CF and OG have the same excitation and emission wavelengths (excitation maxima: 495 nm, emission maxima: 520 nm) but different pKa, rec-CF5/OG5/CR5 could be excited and monitored by two channels just like rec-CF5/CR5 when rec-CF5/OG5/CR5 is used for cellular application under microscopic observation. That is, another channel (e.g., Cy5), which is usually mounted in conventional fluorescence microscopy, could be used for another probe (e.g., a fluorescent probe for enzyme activity [45]).

5. Conclusions

We have applied a combinational strategy to design a multi-target, detectable fluorescent probe based on a DNA nanostructure to extend the detection pH range of the fluorescent pH probe. The assembly of CF, OG, and CR on a rectangular DNA origami scaffold (rec-CF5/OG5/CR5) provided a ratiometric fluorescent pH probe with a wide pH detection range compared to the ratiometric fluorescent pH probes assembled with two fluorophores, such as rec-CF5/CR5 and rec-OG5/CR5. The combinational strategy could be used not only for pH changes but also for different targets by combining appropriate fluorescent probes on the DNA scaffold [41]. Work in this direction is ongoing in our laboratory.

Supplementary Materials

The following supporting information can be downloaded at: https://www.mdpi.com/article/10.3390/chemistry5030125/s1. Figure S1: Design of a DNA origami scaffold (rec-Ori); Figure S2: Fluorescence spectral changes of OG derivatives as a function of pH; Figure S3: Characterization of rec-OG5/CR5 by gel electrophoresis and AFM imaging; Figure S4: Characterization of rec-CF5/OG5/CR5 by gel electrophoresis and AFM imaging; Figure S5: Estimation of the ratio of fluorescence emission intensities of CF, OG, and CR assembled on rec-Ori with different numbers of CF and OG; Figure S6: Absorbance spectra of CR modified scaffold and monomeric CR. Tables S1 and S2: Nucleotide sequences for the staple strands.

Author Contributions

Conceptualization, T.M.; data curation, E.N., K.G., M.A. and Y.S.; formal analysis, E.N., K.G., M.A. and Y.S.; funding acquisition, E.N. and T.M.; investigation, E.N., K.G., M.A., H.K. and Y.S.; methodology, E.N. and T.M.; project administration, T.M.; resources, E.N., K.G., M.A., H.K., Y.S. and P.L.; supervision, T.M.; validation, K.G., M.A., H.K. and Y.S.; writing—original draft, E.N.; writing—review and editing, E.N., K.G., M.A., H.K., Y.S., P.L. and T.M. All authors have read and agreed to the published version of the manuscript.

Funding

This research was funded by JST CREST Grant Number JPMJCR18H5 (T.M.) and by Japan Society for the Promotion of Science (JSPS) KAKENHI Grant Numbers 23H02083 (T.M.), 20H02860 (E.N.), and 22H05418 (E.N.), Japan.

Data Availability Statement

The data that supports the findings of this study are available in the supplementary material of this article.

Conflicts of Interest

The authors declare no conflict of interest. The funders had no role in the design of the study, in the collection, analysis, or interpretation of data, in the writing of the manuscript, or in the decision to publish the results.

References

  1. Roos, A.; Boron, W.F. Intracellular pH. Physiol. Rev. 1981, 61, 296–434. [Google Scholar] [CrossRef]
  2. Srivastava, J.; Barber, D.L.; Jacobson, M.P. Intracellular pH sensors: Design principles and functional significance. Physiology 2007, 22, 30–39. [Google Scholar] [CrossRef]
  3. Willmann, J.K.; Bruggen, N.V.; Dinkelbuorg, L.M.; Gambhir, S.S. Molecular imaging in drug development. Nat. Rev. Drug Disc. 2008, 7, 591–607. [Google Scholar] [CrossRef]
  4. Hargreaves, R.J. The role of molecular imaging in drug discovery and development. Clinical pharmacology and therapeutics. Clin. Pharmacol. Ther. 2008, 83, 349–353. [Google Scholar] [CrossRef]
  5. Han, J.; Burgess, K. Fluorescent indicators for intracellular pH. Chem. Rev. 2010, 110, 2709–2728. [Google Scholar] [CrossRef] [PubMed]
  6. Steinegger, A.; Wolfbeis, O.S.; Borisov, S.M. Optical sensing and imaging of pH values: Spectroscopies, materials, and applications. Chem. Rev. 2020, 120, 12357–12489. [Google Scholar] [CrossRef]
  7. Urano, Y.; Asanuma, D.; Hama, Y.; Koyama, Y.; Barrett, T.; Kamiya, M.; Nagano, T.; Watanabe, T.; Hasegawa, A.; Choyke, P.L.; et al. Selective molecular imaging of viable cancer cells with pH-activatable fluorescence probes. Nat. Med. 2009, 15, 104–109. [Google Scholar] [CrossRef]
  8. Han, J.; Loudet, A.; Barhoumi, R.; Burghardt, R.C.; Burgess, K. A Ratiometric pH Reporter for Imaging Protein-dye Conjugates In Living Cells. J. Am. Chem. Soc. 2009, 131, 1642–1643. [Google Scholar] [CrossRef]
  9. Tang, B.; Yu, F.; Li, P.; Tong, L.; Duan, X.; Xie, T.; Wang, X. A Near-Infrared Neutral pH Fluorescent Probe for Monitoring Minor pH Changes: Imaging in Living HepG2 and HL-7702 Cells. J. Am. Chem. Soc. 2009, 131, 3016–3023. [Google Scholar] [CrossRef]
  10. Nakata, E.; Yukimachi, Y.; Nazumi, Y.; Uto, Y.; Maezawa, H.; Hashimoto, T.; Okamoto, Y.; Hori, H. A newly designed cell-permeable SNARF derivative as an effective intracellular pH indicator. Chem. Commun. 2010, 46, 3526–3528. [Google Scholar] [CrossRef]
  11. Wann, J.G.; Hsu, Y.; Yang, C.; Lin, C.; Tai, D.W.; Chen, J.; Hsiao, C.; Chen, C. Neutrophils in acidotic haemodialysed patients have lower intracellular pH and inflamed state. Nephrol. Dial. Transpl. 2007, 22, 2613–2622. [Google Scholar] [CrossRef]
  12. Nilsson, C.; Kågedal, K.; Johansson, U.; Ollinger, K. Analysis of cytosolic and lysosomal pH in apoptotic cells by flow cytometry. Methods Cell Sci. 2004, 25, 185–194. [Google Scholar] [CrossRef]
  13. Sennoune, S.R.; Bakunts, K.; Martinez, G.M.; Chua-Tuan, J.L.; Kebir, Y.; Attaya, M.N.; Martinez-Zaguilan, R. Vacuolar H+-ATPase in human breast cancer cells with distinct metastatic potential: Distribution and functional activity. Am. J. Physiol. Cell Physiol. 2004, 286, C1443–C1452. [Google Scholar] [CrossRef]
  14. Nilsson, C.; Johansson, U.; Johansson, A.; Ollinger, K.K. Cytosolic acidification and lysosomal alkalinization during TNF-α induced apoptosis in U937 cells. Apoptosis 2006, 11, 1149–1159. [Google Scholar] [CrossRef]
  15. Huang, X.; Song, J.; Yung, B.C.; Huang, X.; Xiong, Y.; Chen, X. Ratiometric optical nanoprobes enable accurate molecular detection and imaging. Chem. Soc. Rev. 2018, 47, 2873–2920. [Google Scholar] [CrossRef]
  16. Méndez-Ardoy, A.; Reina, J.; Montenegro, J. Synthesis and supramolecular functional assemblies of ratiometric pH probes. Chem. Eur. J. 2020, 26, 7516–7536. [Google Scholar] [CrossRef]
  17. Di Costanzo, L.; Panunzi, B. Visual pH Sensors: From a Chemical Perspective to New Bioengineered Materials. Molecules 2021, 26, 2952. [Google Scholar] [CrossRef]
  18. Chen, Y. Recent advances in fluorescent probes for extracellular pH detection and imaging. Anal. Biochem. 2021, 612, 113900. [Google Scholar] [CrossRef]
  19. Nakata, E.; Gerelbaatar, K.; Komatsubara, F.; Morii, T. Stimuli-Responsible SNARF Derivatives as a Latent Ratiometric Fluorescent Probe. Molecules 2022, 27, 7181. [Google Scholar] [CrossRef]
  20. Hou, J.T.; Ren, W.X.; Li, K.; Seo, J.; Sharma, A.; Yu, X.Q.; Kim, J.S. Fluorescent bioimaging of pH: From design to applications. Chem. Soc. Rev. 2017, 46, 2076–2090. [Google Scholar] [CrossRef]
  21. Jaworska, A.; Malek, K.; Kudelski, A. Intracellular pH–Advantages and pitfalls of surface-enhanced Raman scattering and fluorescence microscopy–A review. Spectrochim. Acta Part A 2021, 251, 119410. [Google Scholar] [CrossRef] [PubMed]
  22. Casey, J.; Grinstein, S.; Orlowski, J. Sensors and regulators of intracellular pH. Nat. Rev. Mol. Cell Biol. 2010, 11, 50–61. [Google Scholar] [CrossRef] [PubMed]
  23. Brahimi-Horn, M.C.; Pouysségur, J. Oxygen, a source of life and stress. FEBS Lett. 2007, 581, 3582–3591. [Google Scholar] [CrossRef] [PubMed]
  24. Nakata, E.; Hirose, H.; Gerelbaatar, K.; Arafiles, J.V.V.; Zhang, Z.; Futaki, S.; Morii, T. A facile combinatorial approach to construct a ratiometric fluorescent sensor: Application for the real-time sensing of cellular pH changes. Chem. Sci. 2021, 12, 8231–8240. [Google Scholar] [CrossRef]
  25. Rothemund, P.W.K. Folding DNA to create nanoscale shapes and patterns. Nature 2006, 440, 297–302. [Google Scholar] [CrossRef]
  26. Rajendran, A.; Endo, M.; Sugiyama, H. Single-molecule analysis using DNA origami. Angew. Chem. Int. Ed. 2012, 51, 874–890. [Google Scholar] [CrossRef]
  27. Linko, V.; Nummelin, S.; Aarnos, L.; Tapio, K.; Toppari, J.J.; Kostiainen, M.A. DNA-Based Enzyme Reactors and Systems. Nanomaterials 2016, 6, 139. [Google Scholar] [CrossRef]
  28. Rajendran, A.; Nakata, E.; Nakano, S.; Morii, T. Nucleic-Acid-Templated Enzyme Cascades. ChemBioChem 2017, 18, 696–716. [Google Scholar] [CrossRef]
  29. Hong, F.; Zhang, F.; Liu, Y.; Yan, H. DNA origami: Scaffolds for creating higher order structures. Chem. Rev. 2017, 117, 12584–12640. [Google Scholar] [CrossRef]
  30. Ngo, T.A.; Dinh, H.; Nguyen, T.M.; Liew, F.F.; Nakata, E.; Morii, T. Protein adaptors assemble functional proteins on DNA scaffolds. Chem. Commun. 2019, 55, 12428–12446. [Google Scholar] [CrossRef]
  31. Zhan, P.; Andreas, P.; Qiao, J.; Dongfang, W.; Shikufa, M.; Qiancheng, X.; Qi, S.; Yingxu, S.; Baoquan, D.; Chenxiang, L.; et al. Recent Advances in DNA Origami-Engineered Nanomaterials and Applications. Chem. Rev. 2023, 123, 3976–4050. [Google Scholar] [CrossRef]
  32. Lin, C.; Jungmann, R.; Leifer, A.M.; Li, C.; Levner, D.; Church, G.M.; Shih, W.M.; Yin, P. Submicrometre geometrically encoded fluorescent barcodes self-assembled from DNA. Nat. Chem. 2012, 4, 832–839. [Google Scholar] [CrossRef]
  33. Woehrstein, J.B.; Strauss, M.T.; Ong, L.L.; Wei, B.; Zhang, D.Y.; Jungmann, R.; Yin, P. Sub–100-nm metafluorophores with digitally tunable optical properties self-assembled from DNA. Sci. Adv. 2017, 3, 18–26. [Google Scholar] [CrossRef]
  34. Arafiles, J.V.V.; Hirose, H.; Akishiba, M.; Tsuji, S.; Imanishi, M.; Futaki, S. Stimulating Macropinocytosis for Intracellular Nucleic Acid and Protein Delivery: A Combined Strategy with Membrane-Lytic Peptides to Facilitate Endosomal Escape. Bioconjugate Chem. 2020, 31, 547–553. [Google Scholar] [CrossRef]
  35. Sun, H.; Almdal, K.; Andresen, T.L. Expanding the dynamic measurement range for polymeric nanoparticle pH sensors. Chem. Commun. 2011, 47, 5268–5270. [Google Scholar] [CrossRef] [PubMed]
  36. Benjaminsen, R.V.; Sun, H.; Henriksen, J.R.; Christensen, N.M.; Almdal, K.; Andresen, T.L. Evaluating nanoparticle sensor design for intracellular pH measurements. ACS Nano 2011, 5, 5864–5873. [Google Scholar] [CrossRef]
  37. Chauhan, V.M.; Burnett, G.R.; Aylott, J.W. Dual-fluorophore ratiometric pH nanosensor with tuneable pKa and extended dynamic range. Analyst 2011, 136, 1799–1801. [Google Scholar] [CrossRef]
  38. Chauhan, V.M.; Orsi, G.; Brown, A.; Pritchard, D.I.; Aylott, J.W. Mapping the pharyngeal and intestinal pH of Caenorhabditis elegans and real-time luminal pH oscillations using extended dynamic range pH-sensitive nanosensors. ACS Nano 2013, 7, 5577–5587. [Google Scholar] [CrossRef]
  39. Desai, A.S.; Chauhan, V.M.; Johnston, A.P.; Esler, T.; Aylott, J.W. Fluorescent nanosensors for intracellular measurements: Synthesis, characterization, calibration, and measurement. Front. Physiol. 2014, 4, 401. [Google Scholar] [CrossRef]
  40. Doussineau, T.; Schulz, A.; Lapresta-Fernandez, A.; Moro, A.; Körsten, S.; Trupp, S.; Mohr, G.J. On the design of fluorescent ratiometric nanosensors. Chem. Eur. J. 2010, 16, 10290–10299. [Google Scholar] [CrossRef]
  41. Johnson, I.; Spence, M.T.Z. The Molecular Probes Handbook, 11th ed.; Invitrogen Corp.: Carlsbad, CA, USA, 2010. [Google Scholar]
  42. Ogawa, M.; Kosaka, N.; Choyke, P.L.; Kobayashi, H. H-type dimer formation of fluorophores: A mechanism for activatable, in vivo optical molecular imaging. ACS Chem. Biol. 2009, 4, 535. [Google Scholar] [CrossRef] [PubMed]
  43. Valdes-Aguilera, O.; Neckers, D.C. Aggregation phenomena in xanthene dyes. Acc. Chem. Res. 1989, 22, 171. [Google Scholar] [CrossRef]
  44. Selwyn, J.E.; Steinfeld, J.I. Aggregation of equilibriums of xanthene dyes. J. Phys. Chem. 1972, 76, 762. [Google Scholar] [CrossRef]
  45. Zhang, Z.; Nakata, E.; Shibano, Y.; Morii, T. FRET-Based Cathepsin Probes for Simultaneous Detection of Cathepsin B and D Activities. ChemBioChem 2022, 23, e202200319. [Google Scholar] [CrossRef] [PubMed]
Figure 1. (a) A scheme illustrating the construction of a DNA origami scaffold (rec-Ori) assembled with three types of ODN-tag modified fluorophores. To assemble an ODN-tag attached to a fluorophore on the DNA scaffold, a complementary sequence to the ODN-tag (comp-ODN) extended from staple strands was hybridized to the ODN-tag-attached fluorophore. (b) Structures of 6-carboxyfluorescein (CF) modified with oligo DNA (CF-ODN1), 5-carboxyoregongreen (OG) modified with oligo DNA (OG-ODN3), and 6-carboxythetramethylrhodamine (CR) modified with oligo DNA (CR-ODN2). (c) An illustration of a DNA origami scaffold assembled with three types of fluorophores (e.g., rec-CF5/OG5/CR5).
Chemistry 05 00125 g001
Figure 2. Fluorescence pH titration of OG and CR co-assembled on rec-Ori (rec-OG5/CR5). (a) The structure of rec-OG5/CR5. (b,c) Fluorescence emission spectral changes of (b) OG (excited at 470 nm) and (c) CR (excited at 530 nm) at different pH values ranging from pH 4 to 9 (4.1, 4.2, 4.7, 5.1, 5.8, 6.1, 6.6, 7.1, 7.5, 8.0, and 8.8). (d) A plot for the ratio of the emission intensity of OG at 520 nm excited at 470 nm to that of CR at 580 nm excited at 530 nm. The pKa value was estimated to be 5.4 ± 0.1 at ambient temperature. Details of the buffers used for each pH condition are shown in Section 2.
Chemistry 05 00125 g002
Figure 3. Fluorescence pH titration of CF, OG, and CR co-assembled on rec-Ori (rec-CF5/OG5/CR5). (a) The structure of rec-CF5/OG5/CR5. (b,c) Fluorescence emission spectral changes of (b) CF and OG (excited at 470 nm) and (c) CR (excited at 530 nm) at different pH values ranging from 4 to 9 (4.1, 4.2, 4.7, 5.1, 5.8, 6.1, 6.6, 7.1, 7.5, 8.0, and 8.8). (d) A plot (open circle) of the ratio of the emission intensity of CF and OG at 520 nm excited at 470 nm to that of CR at 580 nm excited at 530 nm. The pKa values were estimated to be 5.2 ± 0.1 and 7.0 ± 0.1, respectively, at ambient temperature. A plot (filled circle) of the estimated ratio calculated by rec-CF5/CR5 and rec-OG5/CR5 was included. Details of the buffer used for each pH condition are shown in Section 2.
Chemistry 05 00125 g003
Disclaimer/Publisher’s Note: The statements, opinions and data contained in all publications are solely those of the individual author(s) and contributor(s) and not of MDPI and/or the editor(s). MDPI and/or the editor(s) disclaim responsibility for any injury to people or property resulting from any ideas, methods, instructions or products referred to in the content.

