Article

Ni-Mg/Al Mixed Oxides Prepared from Layered Double Hydroxides as Catalysts for the Conversion of Furfural to Tetrahydrofurfuryl Alcohol

1
Departament d’Enginyeria Química, Universitat Rovira i Virgili, Av. Països Catalans 26, E-43007 Tarragona, Spain
2
Institute of Energy Technologies, Department of Chemical Engineering, Barcelona Research Center in Multiscale Science and Engineering, Barcelona East School of Engineering (EEBE), Universitat Politècnica de Catalunya, Eduard Maristany 16, E-08019 Barcelona, Spain
*
Author to whom correspondence should be addressed.
Chemistry 2023, 5(1), 571-588; https://doi.org/10.3390/chemistry5010041
Submission received: 14 December 2022 / Revised: 6 March 2023 / Accepted: 6 March 2023 / Published: 9 March 2023

Abstract

:
Ni-Mg/Al mixed oxide catalysts (Ni2Al, Ni2Mg1Al, and Ni1Mg1Al) obtained from layered double hydroxides (LDHs) were tested on the one-pot production of tetrahydrofurfuryl alcohol (TFA) from furfural (FF). Upon calcination at 400 °C and reduction at 500 °C, the LDHs gave catalysts containing small nickel crystallites (<4 nm) dispersed on mixtures of metal oxides and spinel structures. Complete conversion of FF (>99.5%) was achieved on all the catalysts after 4 h at 190 °C and 5.0 MPa of H2 using 5 wt.% FF in ethanol and a furfural-to-catalyst mass ratio of 7.44 g/g. TFA evolved from the sequential hydrogenation of FF to furfuryl alcohol (FA) to TFA. Competing reaction routes involved decarbonylation of FF to furan (FUR) followed by hydrogenation to tetrahydrofuran (THF) or hydrogenolysis to n-butane (BU) and the hydrogenation of the carbonyl group in FF to form 2-methyl furan (mFUR) and its hydrogenation to 2-methyltetrahydrofuran (mTHF). A third competing route consisted of the nucleophilic addition of FF with ethanol and with FA to form acetals (such as 2-(diethoxymethyl)furan, FDA), which were later converted to difurfuryl ether (DFE) and tetrahydrofurfuryl ethyl ether (TFEE) as final products. Hydrogen pressure favored the production of TFA and diminished the formation of acetals, while temperature reduced the capacity of the catalyst to hydrogenate the furan ring, thus reducing TFA and increasing FA and FUR. An 80% yield to TFA was achieved with the Ni2Mg1Al catalysts after 6 h at 190 °C and 50 bar H2, but a variety of coproducts were present at low concentration. Testing of the catalysts in gas-phase hydrogenation conditions at atmospheric pressure revealed a poorer performance, with FA as the main product.

1. Introduction

Furfural is produced by the acid-catalyzed dehydration of the C-5 carbohydrates forming hemicellulose and has been identified as a key biomass-derived platform chemical [1,2,3]. Furfural is a versatile chemical due to the presence of an aldehyde group and the α,β unsaturation of the furan ring. These functionalities make furfural an excellent starting molecule for the synthesis of many value-added chemicals since it can be converted by dehydration, oxidation, hydrogenation, decarbonylation, decarboxylation, condensation, or ring opening reactions [4,5]. Furfural hydrogenation can produce several industrially useful chemicals, such as furfuryl alcohol, tetrahydrofurfuryl alcohol, or tetrahydrofuran, among others. Tetrahydrofurfuryl alcohol in particular is used as a high-boiling-point solvent for dyes, pesticides and herbicides, inks, specialty chemicals, and in the synthesis of some pharmaceuticals [6].
The established industrial process to produce tetrahydrofurfuryl alcohol (TFA) uses supported Ni catalysts to hydrogenate furfuryl alcohol (FA) at low temperature (typically below 100 °C) in either vapor or liquid phases. The direct synthesis of TFA from furfural has attracted considerable interest, but it is challenging since it requires catalysts that activate both the furan ring and the carbonyl group. Heterogeneous catalysts based on noble metals supported on a variety of materials have been studied in detail for this reaction since they have good C=C reduction activity. Palladium supported on a Si-MFI molecular sieve (3% Pd/MFI) gave a 95% selectivity to TFA after 10 h at 220 °C and 35.5 bar H2 using isopropanol as solvent [7]. Milder conditions were required to reach similar selectivity with other supports such as hydroxyapatite (100% TFA, Pd-HAP, isopropanol, 40 °C, 10 bar H2, 3 h) [8] or metal organic frameworks (100% TFA, Pd/UiO-66, water, 60 °C, 10 bar H2, 4 h) [9]. Addition of platinum to palladium using titanium as support (PdPt/TiO2) gave a 95% selectivity to TFA at lower pressure and temperature (isopropanol, 30 °C, 3 bar H2, 4 h) [10]. A platinumnickel alloy supported on activated carbon (PtNi/C) gave a 93% TFA yield at 35 °C and 20 bar H2 using water as solvent for 12 h, close to the yield of Pd/C [11] and also similar to the performance of a commercial Rh/C catalyst (93% TFA, water, 30 °C, 10 bar H2, and 12 h) [12]. Due to the high cost of noble metals, catalysts based on non-noble metals such as nickel have been studied widely. Nakagawa et al. [13] reported a 94% yield of TFA in the gas phase hydrogenation of FF at 130 °C on Ni/SiO2 prepared by impregnation. TFA was formed through the sequential transformation of FF to FA to TFA. The presence of FF inhibited the second step because FF adsorption on the surface was stronger than that of FA. This step was also very sensitive to the structure of the catalyst. The highest activity was reached with small Ni crystallites (<4 nm). Yang et al. [14] reached a 99% selectivity to TFA at 140 °C, 40 bar H2 and 4 h using water as solvent with nickel supported on alumina modified with barium (Ni/Ba-Al2O3). Barium enhanced the selectivity to TFA by giving more basicity to the surface, thus inhibiting furfural polymerization and secondary reactions on acidic sites. A bimetallic Ni-Co supported on mesoporous silica (SBA-15) gave catalysts with highly dispersed Ni-CoOx sites (5–8 nm crystallites) that were responsible for the high selectivity to TFA (90%) during the hydrogenation of FF in isopropanol at 210 °C and 70 bar H2 for 6 h [15]. Mesoporous clays modified with MgO to reduce acidity were used as support for Ni catalysts (Ni/MgO/montmorillonite MK-10) that achieved a complete conversion of FF to TFA in aqueous-phase at 140 °C, 40 bar H2, and 4 h [16]. Kumar et al. [17] reported a ca. 90% selectivity to TFA with 10% nickel supported on a CuFe spinel (Ni/CuFe2O4) at 150 °C and 10 bar H2 in ethanol.
A high dispersion of the active metal as nanoparticles with small crystallite sizes enhances the hydrogenation activity of the catalysts by providing a large concentration of active sites, but the interaction of the metal nanoparticles with the support must be strong enough to prevent a loss of activity by sintering. An efficient way to achieve a high dispersion and stable nanoparticles is by introducing the metal directly into the structure of the support by using precursors based on layered double hydroxides (LDH) [18,19]. These are clays consisting of hydroxide layers having positive charge, balanced by mobile anions and water located in the interlayer region, according to the general molecular formula [M2+1−x M3+x(OH)2]x+ [An−x/n·yH2O]x− (0 < x < 1) [20]. This particular structure makes LDH versatile materials that can be used as heterogeneous catalysis. The basicity of the LDH surface can be modified by varying the M2+/M3+ ratio or by changing the anionic species in the interlayer space. Therefore, surface metal species can cooperate with basic-acid sites on the surface of LDH to generate multifunctional catalysts. The anionic species in the interlayer region can be modified by ion-exchange or by calcination and rehydration (memory effect) to introduce catalytically active species into the structure. Furthermore, LDH can be used as support structure for highly dispersed metal nanoparticles [20,21,22]. Heterogeneous catalysts can be also obtained from LDH precursors by calcination at controlled conditions followed by partial reduction. This produces mixed oxide structures containing small and highly dispersed metal crystallites that have strong interaction with the oxides, which provides active catalysts with good resistance to sintering [23,24,25]. Catalysts produced from LDH precursors have demonstrated good performance in the hydrogenation of furfural. Sulmonetti et al. [26] tested various nickel/mixed-metal oxides derived from Ni-Mg-Al and Ni-Co-Al LDHs in the gas-phase hydrogenation of FF at 155 °C and atmospheric pressure. FA was the main product followed by TFA, but variable amounts of FUR, mFUR, BU, and 12PD were obtained. Selectivity to TFA was only 21% with Ni2Al and 13.1% with Ni1.9Mg1Al. Improved selectivity to TFA was achieved in liquid phase hydrogenation. Wu et al. [27] reported a 95% selectivity to TFA in the hydrogenation of furfural in ethanol at 150 °C, 40 bar H2, and 3 h using a supported CuNi alloy catalyst (CuNi/MgAlO) obtained from an LDH precursor. The dispersion of the alloy crystallites and the basicity of the surface was determined by the temperature of calcination of the LDH. A 99% selectivity to TFA using Ni supported on mixed-metal oxides prepared from Ni-Al LDHs having carbonate as interlayer anion was attained in isopropanol at 110 °C, 30 bar H2 and 3 h [28]. Similarly, a 98% yield of TFA was achieved at 160 °C, 30 bar H2 and 4 h using 2-butanol as solvent with an equimolar NiCu alloy supported on mixed oxides (NiO, CuO, CuAl2O4, and NiAl2O4 spinel) derived from Ni(Cu)Al-LDH [29]. Recently, Stepanova [30] explored the Ni(Mg)AlOx catalysts obtained by calcination of Ni(Mg)Al-LDH. Tests were conducted using water as solvent at 90 °C and 20 bar H2. FA tended to be the main product, but Ni0.9Mg2.1Al gave a 44% selectivity to TFA.
The aim of this work was to synthesize NixMgyAl mixed-oxide catalysts from Ni(Mg)Al-LDH precursors using Ni/Mg atomic ratios x/y of 2/0, 1/1, and 2/1. The catalysts were characterized and tested for the total hydrogenation of furfural to TFA. The influence on product selectivity of the process conditions (10 to 50 bar H2, 160 to 210 °C, and 1 to 8 h) was investigated in detail with the Ni2Mg1Al catalyst in a batch slurry reactor using ethanol as solvent, and the pathways leading to the formation of the major products were discussed. The influence of catalyst composition was assessed with experiments at constant conditions, both in liquid phase at 50 bar of H2 and in gas phase on a continuous atmospheric reactor.

2. Materials and Methods

2.1. Synthesis of the Catalysts

To synthesize the LDH precursors, adequate amounts of Mg(NO3)2·6H2O, Ni(NO3)2·6H2O, and Al(NO3)3·9H2O were dissolved in deionized water (Merck Millipore UV water purification system, Merck Life Science S.L.U., Madrid, Spain) to a total concentration of 0.6 M. This solution was then added dropwise at room temperature to a pre-established volume of 0.3 M Na2CO3 in a flat-bottom flask under magnetic stirring at 500 rpm. A pH meter (HI-5222, HANNA Instruments S.L., Eibar, Spain) was used to maintain a constant pH of 10 by adding controlled amounts of a 1.0 M solution of NaOH. The resulting suspension was heated to 60 °C and aged for 24 h under vigorous stirring. The solid was recovered by filtration and washed with distilled water until the wash solution had a pH of 7. Afterwards, the wet solid was transferred to a ceramic crucible and dried at 105 °C for 24 h to obtain the LDH. The active forms of the catalyst were produced by calcination of the LDH in air at 400 °C for 4 h to form the mixed oxides, followed by their reduction at 500 °C for 1 hour with 40 mL·min−1 (STP) of pure hydrogen. The calcined materials were labeled according to their nominal molar metal composition as Ni2Mg1Al, Ni1Mg1Al, and Ni2Al. The reduced catalysts were identified by adding the suffix -R to their tag (Ni2Mg1Al-R, Ni1Mg1Al-R and Ni2Al-R).

2.2. Characterization of the Catalysts

The chemical composition of the calcined materials was measured by inductively coupled plasma optical emission spectrometry (ICP-OES, Spectro Arcos FHS16, SPECTRO Analytical Instruments GmbH, Kleve, Germany). Samples of ca. 52 mg of the oxides were added to 10 mL of 69 wt.% HNO3 in 50 mL Teflon sealed vessels and treated in a microwave reactor (Ethos Easy model, Milestone Srl, Sorisole, Italy) for 15 min at 120 °C followed by 40 min at 220 °C and a cooling period of 15 min. The digested samples were then diluted with milli-Q ultrapure water at a 1:10 volume ratio. The surface composition of the calcined precursors was determined by field emission scanning electron microscopy with energy dispersive X-ray spectroscopy (FESEM-EDX) in a Scios 2 Dual Beam instrument (ThermoFisher, Waltham, MA, USA) at 5 kV with a resolution of 512 by 340 pixels and a pixel size of 0.01 µm.
The textural properties of the mixed oxides were determined from nitrogen adsorption-desorption isotherms at 77 K using a Quadrasorb SI Model 4.0 (Quantachrome, Boynton Beach, FL, USA). Samples of the calcined precursors were outgassed at 150 °C for 12 h under vacuum (6 mTorr) to eliminate chemisorbed volatiles before the adsorption isotherm was measured. Surface areas were calculated using the BET equation, while the pore size distribution was calculated from the desorption wing of the isotherm according to the DFT method.
X-ray diffraction measurements were made on a Bruker-AXS D8-Advance diffractometer (Madison, WI, USA) with vertical theta-theta goniometer, incident- and diffracted-beam Soller slits of 2.5°, a fixed 0.5° receiving slit, and an automatic air-scattering knife on the sample surface. The angular 2θ range was between 20 and 80°. Data was collected with an angular step of 0.02° at a step/time of 0.5 s. Cukα radiation was obtained from a copper X-ray tube operated at 40 kV and 40 mA. Diffracted X-rays were measured with a PSD detector LynxEye-XE-T (Bruker, Madison, WI, USA) with an opening angle of 2.94°. The experimental diffractograms were fitted with the crystal structure (Rietveld analysis) [31] for the phases identified with the aid of TOPAS 6.0 software (Bruker) [32]. With the same software, the cell parameters and the mean crystallite size of the phases detected were determined using the double-Voigt approach [33]. We considered that the samples were free of micro strain as a secondary effect of the peak broadening to simplify the refinement. The wt.% of the phases involved was estimated by refining the Rietveld scale factor and applying the corresponding equations [34]. The instrumental contribution was obtained from a sample of LaB6 (SRM 660a) analyzed under the same conditions and was considered prior to establishing the crystallite size effect in the peak width.
High-resolution transmission electron microscopy (HRTEM) and high-angle annular dark-field scanning transmission electron microscopy (HAADF-STEM) of the catalysts were recorded at 200 kV on a FEI Tecnai F20 microscope (ThermoFisher, Waltham, MA, USA) equipped with a field emission source with a point-to-point resolution of 0.19 nm. Prior to the analyses, the samples were reduced in situ at 500 °C for 1 h under hydrogen.
Temperature programmed reduction (TPR) of the calcined oxides was conducted on an Autochem 2920 chemisorption analyzer (Micromeritics Instruments, Norcross, GA, USA) equipped with a TCD detector. Samples of ca. 100 mg of calcined oxides were treated at 400 °C for 2 h under a constant flow of 20 mL·min−1 (STP) of He to remove pre-adsorbed species. The samples were then cooled to 50 °C and heated to 800 °C at 5 °C·min−1 under 20 mL·min−1 (STP) of 10% H2 in Ar. The total amount of hydrogen consumed was calculated from the area under the reduction curve. Calibration of the instrument was performed by injecting known volumes of a calibration mixture (10% H2 in argon). The same instrument was used to determine the acidity and basicity of the catalysts by temperature programmed desorption of ammonia and carbon dioxide, respectively. For NH3-TPD-, samples of ca. 100 mg of the calcined oxides were reduced in situ by heating to 500 °C at 20 °C·min−1 under 30 mL·min−1 (STP) of 10% H2 in Ar and kept at that temperature for 1 h. The reduced samples were then cooled down to 40 °C at 90 °C·min−1 and stabilized for 10 min. Ammonia adsorption was performed with 30 mL·min−1 (STP) of 2.5% NH3 in helium for 60 min. Next, the samples were maintained at 45 °C under 30 mL·min−1 (STP) of helium to remove the ammonia physically adsorbed. The TPD-NH3 analysis was then performed in helium heating the sample at 10 °C·min−1 to 800 °C. The total amount of acidic sites was calculated from the area under the NH3 desorption curve. The instrument was calibrated injecting known volumes of a calibration mixture (2.5% NH3 in helium). Concerning CO2-TPD, samples of ca. 100 mg of mixed oxides were reduced in situ as previously described. Carbon dioxide adsorption was performed following the same procedure than for NH3-TPR, but using 30 mL·min−1 (STP) of 2.5% CO2 in helium for 45 min to saturate the sample and extending the CO2 desorption measurement temperature to 900 °C. Calibration was performed using known volumes of a standard containing 2.5% CO2 in helium.

2.3. Catalytic Activity

Catalyst activity was determined in a high-pressure batch slurry reactor (SSR) of 100 mL (Autoclave Engineers, Erie, PA, USA). The reactor was loaded with 30 mL of 5.0 wt.% furfural in ethanol and ca. 200 mg of pre-reduced catalyst (100 to 200 μm), which gave a furfural-to-catalyst mass ratio R/C of 7.44 g/g. The stirrer velocity was set to 1000 rpm to minimize fluid-to-particle mass transfer limitations. The Ni2Mg1Al-R catalyst was studied in detail at several conditions. Experiments were conducted at temperatures of 160 °C, 190 °C, and 210 °C and hydrogen pressures of 1.0, 2.0, 3.0, 4.0, and 5.0 MPa and reaction times of 1, 2, 4, 6, and 8 h. Before loading the SSR, the catalyst samples were reduced under 40 mL·min−1 (STP) of hydrogen at 500 °C for 1 h in a tubular reactor and then cooled to room temperature under hydrogen. Once cold, the tubular reactor was isolated with two ball valves to avoid the exposure of the catalyst to air, detached from the setup, and the catalyst was then discharged directly into the furfural solution contained in the SSR. After completing a reaction, the SSR reactor was cooled to room temperature, depressurized and opened. The catalyst was recovered by filtration, air-dried, and weighted. A sample of the liquid product was filtered with 0.22 μm nylon syringe filters (Nylon 25 mm, Scharlab, Barcelona, Spain) and cold-stored for analysis by gas chromatography as reported below.
The activity of the catalysts was also measured in the gas-phase hydrogenation of furfural at atmospheric pressure on a continuous packed bed reactor (PBR), which was described in detail elsewhere [35]. The reactor was loaded with 500 mg of calcined oxides sieved to 100–200 μm, and the catalyst was reduced in situ under 60 mL·min−1 of H2 (STP) at 500 °C for 1 h. After the catalyst was reduced, the bed temperature was decreased to 190 °C and the catalyst activity was studied at this temperature for a time-on-stream of 4 h. Constant flow rates of 80 mL·min−1 of H2 (STP) and 0.6 mL·min−1 of a solution of 5 wt.% solution of furfural in ethanol were used. The latter was equivalent to a WHSV of 2.85 gFF·gcat−1·h−1 and a hydrogen-to-furfural molar ratio of 12.7:1.0. Samples of the reaction products were collected in a cold trap at −5 °C installed at the exit of the reactor, and cold-stored until analyzed by gas chromatography.
The performance of the catalysts was established based on the fractional conversion of furfural (XF) and the molar selectivity towards the hydrogenolysis products (Sj), which were calculated according to Equations (1) and (2), respectively. NF,0 and NF were the moles of furfural in the reactor feed, the product Nj was the moles of product j formed by the reaction, and νj was the stoichiometric number of moles of furfural required to form compound j.
X F u r = N F , 0 N F N F , 0
S j = ν j N j N F , 0 N F
The reaction products were analyzed by capillary gas chromatography. The products were identified by GC-MS (GCMS-QP2010, Shimadzu, Kyoto, Japan) using a TRB-5 column (Teknokroma, Barcelona, Spain; TR-120232, 30 m length, 0.25 μm film thickness, and 0.25 mm inner diameter). Analyses were conducted using a 3-stage temperature programming (5 min at 50 °C, heating to 230 °C at 5 °C·min−1 followed by 10 min at the latter temperature) using He as carrier gas (47 mL·min−1). Sample injection was 1.0 μL and a split ratio of 300 was used. The retention time and the mass spectra of the detected products were compared with those of pure standards, when available, to confirm the assignments. Regular quantification of the reaction products was performed by GC-FID (GC-2010, Shimadzu, Kyoto, Japan) using the same column and analysis conditions.
Calibration standards were prepared in ethanol solutions with commercial samples of furfuryl alcohol (FA, 98%), tetrahydrofuran (THF, 99.9%), 1,2-butanediol (12BD, 98%), 1,2-propandiol (12PrD, 99%), 1,5-pentanediol (15PD, 97%), 1,2-pentanediol (12PD, 96%), 1,4-pentanediol (14PD, 99%), 1-pentanol (PE, 99%), furan (FUR, 99%), and 1-butanol (BU, 99.8%) purchased from Sigma Aldrich, and 2-methylfuran (mFUR, 99%), 2-methyltetrahydrofuran (mTHF, 99.9%), and tetrahydrofurfuryl alcohol (TFA, 98%) purchased from Acros Organics. All chemicals were used as received without any further treatment, except for furfural, which was freshly distilled before the reactions. Response factors in the FID detector of the compounds that were not available commercially were estimated based on their structure [36,37].

3. Results and Discussion

3.1. Catalyst Characterization

The chemical composition of the bulk calcined oxides was measured by ICP-OES (Table 1). The Ni/Al atomic ratios obtained for Ni2Mg1Al and Ni1Mg1Al were 1.90 and 0.90, respectively, closer to the intended values than the ratio of 1.83 for Ni2Al. The Mg/Al ratios were 1.11 for Ni2Mg1Al and 0.98 for Ni1Mg1Al. The surface compositions determined by FESEM-EDX (Figure S1) gave values like those of the bulk composition determined by ICP-OES (Table 1), except on the case of Ni2Mg1Al, where both the Ni/Al and Mg/Al were lower. SEM imaging (Figure S2) showed that the three calcined materials consisted of aggregates of spherical granules, which were slightly larger for Ni2Mg1Al and Ni1Mg1Al than for Ni2Al.
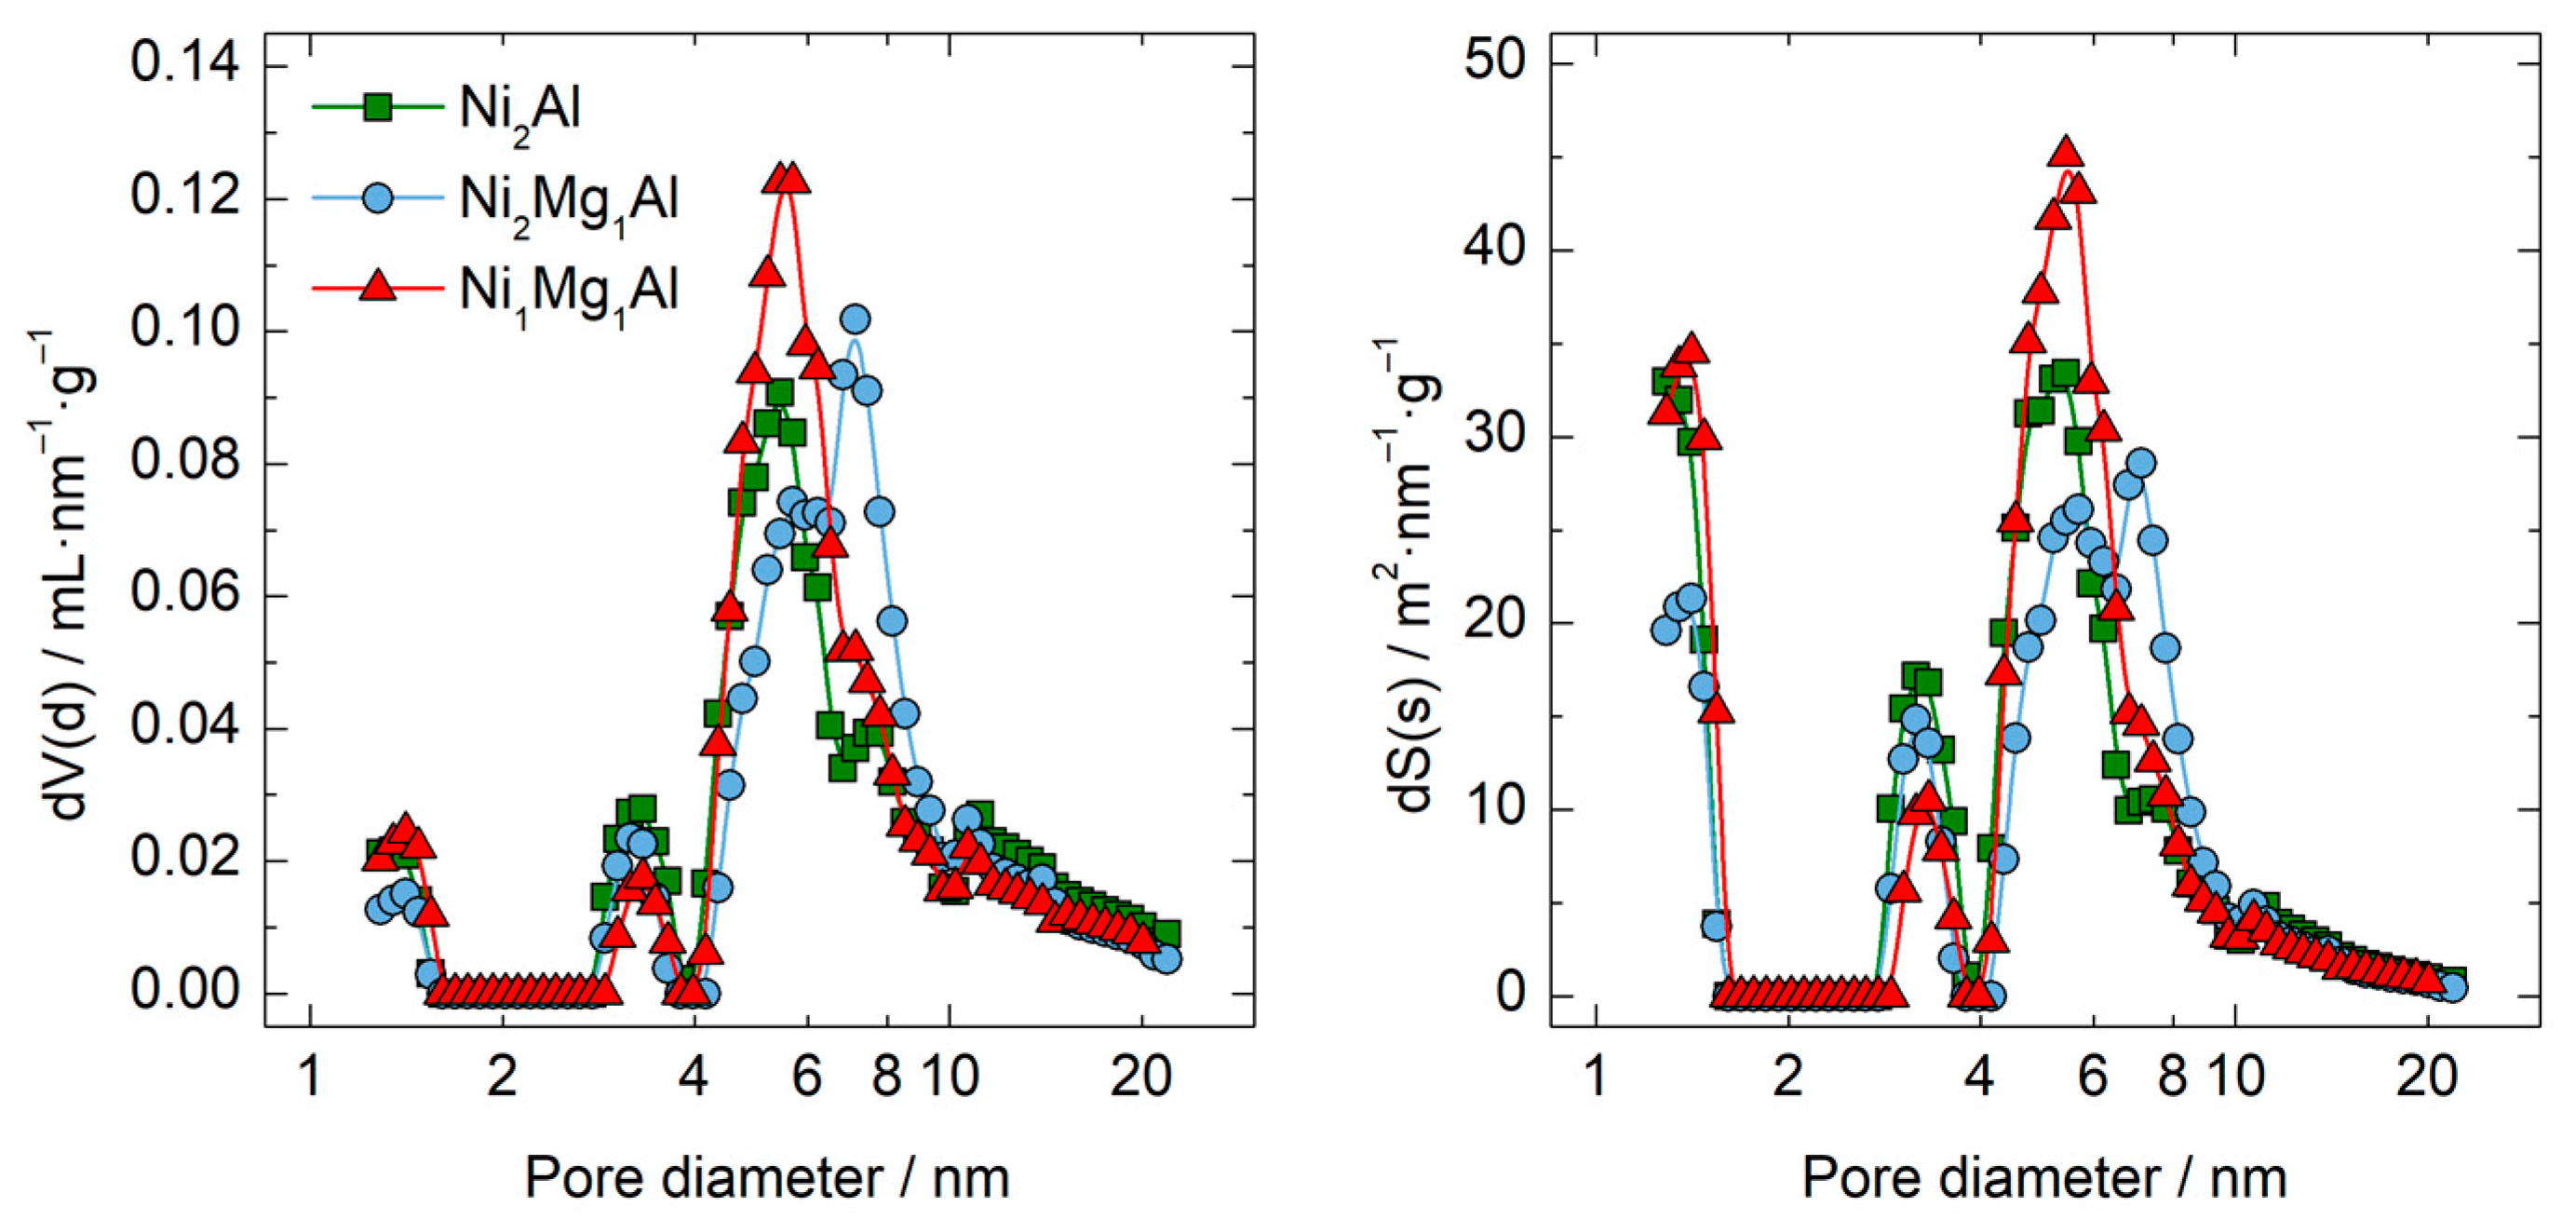
The N2 physisorption isotherms of the calcined LDH precursors (Figure 1) were characteristic of mesoporous materials with type II isotherms and H3 hysteresis loops according to the IUPAC classification [38,39]. The textural properties and the surface composition changed with the (Ni + Mg)/Al atomic ratio of the precursor double-layered hydroxides. The BET surface area (Table 2) of Ni2Al and Ni1Mg1Al were similar, ca. 210 m2·g−1, and it was 200 m2·g−1 for Ni2Mg1Al. The pore size and surface distributions (Figure 2) and the specific volume and average pore diameter calculated with the DFT model followed a similar trend. The average pore volume and surface area were ca. 0.49 mL·g−1 and 5.4 nm for both Ni2Al and Ni1Mg1Al, and the distributions were similar. Ni2Mg1Al had the same pore volume but a larger average pore size (7.1 nm) resulting from the presence of a maximum in both distributions at ca. 7 nm.
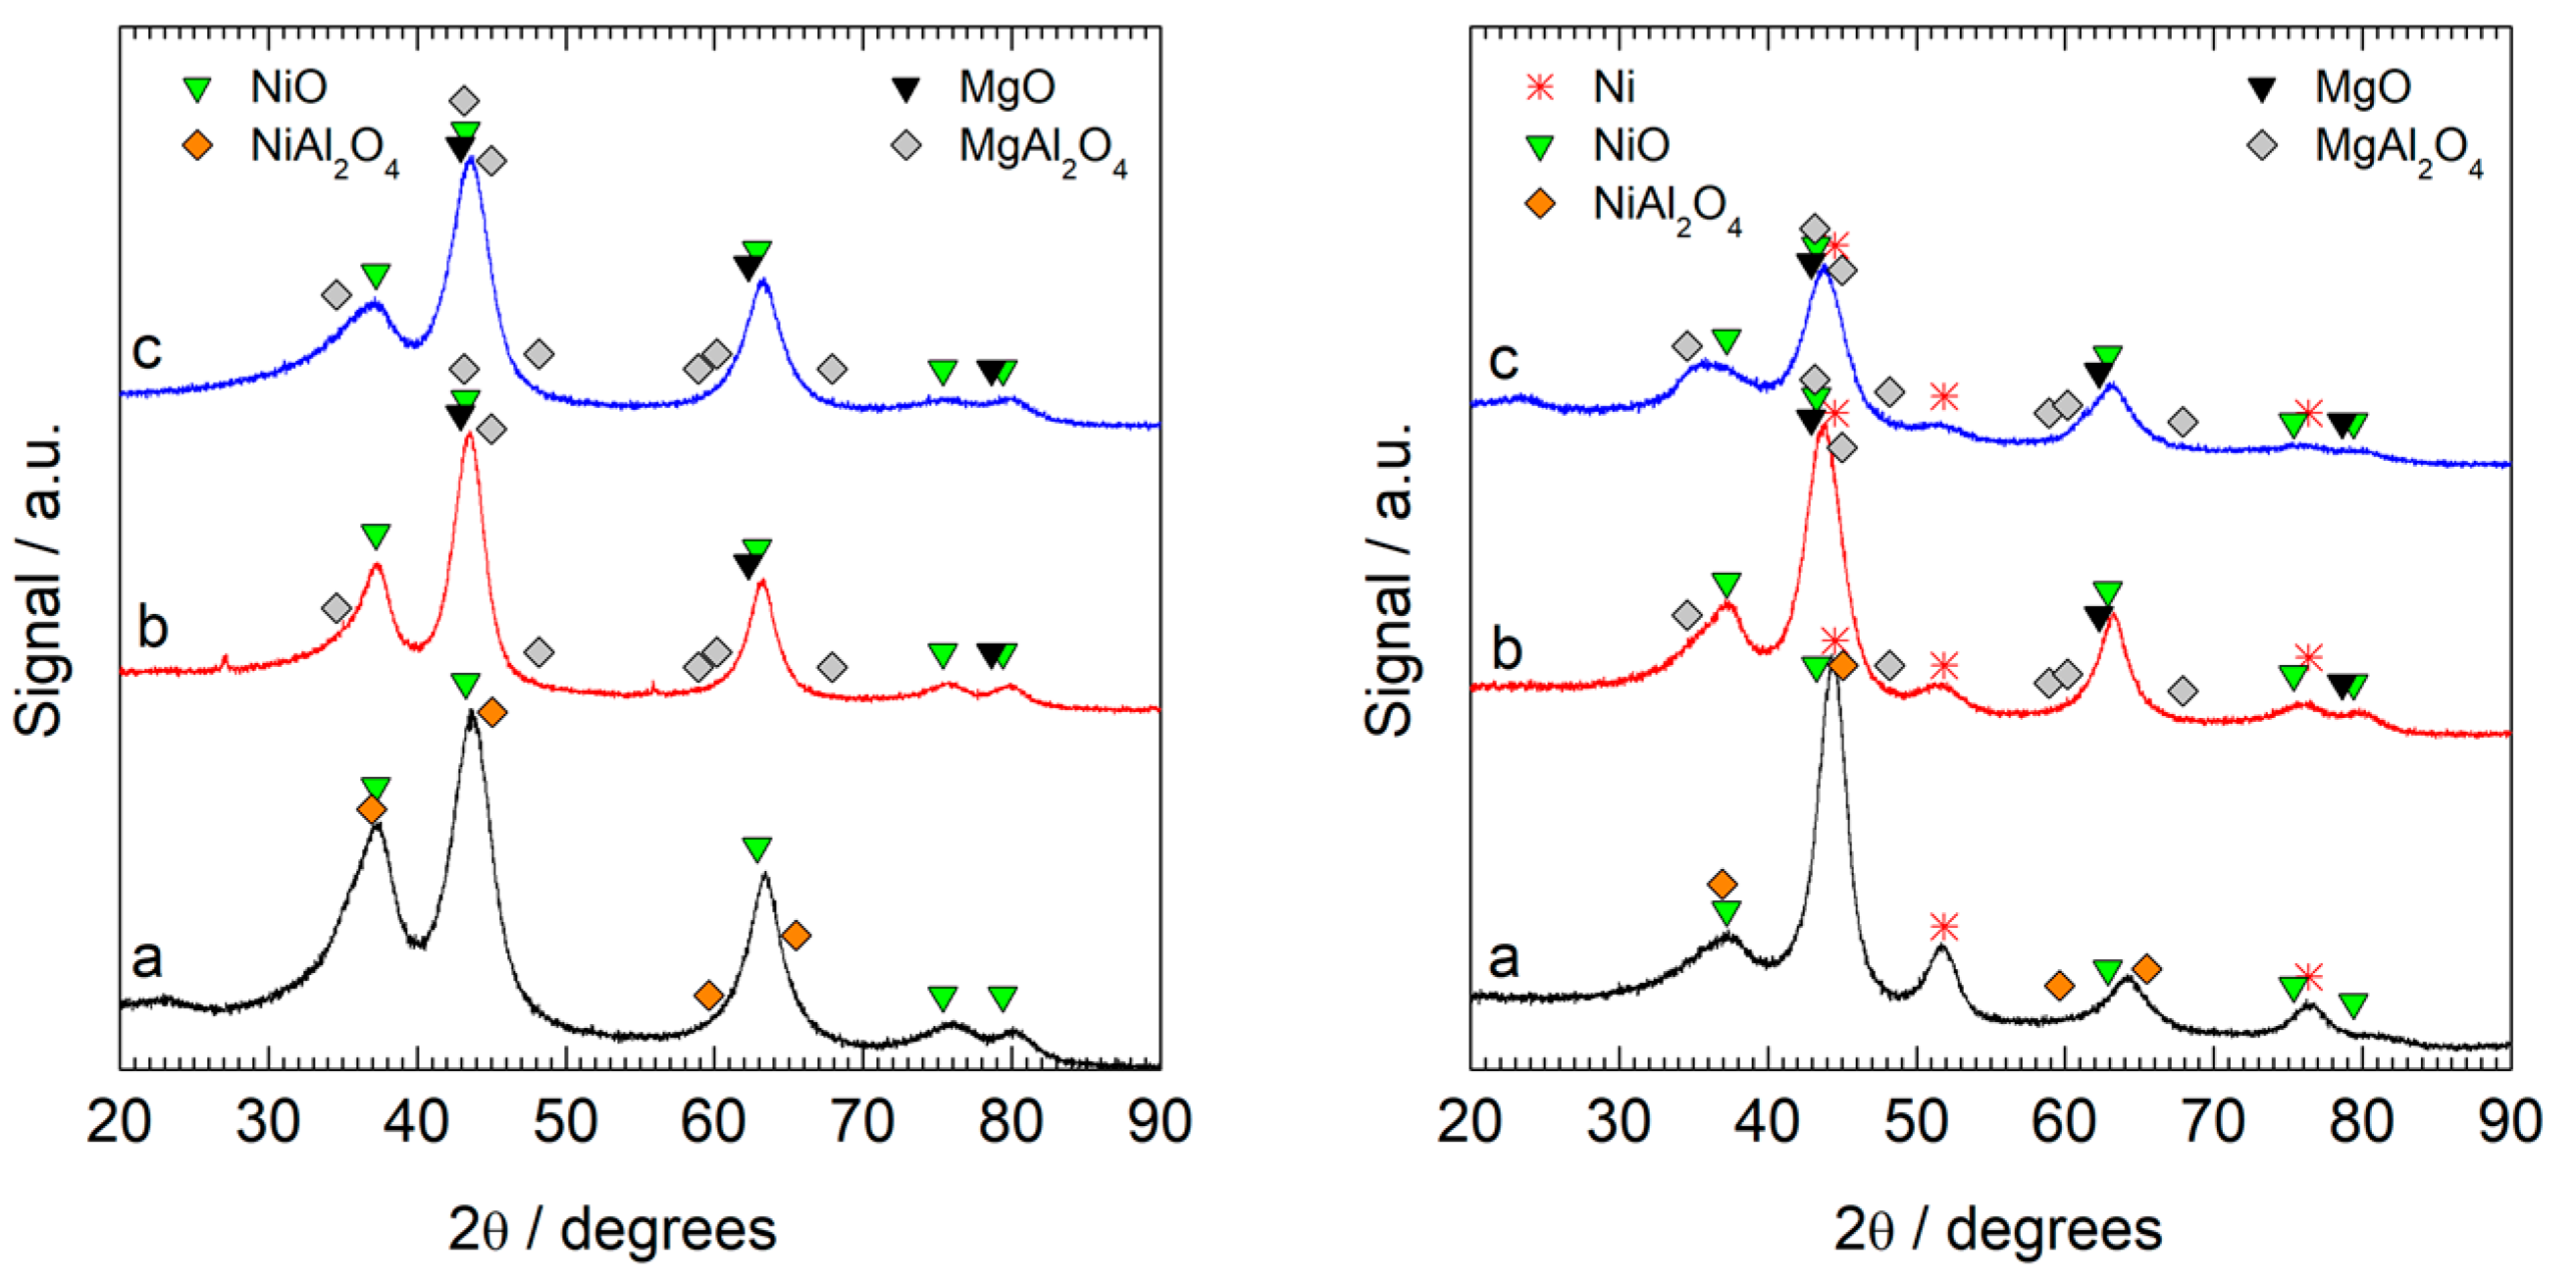
The XRD diffraction patterns of the calcined precursors (Figure 3) had wide overlapping peaks characteristic of structures with small crystallites, which complicated the elucidation of the phases present in the materials. The Rietveld analysis revealed the coexistence of a spinel-type structure (A) [B]2O4 (Fd3m) with the tetrahedral position (A) and the octahedral [B] position occupied by Ni or Mg and Al, NiO in Ni2Al, and NixMg(1−x)O mixed oxides in the materials containing magnesium. To determine the composition of the spinel, the distribution of cations was adjusted manually to fulfill these rules: (i) minimum difference between the elemental composition of the sample measured by SEM and that calculated from the Rietveld analysis; (ii) minimum electrical charge of the spinel structure calculated with the Bond valence theory [40]; (iii) minimum conventional Rietveld agreement factor (Rwp); and (iv) complete occupation of the tetrahedral position (A) and the octahedral position [B] by the cations. The NixMg(1−x)O structure was estimated from its refined cell parameter (Vegard’s law) [41]. Calcined Ni2Al consisted of 54. wt.% NiO and 46 wt.% spinel (Table 3). In Ni2Mg1Al, the phases were 58 wt.% mixed nickel-magnesium oxide (Ni0.49Mg0.51O) and 42 wt.% a Mg0.7Ni0.3[Al]2O4 spinel. Similarly, Ni1Mg1Al contained 54 wt.% Ni0.31Mg0.69O and 46 wt.% Mg0.5Ni0.5[Al]2O4. After reduction at 500 °C for 1 h (Figure 3), in Ni2Al-R the amount of spinel and NiO decreased, the spinel was enriched in aluminum, and a 30 wt.% metallic nickel (Fd3m) having an average crystallite size of 3.4 nm was formed (Table 3). A 12 wt.% metallic nickel with an average crystallite size of 2.8 nm was formed in Ni2Mg1Al-R, and the amounts of spinel and mixed oxides decreased to 40 wt.% and 48 wt.%, respectively. Likewise, in Ni1Mg1Al-R, a 6.2 wt.% nickel was formed, with the corresponding decrease on the amounts of spinel and mixed oxides. Overall, the addition of Mg seemed to decrease the reducibility of nickel.
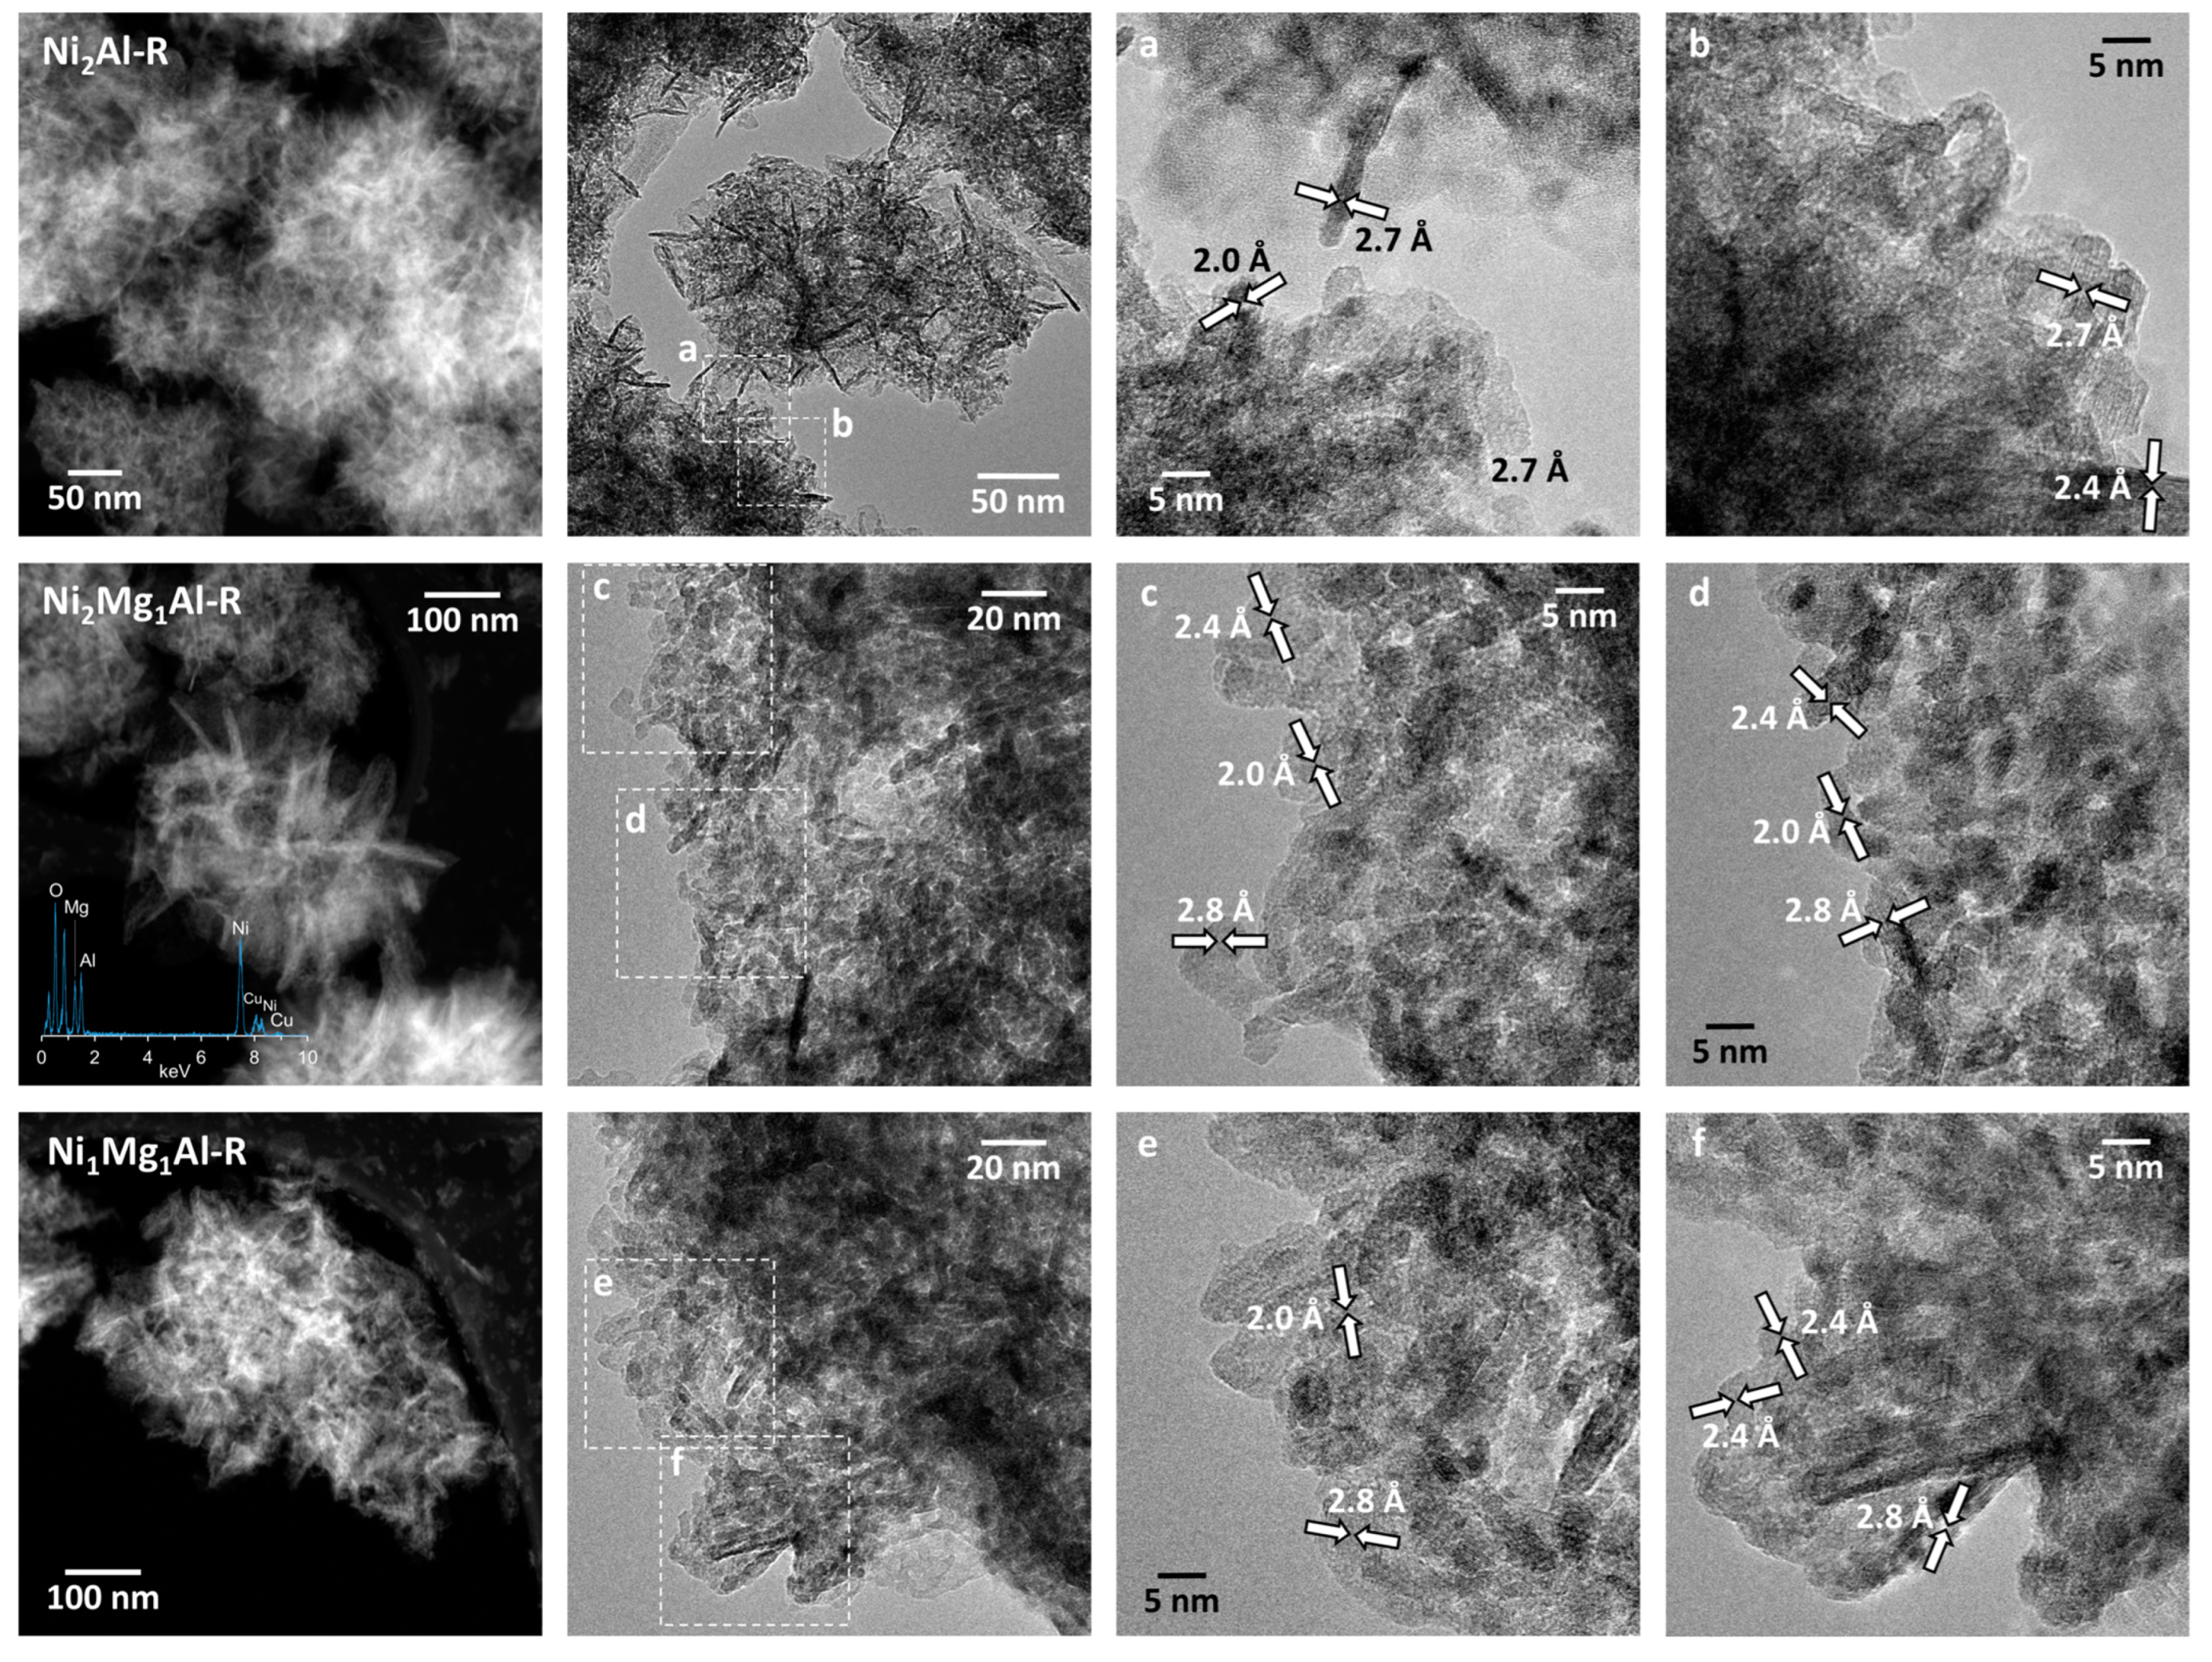
The structure of the reduced materials was investigated further by TEM (Figure 4). The HAADF-STEM image of sample Ni2Al-R showed a mixture of well-defined elongated structures and small nanoparticles. These nanoparticles appeared brighter in the image and likely corresponded to metallic nickel. The structures were well appreciated in the bright-field TEM image. HRTEM of insert “a” shows lattice fringes at 2.7 and 2.0 Å. Lattice fringes at 2.7 Å were ascribed to the (220) crystallographic plane of nickel aluminate and those at 2.0 Å corresponded well to the (111) crystallographic plane of metallic nickel. The HRTEM image from insert “b” showed lattice fringes at 2.7 and 2.4 Å, which were ascribed to the (220) and (111) crystallographic planes of nickel aluminate and nickel oxide (NiO). Therefore, the sample was constituted by Ni aluminate particles with elongated morphology of about 5–10 nm in size and round-shaped Ni and NiO nanoparticles with mean particle sizes of ca. 3–4 and 4–6 nm, respectively. The HAADF-STEM image of sample Ni2Mg1Al-R showed a poorly defined elongated morphology. The general EDX spectrum showed signals corresponding to Ni, Mg, Al, and O, while the Cu signal was caused by the sample grid. The bright-field TEM image revealed that the elongated structures were, in fact, constituted by very small nanoparticles, ranging in size from 3 to 8 nm. The enclosed areas “c” and “d” are shown in HRTEM mode where lattice fringes at 2.8, 2.4, and 2.0 Å are observed. These were ascribed to the (220) planes of the Mg aluminate spinel, to the (111) planes of NiO, and to the (111) planes of metallic Ni, respectively. The HAADF-STEM image of sample Ni1Mg1Al-R showed elongated nanoparticles that could be better distinguished with respect to the Ni2Mg1Al-R sample. Nevertheless, they were constituted by small nanoparticles as well, as shown in the bright-field TEM image, but the size of the nanoparticles was larger (ca. 5–15 nm). The areas enclosed in inserts “e” and “f” are shown in HRTEM mode. Insert “e” had lattice fringes at 2.8 and 2.0 Å that were ascribed to the (220) planes of Mg aluminate spinel and to the (111) planes of metallic Ni, respectively. In insert “f”, lattice fringes at 2.8 and 2.4 Å ascribed to the (220) planes of Mg aluminate spinel and to the (111) planes of NiO were seen. No other phases were identified.
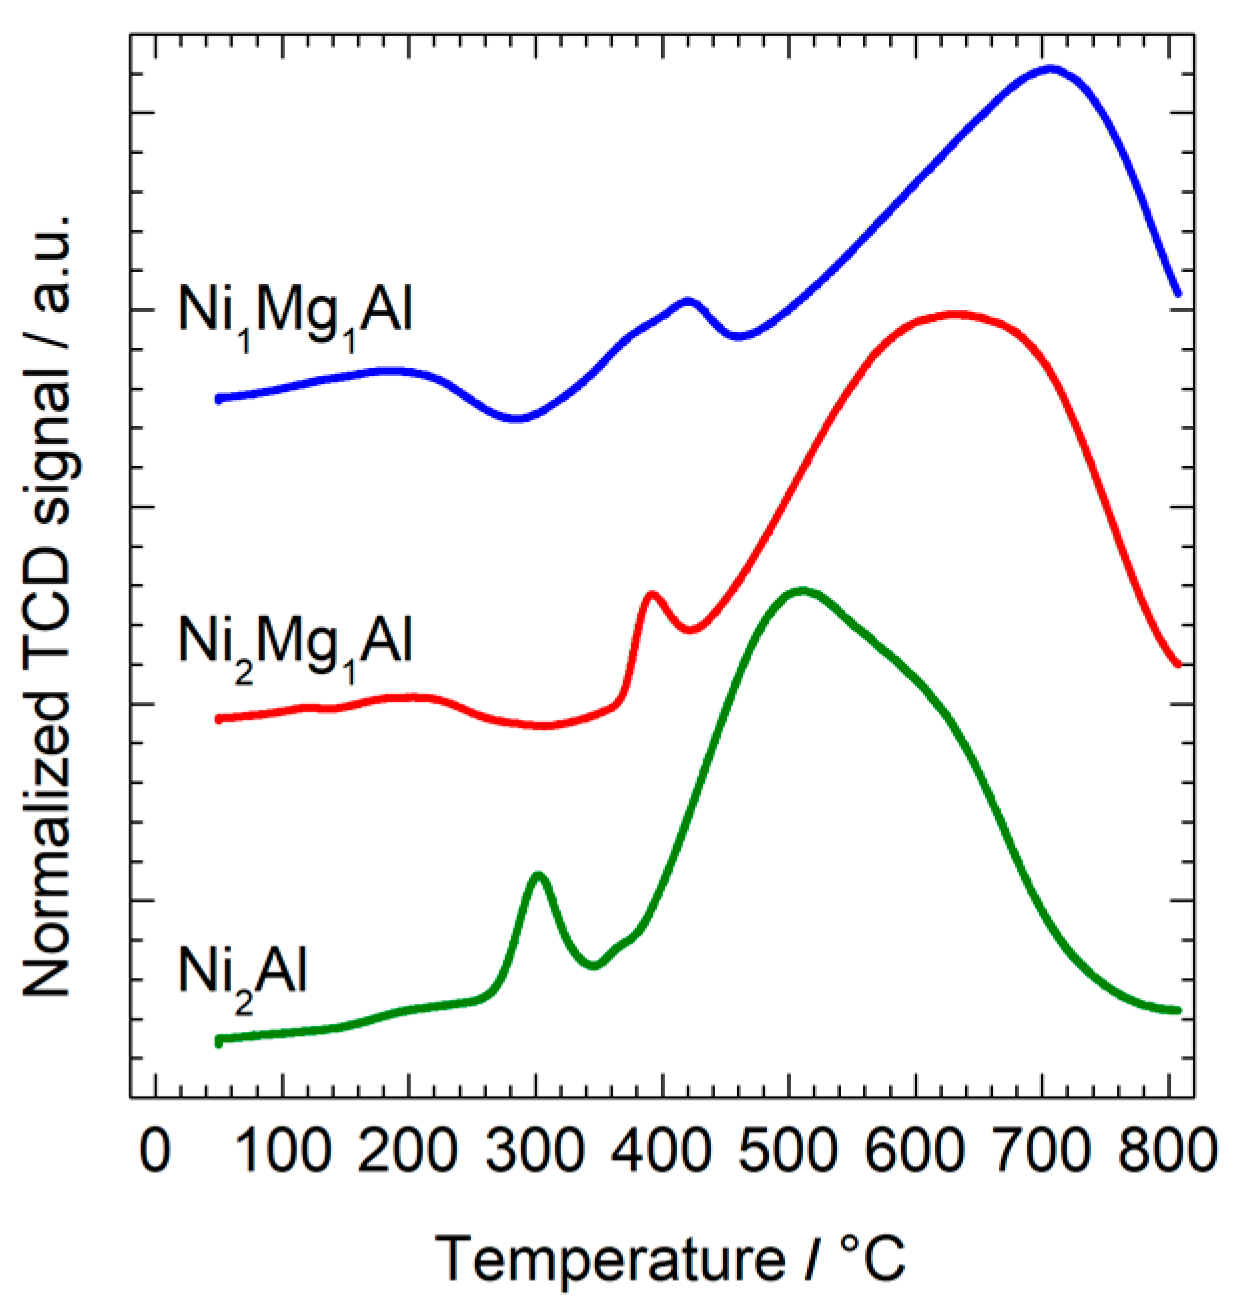
The reducibility of the calcined materials was studied by H2-TPR between 100 and 800 °C under 10% hydrogen in argon (Figure 5). The three materials presented two peaks above 200 °C, which shifted to higher temperatures with the magnesium content (Table 4). In Ni2Al, the low temperature peak at 302 °C was attributed to the reduction of small fraction of NiO that had little interaction with the aluminates, while the largest and broader peak at 513 °C comprised the transformation of the spinel and the partial reduction of NiO to metallic nickel [42,43,44]. Ni2Mg1Al and specially Ni1Mg1Al were less reducible than Ni2Al. The high temperature peak was very broad and it was attributed to the transformation of multiple structures of nickel with magnesium and aluminum [45]. The peak maxima shifted to higher temperature, and the hydrogen consumption decreased with the amount of magnesium, which was consistent with the formation of the unreducible Mg[Al]2O4 spinel and mixed NixMg(1−x)O oxides with high interaction with the spinel, and a lower formation of reduced nickel, as inferred from XRD.
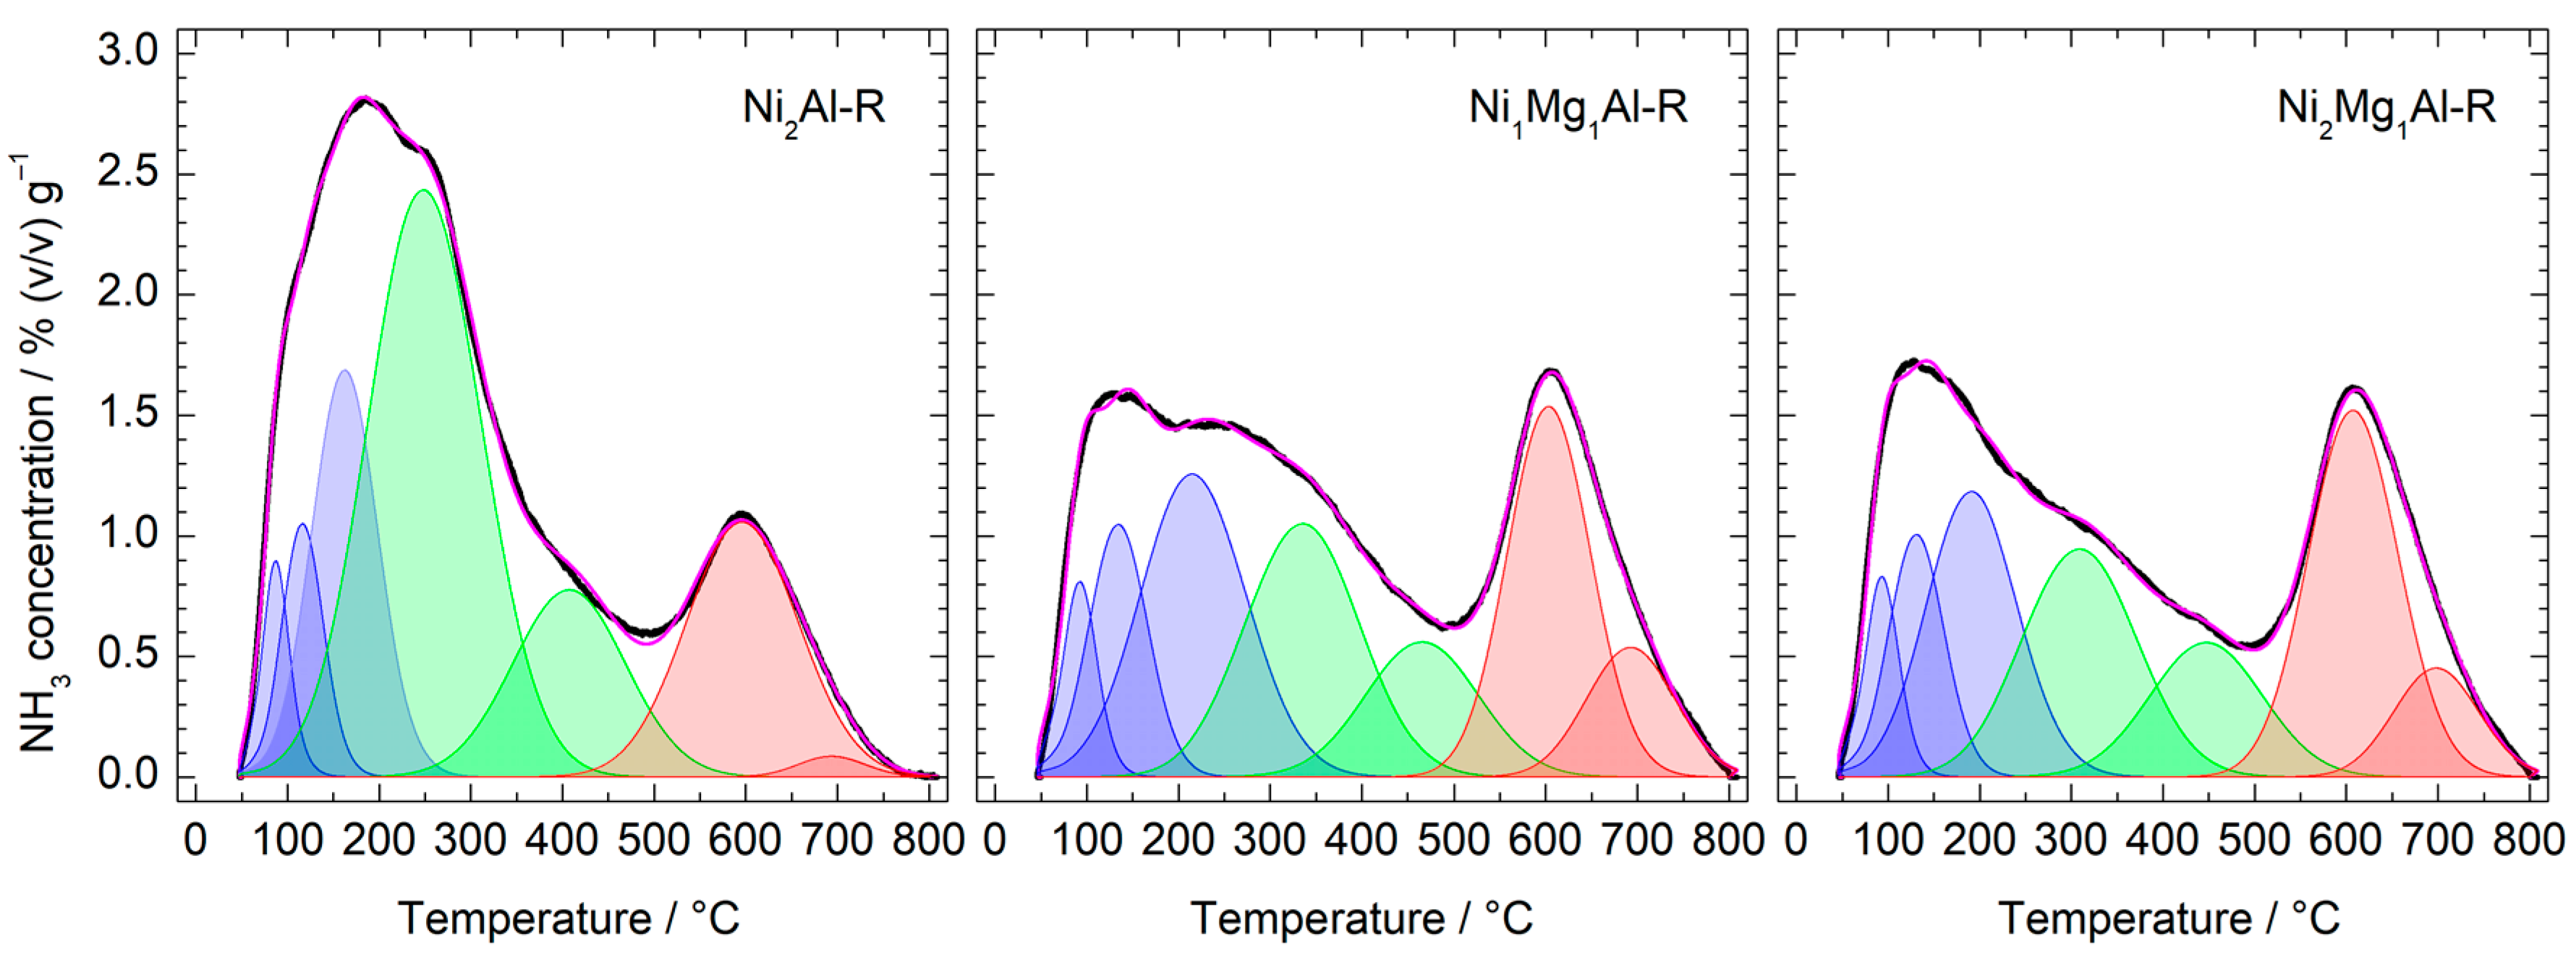
The acidity of the reduced catalysts was determined by NH3-TPD (Figure 6). The desorption peaks of all the materials had broad temperature ranges, implying wide distributions in the strength of the acidic sites. Multiple overlapped peaks were apparent in Ni2Al-R below 350 °C resulting from the desorption of ammonia from weak and moderate strength sites, together with a peak of strong acidic sites at ca. 600 °C. The presence of Mg in Ni2Mg1Al-R and Ni1Mg1Al-R made the peak below 500 °C less intense than that of Ni2Al-R, thus showing that the addition of Mg reduced the amount of weak and middle-strength acid sites. On the contrary, the high temperature peak gained in intensity, which was caused by the enhancing of the dispersion of the Ni sites responsible for acidity.
Deconvolution of the TCD signal was used to quantify the amounts of weak (α, Td < 220 °C) and intermediate (β, 220 °C < Td < 500 °C) sites (Table 5). The number of α sites increased slightly with the content of magnesium, from 0.34 mmol NH3·g−1 in Ni2Al-R to ca. 0.41 mmol NH3·g−1 in Ni1Mg1Al-R. The amount of β sites diminished with the content of Mg, from 0.66 to 0.31 mmol NH3·g−1 in Ni2Al-R and Ni2Mg1Al-R, respectively. Strong acidic sites (γ, Td > 500°C) could not be quantified reliably with the TCD detector because the ammonia adsorbed on those sites was oxidized to N2O at high temperature at the expense of the surface oxygen of the sample [46], and they were not included in the quantitative results. However, magnesium promoted the peaks at 600 and 700 °C. Magnesium decreased the total acidity from 1.00 mmol NH3·g−1 in Ni2Al-R to 0.74 mmol NH3·g−1 in Ni1Mg1Al-R and 0.67 mmol NH3·g−1 in Ni2Mg1Al-R. Due to the similar surface areas of the three catalysts, the surface density of acidic sites followed the same trend (Table 5).
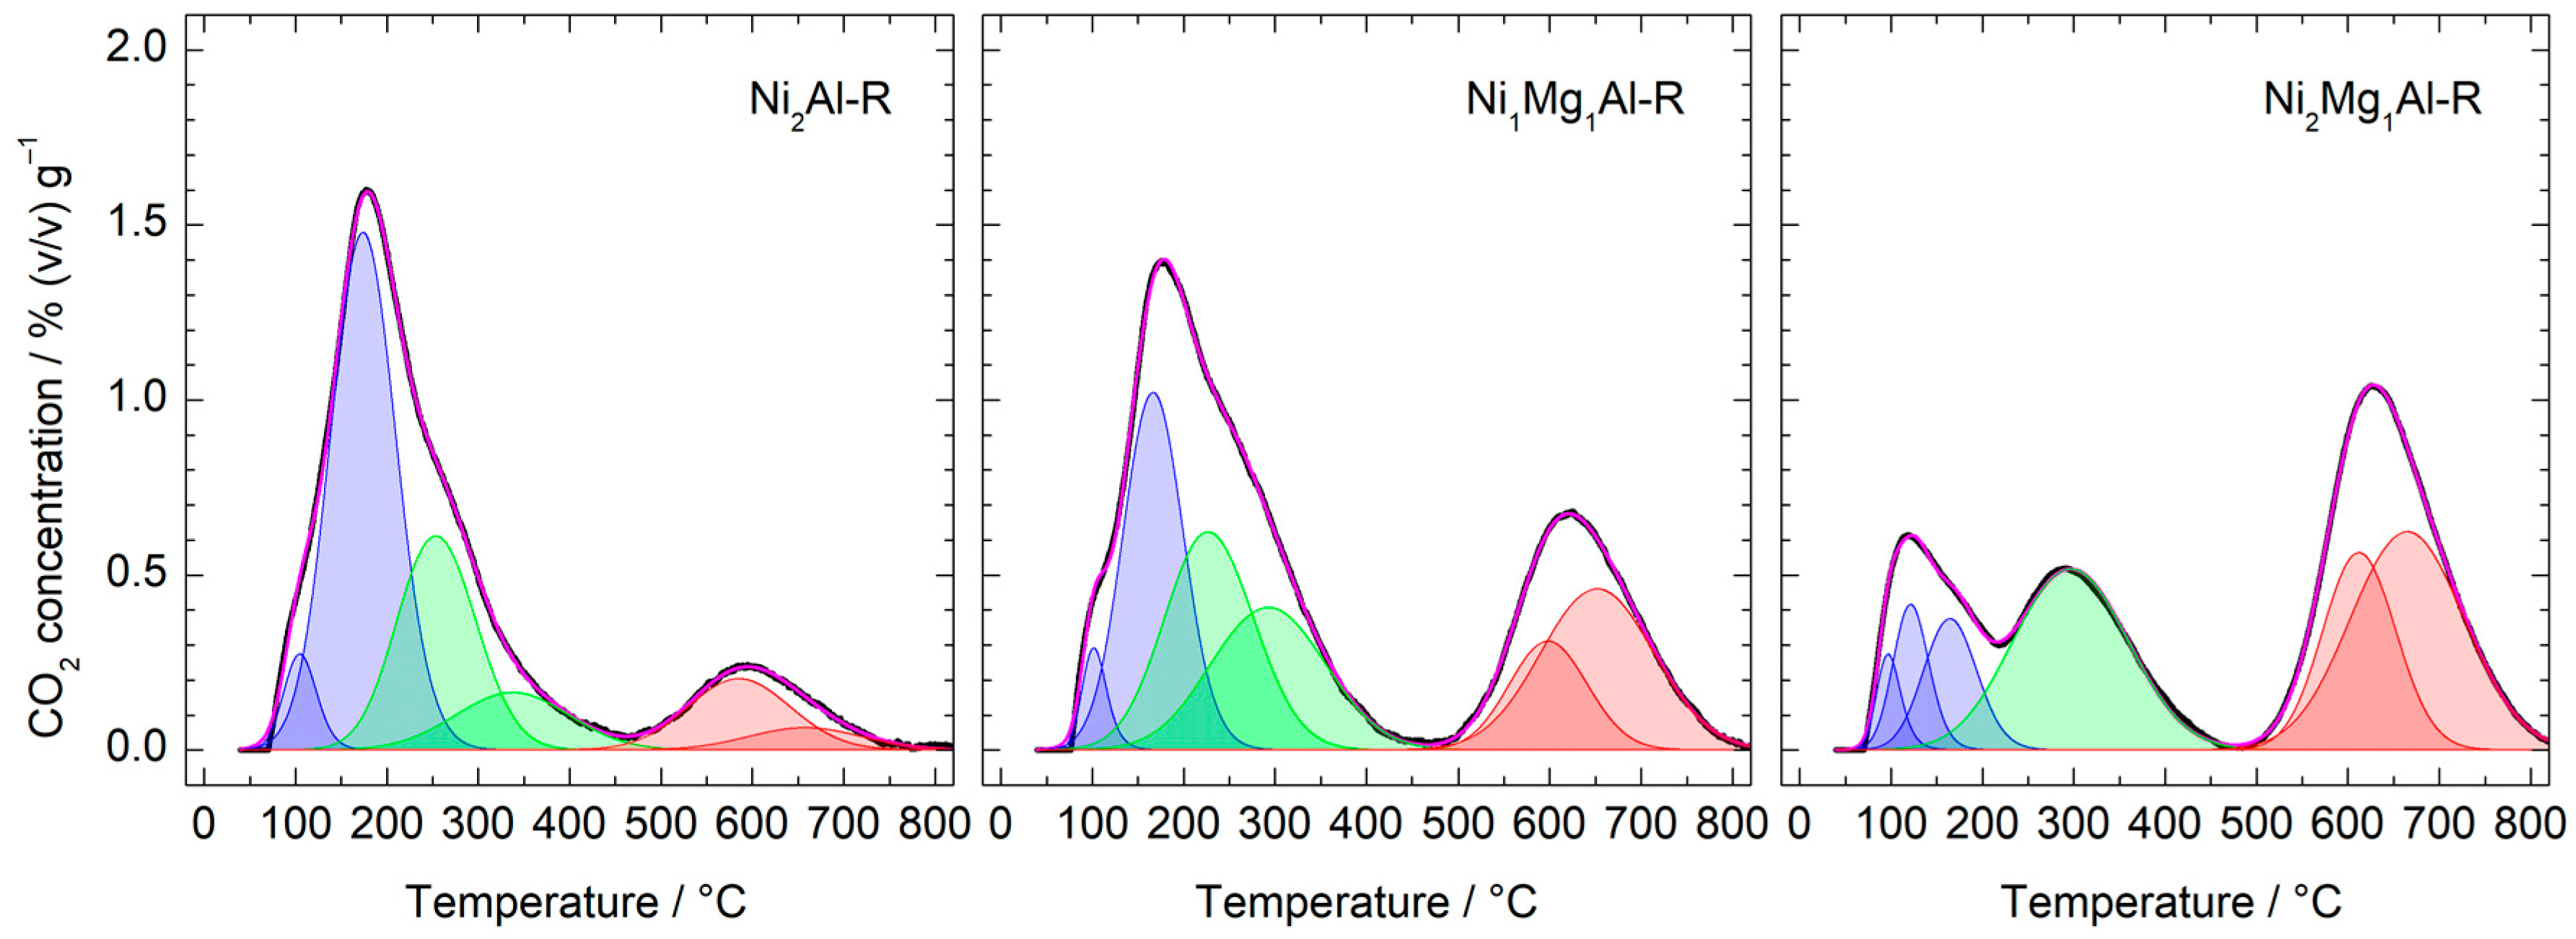
The basicity of the reduced catalysts was measured by CO2-TPD (Figure 7) and the content of basic sites calculated by deconvolution of the TCD signal (Table 6). Ni2Al-R had the higher concentration of weak sites (Td < 200 °C) and very few strong sites (Td > 500 °C). Addition of magnesium in Ni1Mg1Al-R promoted medium and strong basic sites and decreased the weak. The total content of basic sites in Ni2Mg1Al-R was lower, and it had very few weak sites but the highest content of strong sites. The large difference in the content of low and medium-low basic sites of this catalyst can be explained by the differences derived from the higher M+2/M+3 ratio used to synthesize the LDH precursor.

3.2. Catalytic Activity Tests

The influence of the process conditions on the conversion of furfural and the selectivity to its main hydrogenation products were studied in detail with the Ni2Mg1Al-R catalyst. Experiments were performed in a stirred slurry reactor (SSR) considering temperature (160 °C, 190 °C, and 210 °C), time (1, 2, 4, 6, and 8 h), and hydrogen pressure (1.0, 2.0, 3.0, 4.0, and 5.0 MPa). In all the experiments, 30 mL of a 5.0 wt% FF solution in ethanol and 200 mg of reduced catalyst were used.
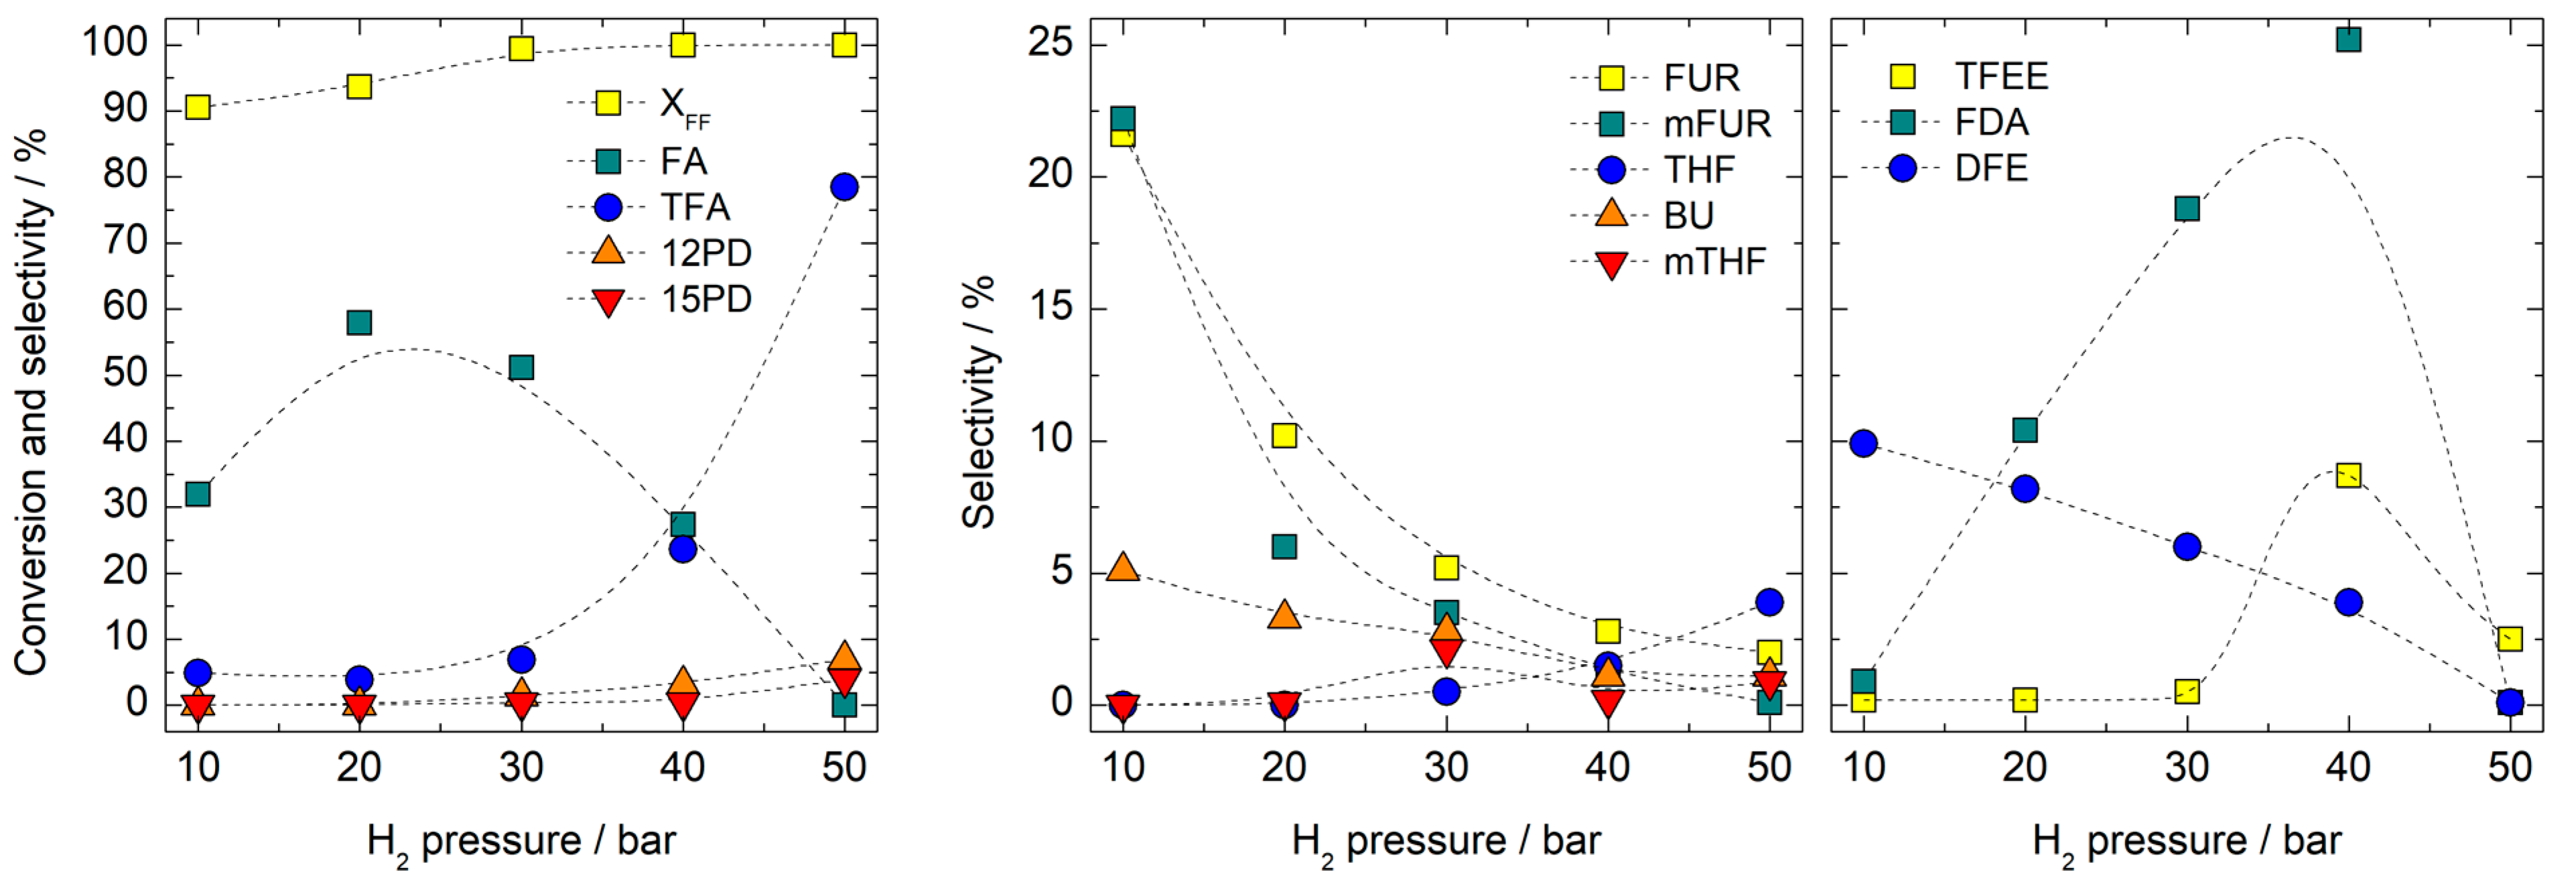
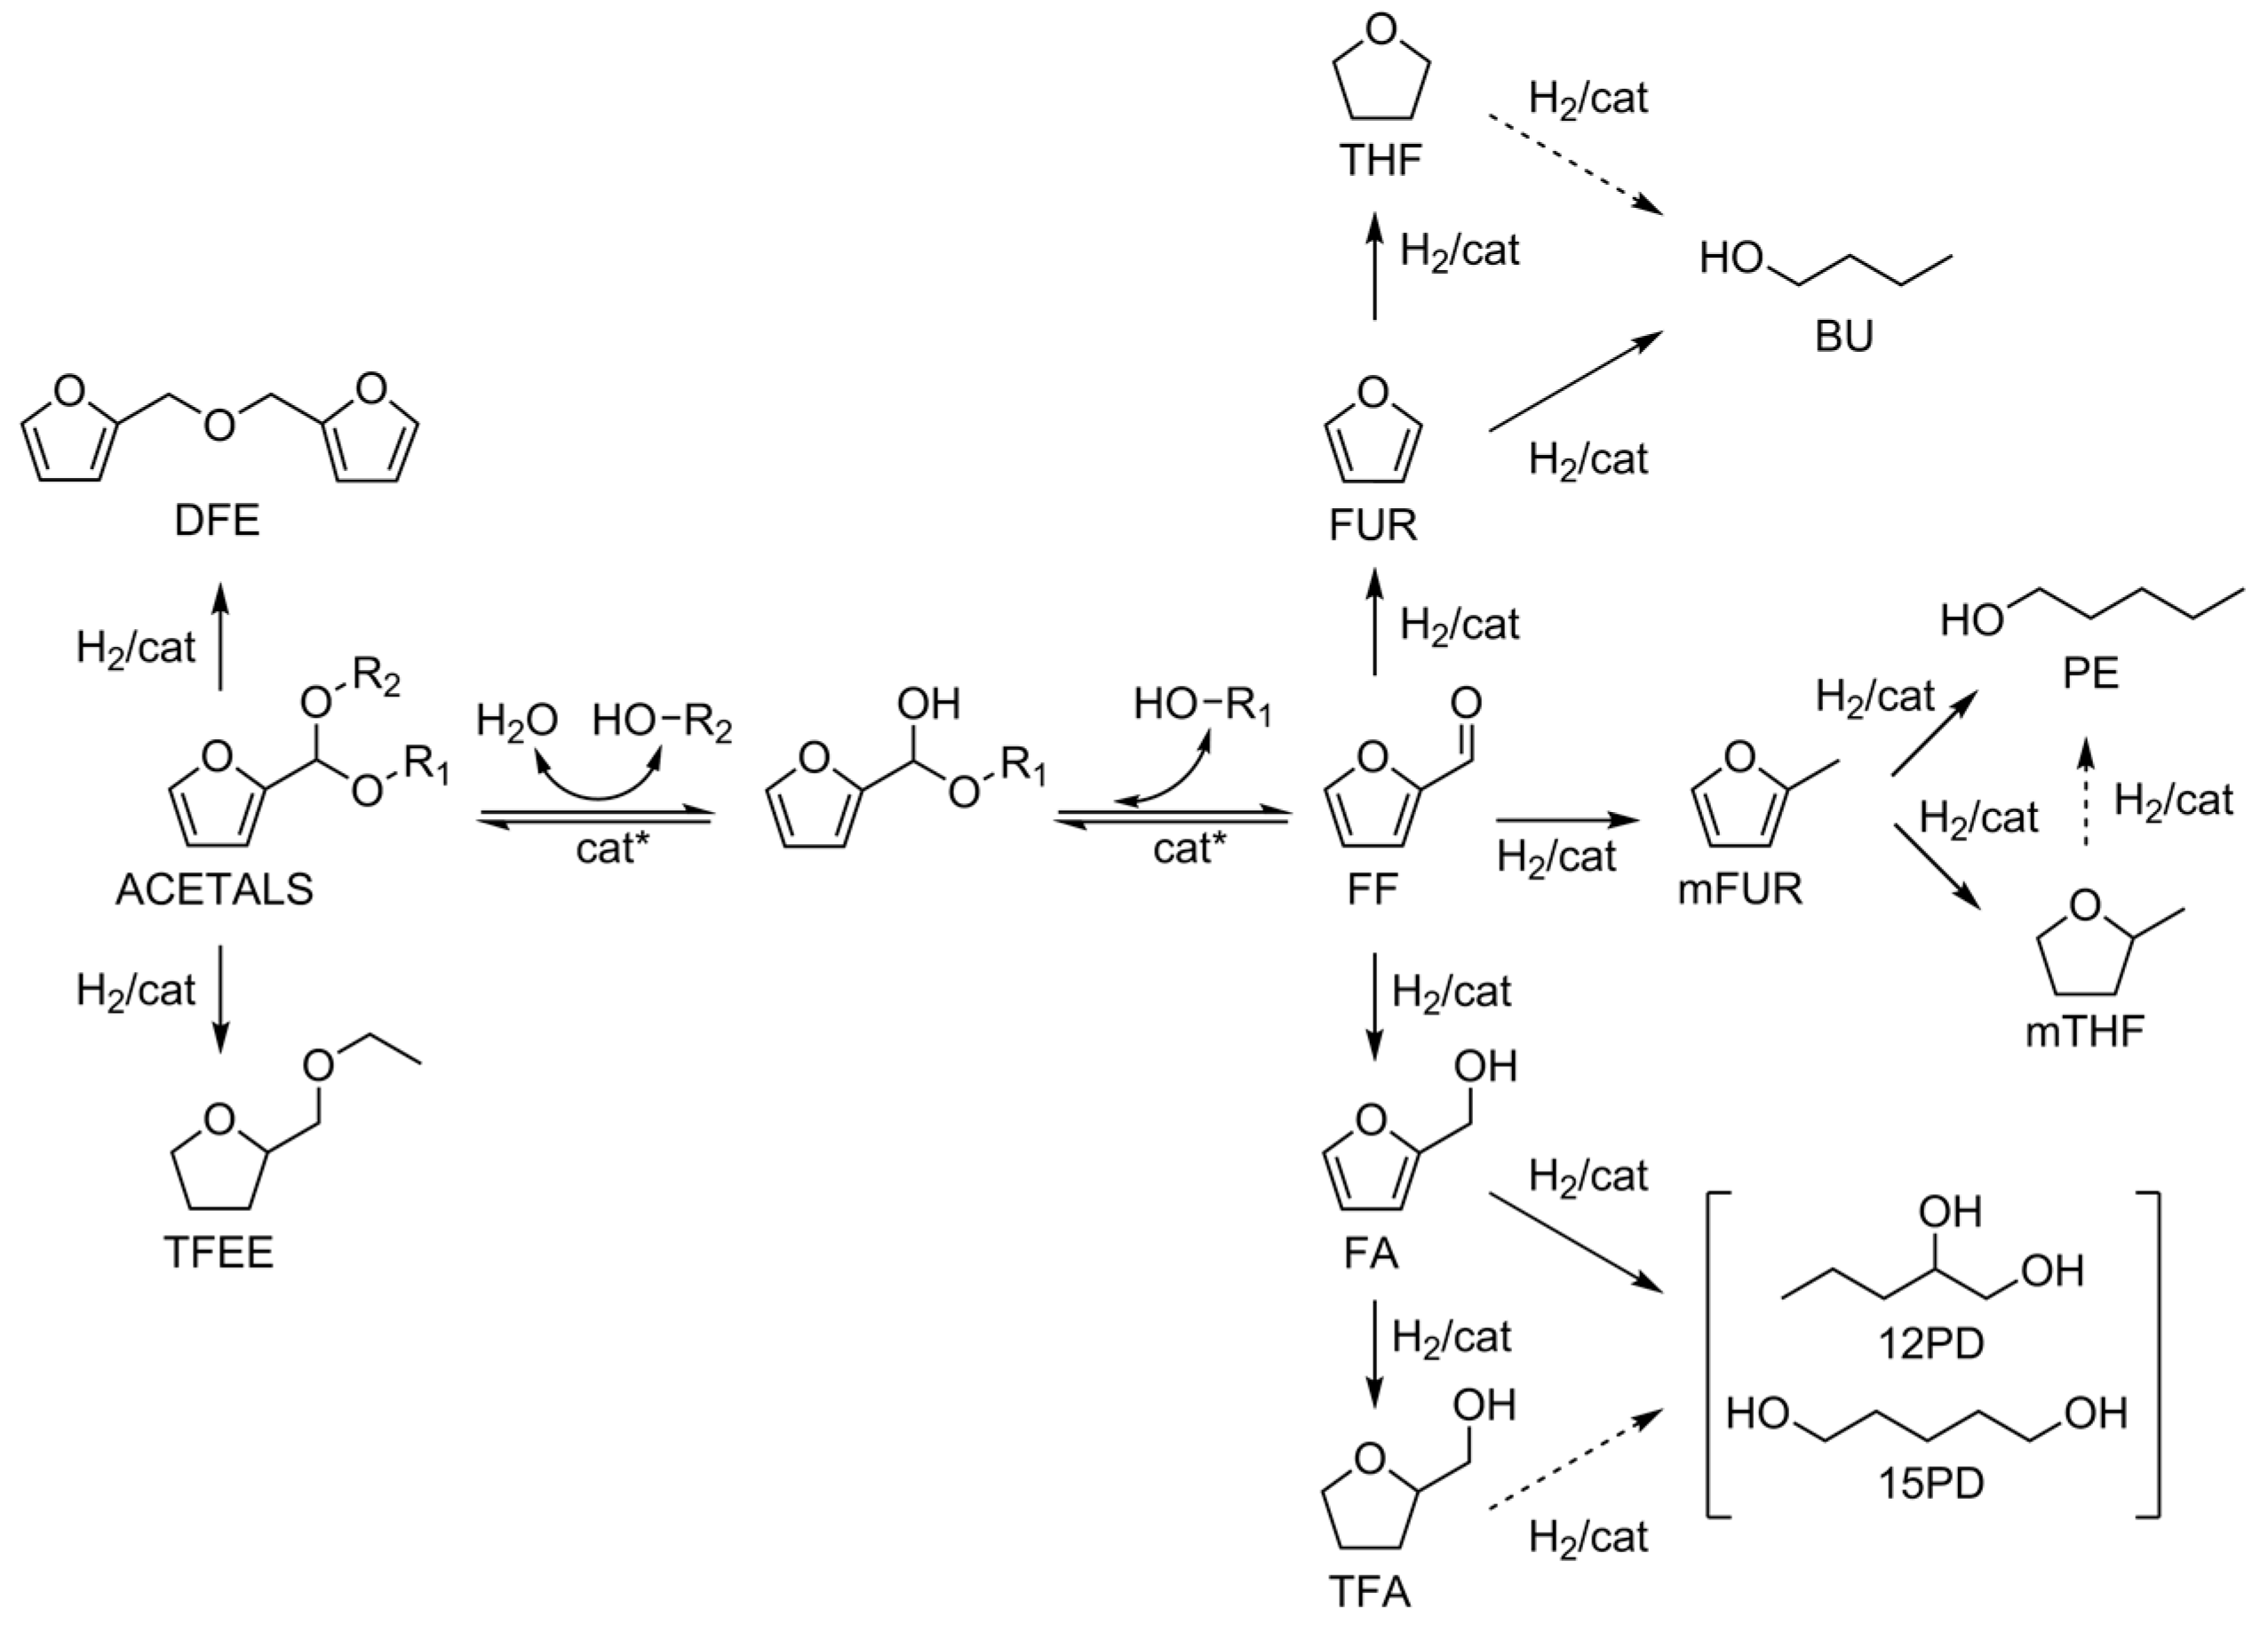
The effect of hydrogen pressure was studied at 190 °C and 4 h. Furfural conversion was 90.6% at 10 bar, 99.4% at 30 bar, and complete above that (Figure 8). A variety of products with selectivity that changed with hydrogen pressure were identified. At 10 bar, furfural was hydrogenated to furfuryl alcohol (FA, 32%) as the main product and 2-methylfuran (mFUR, 21.6%), but it was also decarbonylated to furane (FUR, 22%). Minor hydrogenation products included tetrahydrofurfuryl alcohol (TFA, 4.9%) from the hydrogenation of FA and n-butanol (BU, 5.1%) from the ring-opening hydrogenolysis of FUR. In addition, difurfuryl ether (DFE, 9.9%) and 2-(diethoxymethyl)furan (FDA, 0.9%) were obtained. Both evolved through the formation of acetals on the acidic sites of the catalyst surface by reversible nucleophilic addition of FF with FA or ethanol (Scheme 1), a reaction path that has been previously observed on different catalysts. The formation of FDA from FF and ethanol was reported under mild hydrogenation conditions on Pd/UiO-66 [9] and on a Pd/C catalyst, where it was identified as the key intermediate in the production of tetrahydrofurfuryl ethyl ether (TFEE) [47]. Similarly, 2-(diisopropoxymethyl)furan resulting from acetylation of FF with isopropanol was reported on NiO [48], NiO-Al2O3, and ZnAl2O4-Al2O3 [49] and on Pd-exchanged β-zeolites [50] during the catalytic transfer hydrogenation of FF with 2-propanol. During FF hydrogenation under mild conditions over Pd/HPA, 2-(isopropoxymethyl)furan was formed as an intermediate compound in weak acidic sites that was then converted to TFA on basic sites [8].
Increasing the hydrogen pressure in Ni2Mg1Al-R promoted the formation of FA and lowered the selectivity to FUR and mFUR. FA selectivity was maximum at 20 bar (58%) but decreased at higher pressure, and it was not detected significantly at 50 bar. Pressure favored the hydrogenation of FA to tetrahydrofurfuryl alcohol (TFA), which reached a selectivity of 78.5% at 50 bar. In addition, pressure shifted the selectivity of the addition reactions to the formation of FDA instead of DFE. FDA was subsequently hydrogenated to TFEE (Scheme 1). The selectivity to 1,2- and 1,5-pentanediol (12PD and 15PD) formed by the hydrogenolysis of FA and TF grew continuously with the hydrogen pressure and reached 7.0 and 4.5 at 50 bar, respectively. Concerning FUR and mFUR, hydrogen pressure promoted their hydrogenation to tetrahydrofuran (THF) and 2-methyltetrahydrofuran (mTHF). The hydrogenation of FUR to THF was promoted over its hydrogenolysis to BU as hydrogen pressure was increased. Overall, a pressure of 50 bar was the most adequate to favor the selectivity to TFA and to lower the formation of byproducts such as DFE, TFEE, and FDA, and it was selected to study the effect of the other variables.
The effect of reaction time was investigated with the Ni2Mg1Al-R catalyst at 190 °C and 50 bar of hydrogen for up to 8 h (Figure 9). FF conversion was 93.4% after 1 h, and the main products were FA (50%) and TFA (36%), together with FUR (4.7%), 12PD (3.2%) and minor amounts of the other products. FF conversion was complete after 2 h. After 4 h, FA was not present, and TFA reached a selectivity of 78.5%, with 7.0% 12PD, 4.5% 15PD, and 3.9% THF. Extending the reaction time to 8 h had little impact on the composition of the product mixture. Selectivity to TFA was constant at ca. 80%, and 12PD and 15PD only increased marginally, reaching 9.0% and 4.8% after 8 h, respectively, showing that the catalyst was not significantly active for the hydrogenolysis of TFA.
The effect of temperature was tested at 160, 190 and 210 °C, with the Ni2Mg1Al-R catalyst at 50 bar and 2 h. FF conversion was 92.7% at 160 °C, and it was complete at higher temperature (Figure 10). Temperature favored the decarbonylation of FF to FUR, which grew from 1.5% at 160 °C to 7.4% at 210 °C, even if FA was always the main primary product (51.5% and 54.3% at 160 °C and 210 °C, respectively). Similarly, the selectivity to mFUR and BU also grew with temperature. It is worth mentioning that the effectivity of the catalyst to hydrogenate the double bonds (π bonds) in furan rings decreased with temperature. The selectivity to TFA was actually lower at 210 °C (26.4%) than at 190 °C (43.6%), while that of FA was higher. Additionally, the selectivity to THF and mTHF was virtually unchanged from 190 to 210 °C, even if the amount of FUR and mFUR grew. Finally, raising the temperature from 190 to 210 °C had no impact on the selectivity to 12PD and 15PD.
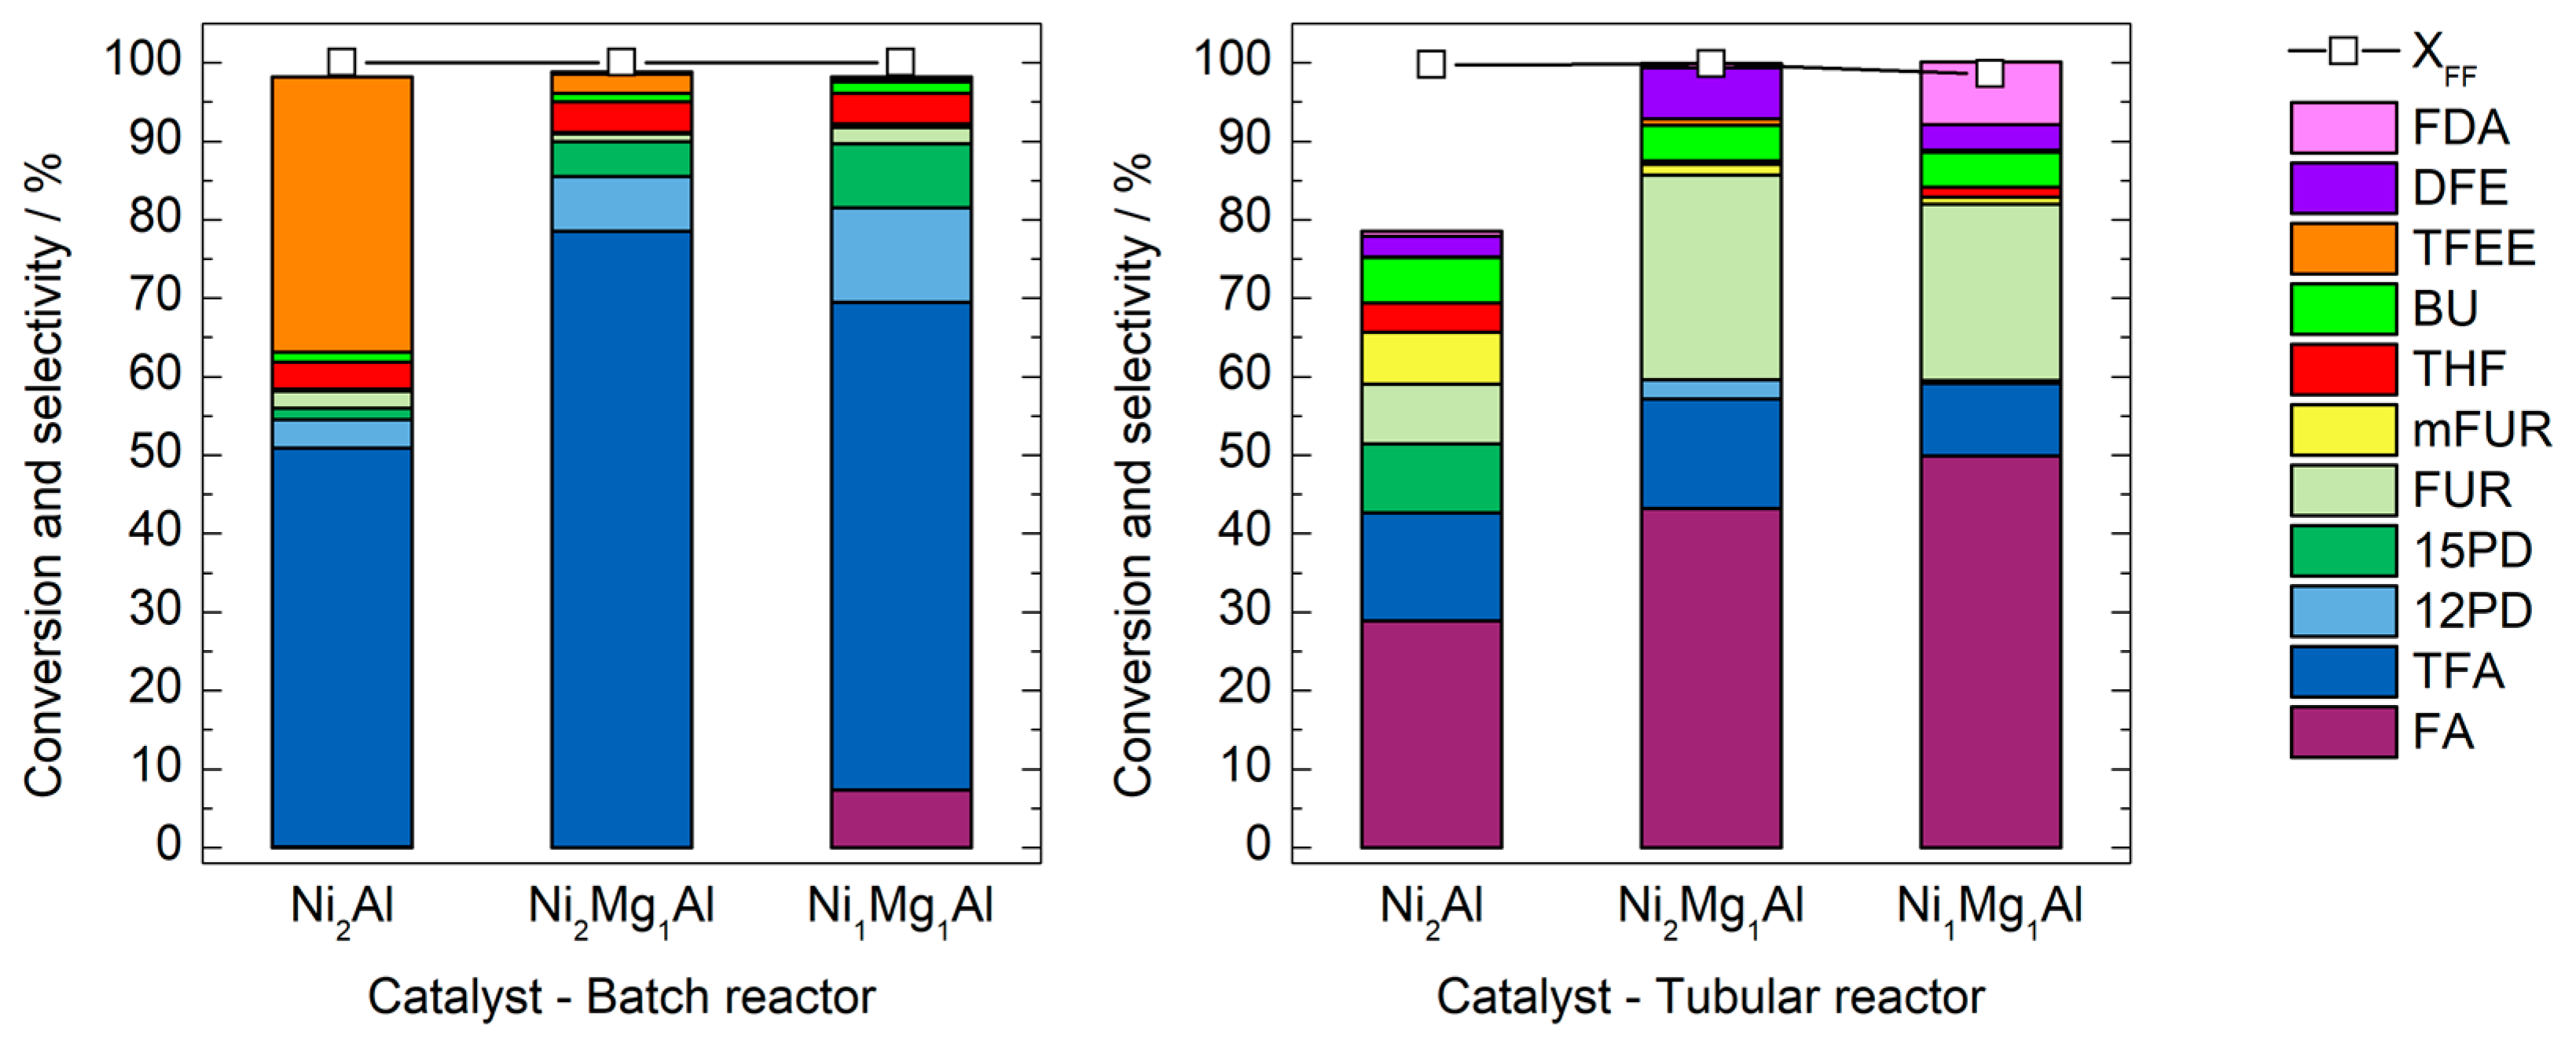
Based on the previous results, the effect of the Mg/Ni ratio in the catalyst was tested at 190 °C, 50 bar of H2, and 4 h of reaction time (Figure 11). The conversion of FF was complete in the three catalysts (Ni2Al-R, Ni2Mg1Al-R, and Ni1Mg1Al-R) and the selectivity to minor products such as FUR, mFUR, THF, mTHF, and BU was practically independent of the catalyst composition. TFA was the main product in all cases, but differences were observed on its selectivity and those of the other major products. FA was not produced in Ni2Al-R. It had the lowest selectivity to TFA (51%) and a 35% selectivity to TFEE, thus showing a high capacity to catalyze the formation of acetals through addition reactions. This is consistent with its higher content of medium strength acidic sites and lower presence of basic sites. Even if this catalyst had a 30% reduction of Ni, its furfural hydrogenation capacity was limited by the competence of the condensation reactions of furfural on the Lewis sites of the surface NiO groups. In contrast, TFEE in Ni1Mg1Al-R was only 0.4% showing that addition of Mg inhibited this reaction route by reducing the amount of acid sites with intermediate strength (Table 5) by the formation of the mixed NixMg(1−x)O oxide. However, its hydrogenation capacity was somewhat limited by the low content of reduced Ni, which was only 6.2%. That is why at the tested conditions it still gave 7.3% unconverted FA and formed less TFA (62%) than Ni2Mg1Al-R (78.5%). The latter had a similar content of Ni-Mg oxide phase and low acidity that prevented the condensation route, but it had a 12% reduction of Ni, which increased its hydrogenation capacity. However, the Ni1Mg1Al catalyst was slightly more selective to ring-opening reactions since it gave the highest formation of 12PD (12%) and 15PD (8.2%).
The three catalysts were also tested at 190 °C on a continuous packed bed reactor at atmospheric pressure. Important differences on the behavior of the catalysts were observed when the reaction was conducted in gas phase (Figure 11). Unlike the SSR, FA was always the main product in the atmospheric PBR. FF conversion was complete on Ni2Al-R and it gave a selectivity to FA and THF of 30% and 14%, respectively, accompanied by smaller amounts of 15PD, FUR, mFUR, THF, BU, and DFE. Overall, the selectivity of the products that were identified only accounted for 79% of the converted furfural. The unidentified fraction consisted of a complex mixture of species with apparent high molar masses that were observed in the gas chromatograms at high retention time but could not be identified by GC/MS. The formation of these compounds by condensation reactions involving FF and FA seems consistent with the capacity exhibited by this catalyst to promote the formation of acetals in liquid phase under high H2 pressure. In Ni2Mg1Al-R the selectivity to FA was 43%, followed in decreasing order by FUR (26%), TFA (14%), and DFE (6.5%). In fact, these values are qualitatively closer to those obtained with this catalyst in the SSR reactor at 10 bar than to those measured at 50 bar. Finally, FF conversion was only 98.6% on Ni1Mg1Al-R, although it gave more FA (50%) and less FUR and TFA than Ni2Mg1Al-R. Again, this is consistent with its lower content of reduced Ni. It is worth mentioning that pentanediols were not formed significantly with Ni2Mg1Al-R and Ni1Mg1Al-R at atmospheric pressure, in contrast with the situation in the slurry reactor at 50 bar of H2. Additionally, both catalysts produced significant amounts of condensation products at atmospheric pressure, with 6.5% DFE in Ni2Mg1Al-R and 8.0% FDA in Ni1Mg1Al-R.

4. Conclusions

Ni-Mg/Al catalysts derived from layered double hydroxides were synthesized and tested in the production of TFA from FF in liquid-phase hydrogenation. After calcination and reduction, the catalysts contained small nickel crystallites (ca < 4 nm) dispersed on a solid matrix consisting of nickel-magnesium mixed oxides and a Mg[Al]2O4 spinel. Furfural conversion took place by a competing set of reactions. A low hydrogen pressure favored FA as the main hydrogenation product together with FUR and mFUR, and also promoted addition reactions that formed acetals that eventually led to DFE and TFEE as identified final products. Higher hydrogen pressures promoted the hydrogenation of the furan rings and reduced the extension of the condensation reactions, thus favoring TFA as the main product. Temperature reduced the selectivity to TFA and increased that to FA. Pentanediols (12PD and 15PD) were formed as minor products, but their selectivity increased with the Mg/Ni ratio of the catalyst. Testing of the catalysts in gas-phase hydrogenation conditions at atmospheric pressure revealed a poorer performance with FA and FUR as the main products. Even if the Ni2Mg1Al catalysts achieved complete conversion of FF and a selectivity to TFA of 80% after 6 h at 190 °C and 50 bar H2, a large variety of coproducts were present at low concentration. Further optimization of the catalysts (Mg/Ni ratio and synthesis parameters) and reaction conditions is required to obtain a catalyst selective enough for the total hydrogenation of FF to TFA at the industrial level.

Supplementary Materials

The following supporting information can be downloaded at: www.mdpi.com/article/10.3390/chemistry5010041/s1, Figure S1: FESEM-EDX imaging of the LDH precursors calcined at 400 °C for 4 h; Figure S2: SEM imaging of the LDH precursors calcined at 400 °C for 4 h (10,000× magnification).

Author Contributions

Conceptualization, F.M. and D.M.; methodology, F.M. and A.A.; validation, A.A.; formal analysis, A.A., J.L. and D.M.; investigation, A.A. and J.L.; writing—original draft preparation, A.A., J.L. and D.M.; writing—review and editing, D.M.; visualization, D.M.; supervision, F.M.; funding acquisition, F.M. and D.M. All authors have read and agreed to the published version of the manuscript.

Funding

This research was developed within the projects PID2021-123665OB-I00 funded by MCIN/AEI/10.13039/501100011033 and FEDER Una manera de hacer Europa, TED2021-129343B-I00 funded by MCIN/AEI/10.13039/501100011033 and the European Union NextGenerationEU/PRTR, and the project 2022/31 “Producció d’hidrogen a partir de biomassa: estudi del reformat catalític al vapor de compostos model” funded by Diputació de Tarragona and the Universitat Rovira i Virgili under the collaboration framework agreement for the period 2020–2023.

Data Availability Statement

The data presented in this study are available on request from the corresponding author.

Acknowledgments

A. Aldureid is grateful to the Universitat Rovira i Virgili for his Ph.D. scholarship (2018PMF-PIPF-28). S. Domínguez and A. Dafinov are acknowledged for their technical support.

Conflicts of Interest

The authors declare no conflict of interest.

References

  1. Bozell, J.J.; Petersen, G.R. Technology development for the production of biobased products from biorefinery carbohydrates—The US Department of Energy’s “Top 10” revisited. Green Chem. 2010, 12, 539–554. [Google Scholar] [CrossRef]
  2. Lange, J.-P.; van der Heide, E.; van Buijtenen, J.; Price, R. Furfural—A Promising Platform for Lignocellulosic Biofuels. ChemSusChem 2012, 5, 150–166. [Google Scholar] [CrossRef] [PubMed]
  3. Mariscal, R.; Maireles-Torres, P.; Ojeda, M.; Sádaba, I.; Granados, M.L. Furfural: A renewable and versatile platform molecule for the synthesis of chemicals and fuels. Energy Environ. Sci. 2016, 9, 1144–1189. [Google Scholar] [CrossRef]
  4. Zeitsch, K.J. The Chemistry and Technology of Furfural and Its Many By-Products; Elsevier: New York, NY, USA, 2000; ISBN 9780080528991. [Google Scholar]
  5. Yan, K.; Wu, G.; Lafleur, T.; Jarvis, C. Production, properties and catalytic hydrogenation of furfural to fuel additives and value-added chemicals. Renew. Sustain. Energy Rev. 2014, 38, 663–676. [Google Scholar] [CrossRef]
  6. Hoydonckx, H.E.; Van Rhijn, W.M.; Van Rhijn, W.; De Vos, D.E.; Jacobs, P.A. Furfural and Derivatives. In Ullmann’s Encyclopedia of Industrial Chemistry; Wiley-VCH Verlag GmbH & Co. KGaA: Weinheim, Germany, 2012; Volume 16, pp. 285–313. [Google Scholar]
  7. Biradar, N.S.; Hengne, A.M.; Birajdar, S.N.; Niphadkar, P.S.; Joshi, P.N.; Rode, C.V. Single-pot formation of THFAL via catalytic hydrogenation of FFR over Pd/MFI catalyst. ACS Sustain. Chem. Eng. 2014, 2, 272–281. [Google Scholar] [CrossRef]
  8. Li, C.; Xu, G.; Liu, X.; Zhang, Y.; Fu, Y. Hydrogenation of biomass-derived furfural to tetrahydrofurfuryl alcohol over hydroxyapatite-supported Pd catalyst under mild conditions. Ind. Eng. Chem. Res. 2017, 56, 8843–8849. [Google Scholar] [CrossRef]
  9. Wang, C.; Wang, A.; Yu, Z.; Wang, Y.; Sun, Z.; Kogan, V.M.; Liu, Y.-Y. Aqueous phase hydrogenation of furfural to tetrahydrofurfuryl alcohol over Pd/UiO-66. Catal. Commun. 2021, 148, 106178. [Google Scholar] [CrossRef]
  10. Albilali, R.; Douthwaite, M.; Heb, Q.; Taylor, S.H. The selective hydrogenation of furfural over supported palladium nanoparticle catalysts prepared by sol-immobilisation: Effect of catalyst support and reaction conditions. Catal. Sci. Technol. 2018, 8, 252–267. [Google Scholar] [CrossRef]
  11. Wu, J.; Zhang, X.; Chen, Q.; Chen, L.; Liu, Q.; Wang, C.; Ma, L. One-pot hydrogenation of furfural into tetrahydrofurfuryl alcohol under ambient conditions over PtNi alloy catalyst. Energy Fuels 2020, 34, 2178–2184. [Google Scholar] [CrossRef]
  12. Matsagar, B.M.; Hsu, C.-Y.; Chen, S.S.; Ahamad, T.; Alshehri, S.M.; Tsang, D.C.W.; Wu, K.C.-W. Selective hydrogenation of furfural to tetrahydrofurfuryl alcohol over a Rh-loaded carbon catalyst in aqueous solution under mild conditions. Sustain. Energy Fuels 2020, 4, 293–301. [Google Scholar] [CrossRef]
  13. Nakagawa, Y.; Nakazawa, H.; Watanabe, H.; Tomishige, K. Total hydrogenation of furfural over a silica-supported nickel catalyst prepared by the reduction of a nickel nitrate precursor. ChemCatChem 2012, 4, 1791–1797. [Google Scholar] [CrossRef]
  14. Yang, Y.; Ma, J.; Jia, X.; Du, Z.; Duan, Y.; Xu, J. Aqueous phase hydrogenation of furfural to tetrahydrofurfuryl alcohol on alkaline earth metal modified Ni/Al2O3. RSC Adv. 2016, 6, 51221–51228. [Google Scholar] [CrossRef]
  15. Parikh, J.; Srivastava, S.; Jadeja, G.C. Selective hydrogenation of furfural to tetrahydrofurfuryl alcohol using supported nickel−cobalt catalysts. Ind. Eng. Chem. Res. 2019, 58, 16138–16152. [Google Scholar] [CrossRef]
  16. Sunyol, C.; Owen, R.E.; González, M.D.; Salagre, P.; Cesteros, Y. Catalytic hydrogenation of furfural to tetrahydrofurfuryl alcohol using competitive nickel catalysts supported on mesoporous clays. Appl. Catal. A 2021, 611, 117903. [Google Scholar] [CrossRef]
  17. Kumar, A.; Shivhare, A.; Bal, R.; Srivastava, R. Metal and solvent-dependent activity of spinel- based catalysts for the selective hydrogenation and rearrangement of furfural. Sustain. Energy Fuels 2021, 5, 3191–3204. [Google Scholar] [CrossRef]
  18. Cavani, F.; Trifirò, F.; Vaccari, A. Hydrotalcite-type anionic clays: Preparation, properties and applications. Catal. Today 1991, 11, 173–301. [Google Scholar] [CrossRef]
  19. Hernández, W.Y.; Lauwaert, J.; Van Der Voort, P.; Verberckmoes, A. Recent advances on the utilization of layered double hydroxides (LDHs) and related heterogeneous catalysts in a lignocellulosic feedstock biorefinery scheme. Green Chem. 2017, 19, 5269–5302. [Google Scholar] [CrossRef] [Green Version]
  20. Kaneda, K.; Mizugaki, T. Design of high-performance heterogeneous catalysts using hydrotalcite for selective organic transformations. Green Chem. 2019, 21, 1361–1389. [Google Scholar] [CrossRef]
  21. Sels, B.F.; De Vos, D.E.; Jacobs, P.A. Hydrotalcite-like anionic clays in catalytic organic reactions. Catal. Rev. Sci. Eng. 2001, 43, 443–488. [Google Scholar] [CrossRef]
  22. Kaneda, K.; Ebitani, K.; Mizugaki, T.; Mori, K. Design of high-performance heterogeneous metal catalysts for green and sustainable chemistry. Bull Chem. Soc. Jpn. 2006, 79, 981–1016. [Google Scholar] [CrossRef] [Green Version]
  23. Kannan, S. Catalytic applications of hydrotalcite-like materials and their derived forms. Catal. Surv. Asia 2006, 10, 117–137. [Google Scholar] [CrossRef]
  24. Fan, G.; Li, F.; Evans, D.G.; Duan, X. Catalytic applications of layered double hydroxides: Recent advances and perspectives. Chem. Soc. Rev. 2014, 43, 7040–7066. [Google Scholar] [CrossRef] [PubMed]
  25. Feng, J.; He, Y.; Liu, Y.; Du, Y.; Li, D. Supported catalysts based on layered double hydroxides for catalytic oxidation and hydrogenation: General functionality and promising application prospects. Chem. Soc. Rev. 2015, 44, 5291–5319. [Google Scholar] [CrossRef] [PubMed] [Green Version]
  26. Sulmonetti, T.P.; Pang, S.H.; Claure, M.T.; Lee, S.; Cullen, D.A.; Agrawal, P.K.; Jones, C.W. Vapor phase hydrogenation of furfural over nickel mixed metal oxide catalysts derived from layered double hydroxides. Appl. Catal. A 2016, 517, 187–195. [Google Scholar] [CrossRef] [Green Version]
  27. Wu, J.; Gao, G.; Li, J.; Sun, P.; Long, X.; Li, F. Efficient and versatile CuNi alloy nanocatalysts for the highly selective hydrogenation of furfural. Appl. Catal. B 2017, 203, 227–236. [Google Scholar] [CrossRef]
  28. Meng, X.; Yang, Y.; Chen, L.; Xu, M.; Zhang, X.; Wei, M. A control over hydrogenation selectivity of furfural via tuning exposed facet of Ni catalysts. ACS Catal. 2019, 9, 4226–4235. [Google Scholar] [CrossRef]
  29. Rao, T.U.; Suchada, S.; Choi, C.; Machida, H.; Huo, Z.; Norinaga, K. Selective hydrogenation of furfural to tetrahydrofurfuryl alcohol in 2-butanol over an equimolar Ni-Cu-Al catalyst prepared by the co-precipitation method. Energy Convers. Manag. 2022, 265, 115736. [Google Scholar] [CrossRef]
  30. Stepanova, L.N.; Belskaya, O.B.; Leont’eva, N.N.; Kobzar, E.O.; Salanov, A.N.; Gulyaeva, T.I.; Trenikhin, M.V.; Likholobov, V.A. Study of the properties of the catalysts based on Ni(Mg)Al-Layered Hydroxides for the reaction of furfural hydrogenation. Mater. Chem. Phys. 2021, 263, 124091. [Google Scholar] [CrossRef]
  31. Rietveld, H.M. A profile refinement method for nuclear and magnetic structures. J. Appl. Crystallogr. 1969, 2, 65–71. [Google Scholar] [CrossRef]
  32. Coelho, A.A. TOPAS and TOPAS-academic: An optimization program integrating computer algebra and crystallographic objects written in C++. J. Appl. Crystallogr. 2018, 51, 210–218. [Google Scholar] [CrossRef] [Green Version]
  33. Balzar, D. Voigt-function model in diffraction line-broadening analysis. In Defect and Microstructure Analysis by Diffraction; Snyder, R.L., Fiala, J., Bunge, H.J., Eds.; International Union of Crystallography Monographs on Crystallography Num. 10; Oxford University Press: New York, NY, USA, 1999; pp. 94–124. [Google Scholar]
  34. Hill, R.J.; Howard, C.J. Quantitative phase analysis from neutron powder diffraction data using the Rietveld method. J. Appl. Crystallogr. 1987, 20, 467–474. [Google Scholar] [CrossRef]
  35. Abelló, S.; Bolshak, E.; Montané, D. Ni-Fe catalysts derived from hydrotalcite-like precursors for hydrogen production by ethanol steam reforming. Appl. Catal. A 2013, 450, 261–274. [Google Scholar] [CrossRef]
  36. Jorgensen, A.D.; Picel, K.C.; Stamoudis, V.C. Prediction of gas chromatography flame ionization detector response factors from molecular structures. Anal. Chem. 1990, 62, 683–689. [Google Scholar] [CrossRef]
  37. Saint Laumer, J.-Y.; Leocata, S.; Tissot, E.; Baroux, L.; Kampf, D.M.; Merle, P.; Boschung, A.; Seyfried, M.; Chaintreau, A. Prediction of response factors for gas chromatography with flame ionization detection: Algorithm improvement, extension to silylated compounds, and application to the quantification of metabolites. J. Sep. Sci. 2015, 38, 3209–3217. [Google Scholar] [CrossRef]
  38. Thommes, M.; Kaneko, K.; Neimark, A.V.; Olivier, J.P.; Rodriguez-Reinoso, F.; Rouquerol, J.; Sing, K.S.W. Physisorption of gases, with special reference to the evaluation of surface area and pore size distribution (IUPAC Technical Report). Pure Appl. Chem. 2015, 87, 1051–1069. [Google Scholar] [CrossRef] [Green Version]
  39. Bardestani, R.; Patience, G.S.; Kaliaguine, S. Experimental methods in chemical engineering: Specific surface area and pore size distribution measurements—BET, BJH, and DFT. Can. J. Chem. Eng. 2019, 97, 2781–2791. [Google Scholar] [CrossRef]
  40. Brown, I.D. Bond valence theory. In Bond Valences; Brown, I., Poeppelmeier, K.R., Eds.; Springer: Berlin/Heidelberg, Germany, 2014; Volume 3, pp. 11–58. [Google Scholar]
  41. Vegard, L. Die konstitution der mischkristalle und die raumfüllung der atome. Z. Physik 1921, 5, 17–26. [Google Scholar] [CrossRef]
  42. Clause, O.; Coelho, M.G.; Gazzano, M.; Matteuzzi, D.; Trifirò, F.; Vaccari, A. Synthesis and thermal reactivity of nickel-containing anionic clays. Appl. Clay Sci. 1993, 8, 169–186. [Google Scholar] [CrossRef]
  43. Mas, V.; Baronetti, G.; Amadeo, N.; Laborde, M. Ethanol steam reforming using Ni(II)-Al(III) layered double hydroxide as catalyst precursor. Kinetic study. Chem. Eng. J. 2008, 138, 602–667. [Google Scholar]
  44. Abelló, D.; Berrueco, C.; Gispert-Guirado, F.; Montané, D. Synthetic natural gas by direct CO2 hydrogenation on activated takovites: Effect of Ni/Al molar ratio. Catal. Sci. Technol. 2016, 6, 2305–2317. [Google Scholar] [CrossRef]
  45. Puxley, D.C.; Kitchener, I.J.; Komodromos, C.; Parkyns, N.D. The effect of preparation method upon the structures, stability and metal/support interactions in nickel/alumina catalysts. Stud. Surf. Sci. Catal. 1983, 16, 237–271. [Google Scholar]
  46. Gavilà, L.; Lähde, A.; Jokiniemi, J.; Constanti, M.; Medina, F.; del Río, E.; Tichit, D.; Álvarez, M.G. Insights on the One-Pot Formation of 1,5-Pentanediol from Furfural with Co–Al Spinel-based Nanoparticles as an Alternative to Noble Metal Catalysts. ChemCatChem 2019, 11, 4944–4953. [Google Scholar] [CrossRef]
  47. Wang, Y.; Cui, Q.; Guan, Y.; Wu, P. Facile synthesis of furfuryl ethyl ether in high yield via the reductive etherification of furfural in ethanol over Pd/C under mild conditions. Green Chem. 2018, 20, 2110–2117. [Google Scholar] [CrossRef]
  48. He, J.; Nielsen, M.R.; Hansen, T.W.; Yang, S.; Riisager, A. Hierarchically constructed NiO with improved performance for catalytic transfer hydrogenation of biomass-derived aldehydes. Catal. Sci. Technol. 2019, 9, 1289–1300. [Google Scholar] [CrossRef] [Green Version]
  49. Ramos, R.; Peixoto, A.F.; Arias-Serrano, B.I.; Soares, O.S.G.P.; Pereira, M.F.R.; Kubička, D.; Freire, C. Catalytic transfer hydrogenation of furfural over Co3O4-Al2O3 hydrotalcite-derived catalyst. ChemCatChem 2020, 12, 1467–1475. [Google Scholar] [CrossRef]
  50. Jorge, E.Y.; Lima, T.D.M.; Lima, C.G.; Marchini, L.; Castelblanco, W.N.; Rivera, D.G.; Urquieta-Gonzalez, E.A.; Varma, R.S.; Paixão, M.W. Metal-exchanged magnetic β-zeolites: Valorization of lignocellulosic biomass-derived compounds to platform chemicals. Green Chem. 2017, 19, 3856–3868. [Google Scholar] [CrossRef]
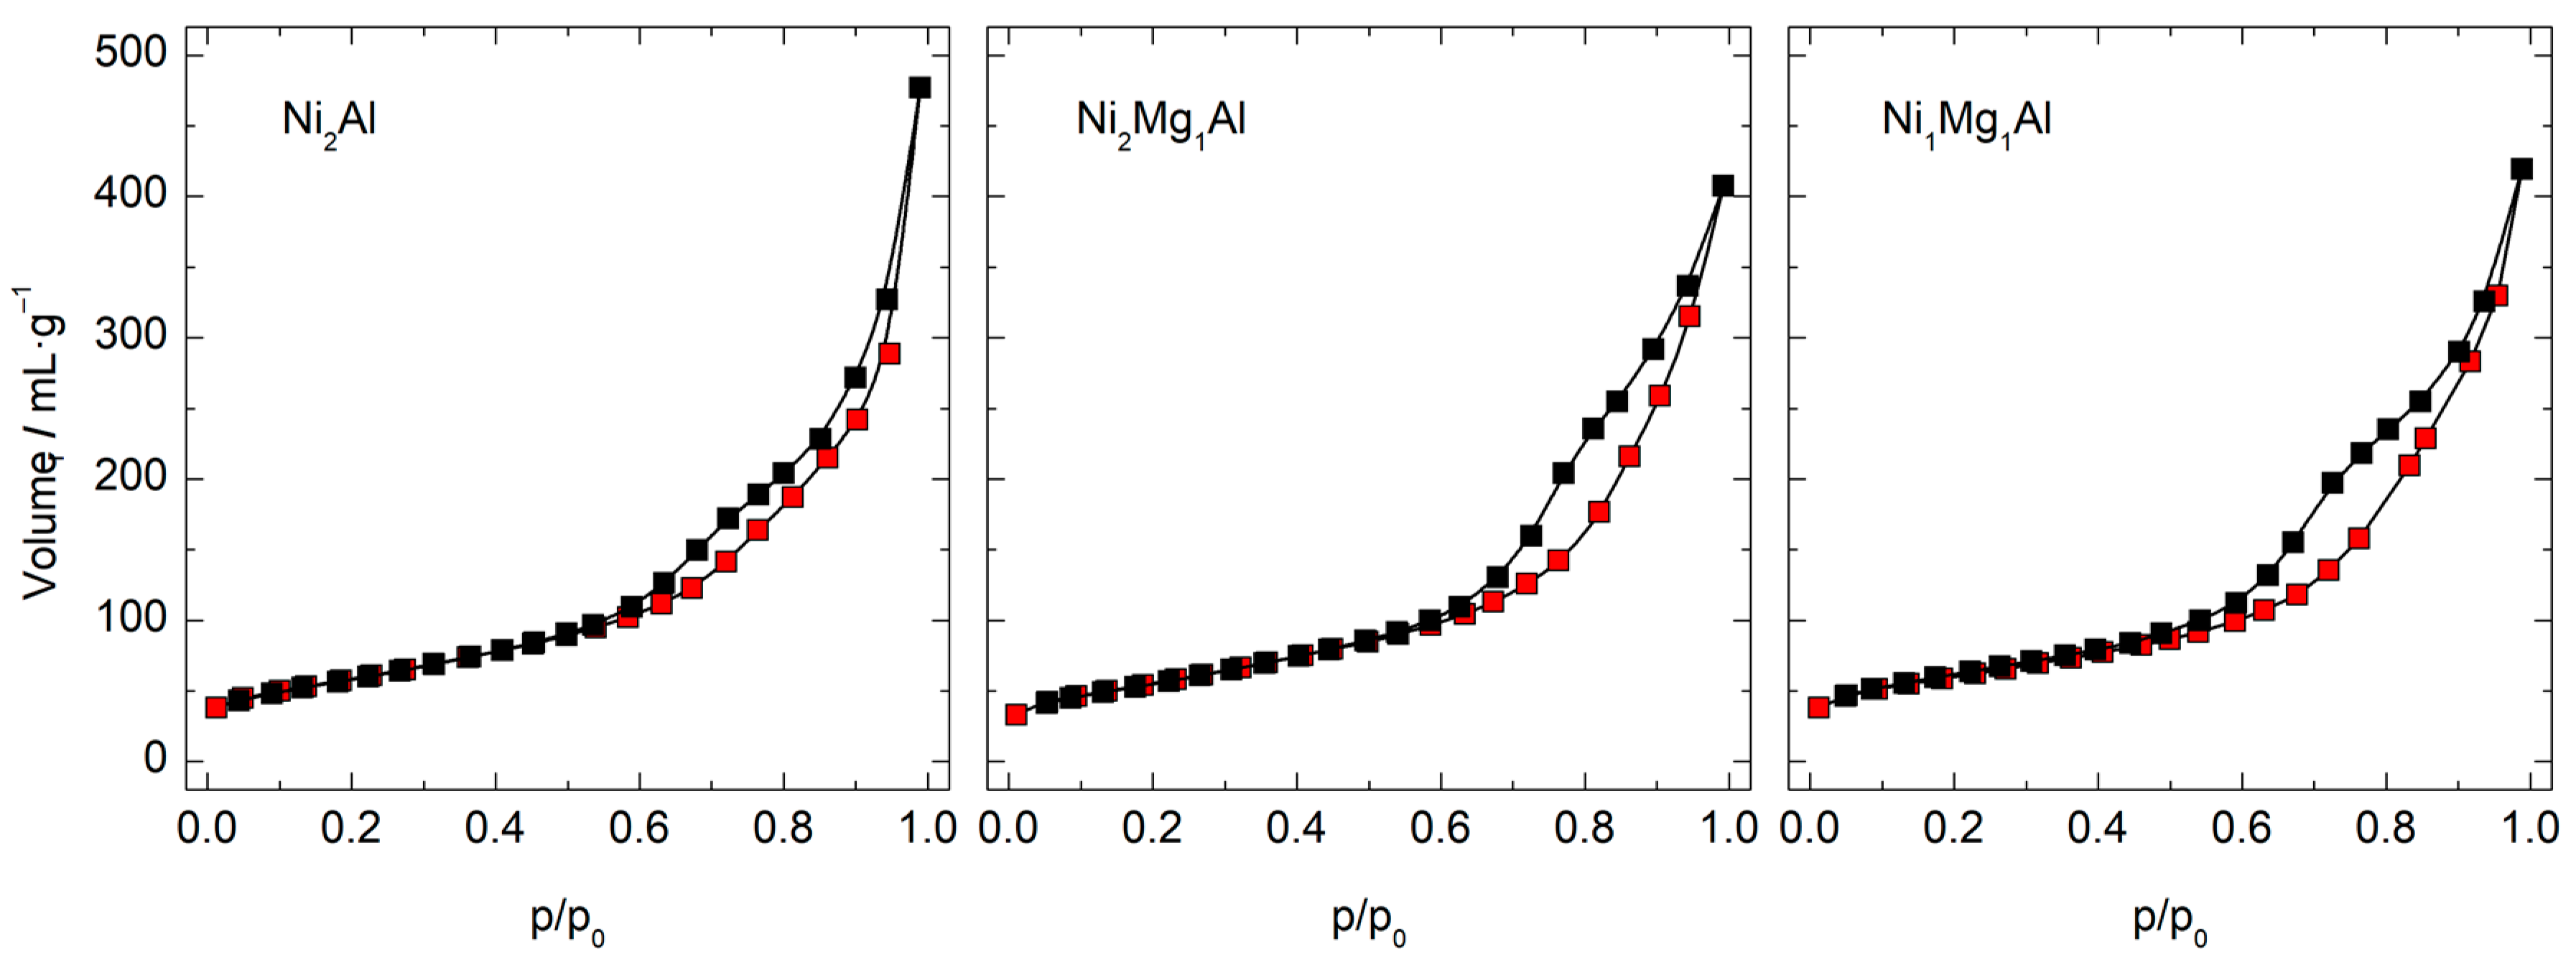
Figure 1. N2 physisorption isotherms of the LDH precursors calcined at 400 °C for 4 h. The red symbols are the adsorption branch, and the black symbols are the desorption branch of the isotherm.
Chemistry 05 00041 g001
Figure 2. Pore volume (left) and surface (right) distributions of the LDH precursors calcined at 400 °C for 4 h and determined with the DFT model.
Chemistry 05 00041 g002
Figure 3. XRD patterns of the LDH precursors calcined at 400 °C for 4 h (left) and the catalysts after reduction at 500 °C for 1 h (right) (a: Ni2Al, b: Ni2Mg1Al, c: Ni1Mg1Al).
Chemistry 05 00041 g003
Figure 4. TEM analysis of Ni2Al-R (top row), Ni2Mg1Al-R (center row), and Ni1Mg1Al-R (bottom row): HAADF-STEM images (1st column), bright-field TEM images (2nd column), and HRTEM images of the selected areas labelled a to f in the bright-field TEM images (3rd and 4th columns). Arrows mark the measured lattice fringes.
Chemistry 05 00041 g004
Figure 5. H2-TPR of the LDH precursors calcined at 400 °C for 4 h.
Chemistry 05 00041 g005
Figure 6. Acidic groups on the reduced catalysts by NH3-TPD. Black line: recorded signal. Red line: deconvoluted signal. Blue peaks = weak (α); green peaks = intermediate (β); red peaks = strong sites (γ).
Chemistry 05 00041 g006
Figure 7. Basic groups on the reduced catalysts by CO2-TPD. Black line: recorded signal. Red line: deconvoluted signal. Blue peaks = weak (α); green peaks = intermediate (β); red peaks = strong sites (γ).
Chemistry 05 00041 g007
Figure 8. Furfural conversion and product selectivity over Ni2Mg1Al-R: effect of hydrogen pressure at 4 h and 190 °C using 5 wt.% FF in ethanol (the dashed lines only indicate trends).
Chemistry 05 00041 g008
Scheme 1. Reaction pathways involved in the hydrogenation of furfural on Ni-Mg/Al catalysts.
Chemistry 05 00041 sch001
Figure 9. Furfural conversion and product selectivity over Ni2Mg1Al-R: effect of reaction time at 50 bar of H2 and 190 °C using 5 wt.% FF in ethanol (the dashed lines only indicate trends).
Chemistry 05 00041 g009
Figure 10. Furfural conversion and product selectivity over Ni2Mg1Al-R: effect of reaction temperature at 50 bar of H2 and 2 h using 5 wt.% FF in ethanol (the dashed lines only indicate trends).
Chemistry 05 00041 g010
Figure 11. Furfural conversion and product selectivity using 5 wt.% FF in ethanol at 190 °C: influence of the catalyst composition and the reactor type. Left: batch reactor at 50 bar of H2 for 4 h. Right: tubular reactor at atmospheric pressure using a WHSV of 2.85 gFF·gcat−1·h−1 and a hydrogen-to-furfural molar ratio of 12.7:1.0.
Chemistry 05 00041 g011
Table 1. Atomic ratios of the LDH precursors calcined at 400 °C for 4 h, measured by ICP-EOS and FESEM-EDX.
Calcined MaterialICP-EOSFESEM-EDX
Ni/AlMg/AlNi/AlMg/Al
Ni2Al1.83-2.05-
Ni2Mg1Al1.901.111.270.82
Ni1Mg1Al0.900.980.961.02
Table 2. Textural properties of the LDH precursors calcined at 400 °C for 4 h.
Calcined MaterialBET Surface Area
(m2·g−1)
DFT Pore Volume
(mL·g−1)
DFT Pore Diameter
(nm)
Ni2Al2100.495.4
Ni2Mg1Al2000.507.1
Ni1Mg1Al2120.485.4
Table 3. Crystalline phases detected and average crystallite sizes calculated from the XRD diffraction patterns of the calcined and reduced samples.
Composition (XRD %)Phases
SamplesAlMgNiIdentifiedwt.%Crystallite Size (nm)
Ni2Al13.6-57.6(Al0.85Ni0.15)[Al0.55Ni0.45]2O4461.3
NiO542.2
Ni2Mg1Al10.513.633.0Ni0.3Mg0.7[Al]2O4421.2
Ni0.49Mg0.51O582.8
Ni1Mg1Al7.713.018.8Ni0.5Mg0.5[Al]2O4460.7
Ni0.31Mg0.69O542.1
Ni2Al-R18.3-59.0(Al0.90Ni0.10)[Al0.99Ni0.01]2O4351.3
NiO351.8
Ni303.4
Ni2Mg1Al-R15.116.837.1Mg[Al]2O4401.3
Ni0.51Mg0.49O482.8
Ni122.8
Ni1Mg1Al-R16.518.830.3Mg[Al]2O4441.3
Ni0.44Mg0.56O501.5
Ni6.23.6
Table 4. Specific hydrogen consumption during the TPR of the LDH precursors calcined at 400 °C for 4 h.
Calcined MaterialPeak 1Peak 2Total
T (°C)H2 (mmol·g−1)T (°C)H2 (mmol·g−1)H2 (mmol·g−1)
Ni2Al3020.315136.777.08
Ni2Mg1Al3920.316305.675.98
Ni1Mg1Al4220.587064.294.87
Table 5. Concentration and surface density of weak (α, Td < 220 °C) and intermediate (β, 220 °C < Td < 500 °C) acidic sites determined by NH3-TPD.
CatalystConcentration (mmol NH3·g−1)Surface Density (µmol NH3·m−2)
Weak (α) Medium (β)TotalWeak (α)Medium (β)Total
Ni2Al-R0.340.661.001.623.144.76
Ni1Mg1Al-R0.410.330.741.931.563.49
Ni2Mg1Al-R0.360.310.671.801.553.35
Table 6. Concentration and surface density of weak (α, Td < 200 °C), intermediate (β, 200 °C < Td < 500 °C), and strong (γ, Td > 500 °C) basic sites determined by CO2-TPD.
CatalystConcentration (mmol CO2·g−1)Surface Density (µmol CO2·m−2)
Weak (α) Medium (β)Strong (γ)TotalWeak (α)Medium (β)Strong (γ)Total
Ni2Al-R0.200.120.050.370.960.570.241.78
Ni1Mg1Al-R0.130.190.140.460.620.870.662.15
Ni2Mg1Al-R0.040.140.200.390.200.721.011.94
Disclaimer/Publisher’s Note: The statements, opinions and data contained in all publications are solely those of the individual author(s) and contributor(s) and not of MDPI and/or the editor(s). MDPI and/or the editor(s) disclaim responsibility for any injury to people or property resulting from any ideas, methods, instructions or products referred to in the content.