Review

Quantitative Measurements of Pharmacological and Toxicological Activity of Molecules

Laboratory of Biochemical Neuropharmacology, Kazan Federal University, Kremliovskaya Str 18, 420111 Kazan, Russia
*
Author to whom correspondence should be addressed.
Chemistry 2022, 4(4), 1466-1474; https://doi.org/10.3390/chemistry4040097
Submission received: 6 October 2022 / Revised: 3 November 2022 / Accepted: 4 November 2022 / Published: 8 November 2022
(This article belongs to the Section Medicinal Chemistry)

Abstract

:
Toxicity and pharmacological activity scales of molecules, in particular toxicants, xenobiotics, drugs, nutraceuticals, etc., are described by multiples indicators, and the most popular is the median lethal dose (LD50). At the molecular level, reversible inhibition or binding constants provide unique information on the potential activity of molecules. The important problem concerning the meaningfulness of IC50 for irreversible ligands/inhibitors is emphasized. Definitions and principles for determination of these quantitative parameters are briefly introduced in this article. Special attention is devoted to the relationships between these indicators. Finally, different approaches making it possible to link pharmacological and toxicological properties of molecules in terms of molecular interactions (or chemical reactions) with their biological targets are briefly examined. Experimental trends for future high-throughput screening of active molecules are pointed out.

Graphical Abstract

1. Introduction

Quantification of dose–response is a major issue in toxicology and pharmacology. The frontier between beneficial effects of a drug and toxicity is fuzzy, but it has been recognized for centuries that the effect in general depends on the dose. All over the world, fresh students in pharmacology and medicine have learnt the famous aphorism of Paracelsus (1493–1541): “dosis sola facit venenum”. Though hormesis [1] and hysteresis [2] are uncommon but important phenomena in pharmacology and toxicology, we will focus exclusively on concentration-dependent actions/effects of drugs. Indeed, in this article, we would like to clarify basic concepts used in pharmacology and toxicology that relate the general action of chemicals to physiological, pharmacological, and toxic effects. Working in a reductionist perspective, the effects of chemicals can be investigated first on biological targets, e.g., enzymes, receptors, nucleic acids, etc., and addressed in terms of molecular interactions. Then, chemical dose–response can be studied on whole organisms and cell cultures to quantify chemical actions at physiological level. Though with the fantastic developments of microfluidic and single-cell techniques, quantitative structure–activity relationships (QSAR), in silico predictive methods, artificial intelligence, and deep learning, we are at the eve of a revolution in predictive drug–response approaches [3], our presentation is focused on fundamental concepts rather than on innovative methodologies.

2. Indicators of Toxicity and Pharmacological Activity

2.1. The Half-Maximal Inhibitory Concentration (IC50)

At the target level, IC50 corresponds to the inhibitor concentration causing 50% inhibition of enzyme or receptor activity. Dose–response curves for enzyme inhibition or receptor binding can be determined graphically by plotting the remaining fractional activity of an enzyme (vi/v0) or the fractional occupancy (B) of a receptor as a function of inhibitor (or ligand) concentration [I].
Cheng and Prusoff [4] derived all equations describing the relationships between enzyme catalytic parameters, inhibition constants, and IC50 for fast reversible inhibitors (Scheme 1, Table 1).
In the case of fast reversible inhibition, IC50 depends on the type of substrate and its concentration, except for non-competitive inhibitors (Table 1). However, if reversible inhibitors are partial inhibitors, i.e., inhibitors that do not fully inhibit the enzyme—β < 1 in Scheme 1—even at the highest concentrations (for a recent example see [5]), dose–response curves do no reach zero at high inhibitor concentration. The height of asymptotic limit corresponds to the residual fractional activity. Moreover, for certain reversible inhibitors, called “slow-binding inhibitors”, equilibrium is established after a lag time that could be several minutes [6]. Lag times are related to the dissociation rate constant of ligands from a target and measure the residence time on the target. As pointed out, long residence times on targets cause temporal discordances between pharmacokinetics and pharmacodynamics [7]. Slow-binding ligands with in vivo long residence times on targets inhibit targets at doses far below IC50. A recent work about a papain-like protease inhibitor illustrates this statement [8]. Thus, in all cases, IC50 must be determined at equilibrium. Another complication results from possible allosteric effects. When there is a non-michaelian saturation, the Hill coefficients (nH), derived from dose–response curves, provide evidence for multiple ligand binding when it is different from one [9]. This parameter is important in receptology.
Thus, as seen from Table 1, IC50 is largely dependent on the ratio [S]/KM. A replot of IC50 as a function of [S]/KM was recently proposed [10]. This leads to clear inhibition patterns, depending on the value of α (Table 1, right column).
Previous relationships are valid for reversible ligands/inhibitors. However, in the case of drugs that are irreversible, covalent inhibitors (R) of enzymes, or irreversible ligands of proteins, e.g., alkylating agents (Scheme 2), the value of IC50 is not meaningful because the inhibition process is time-dependent. The following formalism is for irreversible enzyme inhibition, but it also applies to irreversible chemical modification of proteins (P) by low amounts ([P] << [R]) of natural and industrial toxicants:
This is the case of irreversible inhibitors of acetylcholinesterase, such as organophosphates and carbamates used as pesticides, drugs for glaucoma, and palliative drugs for Alzheimer disease treatment [11].
In fact, for irreversible inhibition, IC50 must be regarded as the inhibitor concentration leading to 50% of inhibited enzyme after time t, i.e., [E]0/2. For most in vivo irreversible inhibition of enzymes where [E] << [I], the inhibition process obeys first-order kinetics (Equation (1)):
[E]t = [E]0 exp(− ki·t)
in which ki is the second-order rate constant (=kr/Ki) with the reaction half-time, leading to [E]0/2:
t1/2= Ln2/ki
In that case, apparent IC50 values may be calculated for different incubation times (t) and different initial enzyme concentrations, using the sampling method of Aldridge [12].
IC50(t) = Ln2/ki·t
For assays in the presence of substrate, Maurer et al. [13] derived a simple algebraic relationship between IC50(t) and the apparent second-order rate constant (ki) (Equation (4)):
I C 50 t = L n 2   1 + S K m k i · t
The work of Gierse et al. [14], about inhibition of cyclo-oxygenases by non-steroidal anti-inflammatory drugs, perfectly demonstrates the difficulty to rely on IC50 values and compare drugs showing different time-dependent profiles. Richardson [15] also thoroughly discussed the meaning and limitations of IC50(t) values for measuring the potency of irreversible inhibitors of acetylcholinesterase. Despite limitations, determination of IC50 at a fixed time point, IC50(t), can be correlated with cell-based assays. It is, thus, regarded as a meaningful index for testing novel irreversible covalent inhibitors of enzymes, optimizing the structure–activity relationship and dose prediction of designed compounds [16,17].

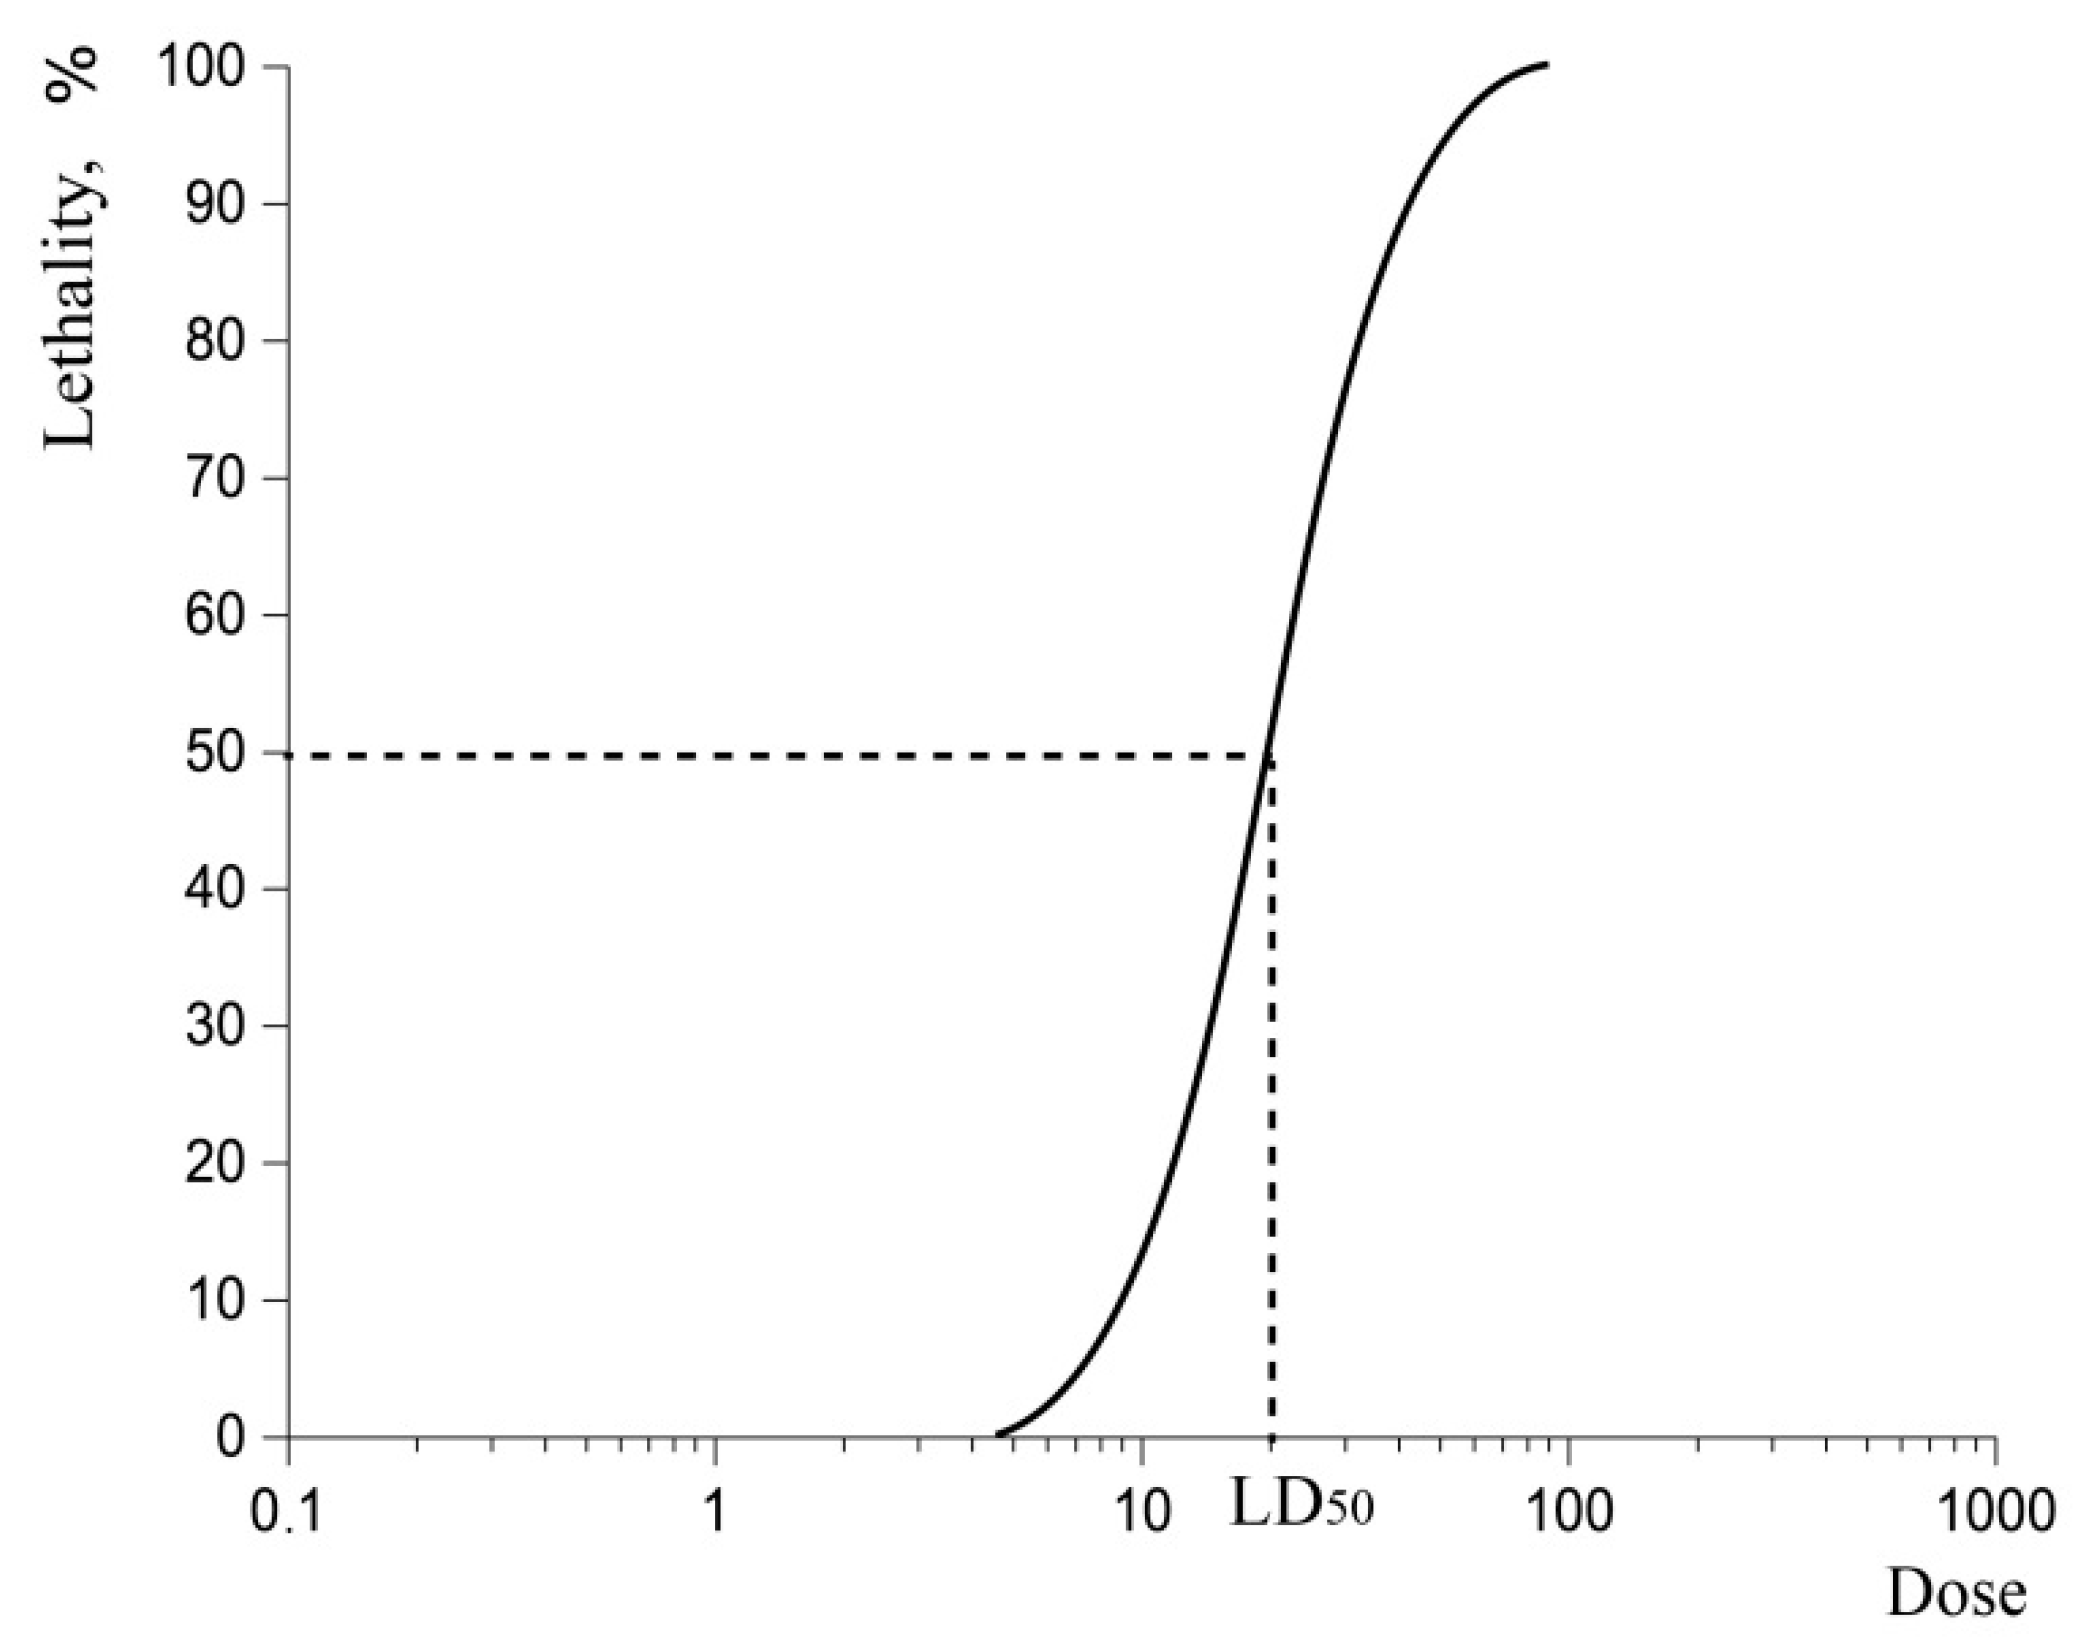
2.2. Lethal Dose-50 (LD50)

When talking about effects on physiological processes in whole organisms, and not just inhibition/activation of enzymes and receptors, the concept of the median lethal dose (LD50) is used. LD50 is the dose that kills 50 per cent of a group of animals (Figure 1). This index was proposed by Trevan in 1927 from studies on lethal doses of cocaine, digitalis, echitamine, insulin, dysentery, and diphtheria toxins [18]. Rodents are the most popular animal model for LD50 studies. Despite the fact that LD50 is criticized for low reproducibility [19], it is used for assigning substances to a toxicity class [20]. However, LD50 gives little information about the toxic effects of substances, yet is one of the most-known indicators of acute toxicity [21]. The dependence of toxicity on the substance dose (e.g., mg/kg) is a sigmoid dose–response curve on a semi-logarithmic scale. A typical curve is presented in Figure 1.
Although translations of LD50 from animals to humans have been criticized [22], calculated LD50 values provide an estimate of chemical toxicity in humans. More recently, correlation between rodent LD50 and human lethal dose was established [23].
An important derived index is the LD50-shift, used to measure the effectiveness of prophylactic and post-exposure drugs against acute toxicity of chemicals. A recent example is provided by the effective action of an encapsulated phosphotriesterase intravenously administered to mice to hydrolyze, i.e., neutralize, the organophosphate paraoxon in blood of poisoned animals, and thus, to counteract the toxic action of this compound [24].
We should also point out that in the case of irreversible inhibitors, active chemicals may induce a cascade of irreversible events, so that LD50 varies with time. Thus, as for IC50 for these compounds, LD50 must be determined at a fixed time after exposure to a toxicant. This concerns numerous xenobiotics and also more and more potential drugs, given the “resurgence of covalent drugs” [12].

3. Relations between Indicators: From Practical Descriptors to Empirical Relationship

3.1. Relationships between IC50, the Median Effective Dose (ED50), and LD50

3.1.1. Relationship between LD50 and IC50

For minimization of the number of animals used for acute toxicity studies, empirical relationships between IC50 and LD50 have been established. It is possible to make an assumption about LD50 values based on in vitro IC50 data [25]. For example, the Interagency Coordinating Committee on the validation of alternative methods proposed an empirical formula for rats [26] (Equation (5)):
LD50 (mg/kg) = 0.372 log IC50 (microg/mL) + 2.024

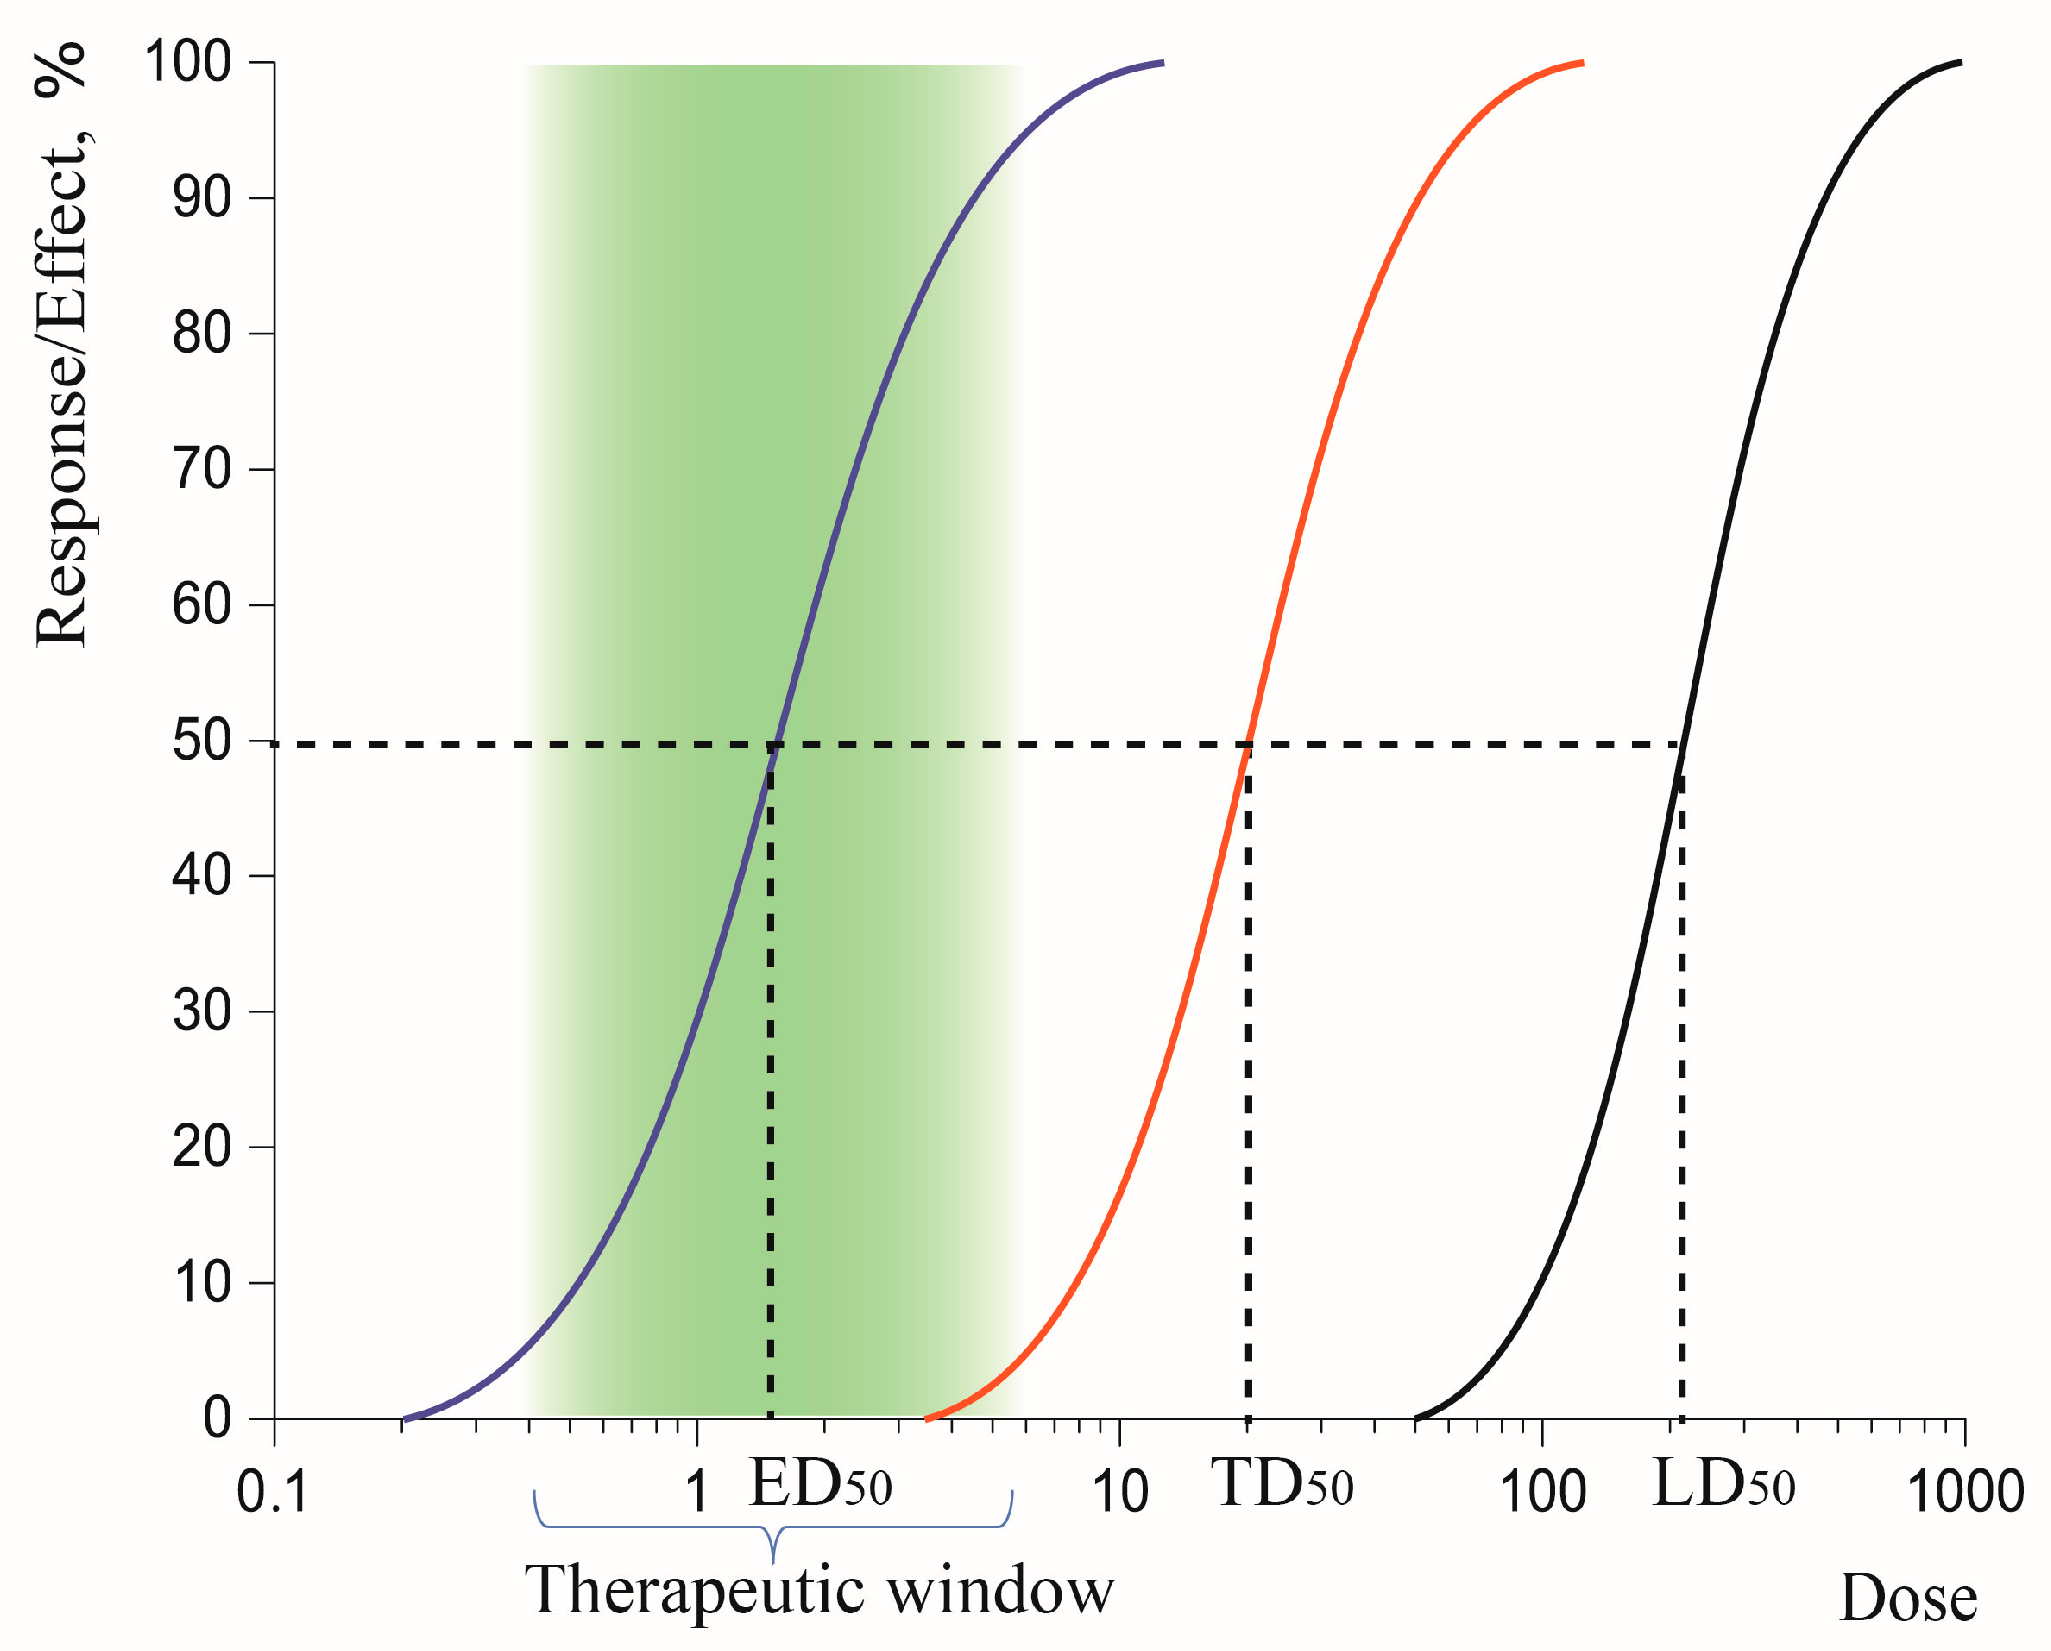
3.1.2. Therapeutic Index (TI)

Despite LD50 being a useless endpoint because it cannot be extrapolated directly to humans [27], it is used in therapeutic index (TI) determination (Figure 2). TI is the ratio of the LD50 to the ED50 (Equation (6)).
TI = LD50/ED50
The half-maximal effective concentration of a compound, EC50, measures the potency of a compound to produce 50% of its maximum effect, either pharmacological efficacy or acute toxicity, and in that case, it coincides with IC50. On the other hand, the median effective dose, ED50, differs from EC50. It is the dose that produces an effect in half of the population. ED50 should be compared to the lowest dose that produces a significant toxic effect, rather than compared to LD50 [28]. Thus far, no observed adverse effect level (NOAEL) of drugs obtained in preclinical studies (with the help of a correction factor based on body surface area) is used for calculation of human equivalent dose (HED) in clinical studies [29].
In relation to humans, TI is defined as the ratio of the dose that produces toxicity in half the population (TD50) to the dose that produces a clinically desired or effective response (ED50) in half the population [30] (Equation (7)):
TI = TD50/ED50
At the same time, it is worth taking into account that TI comparison of different drugs is precarious since different desired or toxic effects can be chosen as endpoints [31].

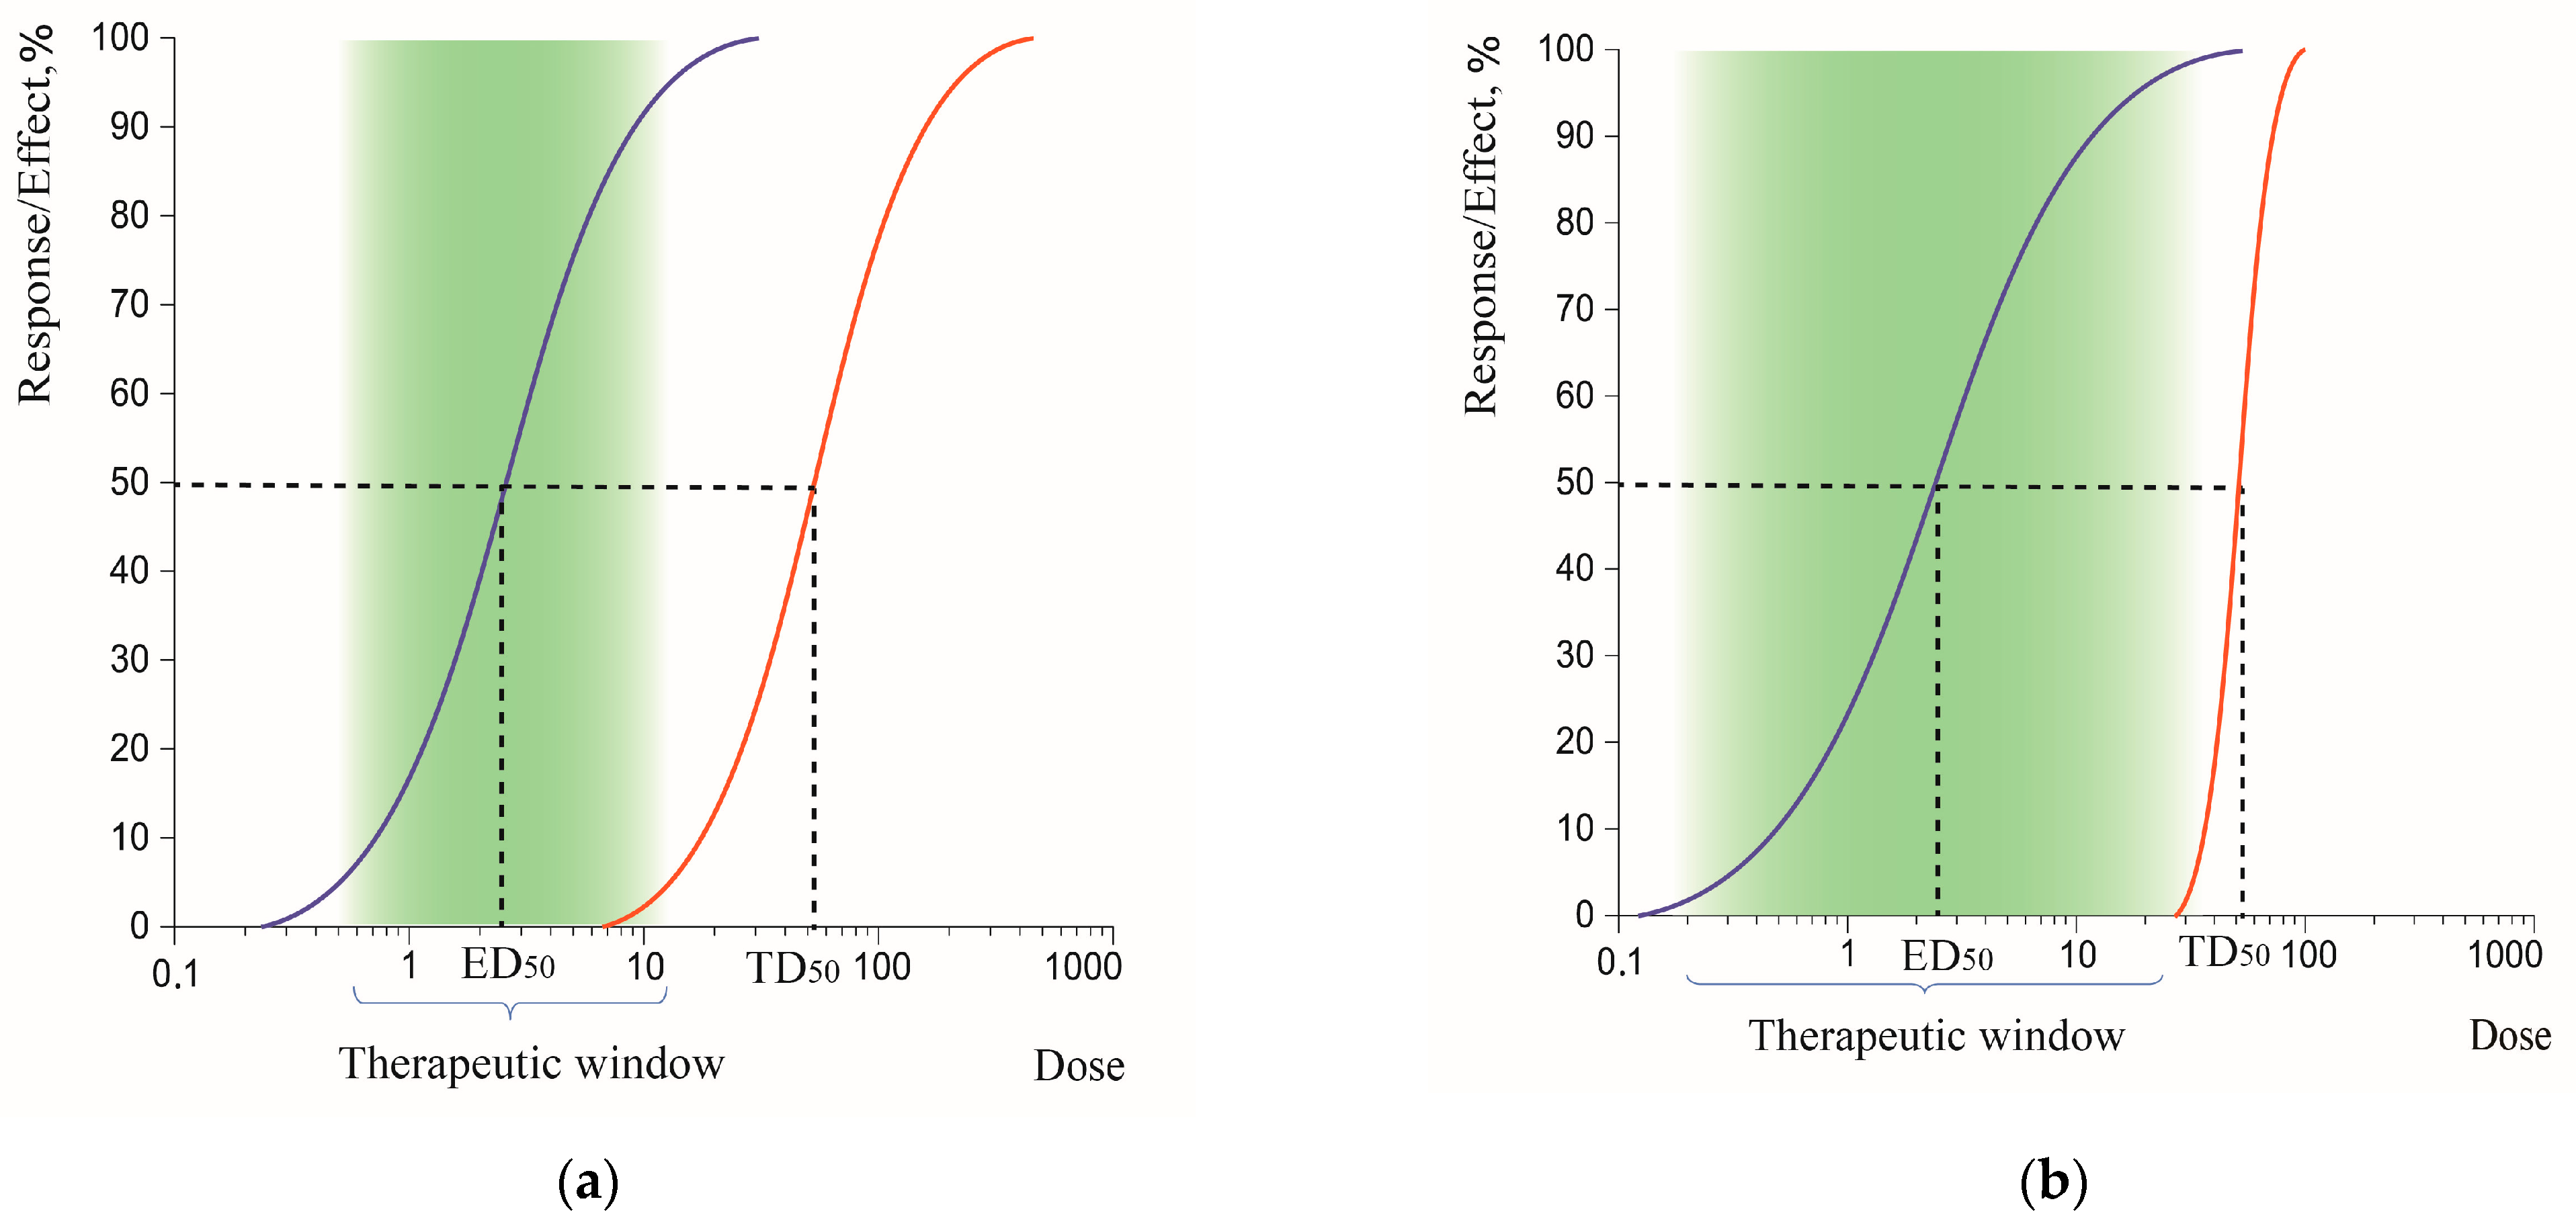
3.1.3. Therapeutic Window

Therapeutic window represents the range of doses where a drug is effective without unwanted iatrogenic effects. While a pharmacology handbook writes that “TI is a measure of a drug’s safety, because a larger value indicates a wide margin between doses that are effective and doses that are toxic” [30], Yartsev [31] noticed that there are possibilities that TI remains the same but therapeutic window may change, so there could be a more rational notion than TI (Figure 3).

3.2. Structure–Activity Relationships and In Silico Approaches

At the molecular level, Hansch’s first attempts [32,33] at correlations between physicochemical parameters (polarity, hydrophobicity, resonance, isomerism, and stericity…) of bioactive molecules and biochemical processes led to the foundations of QSAR (quantitative structure–activity relationships) and QSTR (quantitative structure–toxicity relationships) in the 1970s. This approach allows quantitative description of pharmacologically and toxicologically active molecules in terms of molecular interactions. For this purpose, two important methodological aspects have to be considered: the molecular descriptors of pharmacological and/or toxicological effects, and the algorithm design and computational approaches to be used for building QSAR models. Thus, in addition to the first molecular descriptors introduced by Hansch and pioneers in the field, new predictor parameters have recently been introduced to forecast the toxicity or the pharmacological activity of molecules. For instance, the atom surface fragment contribution (ASFC) method based on the sigma (σ) surface areas of atoms was successfully used to evaluate the toxicity of ionic liquids and even to reveal toxicity differences between isomers against a leukemia rat cell line (IPC-81) [34]. The same research group also developed a new approach called the non-integer group contribution (NGC) method, based on calculation of electrostatic potential and electrostatic surface area of atoms. This method leads to novel group descriptors for prediction of the eco-toxicity of ionic liquids against IPC-80 and conclusive results indicate that it can be applied to predict the toxicity of other chemicals [35]. These new computational methods may include the use of several machine-learning algorithms. This was shown to improve the predictions of QSARs [36].
At the same time, the development of computational chemistry allowed mining and high-throughput screening of combinational libraries of chemicals [37]. Then, the increasing number of solved 3D protein structures leads to integrated approaches combining docking methods and QSAR and QSTR models [38]. Now, the possibility to model protein binding affinity, i.e., IC50, is a powerful tool for drug design and optimizing drug discovery. A recent QSTR study, showing the relationships between molecular descriptors of anti-acetylcholinesterase carbamates and toxicity of these compounds, demonstrates the power of this approach [39]. Finally, combination of QSAR data, physiologically based pharmacokinetic (PBPK) models, and in silico toxicology modeling in artificial intelligence algorithms is the next step toward accurate predictive toxicology [40]. In the case of complex mixtures of chemicals where the resulting effects can be additive, antagonistic, or synergistic, risk assessment may be a challenge. Then, concentration additive models can be used for QSAR analysis of toxicity of chemical mixtures. The recent development of 2D molecular descriptors for the prediction of toxicity of chemical mixtures in the environment illustrates this methodological trend and the power of these new tools [41].

4. Conclusions

Taking into account the high cost, duration, and ethical aspects of conducting experiments on mammals, alternative animals have been introduced in toxicology and pharmacology trials, such as worms (Cenorhabditis elegans and planarians (Dugesia japonica, Schmidtea mediterranea) [42] or zebra fish (Danio rerio) [43]. With these models, instead of LD50, other measures have been used such as LC50, the median lethal concentration in water, and NOEC (no-observed-effect concentration). NOEC is a new toxicological parameter for risk assessment and quantification of pollutant toxicity in environments, in particular in water. Moreover, toxicity assays on different types of cell cultures have been extensively investigated. For example, cytotoxicity tests based on tetrazolium reduction [44] are an important tool in toxicity studies. They help to reduce the number of in vivo experiments with candidate molecules selected by in vitro screening studies. We should mention that specific tests have been developed to assess special cases of toxicity. A typical example is the photosensitivity to some xenobiotics, chemicals, cosmetics, and drugs. Organization for Economic Co-operation and Development experts developed in vitro phototoxicity tests on reconstructed human epidermis which use human-derived keratinocytes [45].
A century of research, animal studies, and alternative methods for investigating toxicity and pharmacological efficacy of chemicals have allowed definition of reliable parameters to quantify acute toxicity of xenobiotics and safe use of drugs. Novel approaches, still in development, combining QSAR, microfluidic devices using 2D and 3D cell cultures [46,47,48], new animal and cell models, and single-gene expression technologies allow high-throughput screening of huge libraries of chemicals, and mining new compounds of pharmacological interest or detecting unwanted toxic compounds in the environment.

Author Contributions

All authors reviewed the manuscript; writing parts 2 and 3, R.R.K.; writing introduction, parts 1, 3.2, and conclusions, P.M. All authors have read and agreed to the published version of the manuscript.

Funding

This work was performed within the frame of the Strategic Academic Leadership Program (PRIORITY-2030) of Kazan Federal University and funded by the Russian Science Foundation, grant # 20-14-00155 to P.M.

Data Availability Statement

Not applicable.

Conflicts of Interest

The authors declare no conflict of interest. The funders had no role in the design of the study; in the collection, analyses, or interpretation of data; in the writing of the manuscript; or in the decision to publish the results.

References

  1. Calabrese, E.J. Hormesis: Why it is important to toxicology and toxicologists. Environ. Toxicol. Chem. 2008, 27, 1451–1474. [Google Scholar] [CrossRef] [PubMed]
  2. Louizos, C.; Yáñez, J.A.; Forrest, M.L.; Davies, N.M. Understanding the Hysteresis Loop Conundrum in Pharmacokinetic/Pharmacodynamic Relationships. J. Pharm. Pharm. Sci. 2014, 17, 34–91. [Google Scholar] [CrossRef] [PubMed] [Green Version]
  3. Wu, Z.; Lawrence, P.J.; Ma, A.; Zhu, J.; Xu, D.; Ma, Q. Single-Cell Techniques and Deep Learning in Predicting Drug Response. Trends Pharmacol. Sci. 2020, 41, 1050–1065. [Google Scholar] [CrossRef]
  4. Cheng, Y.; Prusoff, W.H. Relationship between the inhibition constant (K1) and the concentration of inhibitor which causes 50 per cent inhibition (I50) of an enzymatic reaction. Biochem. Pharmacol. 1973, 22, 3099–3108. [Google Scholar] [CrossRef]
  5. Mukhametgalieva, A.R.; Lushchekina, S.V.; Aglyamova, A.R.; Masson, P. Steady-state kinetic analysis of human cholinesterases over wide concentration ranges of competing substrates. Biochim. Biophys. Acta Proteins Proteom. 2022, 1870, 140733. [Google Scholar] [CrossRef] [PubMed]
  6. Masson, P.; Lushchekina, S.V. Slow-binding inhibition of cholinesterases, pharmacological and toxicological relevance. Arch. Biochem. Biophys. 2016, 593, 60–68. [Google Scholar] [CrossRef]
  7. Copeland, R.A. Evolution of the drug-target residence time model. Expert Opin. Drug Discov. 2021, 16, 1441–1451. [Google Scholar] [CrossRef]
  8. Kwon, C.W.; Chung, B.; Yoo, S.H.; Chang, P.S. Heterologous expression of a papain-like protease inhibitor (SnuCalCpI17) in the E. coli and its mode of inhibition. Appl. Microbiol. Biotechnol. 2022, 106, 4563–4574. [Google Scholar] [CrossRef] [PubMed]
  9. Prinz, H. Hill coefficients, dose–response curves and allosteric mechanisms. J. Chem. Biol. 2010, 3, 37–44. [Google Scholar] [CrossRef] [Green Version]
  10. Buker, S.M.; Boriack-Sjodin, P.A.; Copeland, R.A. Enzyme–Inhibitor Interactions and a Simple, Rapid Method for Determining Inhibition Modality. SLAS Discov. 2019, 24, 515–522. [Google Scholar] [CrossRef]
  11. Colović, M.B.; Krstić, D.Z.; Lazarević-Pašti, T.D.; Bondžić, A.M.; Vasić, V.M. Acetylcholinesterase inhibitors: Pharmacology and toxicology. Curr. Neuropharmacol. 2013, 11, 315–335. [Google Scholar] [CrossRef] [Green Version]
  12. Singh, J.; Petter, R.C.; Baillie, T.A.; Whitty, A. The resurgence of covalent drugs. Nat. Rev. Drug Discov. 2011, 10, 307–317. [Google Scholar] [CrossRef]
  13. Maurer, T.S.; Tabrizi-Fard, M.A.; Fung, H.L. Impact of mechanism-based enzyme inactivation on inhibitor potency: Implications for rational drug discovery. J. Pharm. Sci. 2000, 89, 1404–1414. [Google Scholar] [CrossRef]
  14. Gierse, J.K.; Koboldt, C.M.; Walker, M.C.; Seibert, K.; Isakson, P.C. Kinetic basis for selective inhibition of cyclo-oxygenases. Biochem. J. 1999, 339, 607–614. [Google Scholar] [CrossRef] [PubMed]
  15. Richardson, R.J. Chapter 4—Toxicant interactions with macromolecular targets. In An Introduction to Interdisciplinary Toxicology; Pope, C.N., Liu, J., Eds.; Academic Press: Cambridge, MA, USA, 2020; pp. 45–57. [Google Scholar] [CrossRef]
  16. Thorarensen, A.; Balbo, P.; Banker, M.E.; Czerwinski, R.M.; Kuhn, M.; Maurer, T.S.; Telliez, J.B.; Vincent, F.; Wittwer, A.J. The advantages of describing covalent inhibitor in vitro potencies by IC50 at a fixed time point. IC50 determination of covalent inhibitors provides meaningful data to medicinal chemistry for SAR optimization. Bioorg. Med. Chem. 2021, 29, 115865. [Google Scholar] [CrossRef]
  17. Maurer, T.S.; Smith, D.; Beaumont, K.; Di, L. Dose Predictions for Drug Design. J. Med. Chem. 2020, 63, 6423–6435. [Google Scholar] [CrossRef] [PubMed]
  18. Trevan, J.W. The error of determination of toxicity. Proc. Royal Soc. B 1927, 101, 483–514. [Google Scholar] [CrossRef] [Green Version]
  19. Zbinden, G.; Flury-Roversi, M. Significance of the LD50-test for the toxicological evaluation of chemical substances. Arch. Toxicol. 1981, 47, 77–99. [Google Scholar] [CrossRef] [PubMed]
  20. United Nations. Globally Harmonized System of Classification and Labelling of Chemicals (GHS), 6th ed.; United Nations: New York, NY, USA, 2015.
  21. Colerangle, J.B. Chapter 25—Preclinical Development of Nononcogenic Drugs (Small and Large Molecules). In A Comprehensive Guide to Toxicology in Nonclinical Drug Development, 2nd ed.; Faqi, A.S., Ed.; Academic Press: Cambridge, MA, USA, 2017; pp. 659–683. [Google Scholar] [CrossRef]
  22. Blanchard, O.L.; Smoliga, J.M. Translating dosages from animal models to human clinical trials—Revisiting body surface area scaling. FASEB J. 2015, 29, 1629–1634. [Google Scholar] [CrossRef] [Green Version]
  23. Dearden, J.C.; Hewitt, M. Prediction of Human Lethal Doses and Concentrations of MEIC Chemicals from Rodent LD50 Values: An Attempt to Make Some Reparation. Altern. Lab. Anim. 2021, 49, 10–21. [Google Scholar] [CrossRef]
  24. Pashirova, T.; Shaihutdinova, Z.; Mansurova, M.; Kazakova, R.; Shambazova, D.; Bogdanov, A.; Tatarinov, D.; Daudé, D.; Jacquet, P.; Chabrière, E.; et al. Enzyme Nanoreactor for In Vivo Detoxification of Organophosphates. ACS Appl. Mater. Interfaces 2022, 14, 19241–19252. [Google Scholar] [CrossRef] [PubMed]
  25. Halle, W.; Spielmann, H. Two Procedures for the Prediction of Acute Toxicity (LD50) from Cytotoxicity Data. Altern. Lab. Anim. 1992, 20, 40–49. [Google Scholar] [CrossRef]
  26. United Stated. ICCVAM Test Method Evaluation Report: In Vitro Cytotoxicity Test Methods for Estimating Starting Doses for Acute Oral Systemic Toxicity Testing; NIH Publication No. 07-4519; United Stated: New York, NY, USA, 2006.
  27. Rosenkranz, H.S.; Cunningham, A.R. Lack of Predictivity of the Rat Lethality (LD50) Test for Ecological and Human Health Effects. Altern. Lab. Anim. 2005, 3, 9–19. [Google Scholar] [CrossRef] [PubMed]
  28. DePass, L.R. Alternative approaches in median lethality (LD50) and acute toxicity testing. Toxicol. Lett. 1989, 49, 159–170. [Google Scholar] [CrossRef]
  29. Center for Drug Evaluation and Research. Estimating the Maximum Safe Starting Dose in Initial Clinical Trials for Therapeutics in Adult Healthy Volunteers; U.S. Food and Drug Administration: Rockville, MD, USA, 2005.
  30. Peris, J. Drug-Receptor Interactions and Pharmacodynamics. In Lippincott Illustrated Reviews: Pharmacology, 7th ed.; Whalen, K., Field, C., Radhakrishnan, R., Eds.; Wolters Kluwer: Philadelphia, PA, USA, 2019; pp. 23–35. [Google Scholar]
  31. Yartsev, A. Therapeutic Index, ED50, TD50 and LD50. 2022. Available online: https://derangedphysiology.com/cicm-primary-exam/required-reading/pharmacodynamics/Chapter%20413/therapeutic-index-ed50-td50-and-ld50 (accessed on 3 October 2022).
  32. Hansch, C.; Rockwell, S.D.; Jow, P.Y.; Leo, A.; Steller, E.E. Substituent constants for correlation analysis. J. Med. Chem. 1977, 20, 304–306. [Google Scholar] [CrossRef]
  33. Hansch, C.; Leo, A.; Taft, R.W. A survey of Hammett substituent constants and resonance and field parameters. Chem. Rev. 1991, 91, 165–195. [Google Scholar] [CrossRef]
  34. Kang, X.; Zhao, Y.; Chen, Z. Atom surface fragment contribution method for predicting the toxicity of ionic liquids. J. Hazard Mater. 2022, 421, 126705. [Google Scholar] [CrossRef]
  35. Kang, X.; Zhao, Y.; Zhanga, H.; Chenb, Z. Application of atomic electrostatic potential descriptors for predicting the eco-toxicity of ionic liquids towards leukemia rat cell line. Chem. Eng. Sci. 2022, 260, 117941. [Google Scholar] [CrossRef]
  36. Wu, Z.; Zhu, M.; Kang, Y.; Leung, E.L.; Lei, T.; Shen, C.; Jiang, D.; Wang, Z.; Cao, D.; Hou, T. Do we need different machine learning algorithms for QSAR modeling? A comprehensive assessment of 16 machine learning algorithms on 14 QSAR data sets. Brief. Bioinform. 2021, 22, bbaa321. [Google Scholar] [CrossRef]
  37. Dudek, A.Z.; Arodz, T.; Gálvez, J. Computational Methods in Developing Quantitative Structure-Activity Relationships (QSAR): A Review. Comb. Chem. High Throughput Screen. 2006, 9, 213–228. [Google Scholar] [CrossRef]
  38. Hsu, H.H.; Hsu, Y.C.; Chang, L.J.; Yang, J.-M. An integrated approach with new strategies for QSAR models and lead optimization. BMC Genom. 2017, 18, 104. [Google Scholar] [CrossRef] [Green Version]
  39. Acosta-Jiménez, E.H.; Zárate-Hernández, L.A.; Camacho-Mendoza, R.L.; González-Montiel, S.; Alvarado-Rodríguez, J.G.; Gómez-Castro, C.Z.; Pescador-Rojas, M.; Meneses-Viveros, A.; Cruz-Borbolla, J. QSTR Modeling to Find Relevant DFT Descriptors Related to the Toxicity of Carbamates. Molecules 2022, 27, 5530. [Google Scholar] [CrossRef]
  40. Benfenati, E. Silico Methods for Predicting Drug Toxicity; Humana Press: New York, NY, USA, 2022. [Google Scholar] [CrossRef]
  41. Chatterjee, M.; Roy, K. Prediction of aquatic toxicity of chemical mixtures by the QSAR approach using 2D structural descriptors. J. Hazard Mater. 2021, 408, 124936. [Google Scholar] [CrossRef] [PubMed]
  42. Poirier, L.; Plener, L.; Daudé, D.; Chabrière, E. Enzymatic decontamination of paraoxon-ethyl limits long-term effects in planarians. Sci. Rep. 2020, 10, 3843. [Google Scholar] [CrossRef] [PubMed] [Green Version]
  43. Hill, A.J.; Teraoka, H.; Heideman, W.; Peterson, R.E. Zebrafish as a Model Vertebrate for Investigating Chemical Toxicity. Toxicol. Sci. 2005, 86, 6–19. [Google Scholar] [CrossRef] [Green Version]
  44. Berridge, M.V.; Herst, P.M.; Tan, A.S. Tetrazolium dyes as tools in cell biology: New insights into their cellular reduction. Biotechnol. Annu. Rev. 2005, 11, 127–152. [Google Scholar] [CrossRef] [PubMed]
  45. Organization for Economic Co-Operation and Development. Test No. 498: In Vitro Phototoxicity—Reconstructed Human Epidermis Phototoxicity test method, OECD Guidelines for the Testing of Chemicals, Section 4; OECD Publishing: Paris, France, 2021. [CrossRef]
  46. Caruso, G.; Musso, N.; Grasso, M.; Costantino, A.; Lazzarino, G.; Tascedda, F.; Gulisano, M.; Lunte, S.M.; Caraci, F. Microfluidics as a Novel Tool for Biological and Toxicological Assays in Drug Discovery Processes: Focus on Microchip Electrophoresis. Micromachines 2020, 11, 593. [Google Scholar] [CrossRef] [PubMed]
  47. McCormick, S.C.; Kriel, F.H.; Ivask, A.; Tong, Z.; Lombi, E.; Voelcker, N.H.; Priest, C. The Use of Microfluidics in Cytotoxicity and Nanotoxicity Experiments. Micromachines 2017, 8, 124. [Google Scholar] [CrossRef]
  48. Mandenius, C.F.; Ross, J.A. Cell-Based Assays Using iPSCs for Drug Development and Testing; Springer: New York, NY, USA; Imprint Humana: New York, NY, USA, 2019. [Google Scholar]
Scheme 1. Minimum mechanisms for reversible inhibition of enzyme catalysis. Inhibition can be purely competitive, inhibitor I competes with substrate S (α→∞, orange box), non-competitive (α = 1, purple box), mixed (α ≠ 1, purple box), or uncompetitive, I binds to complex ES (Ki →∞; αKi << Ki, cyan box). If inhibition is partial, β < 1 (pink triangle).
Chemistry 04 00097 sch001
Scheme 2. Progressive (time-dependent) covalent inhibition of enzymes or alkylation of proteins. The reactive inhibitor (R) forms first a reversible complex with the enzyme, and in a second step reacts (kr), forming a covalent adduct (E-R′) with concomitant release of a leaving group (X).
Chemistry 04 00097 sch002
Figure 1. Lethal-dose–response curve.
Chemistry 04 00097 g001
Figure 2. Correlation of ED50, therapeutic window, TD50, and LD50 on semi-log scale with effect/response as a function of dose.
Chemistry 04 00097 g002
Figure 3. Narrower (a) and wider (b) therapeutic windows (green areas) with the same TI.
Chemistry 04 00097 g003
Table 1. Relations between reversible inhibitors and IC50.
Type of InhibitorIC50IC50 vs. [S]/KM
Competitive K i 1 + S K M if [S] << KM, Ki = IC50Linear ascending plot
Non-competitiveKiα = 1Linear horizontal plot
Mixed type S + K M K M K i + S α K i if α = 1, Ki = IC50α > 1: curvilinear ascending plot
α < 1: curvilinear descending plot
Uncompetitive α K i 1 + K M S if [S] >> KM, αKiIC50Curvilinear descending plot
Publisher’s Note: MDPI stays neutral with regard to jurisdictional claims in published maps and institutional affiliations.

