Article

Kinetics of Thermal Decomposition of Particulate Samples of MgCO3: Experiments and Models

by
Francesca Mancarella
1,2,*,
Marcella D’Elia
1,2,3,
Gaia Micca Longo
4,
Savino Longo
4,5 and
Vincenzo Orofino
1,2,3
1
Department of Mathematics and Physics “Ennio De Giorgi”, University of Salento, Via per Arnesano, 73100 Lecce, Italy
2
Istituto Nazionale di AstroFisica (INAF), Sezione di Lecce, Via per Arnesano, 73100 Lecce, Italy
3
Istituto Nazionale di Fisica Nucleare (INFN), Sezione di Lecce, Via per Arnesano, 73100 Lecce, Italy
4
Department of Chemistry, University of Bari “Aldo Moro”, Via Orabona 4, 70126 Bari, Italy
5
Istituto per la Scienza e Tecnologia dei Plasmi, Consiglio Nazionale delle Ricerche, Bari Section, Via Amendola 122/D, 70125 Bari, Italy
*
Author to whom correspondence should be addressed.
Chemistry 2022, 4(2), 548-559; https://doi.org/10.3390/chemistry4020039
Submission received: 6 April 2022 / Revised: 25 May 2022 / Accepted: 28 May 2022 / Published: 31 May 2022
(This article belongs to the Special Issue Feature Paper from Top Italian Scientist)

Abstract

:
In this work, we study the kinetics of thermal decomposition of MgCO3 in the form of particles of known size. In the experiments, the material is heated to a known temperature in a vacuum oven, and it is characterized, both before and after heating, by infrared spectroscopy and gravimetry. The agreement between the results of the two techniques is excellent. These results are rationalized by means of a model based on Languir’s law, and the comparison with the experiments allows us to estimate the activation energy of the process. The reabsorption of atmospheric water by the oxide is shown spectroscopically, finding that is strongly influenced by the temperature of the process.

1. Introduction

Carbonates are rock-forming chemical compounds that are characterized by the presence in their molecules of a fundamental unit that distinguishes them: the carbonate ion CO 3 2 . They are common constituents of the near-surface crust of the Earth, representing the largest reservoir of carbon of our planet. According to [1], the carbonate rocks make up 10 to 15% of sedimentary rocks and basically consist of two types: limestones, whose main component is represented by the mineral calcite (CaCO3) and dolostones, which instead are composed primarily of dolomite (CaMg(CO3)2). A very common way of formation of these rocks is by aqueous alteration on the bottom of lakes and seas, where CO2 dissolved in the water reacts with silicate minerals in the soil or in pre-existing rocks to form CaCO3. However, on our planet, most carbonates are from biological deposits consisting of fossil animal shells produced by marine organisms [2].
Carbonates have been found also outside the Earth. In particular, carbonate-bearing rocks (Fe-, Ca- and Mg-rich carbonates) have been detected on the Martian surface [3,4,5] and in the SNC (shergottites, nakhlites and chassagnites) Martian meteorites [6,7], representing a key to understand the past aqueous processes on the planet and its ancient environments [8]. Furthermore, spectroscopic evidence confirms the presence of carbonates on the dark surface of Ceres, the largest object in the main asteroid belt [9,10], as well as in cometary dust [11,12] and in dust shells surrounding two different evolved stars [13]. While the presence of carbonates on Mars and Ceres can be explained by terrestrial-like processes (as described above) of aqueous alteration of pre-existing silicate rocks in large pools of liquid water once present on those bodies, carbonate-rich cometary and circumstellar dust should be formed, instead, by gas-phase reactions on the dust particle surface or interactions between silicate grains and a surrounding ice layer [13].
Carbonates, along with sulfates and some other mineral, belong to an important class of materials that in a previous work [14] we called “White Soft Minerals” (WSMs). The importance of these minerals lies in the fact that they may be a key issue in several topics of astrobiological relevance. In fact, they could have played a crucial role in the delivery of organic matter from space to Earth through meteoroids entering our atmosphere and possibly reaching the surface as meteorites. These minerals, in fact, when thermally processed, experience decomposition and/or dehydration reactions, allowing important heat dissipation and mitigating the temperature increase during the first stages of the atmospheric entry; and this thermal protection could preserve any organic material that may be present inside them [14].
In [14], we have studied from both a theoretical and experimental point of view the decomposition process of particulate samples of calcite, a typical WSM, in the size range of 20–50 µm. These grains were thermally processed under vacuum, for about 3.5 h, at various temperatures between 485 and 1150 °C. Furthermore, using a two-dimensional atmospheric entry model, we have shown that calcite and other WSMs, such as magnesite, siderite, and gypsum, may actually reduce the intensity and the duration of the heat peak in a substantial way (especially in the case of grazing entry trajectories), giving a special thermal protection to organic material present in the micrometeorites. These results therefore show that the model based on Langmuir’s law, which as known is excellent for a whole series of homogeneous materials that decompose without change in composition, such as pure metals, needs to be corrected with an activation energy to reproduce the experimental results in the case of CaCO3. This activation energy must refer to a volume phenomenon, an activation necessary for each event of CO2 separation from the crystal lattice of the remaining oxide. It cannot be interpreted as the result of the formation of gradients and diffusion phenomena (which obviously are not described by a Langmuir–Raoult model either) because if this were the case, the crystal would still experience a first decomposition of its external part at low temperature, and we should have a match for this with a significant decomposition at a lower temperature than the fall of our curve. However, this is not observed [14].
In the present work, instead, we will study the decomposition process of magnesite (MgCO3, R 3 ¯ c ), which is another important carbonate belonging to the class of WSMs. On Earth, magnesite has been found in modern sediments, caves and soils. This carbonate can also precipitate in alkaline lakes in the presence of cyanobacteria [15]. From the point of view of industrial applications, magnesite is often used as refractory raw material due to its high fire resistance. From a planetological point of view, this material is certainly one of the most widespread carbonates on Mars, being present in various areas of the planet [8,16,17], including the Jezero crater [18], which was recently visited by the NASA Perseverance rover.
The thermal decomposition of magnesite has already been studied by various authors (see [19,20] and references therein). In particular, [20] have investigated the decomposition of magnesite by means of a thermogravimetric analysis coupled with Fourier Transform Infrared Spectroscopy (FTIR), X-ray Diffraction, and Scanning Electron Microscopy (SEM). These analyses have shown that magnesite begins to decompose at 733K, reaches its maximum decomposition rate at a temperature between 873 and 923K, and finally is completely decomposed to MgO at 973K. According to [20], the average apparent activation energy of this transformation is about 203 kJ mol−1.
In the present work, the same theoretical and experimental approach followed in [14] for calcite will be applied to study the thermal decomposition of magnesite. In the next section, we will present our experimental approach, describing the sample preparation and characterization as well as the gravimetric and spectral measurements performed on the samples. In Section 3, we will describe our theoretical approach in which a model based on the Languir and the Raoult laws is used to simulate the decomposition process. Finally, in Section 4, our results will be presented and discussed.

2. Laboratory Measurements of Magnesite Decomposition

The sample analyzed in this work has been obtained by grinding a rock of magnesite (MgCO3) provided by Treasure Mountain Mining (Greenfield, MA, USA) and was collected near Brumado (Bahia, Brazil).

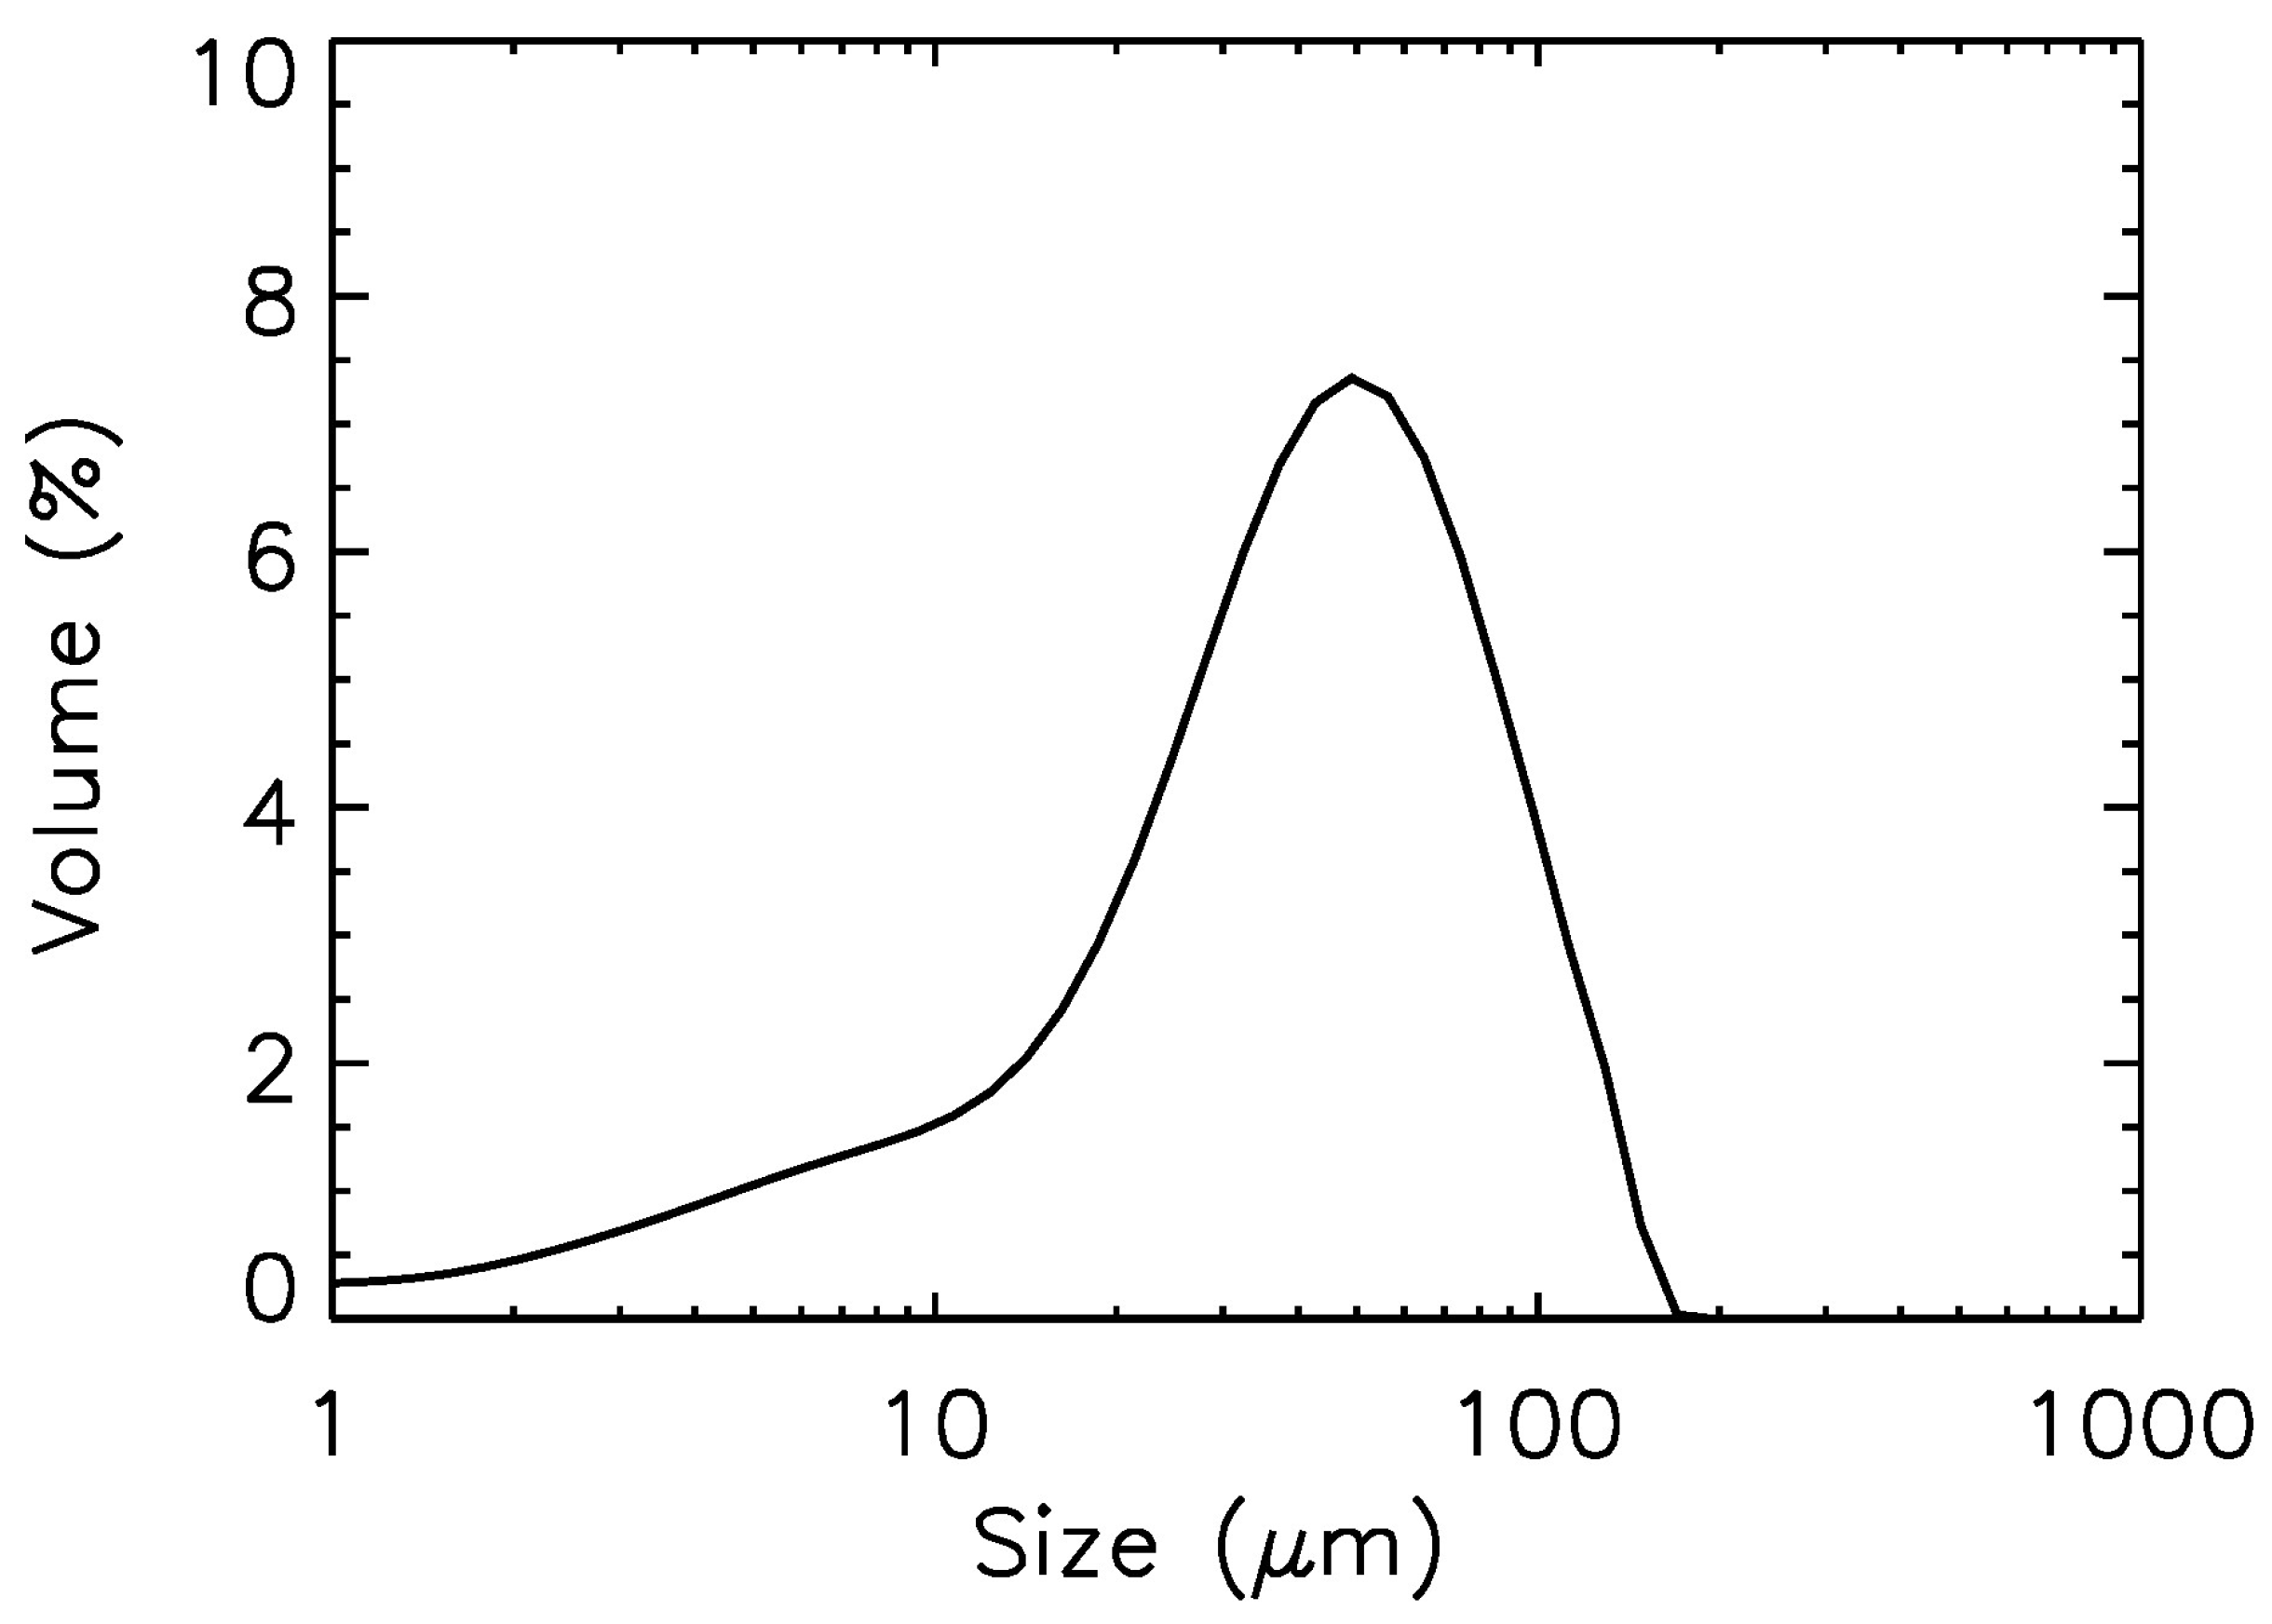
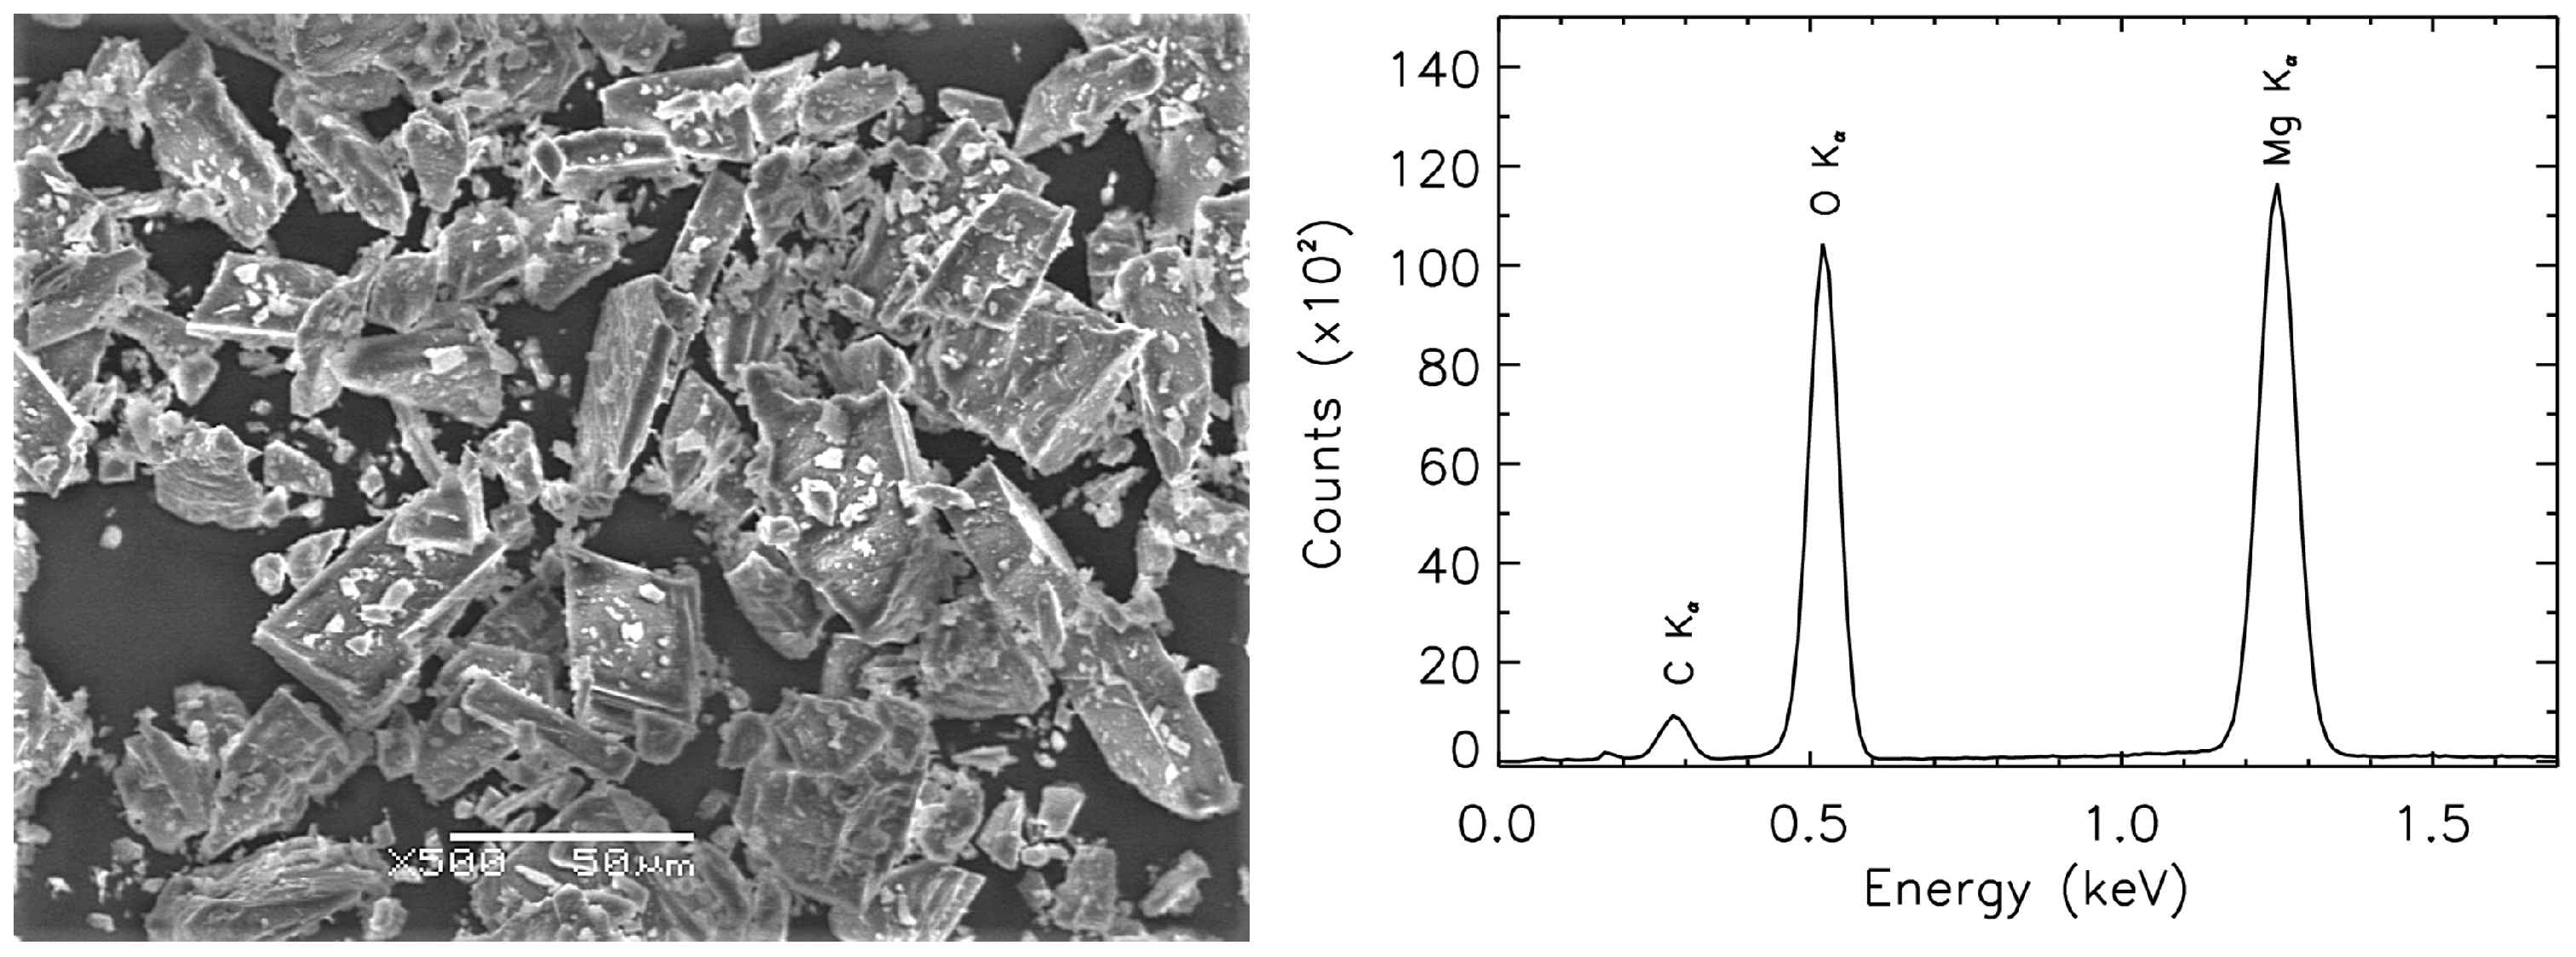
2.1. Sample Preparation and Characterizations

After crumbling the rock with a hammer, small pieces of rock were crushed with a Retsch mechanical mortar grinder (RM100), and increasing the pressure of the tungsten carbide pestle, we obtained very fine powder of magnesite. This unsorted powder was then sieved with a Retsch Sieve Shaker AS 200 for about 30 min using a column of sieves, all provided by Retch, sorting the material in several dimensional classes. For this work, we analyzed the portion with a nominal grain size range between 20 and 50 µm. Before the thermal process, we analyzed the morphology and the granulometric distribution of the sample in more detail. The latter was evaluated by means of the laser diffractometer Malvern Mastersizer 2000, which recovers the dimensional information by analyzing the diffraction pattern of a laser beam and using the Mie scattering theory [21,22,23]. Following the equivalent sphere theory, for each analyzed sample, it is possible to associate an equivalent diameter of a sphere with some characteristic in common with the particles of the sample [24], e.g., the diameter of a sphere with a same volume, which can be described by the following general formulation:
D [ m , n ] = d i m 3 V i d i n 3 V i 1 m n .
where V i is the volume of the particles with the size d i , and m and n are integer values that describe the desired average [25]. Since the radiation–matter interaction processes in spectral measurements involve mainly the volume of each particle and not its surface, we will take into account the diameter of the mean equivalent sphere in volume that corresponds to the couple (m,n) of (4,3) [26,27].
The Malvern Mastersizer 2000 is coupled with a wet sampler, Malvern Hydro 2000, in which the sample is introduced with different dispersant according to the nature of the mineral grains and allowing the possibility of activating a continuous cycle measurement mode with the same sample. In the specific case of magnesite, the liquid dispersant was ethylene glycol.
In Figure 1, we show the grain size distribution in %volume of the magnesite sample with a sieve interval of 20 ÷ 50 µm analyzed in this study. The D[4,3] provided by the software of the instrument is 45 µm, and the connected error ΔD[4,3] is of 32 µm. These statistical errors are directly linked to the sensitivity of the instrument. To decrease these associated uncertainties, each measurement of a single granulometric family is the mean of 5000 different measurements obtained by making the same sample dispersed in the liquid flow through a circuit from the dispersant unit to the cell where the scattering takes place and back. Furthermore, it is possible to note that the granulometric distribution in Figure 1 has a tail toward smaller grains, highlighting their presence in the sample. Furthermore, the distribution extends toward dimensions higher than the upper limit of the considered sieve. In order to investigate in more detail the morphology of the particles of the sample, the sample of magnesite was analyzed with a SEM, JEOL JSM-6480LV.
Looking at the left panel of Figure 2 where the SEM image of the sample with a 500× magnification is shown, it is possible to see that the mean diameter of the grains in the image is less the upper limit of the sieve interval (i.e., less than 50 µm) according to the granulometric results described before. As highlighted by the granulometric distribution, in the SEM image in the left panel of Figure 2, micrometric and submicrometric particles are deposited on the surfaces of bigger grains. From a careful analysis of Figure 2, it is possible to recognize that most of the particles in the SEM image have a narrow and long shape with one dimension longer than the higher limit of the considered sieve. This could be the reason why the granulometric distribution is extended toward higher sizes. Their presence in the sample could be due to the fact that even though the time of the sieving procedure is short enough (i.e., 30 min), particles with elongated shapes passed through the meshes of the sieve because they have time to orient themselves along the shorter dimension.
The combined results from the investigation of the granulometric analysis and from the SEM images highlight how the sample preparation is a key procedure. When the sample was crushed, a fraction of small particles was created due to the fact that magnesite is a soft material, having a hardness value ranging from 3.5 to 4.5 in the Mohs Scale. In the next sieving procedure, due to the continuous shaking, some electrostatic interactions were generated and, as a consequence, the smaller particles were captured by bigger grains. Introducing the sample in the dispersant of the granulometer, the charge was neutralized, and smaller particles are visible in the granulometric distribution.
The SEM microscope is coupled with an iXRF Systems Sirius SD Energy-Dispersion Spectrometer (EDS), allowing the measure of the elemental composition of the sample under examination. The EDS spectrum of the grains of magnesite is shown in the right panel of Figure 2. The peak positions in the energy of this spectrum is in good agreement with those tabulated for each chemical element, which should be present in the crystal lattice of the mineral analyzed, resulting in pure samples because no elemental impurity is present.

2.2. Thermal Process

The sample of magnesite was thermally processed, as was performed before for calcite sample [14,28], with a furnace CTF Carbolite Furnace able to reach 1100 °C and equipped with an accessory for heating the samples in a controlled atmosphere or under vacuum. In this study, in order to prevent contamination of the sample during the process, we operated under vacuum, at pressure varying in the range 10 −4 ÷ 10−5 mbar. The processing temperature was reached in ∼30 min, and after 3.5 h, the samples were left to cool under vacuum for at least 24 h. The time of heating treatment (i.e., 3.5 h) was the same as in the case of calcite [14,28] in order to compare the final results for the two carbonates. The values of the temperatures set for the thermal processing of the magnesite sample were chosen with the same principle followed for thermal processing of the calcite sample. Typical results from Differential Thermal Analysis on magnesite samples reported a temperature of ∼620 °C for the decomposition of magnesite into magnesium oxide (MgO) [29]. This value is about 200 °C lower than that of the decomposition of calcite into calcium oxide (CaO) [30]. For this reason and even because for the calcite sample, a temperature of 485 °C was found as the activation temperature of the degradation process [30], the first heating process of magnesite was fixed at 300 °C. After that, we increased the treatment temperature by 60 °C in the first part (i.e., up to 420 °C) and then by 30 °C (i.e., up to 570 °C) in order to extrapolate results that best describe the degradation curve. The last points were taken at 660 °C, 860 °C, and 1150 °C in order to follow the last part of the process.

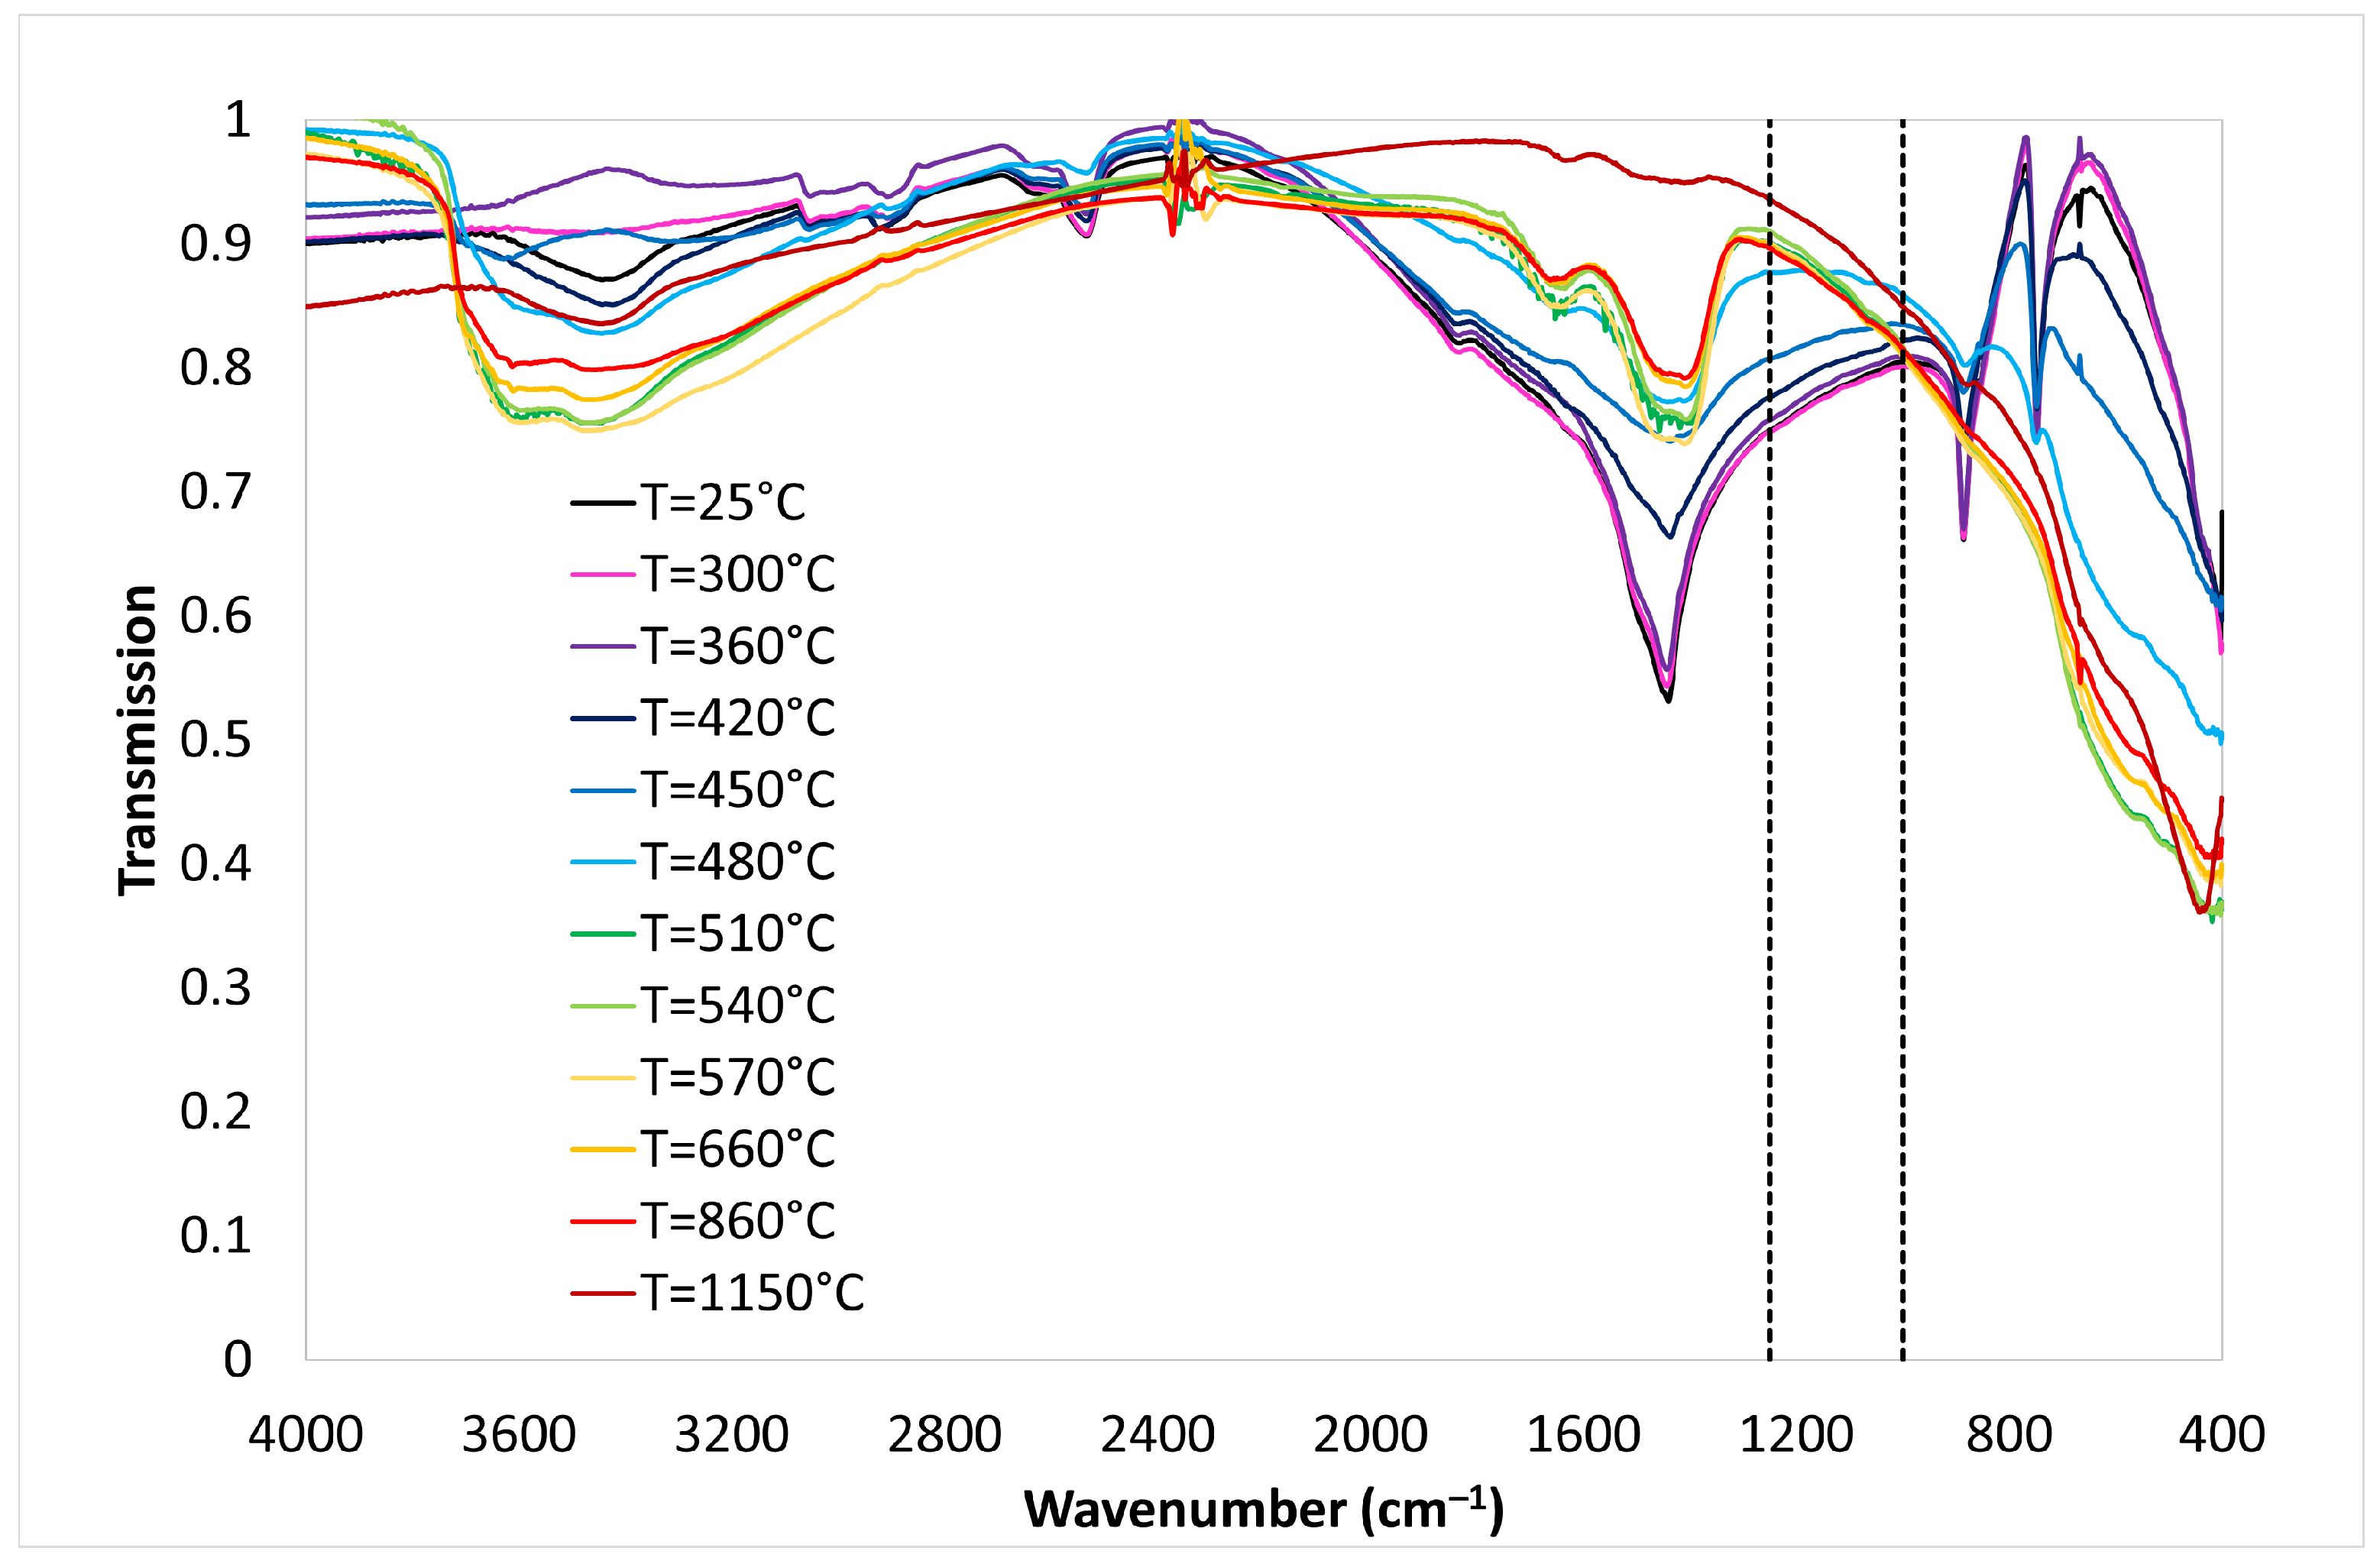
2.3. Gravimetric and Spectral Measurements

In astrobiological studies, it has been widely demonstrated the necessity of using several experimental techniques and, as performed in previous work on calcite sample [14], we used the spectroscopic method and gravimetric studies to quantify the loss of CO2 in the transformation from magnesite to MgO.
Gravimetric measurements were taken that simply weighed the powder of magnesite before and after the thermal process with a Sartorius semi-micro balance Genius ME215S. To control the carbonate fraction during the decomposition process, a parameter χ g r a v i m e t r y is calculated as follows:
χ g r a v i m e t r y = m m m i n m 0 m m i n .
where m is the mass of the grain at temperature T, m 0 represents the mass of the object when it is totally composed by carbonate, and mmin is the minimum mass in which all carbonate is turned into oxide. From an experimental point of view, m 0 is the mass before the thermal process, m is the mass after heating at temperature T, while m m i n is stoichiometrically calculated assuming that all the initial mass has been transformed into oxide. Each value of mass is measured with an accuracy of 10 µg.
Spectroscopic studies on the thermal processed powder of magnesite were developed with a Perkin Elmer Frontier FTIR spectrometer. As done in the case of calcite [14,28], we used the standard pellet technique mixing a small quantity (0.5 ÷ 0.6 mg) of sample grains, after the thermal processing and the gravimetric measurements, in 250 mg of potassium bromide (KBr) [31,32].
Transmission spectra were registered in the range 4000–400 cm−1 and are shown in Figure 3.
The spectral feature centered at 3400 cm−1 is due to a not perfect compensation for the presence of KBr, and it is present in all spectra of Figure 3, usually appearing as a tip but sometimes as a peak (e.g., in violet and blue spectrum of Figure 3). The transmission spectrum of the unprocessed sample (i.e., at T = 25 °C, black curve in Figure 3) shows the spectral signature of the magnesite in this wavelengths range. The absorptions at 1440, 882, and 745 cm−1 correspond, respectively, to the asymmetric stretch, the out-of-plane bend, and the in-plane bend of CO 3 2 [33]. The two weaker doublet absorptions located around 2900 and 2500 cm−1 can be assigned to a combination of vibrational modes quoted above and are typically in anhydrous carbonate [34,35].
In the spectra of magnesite heated at several temperatures (Figure 3), the stretching mode of Mg-O is barely perceptible as a falling in the transmittance spectra in the range from 600 to 400 cm−1, due to the fact that they are registered up to the latter wavelength. Only in the spectra at higher temperatures (i.e., higher than 570 °C, yellow, orange, red, and dark red spectra in Figure 3), a minimum at about 420 cm−1 is appreciable. The spectrum of magnesite heated at 1150 °C (dark red spectrum in Figure 3) reproduces the spectral behavior of MgO with a small hint of the absorption of CO 3 2 at 1440 cm−1.
To evaluate the percentage of carbonate material converted into magnesium oxide using the spectral measurements, it would be useful to find a unique parameter describing the spectral changes. A possible choice could be to take into account the band depth of the main absorption feature of CO 3 2 at 1440 cm−1, or the wavelength position of the band at 400 cm−1, evaluating the reduction of the carbonate component (with the reduction of the band depth) and the increasing of the oxide component heating the sample of magnesite. However, these two main spectral characteristic describing what happens during the thermal degradation of the magnesite grains could be more conveniently represented by the change of the spectral slope in the range between 1000 and 1250 cm−1 from positive values when magnesite is heated at lower temperature (due to the presence of absorption feature of CO 3 2 at 1440 cm−1) to negative ones at higher temperatures (i.e., in spectra of magnesite heated above 480 °C) due to the shift of the minimum of the absorption at 420 cm−1 indicating the formation of MgO during the thermal degradation. As performed in the case of the calcite sample [14,36], we evaluated the index D as follows:
D = T p ( ν 1 ) / T p ( ν 2 ) T u ( ν 1 ) / T u ( ν 2 ) .
where T p and T u are the values of transmittance for processed and unprocessed samples, respectively, at the extremes of the spectral range we chose as reported above (i.e., ν 1 is 1000 cm−1 and ν 2 is 1250 cm−1). As one can see from Equation (3), the index D is a simple and quick indicator of the change of the spectra due to thermal degradation of the sample (i.e., D≃ 1 when the degradation process has not started yet, D < 1 vice versa). As in the case of gravimetric measurements, from all the values of D, it is possible to calculate a χ s p e c t r o s c o p y as
χ s p e c t r o s c o p y = D D m i n D 0 D m i n .
where D is the value obtained for the spectrum of the sample heated at temperature T, D 0 is the value for the spectrum of the same sample before the thermal processing (i.e., at room temperature), and D m i n corresponds to the D value for which the final step of the transformation to oxides is experimentally reached. This latter value was evaluated warming magnesite sample at 1150 °C.

3. Theoretical Model

Regarding the decomposition model, in the past, the thermal decomposition of magnesite has been successfully described mostly using Arrhenius’ law [37,38,39,40]. However, Langmuir’s law is a standard for the decomposition kinetics in space science, to which these results are mainly addressed (e.g., [41,42]). L’vov [43] in an extensive review has discussed both models (addressing them and “chemical” and “physical”, respectively), showing that both have merits and drawbacks. In this paper, we use, therefore, Langmuir’s law together with Raoult’s law, including an additional activation energy and the effect of self-cooling. Raoult’s law is applied to provide a sensible endpoint to the process, following [44]. This approach has been successfully employed in previous works in the context of models of the entry of micrograins of this material and similar materials into the Earth’s atmosphere [44,45].
All this said, the Langmuir law and the Raoult law are applied here to magnesite decomposition, MgCO3→ MgO + CO2.
The three components involved are addressed by the value of index i equal to 1, 2, and 3, respectively.
The model is described in detail in many previous works [14,46].
According to Langmuir law, which is based on thermodynamics and on the balance between evaporation and condensation at equilibrium, the flow of molecules leaving the unit grain surface, J o u t , e v , is given by:
J o u t , e v = 1 4 8 R T g r a i n π M C O 2 p v k T g r a i n
where R is the ideal gas constant, T g r a i n is the temperature of the grain, M C O 2 is the molar mass of the gas component (CO2), p v is the partial pressure of the gas component, and k is the Boltzmann constant.
The vapor pressure p v of the ideal solid mixture MgCO3/MgO can be estimated using Raoult’s law:
p v = p 0 e Δ G ( T ) R T χ M g C O 3
where p0 = 1.01105 Pa. Δ G , the Gibbs free energy, is defined as Δ G ( T ) = Δ H ( T ) T Δ S ( T ) where Δ H and Δ S are enthalpy and entropy variations in a mole of reaction, which are calculated using
Δ H ( T ) = H ( T , C O 2 ) + H ( T , M g O ) H ( T , M g C O 3 )
Δ S ( T ) = S ( T , C O 2 ) + S ( T , M g O ) S ( T , M g C O 3 )
The expressions of heat capacity, enthalpy and entropy, depending on temperature, are given by the Kirchhoff equations [47] applied to Shomate fits [48] for each of the chemical components i = 1 , 2 , 3 of the decomposition reaction:
H i ( T ) = H i ( T 0 ) + T 0 T C p , i d T
S i ( T ) = S i ( T 0 ) + T 0 T C p , i T d T .
C p , i ( T ) = A i + B i t + C i t 2 + D i t 3 + E i t 2 [ Jmol 1 K 1 ]
S i ( T ) = A i ln t + B i t + C i t 2 2 + D i t 3 3 E i 2 t 2 + G i [ Jmol 1 K 1 ]
H i ( T ) = H i ( 298.15 K ) + A i t + B i t 2 2 + C i t 3 3 + D i t 4 4 E i t + F i I i [ kJmol 1 K 1 ]
where all capital letters are constants whose value depends on the temperature range; t = T ( K ) / 1000 and T is the asbolute temperature. The values of the related constant [46] in the relevant range T < 1200 °C are the following:
A 1 = 44.93700 , A 2 = 47.25995 , A 3 = 24.99735 ,
B 1 = 149.7085 , B 2 = 5.681621 , B 3 = 55.18696 ,
C 1 = 74.18274 , C 2 = 0.872665 , C 3 = 33.69137 ,
D 1 = 11.97670 , D 2 = 0.104300 , D 3 = 7.948387 ,
E 1 = 0.629261 , E 2 = 1.053955 , E 3 = 0.136638 ,
F 1 = 1133.224 , F 2 = 619.1316 , F 3 = 403.6075 ,
G 1 = 75.24213 , G 2 = 76.46176 , G 3 = 228.2431 ,
I 1 = 1111.689 , I 2 = 601.2408 , I 3 = 393.5224
The chemical composition of the grain is determined assuming it to be spherical and homogeneous, with a well-defined radius r. These approximations could be relaxed or modified in the future. Under these approximations, the time variation of the mole fraction of carbonate in the grain χ M g C O 3 , which is the same as χ g r a v i m e t r y defined in Equation (2) is determined from
d χ M g C O 3 / d t = J o u t , e v S / ( N A n 0 , M g C O 3 )
where N A is Avogadro’s number, S is the grain surface (estimated as 4 π r 2 ) , and n 0 , M g C O 3 is the initial number of moles of carbonate, estimated from r, the density and the molar mass M M g C O 3 of MgCO3.
Equation (14) is integrated numerically in time with the initial condition χ M g C O 3 ( t = 0 ) = 1 , assuming a grain density of 3 g/cm3 and a grain size 2 r equal to 50 µm, which corresponds to the rather pronounced maximum of the distribution shown in Figure 1. At any time step, the grain temperature is determined by balancing power gains and losses: thermal radiation and self-cooling, using the method described in [44] with the same data.
The single grain mass after partial decomposition is obtained from stoichiometry:
m = m 0 ( χ M g C O 3 + ( 1 χ M g C O 3 ) M M g O / M M g C O 3 )
where m 0 is the initial mass. The sample mass change is then simply estimated from the m / m 0 ratio.
A model based exclusively on the Langmuir equation obviously does not take into account the presence of energy barriers of the process, which do not affect the thermodynamics of the system, for example the vapor pressure, but greatly influence the time required to reach a given state. In our model, we take this into account with an empirical correction, which is based on adding an additional enthalpy Δ H to that calculated by the Shomate fit. The results are then obtained for different values of this parameter.

4. Results and Discussion

Figure 4 reports the results of gravimetric measurements represented by χ g r a v i m e t r y data (black triangles in Figure 4) obtained following Equation (2)) and of spectroscopy represented by χ s p e c t r o c o p y (red dots in Figure 4) calculated with Equation (4). These experimental data are plotted along with their relative uncertainties: on temperature, the uncertainty is related to accuracy of the thermocouple of the oven (±5 °C), while for gravimetric measurements, it is related to the accuracy of the balance that is 10 µg, as mentioned in Section 2.3. The error bars associated with χ s p e c t r o s c o p y have been directly derived from the experimentally absolute error (±5%) on the measured transmittance.
So, considering their error bars, the results from the two independent experimental techniques are in good agreement, but, as shown in Figure 4, the spectroscopic parameter χ s p e c t r o s c o p y is practically zero at 570 °C, while the χ g r a v i m e t r y at the same temperature is appreciably higher. In addition, both parameters show a small but well-defined rise for temperatures greater than 570 °C (for χ s p e c t r o s c o p y , red dots in Figure 4) or 660 °C (for χ g r a v i m e t r y , black triangles in Figure 4), and then, both return to zero at T = 1150 °C. This particular behavior is probably, due to the fact that after the opening of the furnace, the sample partially absorbs some atmospheric component (e.g., CO2 or/and H2O). In fact, during the gravimetric measurements, after the heating process, we noticed that the weighings were not stable, since the weight increased with the time.
Water absorption after the heating process is visible from a careful inspection of the spectra in Figure 3. Leaving out the presence of the spectral feature centered at about 3400 cm−1 of KBr matrix visible in the spectra of unprocessed magnesite (e.g., at T = 25 °C, black curve in Figure 3) and those processed at lower temperatures, in the spectra of magnesite heated at temperature higher than 480 °C (cyan spectrum in Figure 3), the feature, due to the O-H stretch and located between 3700 cm−1 and 2800 cm−1, is clearly visible.
In addition, Figure 4 shows the comparison between the experimental results with theoretical curves. These represent χ M g C O 3 inverting Equation (6) where p v is calculated with Equation (5) at several ΔH (0, 30, 50, 70, 100, and 120 KJ/mol). Under the conditions of this study, the self-cooling effect was overall found to be quite small.
An excellent agreement between all three results, the theoretical one and the two experimental ones, is obtained when the enthalpy barrier has a value of 120 KJ/mol. The fact that the model based on Lagmuir’s law explicitly describes the decomposition process taking into account the surface and the volume of the grain allows us to use the parameter thus determined also for different cases.

5. Conclusions

In this work, we have shown that gravimetric and spectrometric techniques provide complementary information in the study of the kinetics of vacuum thermal decomposition of magnesium carbonate in the form of particulate matter of known size. Gravimetry, by measuring only mass variations, provides an estimate of the progress of the decomposition process that is not influenced by other parameters. At the same time, however, spectrometry allows us to interpret the transition, highlighting the modification of the crystalline structure. Our experiments also clearly show the presence of the OH group in the crystal following the exposure of the oxide formed by the process to the humidity of the air, explaining the apparent stoichiometric incompleteness in gravimetry. A decomposition model was employed to interpret the results: unlike most models based on Arrhenius’s law, this one is based on Langmuir’s law, so it explicitly shows the role of parameters such as the grain surface and its vapor pressure. The decomposition law provided by the model is in agreement with the experiments if an activation energy is introduced. Once this activation energy has been determined, the modified Langmuir model can be used for further applications. The excellent agreement of the two experimental techniques used in this work also shows that the choice of the technique can be made on the basis of convenience on a case-by-case basis.

Author Contributions

Investigation, F.M. and M.D.; Data Curation and Formal analysis, F.M.; Methodology and Software, G.M.L.; Supervision and Writing—Review and Editing, S.L. and V.O. All authors have read and agreed to the published version of the manuscript.

Funding

This paper was partially supported by PON 2014–2020 within the project “Close to the Earth” and “RPASinAir”.

Data Availability Statement

The data presented in this study are available on request from the corresponding author.

Conflicts of Interest

The authors declare no conflict of interest.

References

  1. Mackenzie, F.T. Carbonate mineralogy and geochemistry. In Encyclopedia of Sediments and Sedimentary Rocks; Middleton, G.V., Church, M.J., Coniglio, M., Hardie, L.A., Longstaffe, F.J., Eds.; Springer Netherlands: Dordrecht, The Netherlands, 1978; pp. 93–100. [Google Scholar] [CrossRef]
  2. de Pater, I.; Lissauer, J.J. Planetary Sciences, 2nd ed.; Cambridge University Press: Cambridge, UK, 2010. [Google Scholar] [CrossRef]
  3. Ehlmann, B.L.; Mustard, J.F.; Murchie, S.L.; Poulet, F.; Bishop, J.L.; Brown, A.J.; Calvin, W.M.; Clark, R.N.; Marais, D.J.; Milliken, R.E.; et al. Orbital identification of carbonate-bearing rocks on Mars. Science 2008, 322, 1828–1832. [Google Scholar] [CrossRef] [PubMed] [Green Version]
  4. Boynton, W.; Ming, D.; Kounaves, S.; Young, S.; Arvidson, R.; Hecht, M.; Hoffman, J.; Niles, P.; Hamara, D.; Quinn, R.; et al. Evidence for calcium carbonate at the Mars Phoenix landing site. Science 2009, 325, 61–64. [Google Scholar] [CrossRef] [PubMed] [Green Version]
  5. Palomba, E.; Zinzi, A.; Cloutis, E.A.; d’Amore, M.; Grassi, D.; Maturilli, A. Evidence for Mg-rich carbonates on Mars from a 3.9 µm absorption feature. Icarus 2009, 203, 58–65. [Google Scholar] [CrossRef] [Green Version]
  6. Gooding, J.L.; Wentworth, S.J.; Zolensky, M.E. Calcium carbonate and sulfate of possible extraterrestrial origin in the EETA 79001 meteorite. Geochim. Cosmochim. Acta 1988, 52, 909–915. [Google Scholar] [CrossRef]
  7. Wentworth, S.J.; Gooding, J.L. Carbonates and sulfates in the Chassigny meteorite: Further evidence for aqueous chemistry on the SNC parent planet. Meteoritics 1994, 29, 860–863. [Google Scholar] [CrossRef]
  8. Wray, J.J.; Murchie, S.L.; Bishop, J.L.; Ehlmann, B.L.; Milliken, R.E.; Wilhelm, M.B.; Seelos, K.D.; Chojnacki, M. Orbital evidence for more widespread carbonate-bearing rocks on Mars. J. Geophys. Res. Planets 2016, 121, 652–677. [Google Scholar] [CrossRef] [Green Version]
  9. Rivkin, A.; Volquardsen, E.; Clark, B. The surface composition of Ceres: Discovery of carbonates and iron-rich clays. Icarus 2006, 185, 563–567. [Google Scholar] [CrossRef]
  10. De Sanctis, M.C.; Raponi, A.; Ammannito, E.; Ciarniello, M.; Toplis, M.; McSween, H.; Castillo-Rogez, J.; Ehlmann, B.; Carrozzo, F.G.; Marchi, S.; et al. Bright carbonate deposits as evidence of aqueous alteration on (1) Ceres. Nature 2016, 536, 54–57. [Google Scholar] [CrossRef]
  11. Fomenkova, M.; Kerridge, J.; Marti, K.; McFadden, L.A. Compositional trends in rock-forming elements of comet Halley dust. Science 1992, 258, 266–269. [Google Scholar] [CrossRef]
  12. Busemann, H.; Nguyen, A.N.; Cody, G.D.; Hoppe, P.; Kilcoyne, A.D.; Stroud, R.M.; Zega, T.J.; Nittler, L.R. Ultra-primitive interplanetary dust particles from the comet 26P/Grigg–Skjellerup dust stream collection. Earth Planet. Sci. Lett. 2009, 288, 44–57. [Google Scholar] [CrossRef]
  13. Kemper, F.; Jäger, C.; Waters, L.; Henning, T.; Molster, F.; Barlow, M.; Lim, T.; De Koter, A. Detection of carbonates in dust shells around evolved stars. Nature 2002, 415, 295–297. [Google Scholar] [CrossRef]
  14. Micca Longo, G.; D’Elia, M.; Fonti, S.; Longo, S.; Mancarella, F.; Orofino, V. Kinetics of white soft minerals (WSMs) decomposition under conditions of interest for astrobiology: A theoretical and experimental study. Geosciences 2019, 9, 101. [Google Scholar] [CrossRef] [Green Version]
  15. Shirokova, L.S.; Mavromatis, V.; Bundeleva, I.A.; Pokrovsky, O.S.; Bénézeth, P.; Gérard, E.; Pearce, C.R.; Oelkers, E.H. Using Mg isotopes to trace cyanobacterially mediated magnesium carbonate precipitation in alkaline lakes. Aquat. Geochem. 2013, 19, 1–24. [Google Scholar] [CrossRef]
  16. Carter, J.; Poulet, F. Orbital identification of clays and carbonates in Gusev crater. Icarus 2012, 219, 250–253. [Google Scholar] [CrossRef]
  17. Bishop, J.L.; Tirsch, D.; Tornabene, L.L.; Jaumann, R.; McEwen, A.S.; McGuire, P.C.; Ody, A.; Poulet, F.; Clark, R.N.; Parente, M.; et al. Mineralogy and morphology of geologic units at Libya Montes, Mars: Ancient aqueously derived outcrops, mafic flows, fluvial features, and impacts. J. Geophys. Res. Planets 2013, 118, 487–513. [Google Scholar] [CrossRef] [Green Version]
  18. Horgan, B.H.; Anderson, R.B.; Dromart, G.; Amador, E.S.; Rice, M.S. The mineral diversity of Jezero crater: Evidence for possible lacustrine carbonates on Mars. Icarus 2020, 339, 113526. [Google Scholar] [CrossRef]
  19. Sheila, D. Thermal analysis studies on the decomposition of magnesite. Int. J. Miner. Process. 1993, 37, 73–88. [Google Scholar] [CrossRef]
  20. Tian, L.; Tahmasebi, A.; Yu, J. An experimental study on thermal decomposition behavior of magnesite. J. Therm. Anal. Calorim. 2014, 118, 1577–1584. [Google Scholar] [CrossRef]
  21. Van de Hulst, H.C. Light Scattering: By Small Particles; John Wiley & Sons: New York, NY, USA, 1957; ISBN 0486642283. [Google Scholar]
  22. Kerker, M. The Scattering of Light, and Other Electromagnetic Radiation; Academic Press: New York, NY, USA, 1969; ISBN 9780124045507. [Google Scholar]
  23. Bohren, C.F.; Huffman, D.R. Absorption and Scattering of Light by Small Particles; John Wiley & Sons: New York, NY, USA, 2008; ISBN 9783527618156. [Google Scholar]
  24. Kippax, P. Measuring particle size using modern laser diffraction techniques. Paint. Coatings Ind. 2005, 21, 42–47. [Google Scholar]
  25. Zhou, Y.G.; Li, D.; Wang, L.J.; Özkan, N.; Chen, X.D.; Mao, Z.H. Influences of microemulsion cross-linking reaction and ball-milling on particle size characteristics of potato and maize starches. Int. J. Food Eng. 2006, 2, 4. [Google Scholar] [CrossRef]
  26. Gabas, N.; Hiquily, N.; Laguérie, C. Response of laser diffraction particle sizer to anisometric particles. Part. Part. Syst. Charact. 1994, 11, 121–126. [Google Scholar] [CrossRef]
  27. Allen, T. Particle Size Measurement; Springer: Berlin/Heidelberg, Germany, 1997; Volume 2, ISBN 978-0412753503. [Google Scholar]
  28. Orofino, V.; Blanco, A.; D’Elia, M.; Licchelli, D.; Fonti, S. Infrared transmission spectroscopy of carbonate samples of biotic origin relevant to Mars exobiological studies. Icarus 2007, 187, 457–463. [Google Scholar] [CrossRef]
  29. Kissinger, H.E. Reaction kinetics in differential thermal analysis. Anal. Chem. 1957, 29, 1702–1706. [Google Scholar] [CrossRef]
  30. Cabane, M.; Coll, P.; Szopa, C.; Israel, G.; Raulin, F.; Sternberg, R.; Mahaffy, P.; Person, A.; Rodier, C.; Navarro-Gonzalez, R.; et al. Did life exist on Mars? Search for organic and inorganic signatures, one of the goals for “SAM” (sample analysis at Mars). Adv. Space Res. 2004, 33, 2240–2245. [Google Scholar] [CrossRef]
  31. White, R.G. Handbook of Industrial Infrared Analysis; CRC Press: Boca Raton, FL, USA, 1964. [Google Scholar]
  32. Fridmann, S. Pelleting techniques in infrared analysis: A review and evaluation. Prog. Infrared Spectrosc. 1967, 3, 1–23. [Google Scholar]
  33. Yang, N.; Yue, W. Inorganic Non-Metallic Materials Atlas Manual; Wuhan University of Technology Press: Wuhan, China, 2000. [Google Scholar]
  34. Calvin, W.M.; King, T.V.; Clark, R.N. Hydrous carbonates on Mars?: Evidence from Mariner 6/7 infrared spectrometer and ground-based telescopic spectra. J. Geophys. Res. Planets 1994, 99, 14659–14675. [Google Scholar] [CrossRef]
  35. Jouglet, D.; Poulet, F.; Milliken, R.; Mustard, J.; Bibring, J.P.; Langevin, Y.; Gondet, B.; Gomez, C. Hydration state of the Martian surface as seen by Mars Express OMEGA: 1. Analysis of the 3 µm hydration feature. J. Geophys. Res. Planets 2007, 112, E8. [Google Scholar] [CrossRef] [Green Version]
  36. Orofino, V.; Blanco, A.; D’Elia, M.; Fonti, S.; Licchelli, D. Time-dependent degradation of biotic carbonates and the search for past life on Mars. Planet. Space Sci. 2009, 57, 632–639. [Google Scholar] [CrossRef]
  37. Brown, M.E.; Dollimore, D.; Galwey, A.K. Theory of Solid State Reaction Kinetics. Compr. Chem. Kinet. React. Solid State 1980, 22, 41–113. [Google Scholar]
  38. Britton, H.T.; Gregg, S.J.; Winsor, G.W. The calcination of dolomite. Part I.—The kinetics of the thermal decomposition of calcite and of magnesite. Trans. Faraday Soc. 1952, 48, 63–70. [Google Scholar] [CrossRef]
  39. Samtani, M.; Dollimore, D.; Alexander, K. Comparison of dolomite decomposition kinetics with related carbonates and the effect of procedural variables on its kinetic parameters. Thermochim. Acta 1991, 189, 135–145. [Google Scholar] [CrossRef]
  40. Hurst, H.J. The thermal decomposition of magnesite in nitrogen. Thermochim. Acta 1991, 392, 91–96. [Google Scholar] [CrossRef]
  41. Love, S.G.; Brownlee, D.E. Heating and thermal transformation of micrometeoroids entering the Earth’s atmosphere. Icarus 1991, 89, 26–43. [Google Scholar] [CrossRef]
  42. Vondrak, T.; Plane, J.M.; Broadley, S.; Janches, D. A chemical model of meteoric ablation. Atmos. Chem. Phys. 2008, 8, 7015–7031. [Google Scholar] [CrossRef] [Green Version]
  43. L’vov, B. The physical approach to the interpretation of the kinetics and mechanisms of thermal decomposition of solids: The state of the art. Thermochim. Acta 2001, 372, 97–124. [Google Scholar] [CrossRef]
  44. Longo, G.M.; Longo, S. Thermal decomposition of MgCO3 during the atmospheric entry of micrometeoroids. Int. J. Astrobiol. 2017, 16, 368–378. [Google Scholar] [CrossRef]
  45. Longo, G.M.; Longo, S. Theoretical analysis of the atmospheric entry of sub-mm meteoroids of MgxCa1–xCO3 composition. Icarus 2018, 310, 194–202. [Google Scholar] [CrossRef]
  46. Bisceglia, E.; Longo, G.M.; Longo, S. Thermal decomposition rate of MgCO3 as an inorganic astrobiological matrix in meteorites. Int. J. Astrobiol. 2017, 16, 130–136. [Google Scholar] [CrossRef]
  47. Atkins, P.; Paula, J. Physical Chemistry, 7th ed.; John Wiley&Sons, Inc.: Hoboken, NJ, USA, 2002. [Google Scholar]
  48. Chase, M.W., Jr. NIST-JANAF Thermochemical Tables, Fourth Edition. Phys. Chem. Ref. Data Monogr. 1998, 9, 1–1951. [Google Scholar]
Figure 1. Granulometric distribution of magnesite sample with a nominal grain size of 20 ÷ 50 µm.
Chemistry 04 00039 g001
Figure 2. SEM image at 500× of magnification (left panel) and EDS spectrum of magnesite sample with a nominal grain size range 20 ÷ 50 µm.
Chemistry 04 00039 g002
Figure 3. Transmittance spectra of magnesite samples warmed at different temperatures. Dotted lines at 1000 and 1250 cm−1 indicate the range where the D parameter is calculated.
Chemistry 04 00039 g003
Figure 4. Comparison between experimental measurements, the χ g r a v i m e t r y (black triangles) and χ s p e c t r o s c o p y (red dots) at different temperatures, and theoretical curves at different values of ΔH (indicated in the legend). Th error bars associate with temperatures and values of χ g r a v i m e t r y are within the size of the dots.
Chemistry 04 00039 g004
Publisher’s Note: MDPI stays neutral with regard to jurisdictional claims in published maps and institutional affiliations.

