Abstract
The development of biodegradable materials as food packaging material is important not only due to the reduction in environmental pollution but also because of an improvement in the functionality. Rice husk-reinforced biopolymers have offered a possible solution to waste-disposal problems associated with traditional petroleum-derived plastics. Rice husk-reinforced low density polyethylene (LDPE)-based biocomposites have been of great interest for their use as food packaging material. In this work, the LDPE/RH biocomposites with different rice husk (RH) content (10, 20, 30, 40 and 50 wt.%) were prepared by the melt mixing process in a laboratory Brabender mixer. The effect of RH content on the physical, thermal and mechanical properties of LDPE was investigated. More importantly, this work aimed to research the biodegradation of the LDPE/RH biocomposites as well as their effect on ‘Granny Smith’ apples’ respiration. The results showed that the incorporation of RH into the LDPE decreased the thermal stability of LDPE, increased water vapour permeability and water absorption, and increased the degree of crystallinity. The incorporation of RH increased the biodegradability of LDPE as well as the postharvest quality of ‘Granny Smith’ apples. The addition of RH in LDPE film significantly decreased fruit respiration and increased firmness as compared to LDPE film. The composting results showed that after the LDPE/RH biocomposite films were biodegraded for 21 days, the biocomposite films with the highest content of rice husks were the most degraded.
1. Introduction
Nondegradable polymers are the most popular food packaging materials but can cause a severe environmental problem. The increased presence of plastic waste, mainly derived from synthetic polymers obtained from the petrochemical industry, is a significant source of contamination [1], and has potential to damage plants, animals and humans due to the emission of harmful substances such as dioxins [2]. To reduce these environmental problems, many studies have focused on the development of biodegradable and compostable packaging systems [3,4,5]. In recent decades, biopolymers have received considerable attention in the packaging industry, especially as an alternative to the petroleum-based polymers in the food packaging sector, due to their biodegradability, biocompatibility, renewability and abundance of resources [6,7]. Used packaging materials produced from biopolymers can be disposed as biological waste that is further degraded to biomass, carbon dioxide, methane and water [8]. Biodegradable polymers or biopolymers are polymers obtained from biomass that are found in nature as parts of plants (cellulose, rice husks, starch, alginates, lignin, natural rubber) or animals (proteins, wool, silk, collagen, casein), i.e., natural polymers [9,10]. The incorporation of natural filler into a polymer matrix has been found to be helpful in the biodegradation of the composite materials [11]. Natural fillers are usually referred to as having several benefits over synthetic fillers such as availability, low cost, low density, acceptable modulus–weight ratio, high acoustic damping, low manufacturing energy consumption, low carbon footprint and biodegradability [12]. Rice (Oryza sativa L.) is a primary source of food and has become the world’s second most important cereal crop. Rice husk (RH) occurs in huge quantities as a by-product of rice processing and is an agricultural waste that cannot be incinerated due to ash, harmful gases and fumes that contribute to air pollution [13]. Therefore, this material should be recycled through industrial use. RH can be applied as a natural reinforcement material in the production of biocomposites due its biodegradability, availability and low price [1,14,15]. The exploitation of RH residues in biocomposites offers multiple advantages, for example, reducing the relative amount of constituents derived from synthetic polymers, such as resin polymers and some additives [13]. Besides its use as a filler in food packaging materials, RH can be used as a fuel, for activated carbon capture, polishing particles, cleaning agents and catalysts for water treatments. RH is used in many industries, as reviewed by Suhot et. al. [13], which strengthens its importance and versatility. RH consists of cellulose, hemicelluloses, lignin and silica. For the preparation of biocomposites based on rice husks as a natural reinforcement, the most widely used polymers are polyethylene (PE), polypropylene (PP) and polyvinyl chloride (PVC). Polyethylene (PE) is one of the most widely used thermoplastics in the world because of its good properties such as toughness, excellent chemical inertness, low coefficient of friction, ease of processing and low electrical conductivity. Low density polyethylene (LDPE) is a branched, flexible thermoplastic with low tensile and compressive strength because of the irregular packing of polymer chains. LDPE is used in food packaging materials, rigid containers and plastic film applications such as plastic bags and film wraps. The incorporation of RH aims to serve as a biodegradable filler for LDPE and to produce eco-environmental composites. Biodegradable composites for food packaging application are of interest today to minimize the drawbacks of synthetic plastics. Composting is a biochemical process converting various components in organic wastes into stable humus suitable for use as a soil amendment or organic fertilizer and can provide sufficient sanitation effect [16]. The biodegradation process conducts mesophilic and thermophilic microorganisms (bacteria and fungi) under an aerobic process that is present in soil, water, air, and in substrates for composting [17]. The composting process is shown by Equation (1):
During the composting process, four phases are exchanged: (1) the mesophilic phase (21–48 °C), (2) thermophilic phase (45–68 °C), (3) second mesophilic phase and (4) maturation phase [18,19]. For the composting process, the second phase is the most important because, in that phase, large organic molecules are broken into small molecules. The duration of the individual phases depends on the substrates and the systems in which the composting process is conducted. In this paper, LDPE/RH biopolymers were prepared from low density polyethylene (LDPE) and powder rice husks (RH). The effect of the different RH content (10–50 wt.%) on the physical, thermal and mechanical properties as well as the biodegradation of LDPE/RH biocomposites was studied. The LDPE/RH biocomposites were well characterized using dynamic mechanical analysis to study the effect of the RH content on viscoelastic behavior.
In addition, the effectiveness of LDPE/RH biocomposites on the quality of Granny Smith apples, postharvest, during 6 days at room temperature was investigated. The results indicate that the percentage of RH plays an important role in the final properties of the LDPE/RH biocomposites. The present work will be practically significant to the further research on the analysis of other indicators (antioxidants, vitamins and other quality indicators) to better assess the usability of this type of biocomposites in fruit packaging.
2. Materials and Methods
2.1. Materials
Low density polyethylene (DOWTM LDPE 150 E), with an MFR of 0.25 g/10 min. at 190 °C (ISO 1133) and density of 0.921 g/cm3 (ASTM D 792) was purchased in the pellet form from Dow Chemical Company, Midland, MI, USA. The rice husks (rice cultivar was ‘Sant Andrea’, Oryza sativa L. ‘Sant Andrea’, Italy) were used as natural reinforcement (Kocani, Macedonia). For the composting experiments, a mixture of tobacco waste (TW) and olive waste (OW) was used as a composting substrate. TW was generated in the course of tobacco production in the tobacco factory, TDR d.d., Rovinj, Croatia. The TW product was composed of very fine powdery residues, leaf stalks and wet leaf parts with an average moisture content of approximately 75 wt.%. The freshly collected TW was dried in the laboratory by natural convection and stored in a dry place until use in the experiments. The OW product was generated in the course of olive oil production in the olive oil factory, Agrolaguna, Istria, Croatia. The pH value and moisture content of the waste product were 5.55 and 58 wt.%, respectively. To avoid any kind of degradation, the fresh OW was kept in a freezer at −18 °C until used in the experiments.
The RH were chopped to small size in IKA-WERKE M20 mixer and dried in an air-circulating oven at 105 °C for 24 h to remove moisture prior to mixing with LDPE. All LDPE/RH biocomposites under different RH content (10, 20, 30, 40 and 50 wt.%) were prepared by melt blending in the Brabender kneading chamber at 170 °C for 5 min (screw rotation speed was 60 rpm). The resulting LDPE/RH biocomposites were then hot-pressed into films by using a hydraulic press Fontune, Holland (SRB 140, EC 320 × 320NB) at temperature of 140 °C for 5 min, under the pressure of 25 kPa, for further tests. The films of biocomposites are displayed in Figure 1.

Figure 1.
Digital photographic images of (1) neat LDPE, (2) LDPE + 10 wt % RH, (3) LDPE + 20 wt % RH, (4) LDPE + 30 wt % RH, (5) LDPE + 40 wt % RH and (6) LDPE + 50 wt % RH.
An Olympus model BX50 light microscope (Olympus Optical Co. Ltd., Tokyo, Japan) with an Olympus digital camera was used for microscopic analysis of the neat LDPE and LDPE/RH films with different RH content, Figure 2.
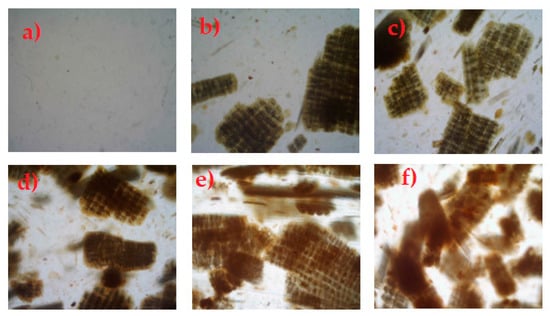
Figure 2.
Optical micrographs of (a) neat LDPE, (b) LDPE + 10 wt % RH, (c) LDPE + 20 wt % RH, (d) LDPE + 30 wt % RH, (e) LDPE + 40 wt % RH and (f) LDPE + 50 wt % RH.
Comparing the images of neat LDPE film (Figure 2a) with that of LDPE/RH biocomposites, we can see that as the concentration of RH increases the phase separation and agglomeration occurs in LDPE/RH biocomposites, especially at a higher RH content.
2.2. Details of Apple Respiration Measurement
The fruit samples of apples (Malus x domestic Borkh, ‘Granny Smith’) were obtained from an orchard in Baštica near Kašić (Zadar County). Fruits were harvested in the optimal maturity stage for storage and transported to the laboratory of Department of Pomology, University of Zagreb within 24 h. For each film, 5 healthy fruits, uniform in weight (total sample mass about 900 g) and shape, were placed in 3500 mL glass jar together with the electrochemical CO2 sensor [20]. The jar was sealed with a film secured on the edge by an electrically insulating adhesive tape to achieve airtightness as shown in Figure 3. Respiration was measured for 6 days at room temperature conditions.
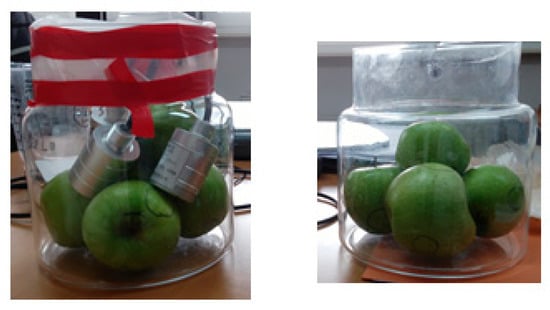
Figure 3.
Photographs of jar with ‘Granny Smith’ apples sealed with an LDPE film for respiration measurement.
2.3. Particle Size Distribution of Rice Husks
Particle size distribution (PSD) of rice husks was determined successfully in dry mode using sieve analysis (ASTM E11-95). Averaged PSD is expressed based on mass, with characteristic mean diameter, d3, 2 and reported via differential distribution function, dQ3 (d). Used sieves and corresponding size intervals are shown in Table 1.

Table 1.
Used size intervals, i.
2.4. Characterization
2.4.1. The Film Thicknesses
The film thickness was measured by using a Digital Micrometer, Mitutoyo, no. 393–340–30, with measurement range of 0–25 ± 0.001 mm. The results were expressed as the average value of three random measurements taken on each sample.
2.4.2. Water Vapour Permeability (WVP)
The water vapour permeability was determined according to DIN standard in Herfeld apparatus. The Herfeld apparatus consists of a glass container with a metal cover that has a circular opening of 36 mm diameter. A total of 50 cm3 of water was added to the glass container, and the circular opening was covered and sealed with the film sample. The glass container was then placed in a desiccator with 97% sulfuric acid at room temperature. The mass of the glass container with the film and water was weighed at the beginning of the test and after time intervals of 24 h and 48 h. Water vapour permeability for three specimens of each sample was calculated using following equation
where w0 is the weight of the glass container with water and film at the beginning of the test; w2 is the weight of the glass container with water and film after 24 h; w3 is the weight of the glass container with water and film after 48 h.
2.4.3. Water Absorption Test
For water absorption (WA) test, the thin film samples were dried overnight in a vacuum oven (80 °C). Dried films were weighed immediately after being taken from the vacuum oven and then immersed in distilled water for 10, 20, 30, 40, 50 and 60 days at 25 °C. After immersion in distilled water, the samples were removed from water, wiped with tissue paper to remove excess water and weighed. The percent of water absorption is calculated using the following equation
where, W0 and Wf are the weight of the samples before and after immersion in water (g), respectively. Triplicate of each samples were carried out for water absorption test.
2.4.4. Thermogravimetric Analysis
Thermal stability and decomposition of LDPE and LDPE/RH biocomposites were measured by DTA/TG instrument (STA NETZSCH Jupiter 449TGA, Selb, Germany). Samples of approximately 10 mg were heated from 25 to 600 °C at a heating rate of 20 K min–1 in the argon atmosphere (60 mL min−1).
2.4.5. Differential Scanning Calorimetry (DSC)
DSC studies were carried out on a DSC instrument (Mettler Toledo DSC 822e) with a heating/cooling rate of 10 °C min−1 under a nitrogen atmosphere (40 mL min−1). Samples (approximately 10 mg) were first heated from 25 °C to 150 °C, held at 150°C for 10 min. to erase any previous thermal history, then cooled from 150 °C to −100 °C and heated again to 150 °C. The Tm, Tc and ΔHm were determined from the second heating cycle. The melting enthalpies from the second heating cycle were used to calculate the degree of crystallinity (χc) of the neat LDPE and LDPE/RH films according to the following equation
where ∆Hm0 is melting enthalpy read from the surface of melting endotherm (J/g), ∆Hm100 is melting enthalpy of 100% crystalline LDPE (290.0 Jg−1) [21,22].
2.4.6. Viscoelastic Properties
Viscoelastic properties, including loss modulus, E’’, and storage modulus, E’, were determined using DMA 983 (TA Instruments, New Castle, DE, USA). Dynamic mechanical properties were measured from −100 °C up to 150 °C at heating rate of 3 °C min−1, frequency of 1 Hz and amplitude of 0.3 mm. The cooling was conducted under liquid nitrogen.
2.4.7. Mechanical Properties
The mechanical properties (tensile strength (σ) and elongation at the break (ε)) of the LDPE/RH biocomposites films were determined on a universal mechanical testing instrument, Textechno Statement M, for standard tensile tests in compliance with ISO 13934_1. The tests were carried out at temperature of 25 °C, relative humidity of 70%, strain rate of 10 mm/min and distance between the machine jaws of 75 mm. The samples were cut into pieces (100 × 10 mm) the tests were carried out five times for each sample and the results were shown as average.
2.4.8. Analysis of Apple Fruits
The analysis of the fruits was made immediately after delivery to the laboratory and after 6 days storage at room temperature (shelf life, SL) on a sample of 5 healthy and uniform fruits. The firmness of the fruit was measured by Effegi FT 307 penetrometer (Effegi Electronica, Turin, Italy) fitted with an 11.1 mm probe on 4 places at equatorial fruit zone. Soluble solids content (SSC) was measured by a digital refractometer ATAGO 3810 PAL-1 (ATAGO, Tokyo, Japan) and titratable acidity (TA) was determined by titration with 0.1 N NaOH. Weight loss is determined from the difference in weight before and after treatment and is expressed in % [23].
2.4.9. Composting Process
The composting of tobacco and olive waste was conducted in a closed thermally insulated cylindrical stainless steel reactor with effective volume (Vr) of 1 L for 21 days. Three different experiments, P1, P2 and P3, were performed. In experiments P1 to P3 the same composting mixture of TW and OW (Table 2) was used but the different mixture of LDPE and rice husks were added. In experiments P1, P2 and P3 the mixtures were added as follows: P1, LDPE and mixture of LDPE and 30 wt.% of RH; P2, mixture of LDPE and 10 wt.% and 40 wt.% of RH; P3, mixture of LDPE and 20 wt.% and 50 wt.% of RH, respectively. The composting mass, dry matter of substrate [24], volatile matter of substrate [25], C/N ratio [25] and the mass of LDPE and mixture of LDPE with different content of RH were determined at the beginning and at the end of composting process. Temperature and pH value were monitored during the composting process and the concentration of evolved CO2 was analysed as well.

Table 2.
The initial conditions of composting process in experiments P1, P2 and P3.
3. Results and Discussion
3.1. Particle Size Distribution of Rice Husks
A profound study of the possibility of rice husk (RH) being able to act efficiently as a packaging material involves determination of its particle property distribution, viz. detection of the particle size distribution. Figure 4 reveals a relatively wide particle size distribution for the system studied. It is evident that rice particles are in the size range 0 up to 1700 μm with a great contribution of size intervals between 180 and 710 μm. Additionally, a calculated Sauter mean diameter (d3,2) of 560.53 μm discovers its dispersity state. Similar PSDs were found in previous studies on similar packaging material [26,27].
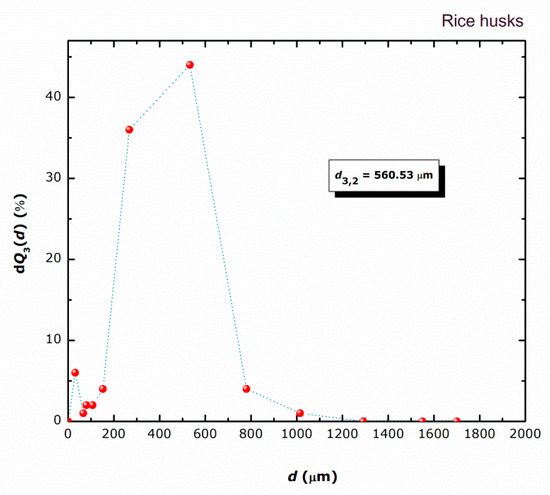
Figure 4.
Size distribution data for RH particles.
3.2. Thickness
The boundary properties of polymer materials used in food packaging or the packaging of other products are important since they are directly related to the product quality, thus, protection against oxygen, humidity, carbon dioxide and environmental light. Apart from water vapour resistance, temperature and humidity, the polymer film’s thickness is also important in the determination of the boundary properties. The average values of the LDPE/RH biocomposite films’ thicknesses are given in Table 3. As expected, the increase in the rice husk content in the film increases the composite films thickness.

Table 3.
Thickness of the LDPE/RH biocomposite films.
3.3. Water Vapour Permeability (WVP)
Water vapour permeability is an important parameter for the food packaging polymeric material. A disadvantage of polymeric packaging materials for fruit packaging applications is their low water vapor permeability (WVP) in contrast to food packaging derived from petroleum. Water vapour can penetrate through the polymeric packaging material to the packed content, which then has a bad influence on its quality. For example, the presence of water vapour in food can cause a growth of microorganisms and change its texture. Measurements of the water vapour permeability were performed for the neat LDPE and LDPE/ RH biocomposite films for water vapour leakage after 24 and 48 h. The results of the water vapour permeability are shown in Figure 5.
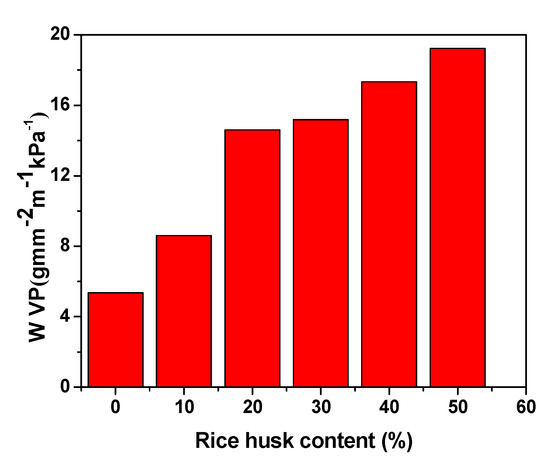
Figure 5.
Water vapour permeability of the LDPE/RH biocomposite films with respect to RH content.
The results showed that the WVP of the LDPE/RH biocomposite films increased compared to the neat LDPE film. Moreover, the WVP of LDPE/RH biocomposite films systematically increased with increasing RH content. The obtained results suggest that the incorporation of RH led to a reduction in the WVP for RH-reinforced LDPE films. This is possibly due to the hydrophilic nature of the RH particles and because of the chances of agglomeration at higher filler loading.
3.4. Water Absorption
Generally, water absorption provides an illustration of the weight of water that can be absorbed on the materials. Figure 6 shows the water absorption for LDPE/RH biocomposite films as a function of RH content. The LDPE is a hydrophobic polymer, and this is reflected in the small amount of water absorbed. When the filler reinforced polymers are exposed to moisture, the hydrophilic rice husks swell, which leads to the micro cracking of composites. As the composites crack, the capillarity becomes active and, hence, the water molecules are actively attracted to the interface. As can be seen from Figure 6, the percentage of water absorption of LDPE/RH biocomposite films increases with an increase in RH content. The main reason could be the increasing hydrophilicity of the biocomposites due to the forming hydrogen bonding between water and the hydroxyl group from RH particles. Therefore, the time required to reach the saturation point of water absorption was longer for composites with higher RH content.
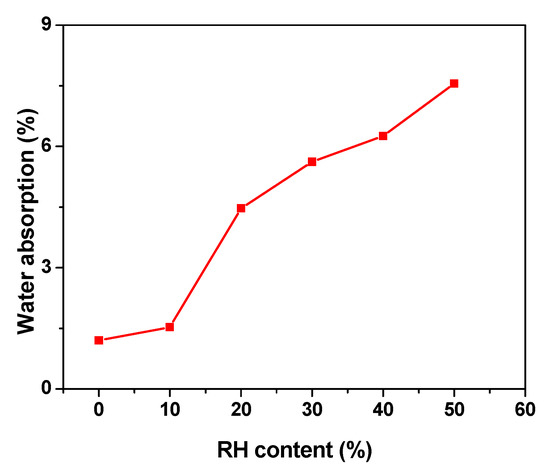
Figure 6.
Effect of various RH content on water absorption.
According to Kwon et al., hydroxyl groups tend to create hydrogen bonds with water (polar solvent) [28]. With increasing RH content, the adhesion between the RH and LDPE matrix decreased because of the presence of the high void content and RH–RH interactions. The experimental results of water absorption for LDPE/RH biocomposite films with respect to the time of immersion in distilled water are illustrated in Figure 7. The amount of water absorption increased with time of immersion up to 20 days for all LDPE/RH biocomposite films, and then gradually decreased when the saturation point was reached. The LDPE is a hydrophobic polymer, and this is reflected in the small amount of water absorbed. It is observed that the addition of hydrophilic RH particles increased the sensitivity of LDPE towards water due to the presence of RH polar groups and nature of the hydrophilic RH particles.
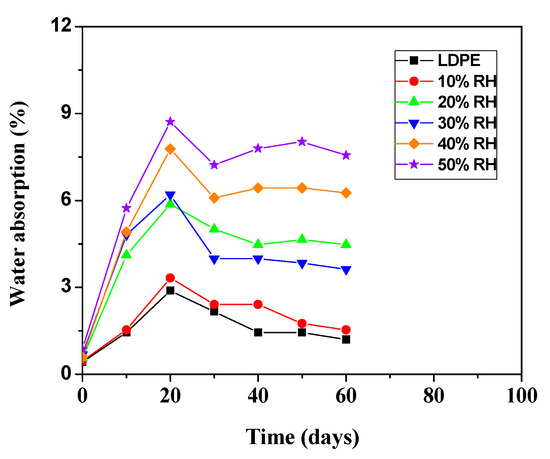
Figure 7.
Absorption of water at 60 days immersion in water for LDPE/RH biocomposite films.
3.5. Thermal Stability of the LDPE/RH Biocomposites
The thermal stability of LDPE/RH films was investigated by conventional TGA. The thermogravimetric (TG) and differential thermogravimetric (DTG) curves of the neat LDPE and RH under a nitrogen environment are shown in Figure 8. The three weight loss steps of thermal degradation were observed in TG curve for RH. The initial weight loss below 100 °C (peak I) was due to moisture evaporation and other volatile substances (about 6.2% weight loss). The second weight loss from 180 to 299 °C (peak II) was associated with a shoulder peak, corresponding to the thermal decomposition of hemicellulose and cellulose as a major organic component in the RH [29,30]. The third weight loss from 299 to 388 °C (peak III)) with weight loss of 38.7%, was associated with the degradation of lignin. According to Kwon et al. [28], the raw RH is comprised of 25–35% cellulose, 18–21% hemicellulose, 26–31% lignin, 15–17% silica, 2–5% of soluble components and 7.5% moisture. At 600 °C the high residual mass was observed around 36%, which is mainly the noncombustible silica.

Figure 8.
TGA curves of the neat LDPE and RH at a heating rate of 10 °C min–1.
The initial weight loss of the neat LDPE occurred in a single stage of degradation from 458 to 504 °C. According to Kim et al., the thermal degradation of LDPE can take place through random chain scission and a radical chain mechanism [31]. The radical mechanism for polyethylene involves the formation of free radicals and abstraction of hydrogen from the polymer chains leading to a molecular weight decrease and, finally, to the formation of volatile products. Polyethylene decomposes into a large number of paraffinic and olefinic compounds without residue [32]. Figure 9 shows the TG of the neat LDPE and LDPE/RH biocomposites, while Table 4 depicts the thermal decomposition data of all samples, including initial degradation temperature (T0), end temperature (Tend) and the percentage residue at 600 °C.
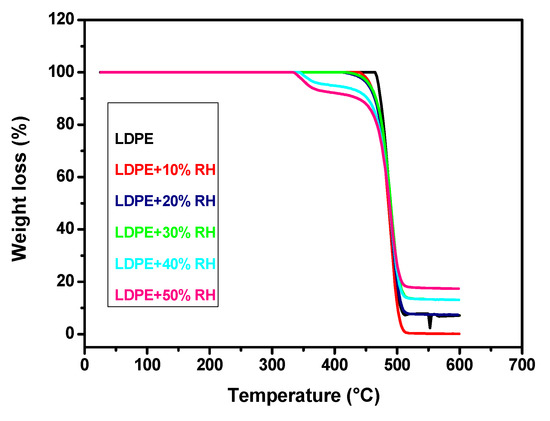
Figure 9.
TG curves of the neat LDPE and LDPE/RH biocomposites containing different RH content at a heating rate of 10 °C min–1.

Table 4.
TGA results for the neat LDPE and LDPE/RH biocomposites.
According to Figure 9, two steps of degradation were observed in TG curves for LDPE/RH biocomposites, the first step of degradation was due to the degradation of RH, while the second step of degradation was due to the decomposition of the neat LDPE. It can be seen from Table 4 that T0 decreases with the increase in RH content. When the RH content increased, the thermal stability of the LDPE/RH films decreased compared to the neat LDPE, which is due to the lower thermal stability of RH compared with the neat LDPE. The introduction of RH resulted in no significant change in the Tend. The value of the residual at 600 °C of LDPE/RH films increased with increasing RH content, and it was related to the high silica content of RH.
3.6. Differential Scanning Calorimetry Analysis of the LDPE/RH Biocomposites
DSC is the most widely used analytical tool to study polymer’s thermal properties. Figure 10 shows the heating thermograms for the neat LDPE and LDPE/RH films with different RH content. The melting temperature (Tm) and melting enthalpy (ΔHm) obtained from DSC curves are summarized in Table 5. The DSC thermogram of LDPE displays a single melting peak located at 110.3 °C, which is due to the melting of the crystalline phase of LDPE [33]. It seems that the Tm of LDPE tends to increase with increasing RH content. This increase in the Tm for LDPE crystalline phase may be due to more crystallites being formed in the LDPE/RH films because of the crystalline nature of RH acting as a nucleating agent. The degree of crystallinity (χc) of the pure LDPE and LDPE/RH films was calculated using Equation (4). The introduction of RH simultaneously increased the χc of the pure LDPE film (Table 5), suggesting that RH, which acts as a crystallization nucleation agent, induced the crystallization of LDPE probably due to the increase in the crystal phase fraction derived from the crystal structure of cellulose present in RH.
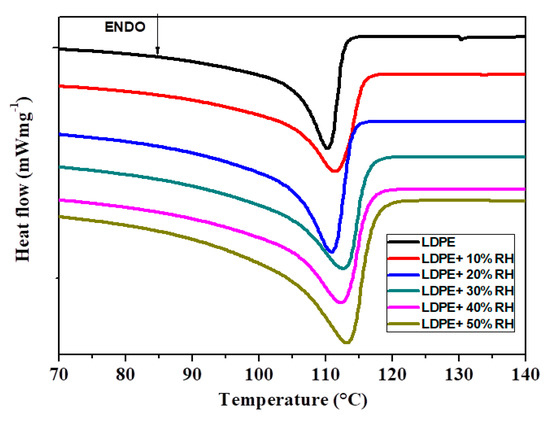
Figure 10.
Melting behaviour of the neat LDPE and LDPE/RH biocomposites recorded during heating by 10 °C/min.

Table 5.
Results of DSC measurement for the neat LDPE and LDPE/RH biocomposites.
The DSC curves of the neat LDPE and LDPE/RH biopolymers during the cooling cycle are shown in Figure 11. The determined Tc values are listed in Table 5. The crystallization temperature of the LDPE film had slightly shifted to a lower temperature compared to the neat LDPE (99.3 °C) with the incorporation of RH. This behaviour might be due to the later initiation of crystallization with the incorporation of RH.
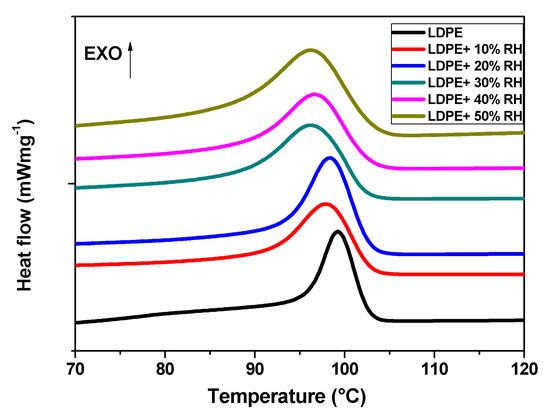
Figure 11.
Crystallization behaviour of the neat LDPE and LDPE/RH biocomposites recorded during cooling by 10 °C/min.
3.7. Viscoelastic Properties
Dynamic mechanical analysis was used to determine the viscoelastic properties, including loss modulus, E’’, and storage modulus, E’. Additionally, this measurement gives useful indications of the state of particle dispersion and interactions between polymer-filler particles. Generally, in biocomposites in which fibers are used as filler, the dynamic mechanical properties depend on the nature of the polymer and the interactions between the filler and the polymer matrix, as well as the nature of the dispersion and orientation of the filler. In order to evaluate the effect of the RH particles in the LDPE matrix, viscoelastic properties were measured. The loss modulus (E’’) curves as a function of temperature for the neat LDPE and LDPE/RH biocomposite are shown in Figure 12. According to Figure 12, all loss modulus curves exhibit one relaxation maximum, which is related to the glass transition temperature (Tg) of the LDPE amorphous phase. The intensity of the area under these peaks decreases in relation to RH content. This behaviour might be due to the decreasing LDPE concentration in the biocomposites. The glass transition temperatures, Tg, obtained from E” are shown in Table 6. The Tg of the LDPE/RH films was shifted to a higher temperature with the addition of RH. This increase in the Tg may be due to a decreased degree of chain mobility of the amorphous phase of LDPE as well as an interaction existing between the RH and LDPE. Moreover, as RH weight content increased, the mobility of the polymer chains decreased, and Tg increased.
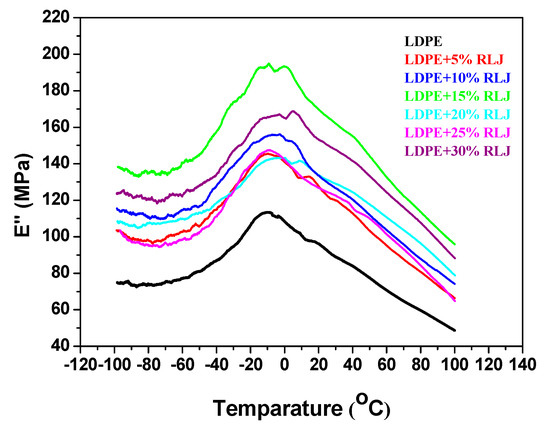
Figure 12.
Loss modulus (E’’) as a function of temperature of neat LDPE, and LDPE/RH biocomposites containing different RH content.

Table 6.
Results of DMA measurement for the neat LDPE and LDPE/RH biopolymers.
The small relaxation peak as a shoulder obtained around 50 °C corresponds to the αh transition related to the LDPE crystalline fractions [34]. Figure 13 shows the temperature dependence of the storage modulus (E’) of the pure LDPE and LDPE/RH biocomposites.
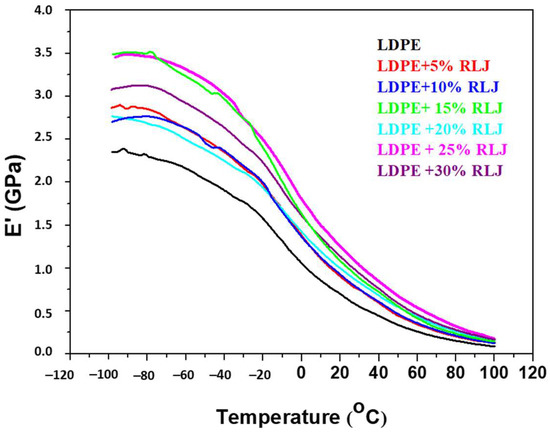
Figure 13.
Storage modulus (E’’) as a function of temperature of the neat LDPE and LDPE/RH biocomposites containing different RH content.
Generally, fibers improve the storage modulus or stiffness of polymeric materials. As the temperature increases, the polymeric materials soften, and the storage modulus drops sharply. Storage modulus values for the neat LDPE and LDPE/RH biocomposite at room temperature are given in Table 6. As shown in Figure 13 and Table 6, the addition of RH slightly increased the storage modulus of the LDPE/RH biocomposites compared to the neat LDPE. Moreover, by increasing the RH content, an improvement in stiffness was verified. This is the expected effect caused by the addition of more rigid fillers into semi-rigid polymer matrices. These results were also in good agreement with the DSC data for the degree of crystallinity (χc). The RH acted as a crystallization nucleation agent and, because of that, higher χc and stiffness of the LDPE/RH biopolymers was observed.
3.8. Mechanical Properties of the LDPE/RH Biocomposites
It is well known that the mechanical properties of reinforced polymer materials are affected by the distribution and the interactions between the particles of the filler and polymer matrix. Table 7 shows the effect of RH content on the tensile strength (σ) and elongation at the break (ε) of LDPE/RH biocomposites. Tensile strength decreases steadily with increasing RH content up to 30 wt %. This was attributed to two possible reasons, firstly, the poor interfacial bonding. The weak bonding between the hydrophilic filler and the hydrophobic matrix results in voids or weak points inside the biocomposites and, thus, causes the tensile strength to decrease when the RH content increases. Secondly, poor dispersion causes agglomeration of the fillers as well as decreasing the tensile properties, and RH–RH agglomeration occurs. As the degree of agglomeration increases, the RH–LDPE interaction become poorer resulting in such a decrement in the tensile strength. The cracks in the matrix can also become polymer weak places that will result in breakage. From the data presented in Table 7, it is also evident that the tensile strength of the LDPE/RH biocomposites slightly increased with increasing RH content (above 40 wt %).

Table 7.
Mechanical properties of the LDPE/RH biocomposites.
The effect of RH content on elongation at the break of LDPE/RH biopolymers is shown in Table 7. Elongation at the break showed a significant decrease with increasing RH content. According to Abu Bakar [35], because cracks travel through the weaker interfacial regions the composite fractures at lower values of elongation.
The reason for this result is similar to the case of the tensile strength, thus, agglomerations of the filler or less homogeneity of the RH and LDPE, causes voids or weak points inside the matrix [36]. Suhot et al. reported that the incompatibility between the hydrophilic matrix and hydrophobic filler reduces the mechanical properties of RH composites [13].
3.9. The Effect of LDPE and RH/LDPE Films on Respiration and Postharvest Quality of ‘Granny Smith’ Apples
Figure 14 shows respiration dynamics (cm3 CO2 g−1 fruit) of ‘Granny Smith’ apples during 6 days at room temperature, as affected by LDPE and LDPE 30% RH films. From the curve, it is evident that the respiration of the fruits under the RH-added film was significantly lower than that of the fruits under the neat LDPE film. This has not reflected on weight loss that was similar for both types of films but significantly differed from the control sample (Table 8).
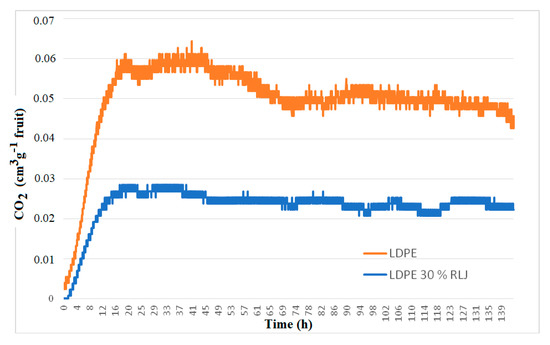
Figure 14.
Respiration dynamics of apples, ‘Granny Smith’, for 6 days at room temperature under the influence of LDPE and LDPE 30% RH films.

Table 8.
Quality of Apples. ‘Granny Smith’, postharvest and 6 days at room temperature under the influence of LDPE and LDPE films 30% RH (mean ± standard deviation).
The film type also did not affect soluble solids content, titratable acidity or SSC/TA ratio. SSC was statistically lowest in the fruits analysed at harvest (initial sample), but after six days at room temperature, these fruits had the highest SSC. This can be associated with the weight loss that was significantly the highest in the control sample. Therefore, the higher SSC in the control sample is the consequence of decreasing water content lost during the respiration process. Fruit firmness was significantly higher under the influence of RH-added film compared to the pure LDPE film but did not significantly differ from the values at harvest and in the control after 6 days. Fruit firmness is an important characteristic of the fruit quality that determines its storage capacity [37,38]. Therefore, preservation of firmness in fruits from the RH-added sample can be considered as an indicator of better storability and fruit quality. After 6 days, control fruits and fruits from the neat LDPE film sample had significantly lower TA, while all treatments had significantly higher SSC/TA ratios compared with values obtained at harvest (Table 8). Based on the obtained results, it can be concluded that the addition of RH in LDPE film significantly decreases fruit respiration, improving fruit firmness, quality preservation and storability. Research should be continued with the analysis of other indicators (antioxidants, vitamins and other quality indicators) to better assess the usability of this type of film in fruit packaging and therefore reducing food waste problems.
3.10. Results from Composting Process
Temperature is one of the most important parameters for maintaining the efficiency of the composting process. During composting, organic matter is decomposed at varying speeds at several temperature stages, in which specific microorganisms play a dominant role. From the Figure 15 and Table 9 in all experiment’s, temperature increased at day 7 and remained in a thermophilic phase till day 16. In this period, the biodegradation rate of organic matter and LDPE, and the mixture of LDPE and different contents of RH, was the highest (Figure 16). As the temperature started to decrease, the concentration of CO2 also decreased, which shows that the third phase of the composting process is near the end and the maturation phase has started. At the end of composting, a conversion of 40% was obtained in all experiments, the C/N ratio decreased due to biodegradation of the organic matter and the pH value increased due to ammonification of the substrate.
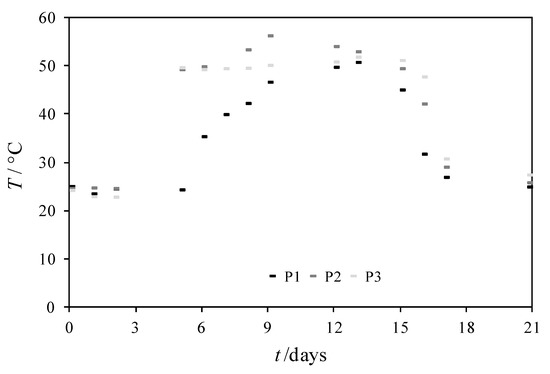
Figure 15.
Temperature changes in composting mass in experiments P1, P2 and P3 for 21 days.

Table 9.
Physical and chemical characterization of composting mass in experiment P1, P2 and P3 at the end of composting.
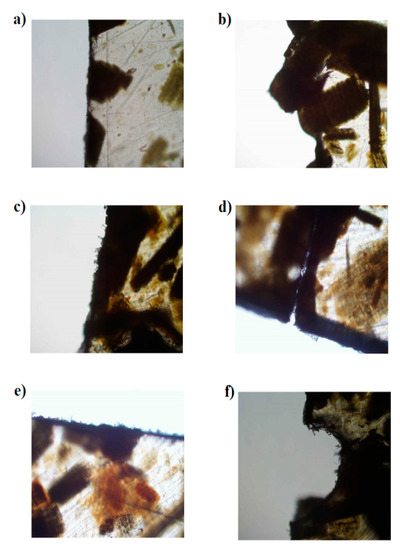
Figure 16.
Biodegradation of biopolymers during 21 days of composting process: LDPE + 10% RH (a) at the beginning of composting and (b) after composting process; LDPE + 40% RH (c) at the beginning of composting and (d) after composting process; LDPE + 50% RH (e) at the beginning of composting and (f) after composting process.
From Figure 16, LDPE with different contents of RH was biodegraded during 21 days of the composting process. At the beginning of the process, all materials had a proper and even edge; after composting the edge was degraded by microorganisms, which were present in the composting materials. The most degraded material was with the highest content of rice husks; a similar result to that obtained by Yin Yap et al., who found that the addition of 40% RH to the polymer made of the mixture of polybutylene succinate (PBS) and poly butylene adipate-Co-terephthalate (PBAT) successfully substitutes starch-based biodegradable polymer and significantly improves its biodegradability.
4. Conclusions
Biocomposites based on rice husks incorporated into low density polyethylene (LDPE) were successfully prepared by a laboratory Brabender mixer. It was observed that the incorporation and increasing of RH content into LDPE influenced the increase in the water vapour permeability of LDPE/RH biocomposite films. Experimental results showed that the addition of RH into LDPE tends to increase the water absorption of the LDPE/RH biocomposite films due to the increasing hydrophilicity of the biocomposites. The thermal stability of the prepared biocomposites was evaluated using TGA. Based on the results of the TGA, the thermal stability of the LDPE/RH biocomposites decreased as the RH content increased. This is a logical consequence of the lower thermal stability of the RH. Differential scanning calorimetric studies showed that the values of degree of crystallinity of LDPE increased with increasing RH content. According to the mechanical properties’ results, the tensile strength and elongation at the break of the LDPE/RH biocomposites decreased with the addition of and increasing RH content. Film type did not affect the soluble solids content, titratable acidity or SSC/TA ratio in ‘Granny Smith’ apples. The addition of RH in LDPE film significantly influenced the intensity of the respiration and firmness in ‘Granny Smith’ apples. The results obtained after the composting process showed that the LDPE/RH biocomposite films biodegraded during 21 days of composting process. The highest degradation was obtained in the film with the highest content of rice husks. The most degraded material was that with the highest content of rice husks. Based on the results in this work, biobased food packaging biocomposites made from LDPE and RH can be an interesting alternative for fruit packaging applications.
Author Contributions
Conceptualization, E.G.B.; Methodology, E.G.B., A.P., T.J., J.B., D.K.G., K.Z. and T.H.G.; Investigation, E.G.B., A.P., T.J., J.B., D.K.G., E.Z., K.Z. and T.H.G.; Formal Analysis, E.G.B., A.P., T.J., D.K.G., K.Z. and T.H.G.; Writing—Original Draft Preparation, E.G.B., T.J., D.K.G. and K.Z. Writing—Review and Editing, E.G.B.; Visualization, E.G.B. All authors have read and agreed to the published version of the manuscript.
Funding
This research received no external funding.
Institutional Review Board Statement
Not applicable.
Informed Consent Statement
Not applicable.
Data Availability Statement
Not applicable.
Acknowledgments
The authors gratefully acknowledge the University of Zagreb for the short-term financial support.
Conflicts of Interest
The authors declare no conflict of interest.
Sample Availability
Samples of the compounds are not available from the authors.
References
- Yap, S.Y.; Sreekantan, S.; Hassan, M.; Sudesh, K.; Ong, M.T. Characterization and Biodegradability of Rice Husk-Filled Polymer Composites. Polymers 2021, 13, 104. [Google Scholar] [CrossRef] [PubMed]
- Avella, M.; De Vlieger, J.J.; Errico, M.E.; Fischer, S.; Vacca, P.; Volpe, M.G. Biodegradable Starch/Clay Nanocomposite Films for Food Packaging Applications. Food Chem. 2005, 93, 467–474. [Google Scholar] [CrossRef]
- Jayaramudu, J.; Reddy, G.S.M.; Varaprasad, K.; Sadiku, E.R.; Ray, S.S.; Rajulu, A.V. Preparation and Properties of Biodegradable Films from Sterculia Urens Short Fiber/Cellulose Green Composites. Carbohydr. Polym. 2013, 93, 622–627. [Google Scholar] [CrossRef] [PubMed]
- Majeed, K.; Jawaid, M.; Hassan, A.; Bakar, A.A.; Abdul Khalil, H.P.S.A.; Salema, A.A.; Inuwa, I. Potential Materials for Food Packaging from Nanoclay/Natural Fibres Filled Hybrid Composites. Mater. Des. 2013, 46, 391–410. [Google Scholar] [CrossRef]
- Song, J.H.; Murphy, R.J.; Narayan, R.; Davies, G.B.H. Biodegradable and compostable alternatives to conventional plastics. Philos. Trans. Soc. B 2009, 364, 2127–2139. [Google Scholar] [CrossRef] [PubMed]
- Tang, X.Z.; Kumar, P.; Alavi, S.; Sandeep, K.P. Recent Advances in Biopolymers and Biopolymer-Based Nanocomposites for Food Packaging Materials. Crit. Rev. Food Sci. Nutr. 2012, 52, 426–442. [Google Scholar] [CrossRef]
- Petersen, K.; Nielsen, P.; Bertelsen, G.; Lawther, M.; Olsen, M.; Nilsson, N.; Mortensen, G. Potential of biobased materials for food packaging. Trend Food Sci. Technol. 1999, 10, 52–68. [Google Scholar] [CrossRef]
- Risch, S.J. Food packaging history and innovations. J. Agric. Food Chem. 2009, 57, 8089–8092. [Google Scholar] [CrossRef] [PubMed]
- Liu, W.; Misra, M.; Askeland, P.; Drzal, L.T.; Mohanty, A.K. ‘Green’ Composites from Soy Based Plastic and Pineapple Leaf Fiber: Fabrication and Properties Evaluation. Polymer 2005, 46, 2710–2721. [Google Scholar] [CrossRef]
- Muratore, G.; Del Nobile, M.A.; Buonocore, G.G.; Lanza, C.M.; Nicolosi Asmundo, C. The Influence of Using Biodegradable Packaging Films on the Quality Decay kinetic of Plum Tomato (Pomodorino Datterino). J. Food Eng. 2005, 67, 393–399. [Google Scholar] [CrossRef]
- Mohammed, L.; Ansari, M.N.M.; Pua, G.; Jawaid, M.; Islam, M.S. A Review on Natural Fiber Reinforced Polymer Composite and Its Applications. Int. J. Polym. Sci. 2015, 2015, 243947. [Google Scholar] [CrossRef] [Green Version]
- AL-Oqla, F.M.; Salit, M.S. Material selection of natural fiber composites. In Materials Selection for Natural Fiber Composites; Elsevier: Amsterdam, The Netherlands, 2017; pp. 107–168. [Google Scholar]
- Suhot, M.A.; Hassan, M.Z.; Aziz, S.A.; Md Daud, M.Y. Recent Progress of Rice Husk Reinforced Polymer Composites: A Review. Polymers 2021, 13, 2391. [Google Scholar] [CrossRef] [PubMed]
- Arjmandi, R.; Hassan, A.; Majeed, K.; Zakaria, Z. Rice Husk Filled Polymer Composites. Int. J. Polym. Sci. 2015, 2015, 501471. [Google Scholar] [CrossRef]
- Pode, R. Potential applications of rice husk ash waste from rice husk biomass power plant. Renew. Sust. Energy Rev. 2016, 53, 1468–1485. [Google Scholar] [CrossRef]
- Jeong, Y.K.; Kim, J.S. A new method for conservation of nitrogen in aerobic composting processes. Bioresour. Technol. 2001, 79, 129–133. [Google Scholar] [CrossRef]
- Mohee, R.; Unmar, G.D.; Mudhoo, A.; Khadoo, P. Biodegradability of biodegradable/degradable plastic materials under aerobic and anaerobic conditions. Waste Manag. 2008, 28, 1624–1629. [Google Scholar] [CrossRef] [PubMed]
- Peigne, J.; Girardin, P. Environmental impacts of farm-scale composting practices. Water Air Soil Pollut. 2004, 153, 45–68. [Google Scholar] [CrossRef]
- Hubbe, M.A.; Nazhad, M.; Sanchez, C. Composting as a way to convert cellulosic biomass and organic waste into high-value soil amendments: A review. BioResources 2010, 5, 2808–2854. [Google Scholar] [CrossRef]
- Xiang, W.; Qile, H.; Matetic, M.; Jemric, T.; Xiaoshuan, Z. Development and evaluation on wireless multi-gas-sensors system for improving traceability and transparency of table grape cold chain. Comput. Electron. Agric. 2017, 135, 195–207. [Google Scholar]
- Bair, H.E.; Gallagher, P.K.; Jaffe, M.; Khana, Y.P.; Maurer, J.J.; Pearce, E.M.; Prime, R.B.; Raucher, D.; Shalaby, S.W.; Wendlandt, W.W.; et al. Thermal Characterization of Polymeric Materials; Turi, E.A., Ed.; Academic Press: Orlando, FL, USA, 1981. [Google Scholar]
- Wunderlich, B. Thermal Analysis; Academic Press: Cambridge, MA, USA, 1990; pp. 417–431. [Google Scholar]
- Jemrić, T.; Pavičić, N.; Skendrović, M. Influence of thinning method on postharvest quality of ‘Golden Delicious Cl. B’ apple (Malus domestica Borkh.). Agric. Conspec. Sci. 2005, 70, 11–15. [Google Scholar]
- Austrian Standards Institute Austrian Standard. Analytical Methods and Quality Control for Waste Compost; ÖNORM S 2023: Vienna, Austria, 1986. [Google Scholar]
- Bremner, J.M. Nitrogen-total. In Methods of Soil Analysis. Part 3—Chemical Methods; Sparks, D.L., Page, A.L., Helmke, P.A., Loeppert, R.H., Soltanpour, P.N., Tabatabai, M.A., Johnston, C.T., Sumner, M.E., Eds.; American Society of Agronomy, Soil Science Society of America: Madison, WI, USA, 1996; pp. 1089–1108. [Google Scholar]
- Kang, S.H.; Hong, S.G.; Moon, J. The use of rice husk ash as reactive filler in ultra- high-performance concrete. Cem. Concr. Res. 2019, 115, 389–400. [Google Scholar] [CrossRef]
- Scarfato, P.; Avallone, E.; Galdi, M.R.; Di Maio, L. Incarnato: Preparation, characterization, and oxygen scavenging capacity of biodegradable-tocopherol/PLA microparticles for active food packaging applications. Polym. Compos. 2017, 38, 981–986. [Google Scholar] [CrossRef]
- Kwon, J.H.; Ayrilmis, N.; Han, T.H. Enhancement of flexural properties and dimensional stability of rice husk particleboard using wood strands in face layers. Compos. Part B Eng. 2013, 44, 728–732. [Google Scholar] [CrossRef]
- Shafizadeh, F. Pyrolysis and combustion of cellulosic materials. Adv. Carbohydr. Chem. 1968, 23, 419–474. [Google Scholar]
- Antal, M.J. Biomass pyrolysis: A review of the literature. Part 1—Carbohydrate pyrolysis. Adv. Sol. Energy 1983, 11, 61–111. [Google Scholar]
- Kim, H.S.; Yang, H.S.; Kim, H.J.; Park, H.J. Thermogravimetric analysis of rice husk flour filled thermoplastic polymer composites. J. Therm. Anal. Calorim. 2004, 76, 395–404. [Google Scholar]
- Chrissafis, K.; Paraskevopoulos, K.M.; Pavlidou, E.; Bikiaris, D. Thermal degradation mechanism of HDPE nanocomposites containing fumed silica nanoparticles. Thermochim. Acta 2009, 485, 65–71. [Google Scholar] [CrossRef]
- Toda, A.; Taguchi, K.; Nozaki, K.; Konishi, M. Melting behaviors of polyethylene crystals: An application of fast-scan DSC. Polymer 2014, 55, 3186–3194. [Google Scholar] [CrossRef]
- McCrum, N.G.; Read, B.E.; Williams, G. Anelastic and Dielectric Effects in Polymeric Solids; Wiley: London, UK, 1967; p. 358. [Google Scholar]
- Abu Bakar, A.; Hassan, A.; Mohd Yusof, A.F. Mechanical and Thermal Properties of Oil Palm Empty Fruit Bunch-Filled Unplasticized Poly (Vinyl Chloride) Composites. Polym. Compos. 2005, 13, 607–618. [Google Scholar] [CrossRef]
- Prachayawarakorn, J.; Yaembunying, N. Effect of Recycling on Properties of Rice Husk Fill Propylene. J. Sci. Technol. 2005, 27, 343–352. Available online: http://www.thaiscience.info/Journals/Article/SONG/10462545.pdf (accessed on 8 October 2021).
- Dobrzański, B.; Rabcewicz, J.; Rybczyński, R. Handling of Apple: Transport Techniques and Efficiency Vibration, Damage and Bruising Texture, Firmness and Quality, B.; Dobrzański Institute of Agrophysics of Polish Academy of Science: Lublin, Poland, 2006. [Google Scholar]
- García-Ramos, F.J.; Valero, C.; Homer, I.; Ortiz-Cañavate, J.; Ruiz-Altisent, M. Non-destructive fruit firmness sensors: A review. Span. J. Agric. Res. 2005, 3, 61–73. [Google Scholar] [CrossRef]
Publisher’s Note: MDPI stays neutral with regard to jurisdictional claims in published maps and institutional affiliations. |
© 2021 by the authors. Licensee MDPI, Basel, Switzerland. This article is an open access article distributed under the terms and conditions of the Creative Commons Attribution (CC BY) license (https://creativecommons.org/licenses/by/4.0/).