
Magnetomechanical Stress-Induced Colon Cancer Cell Growth Inhibition

 , , and
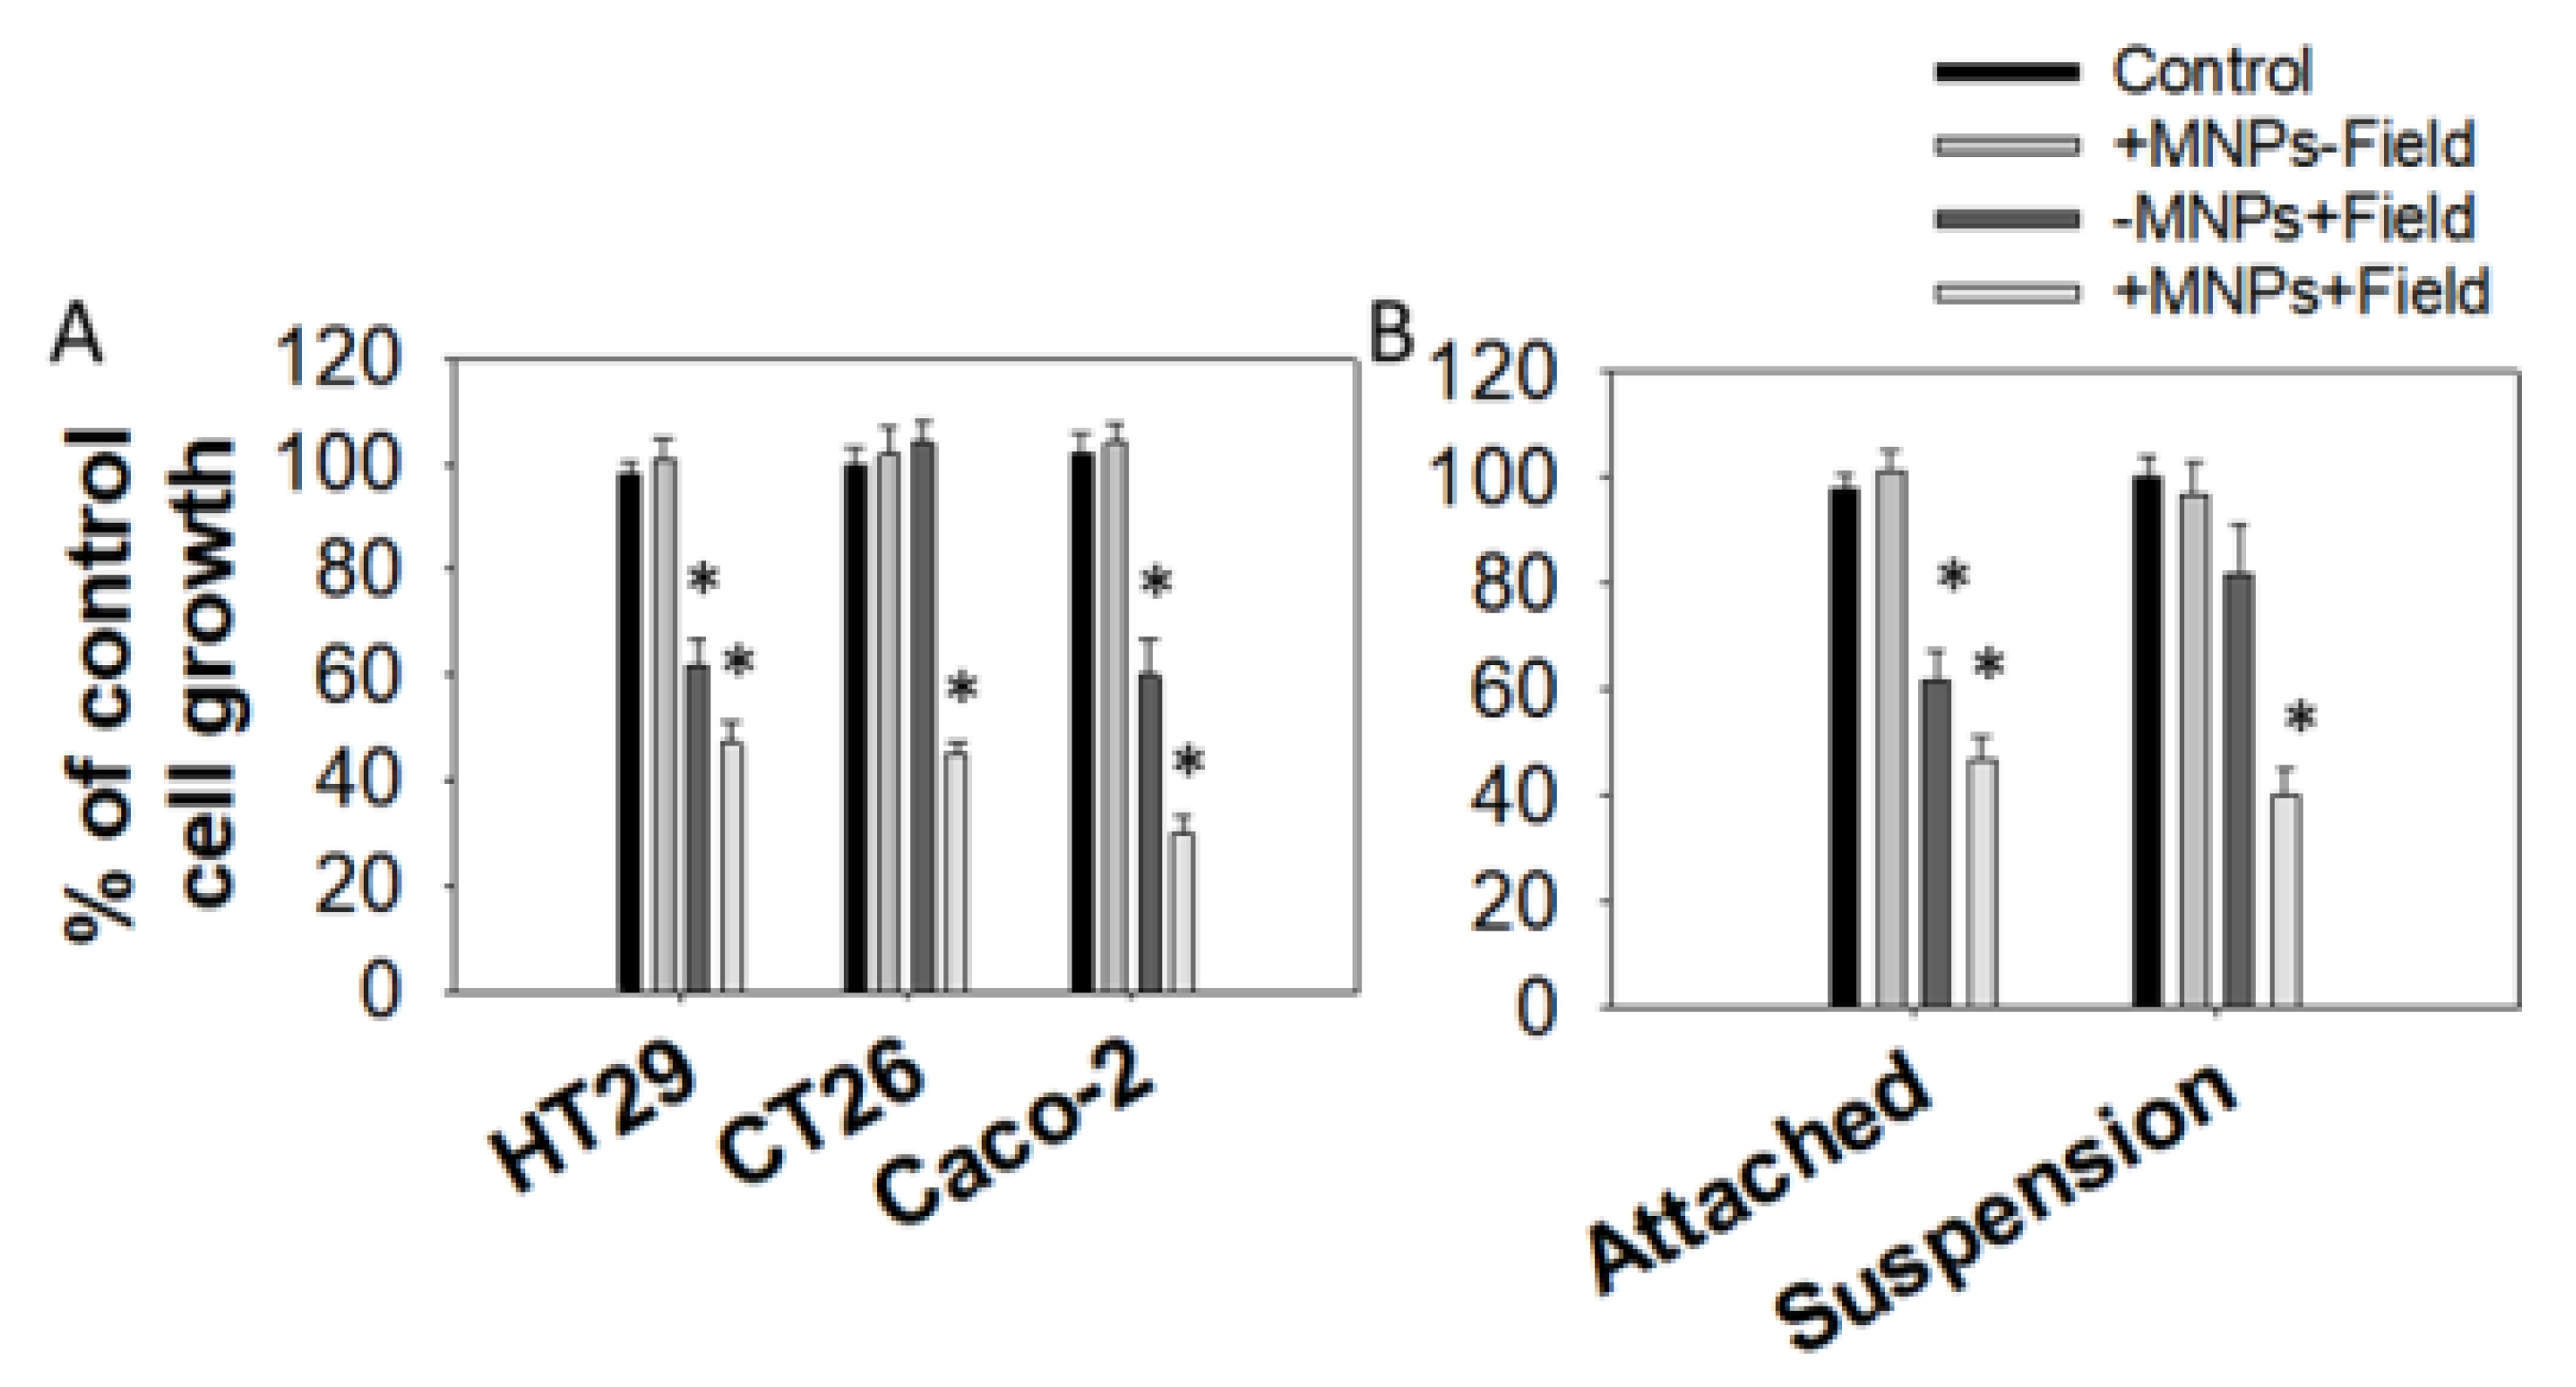
Abstract
:1. Introduction
2. Materials and Methods
2.1. Materials
2.2. Cell Lines
2.3. MNPs Treatment and Magnetic Field Exposure
2.4. Cell Growth Assay
2.5. Fluorescence Microscopy
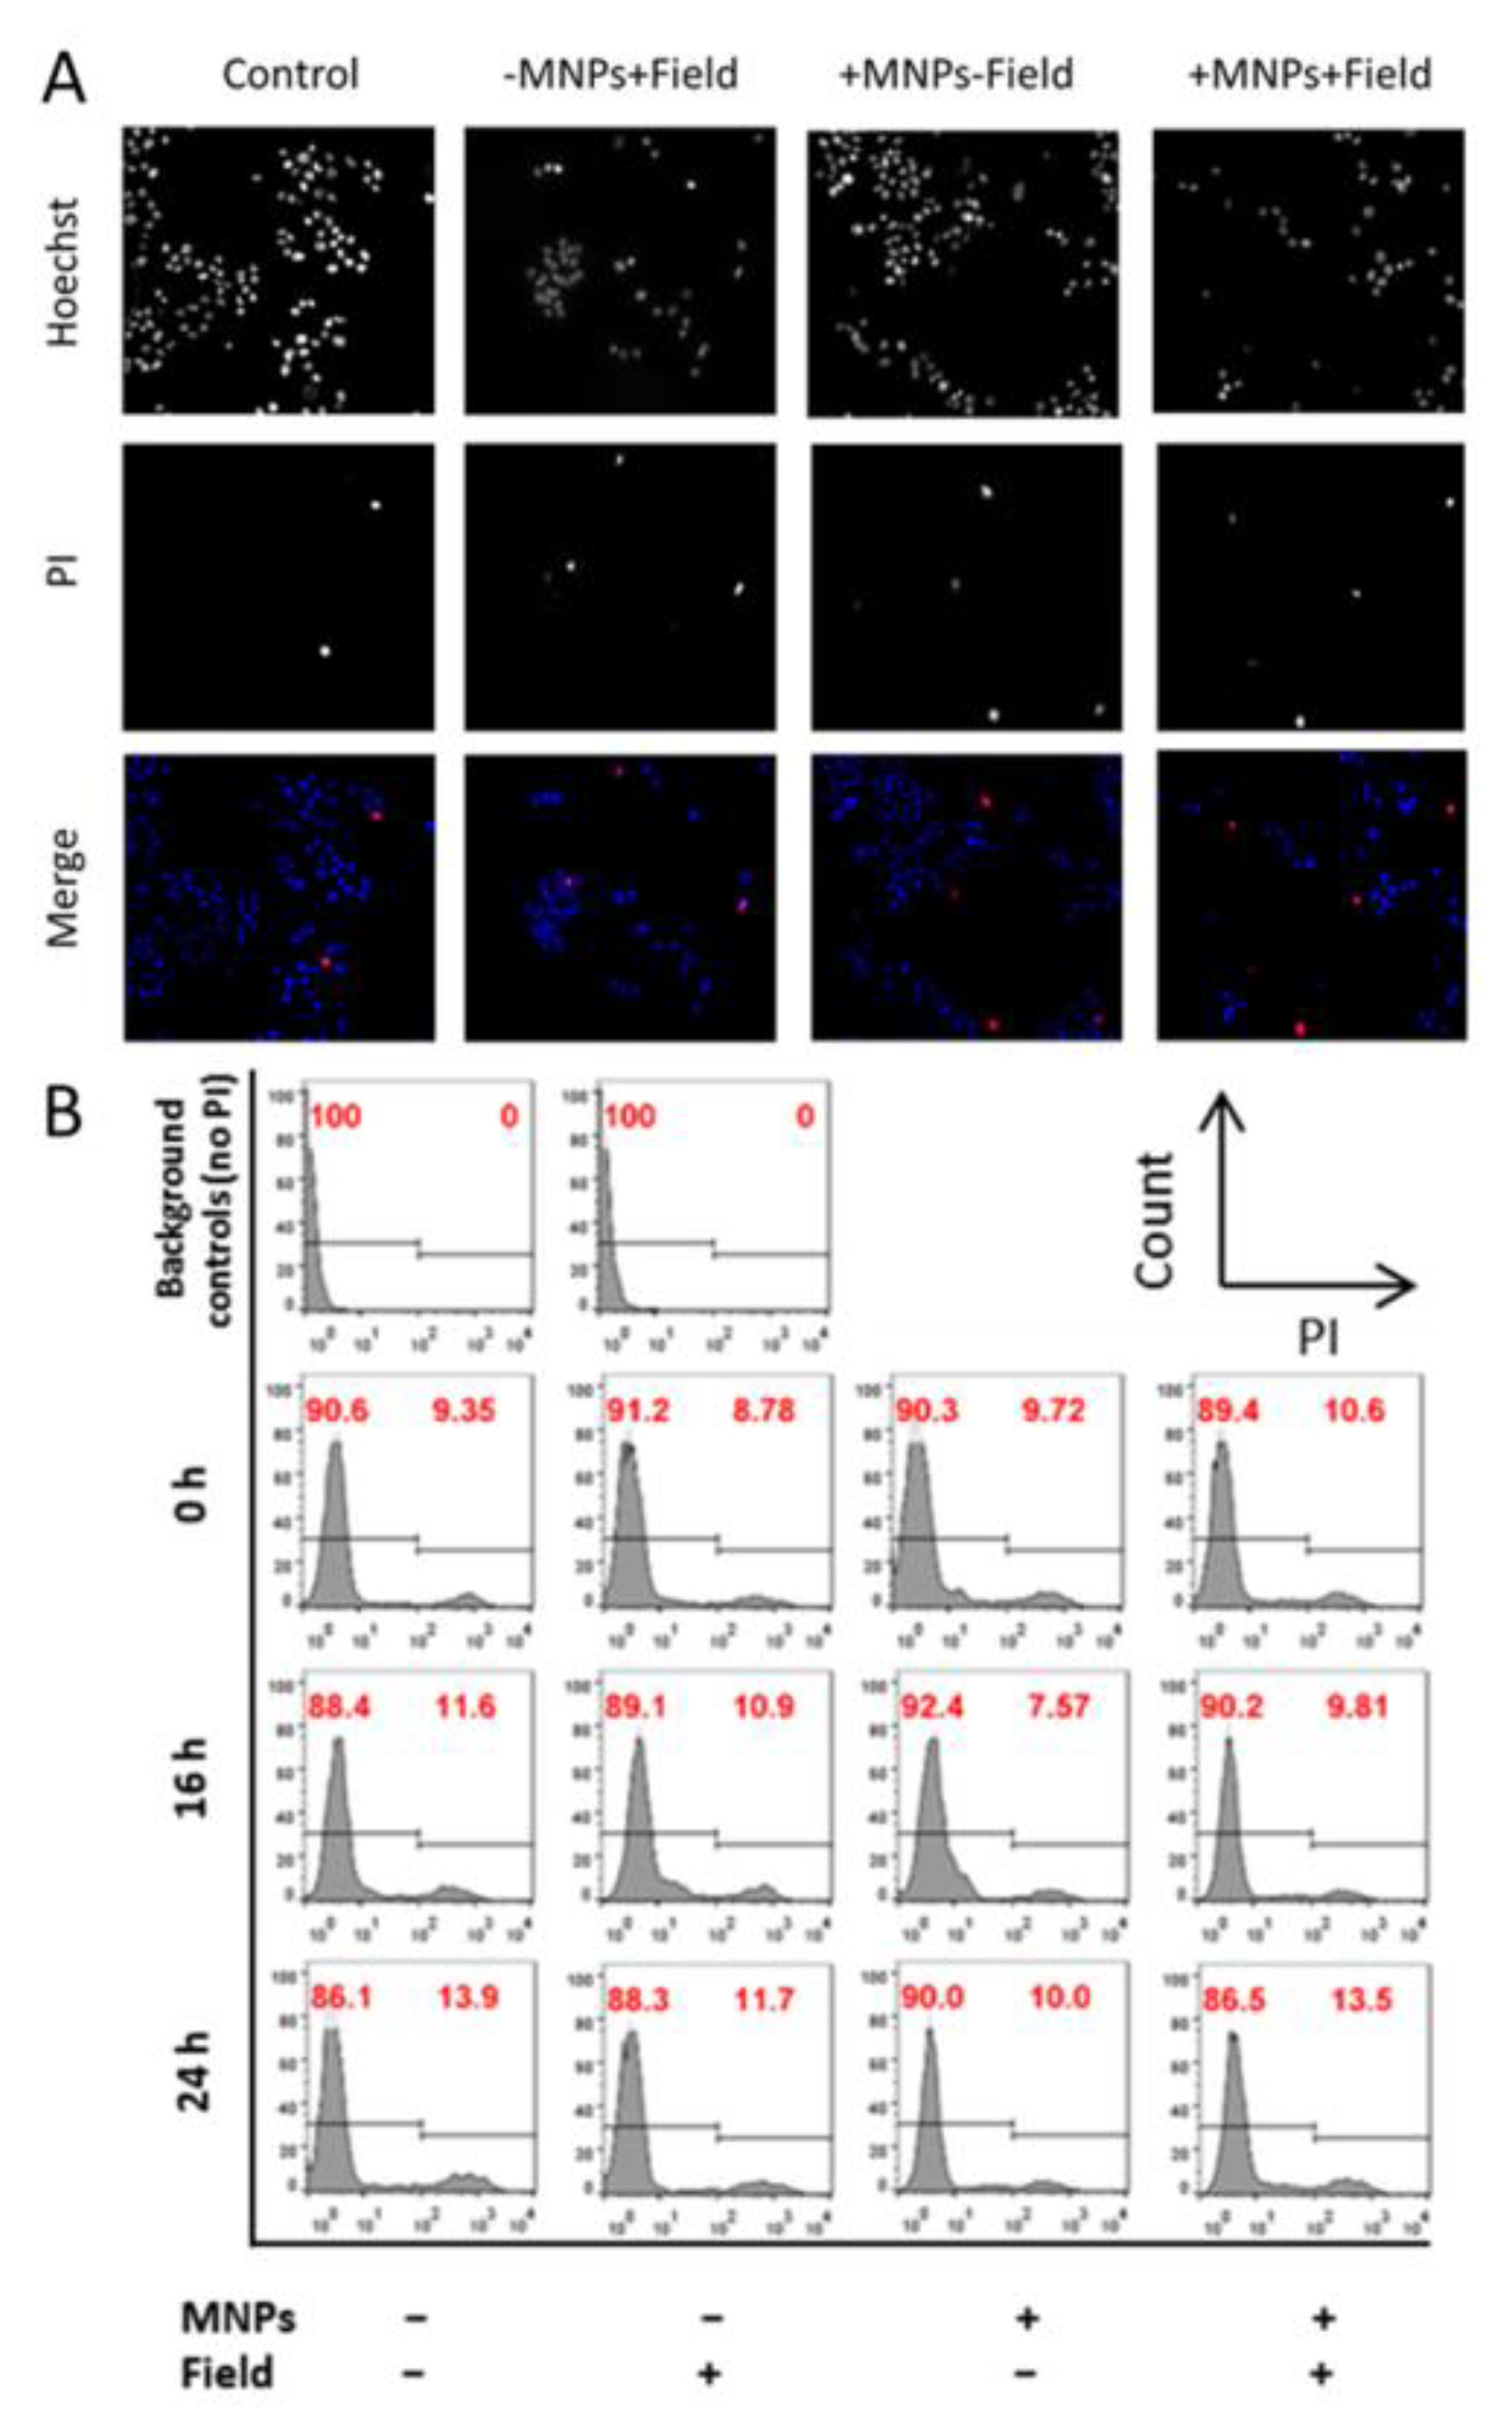
2.6. Assessment of Cell Death
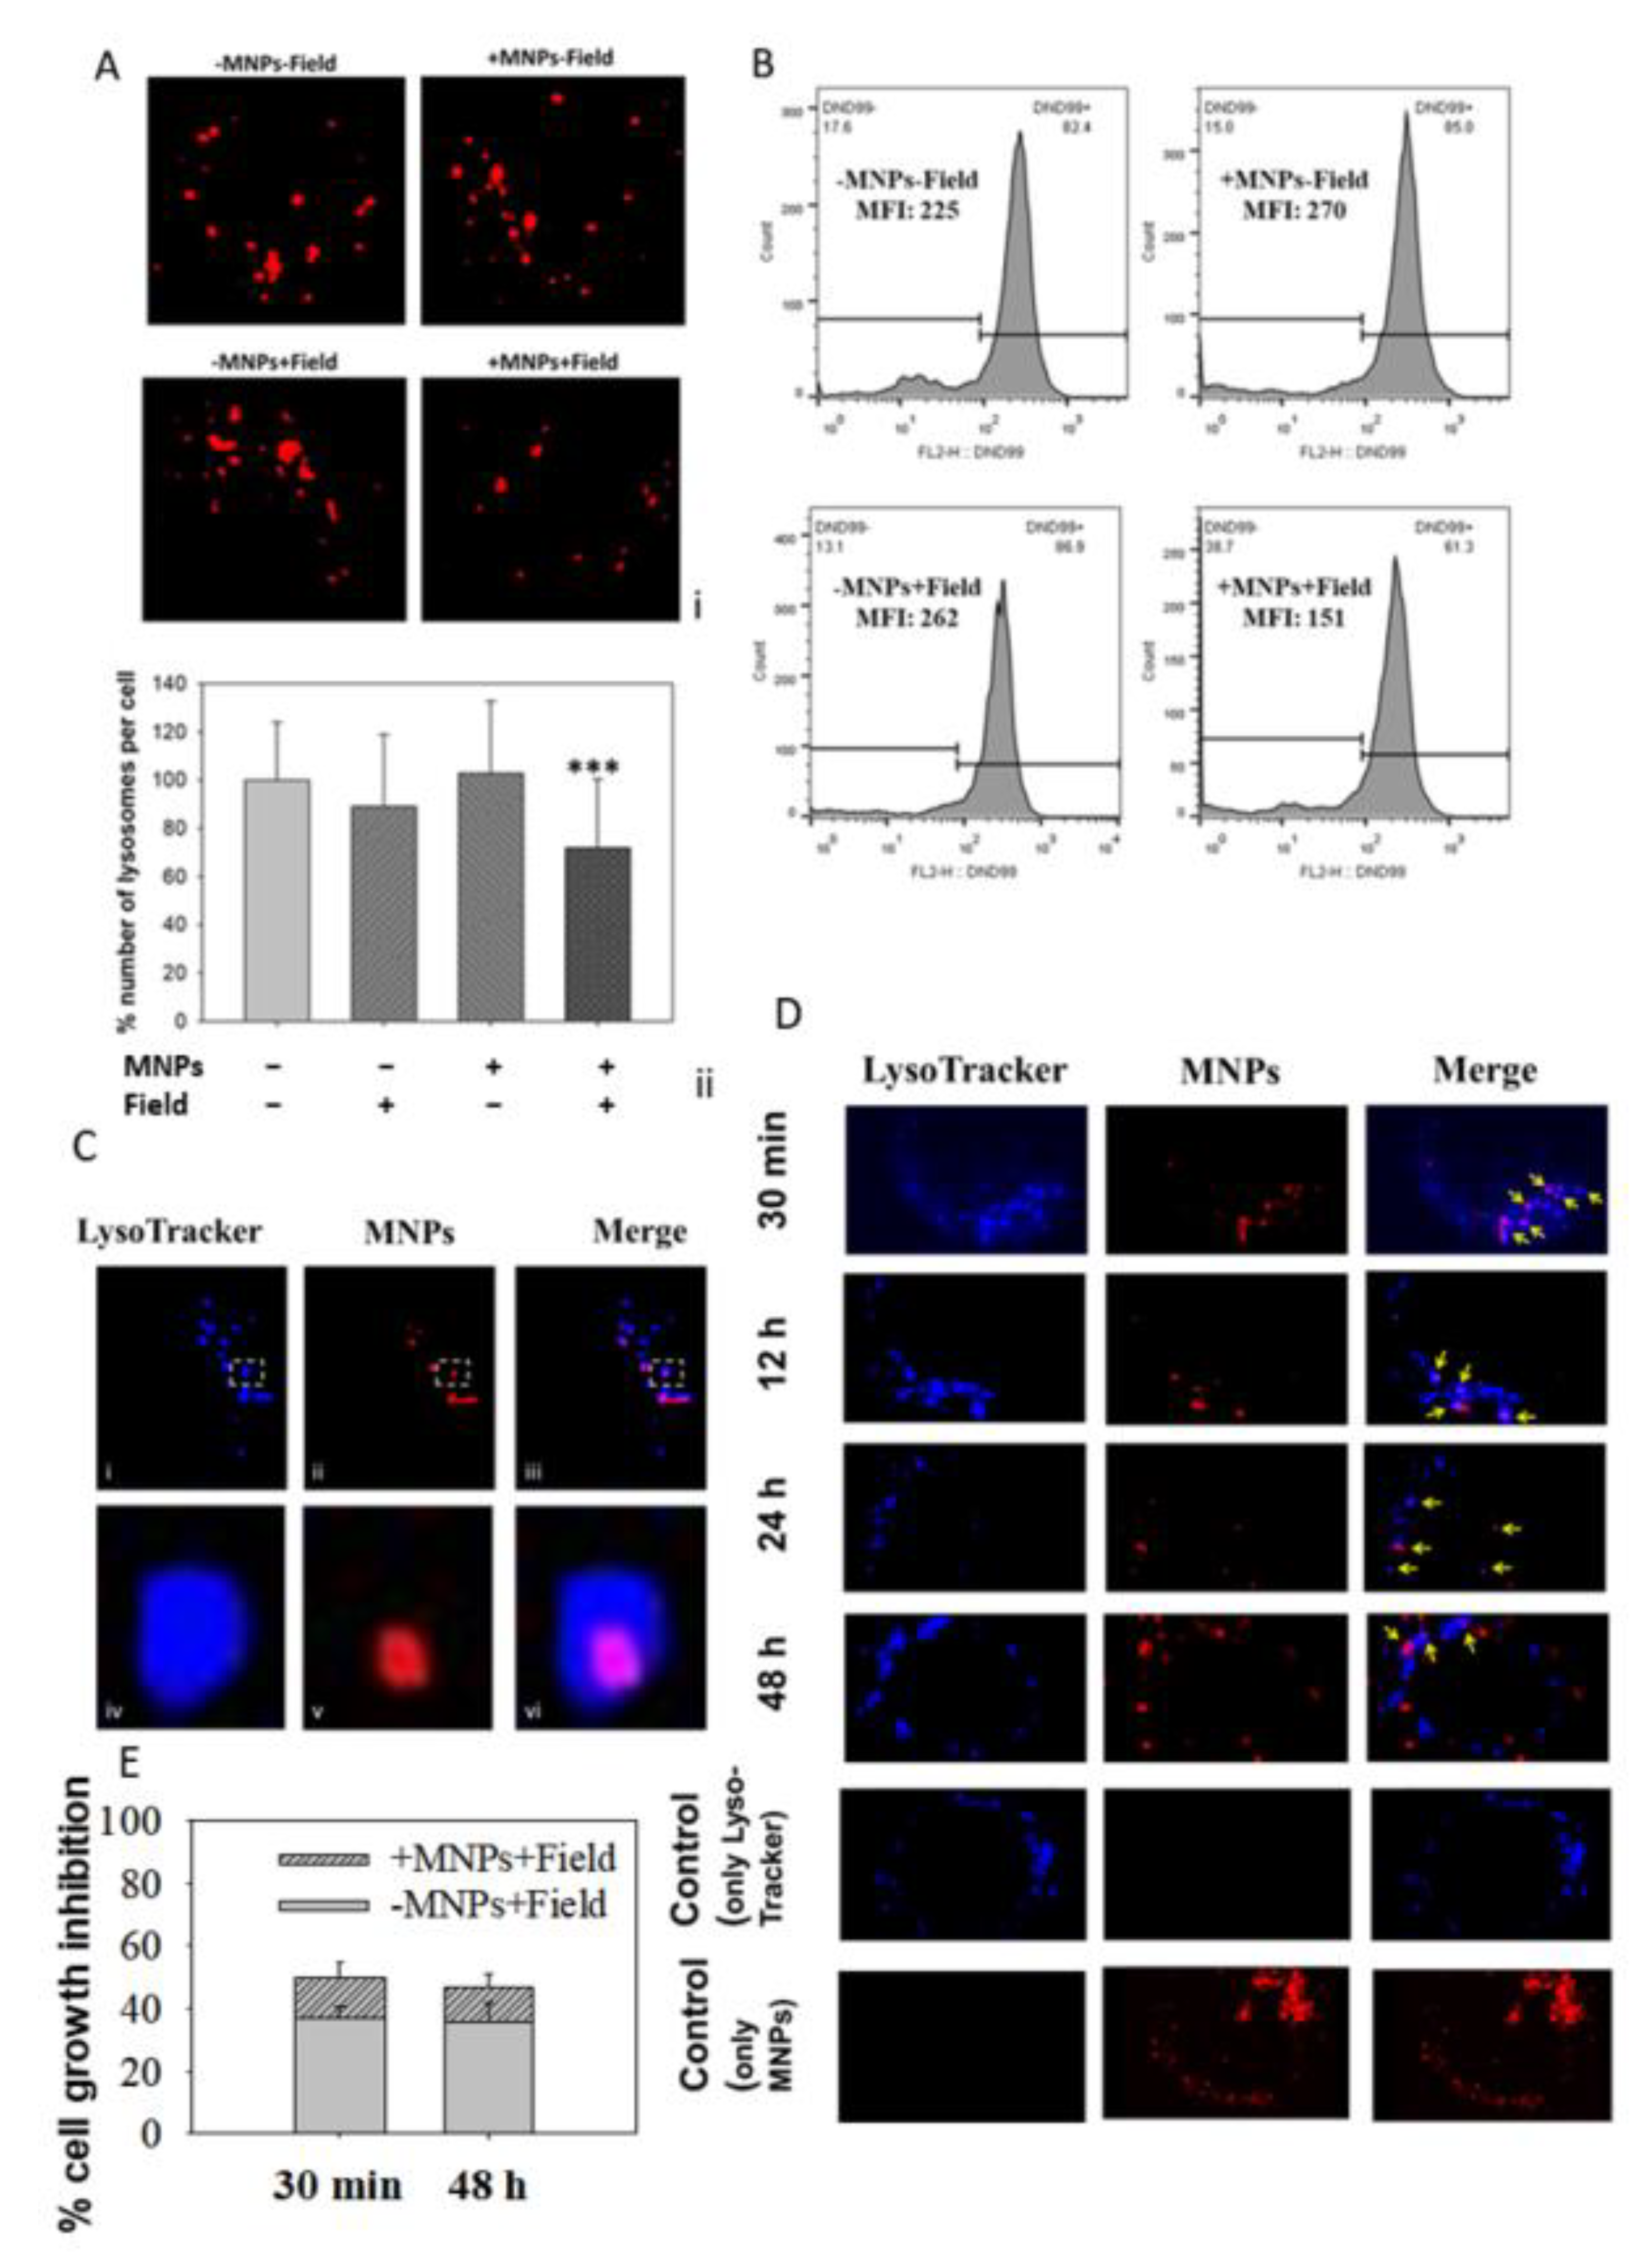
2.7. Assessment of the Structural Integrity of Lysosomes
2.8. Co-Localization of the MNPs with the Lysosomes
2.9. Cell Cycle Analysis
2.10. Cyclin D1 and Cyclin B1 Protein Expression
2.11. Tumor Spheroids
2.12. Magnetic Characterization of the MNPs
2.13. Data Analysis and Statistics
3. Results
3.1. Effect of Magnetomechanical Stress on the Growth of Colon Cancer Cell Lines
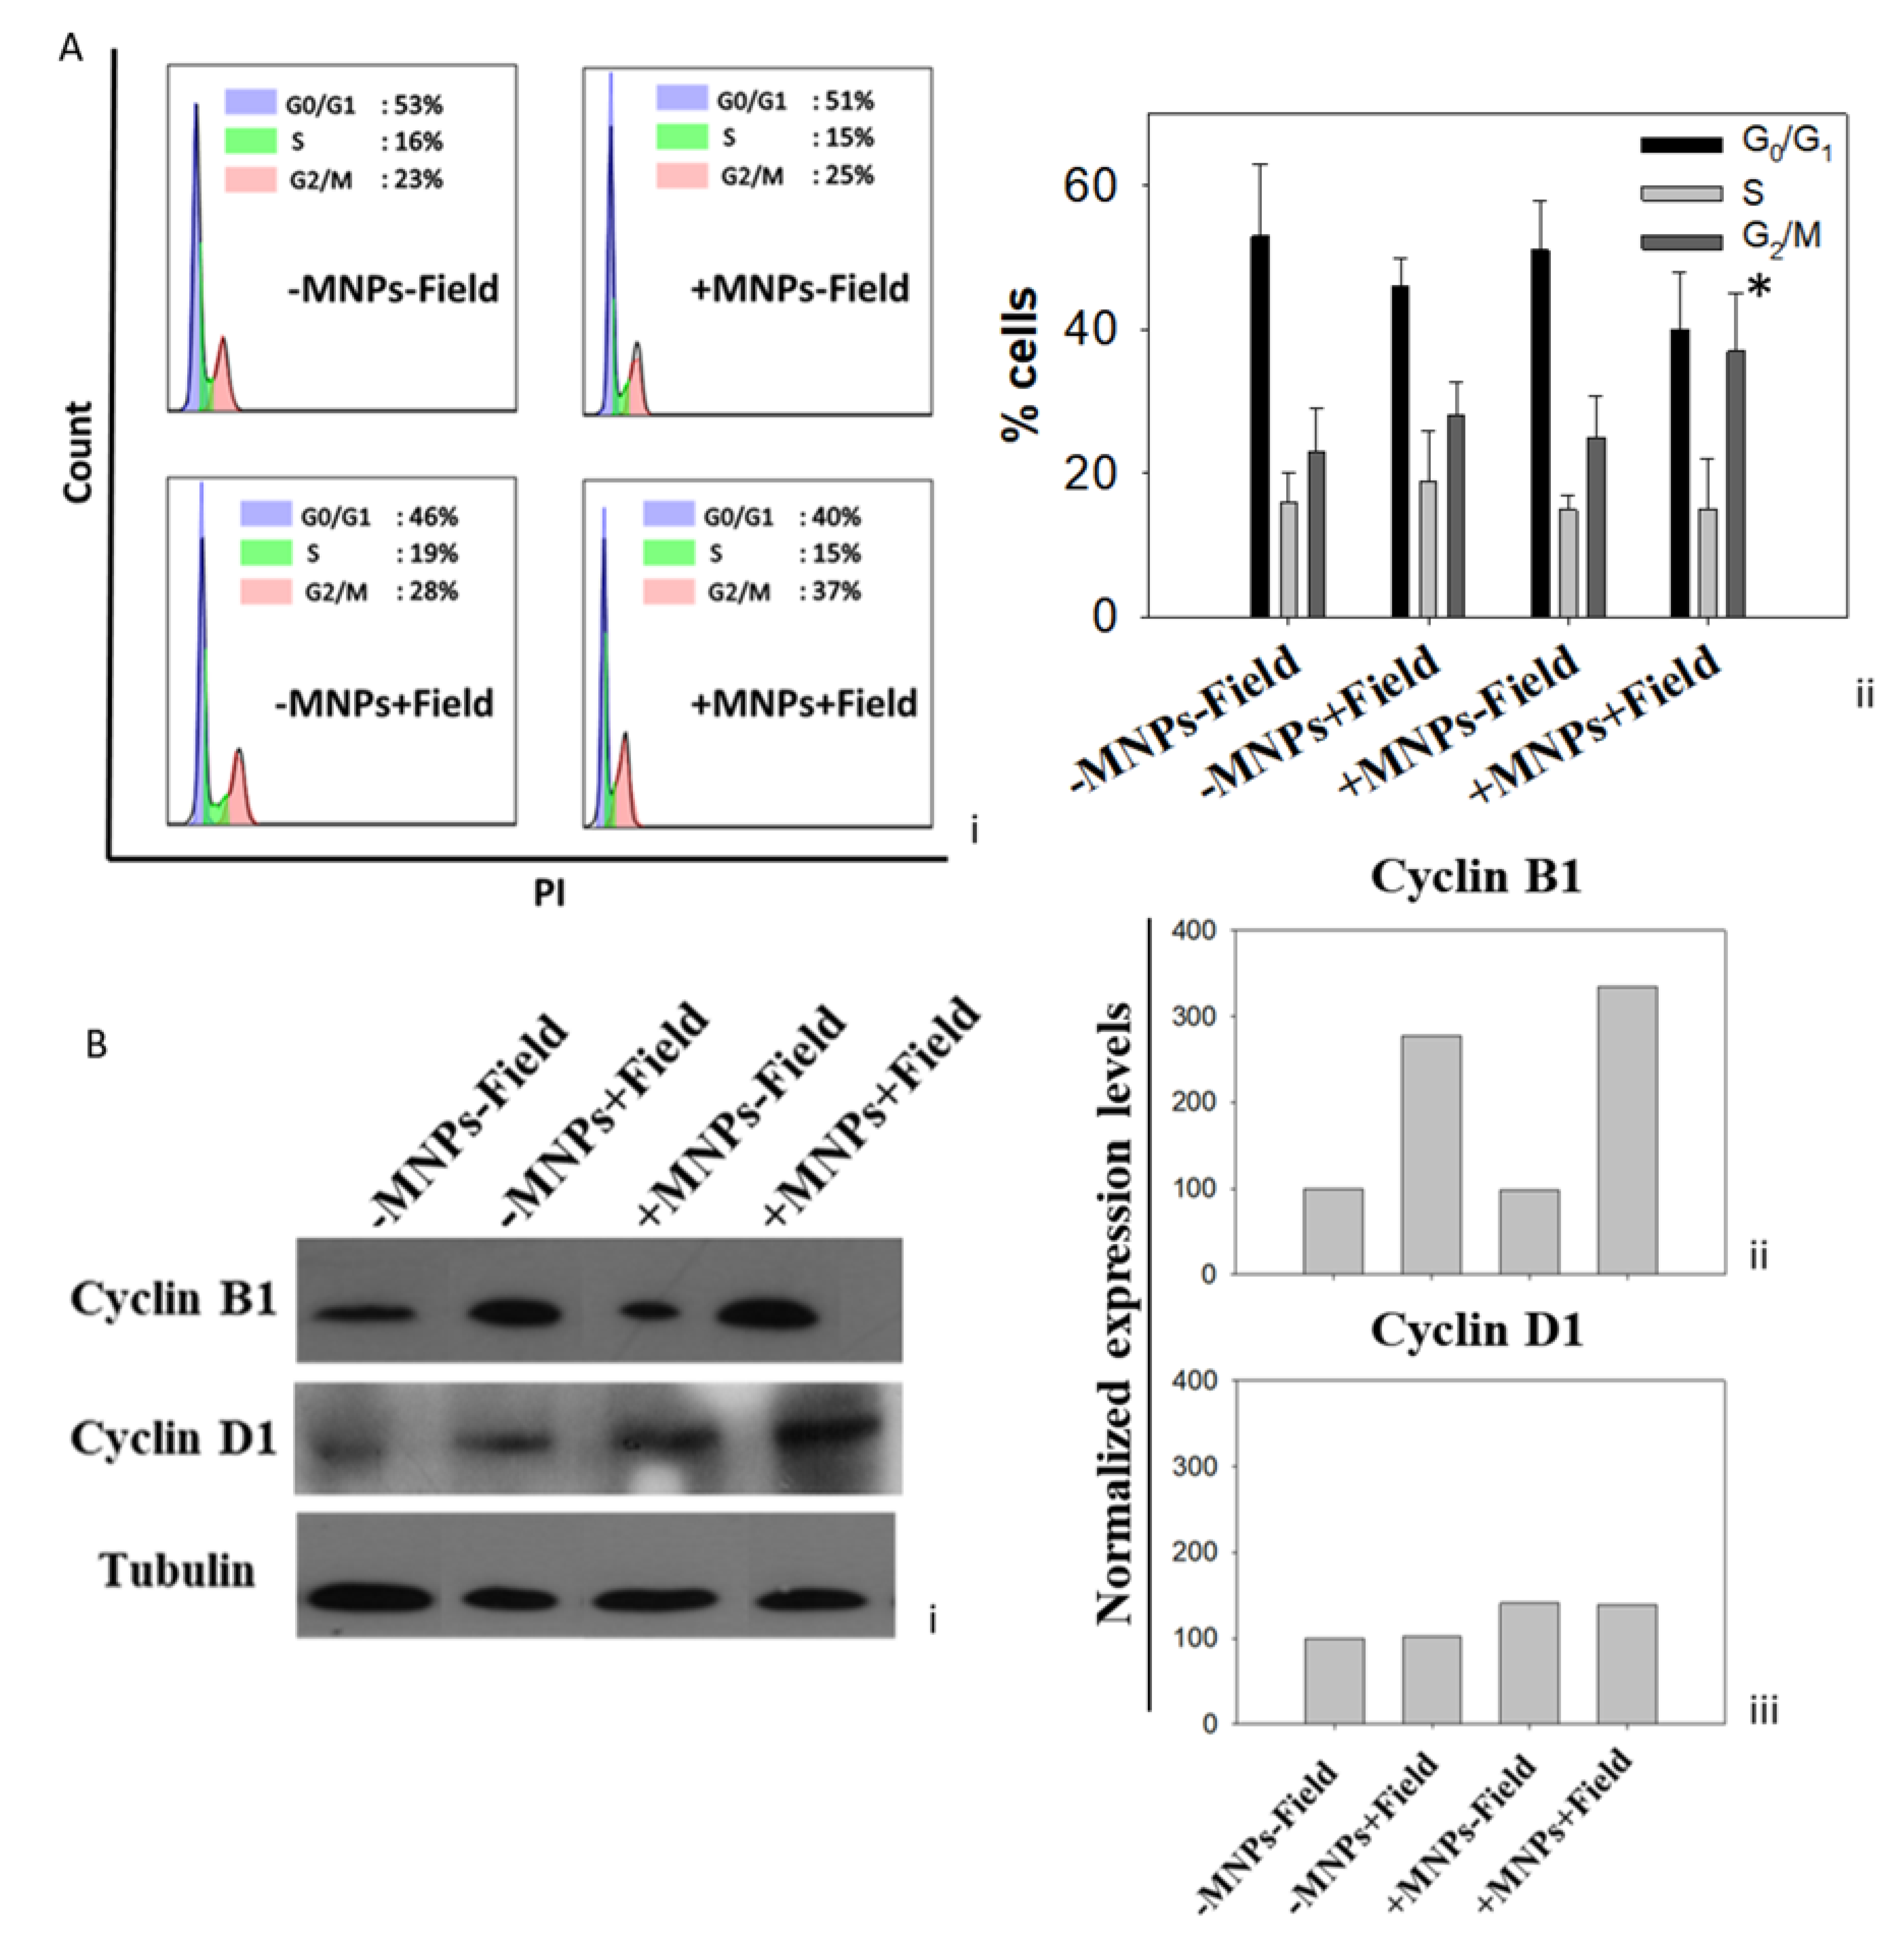
3.2. Cell Growth Inhibition Due to Magnetomechanical Stress Is Mediated by Cell Cycle Arrest
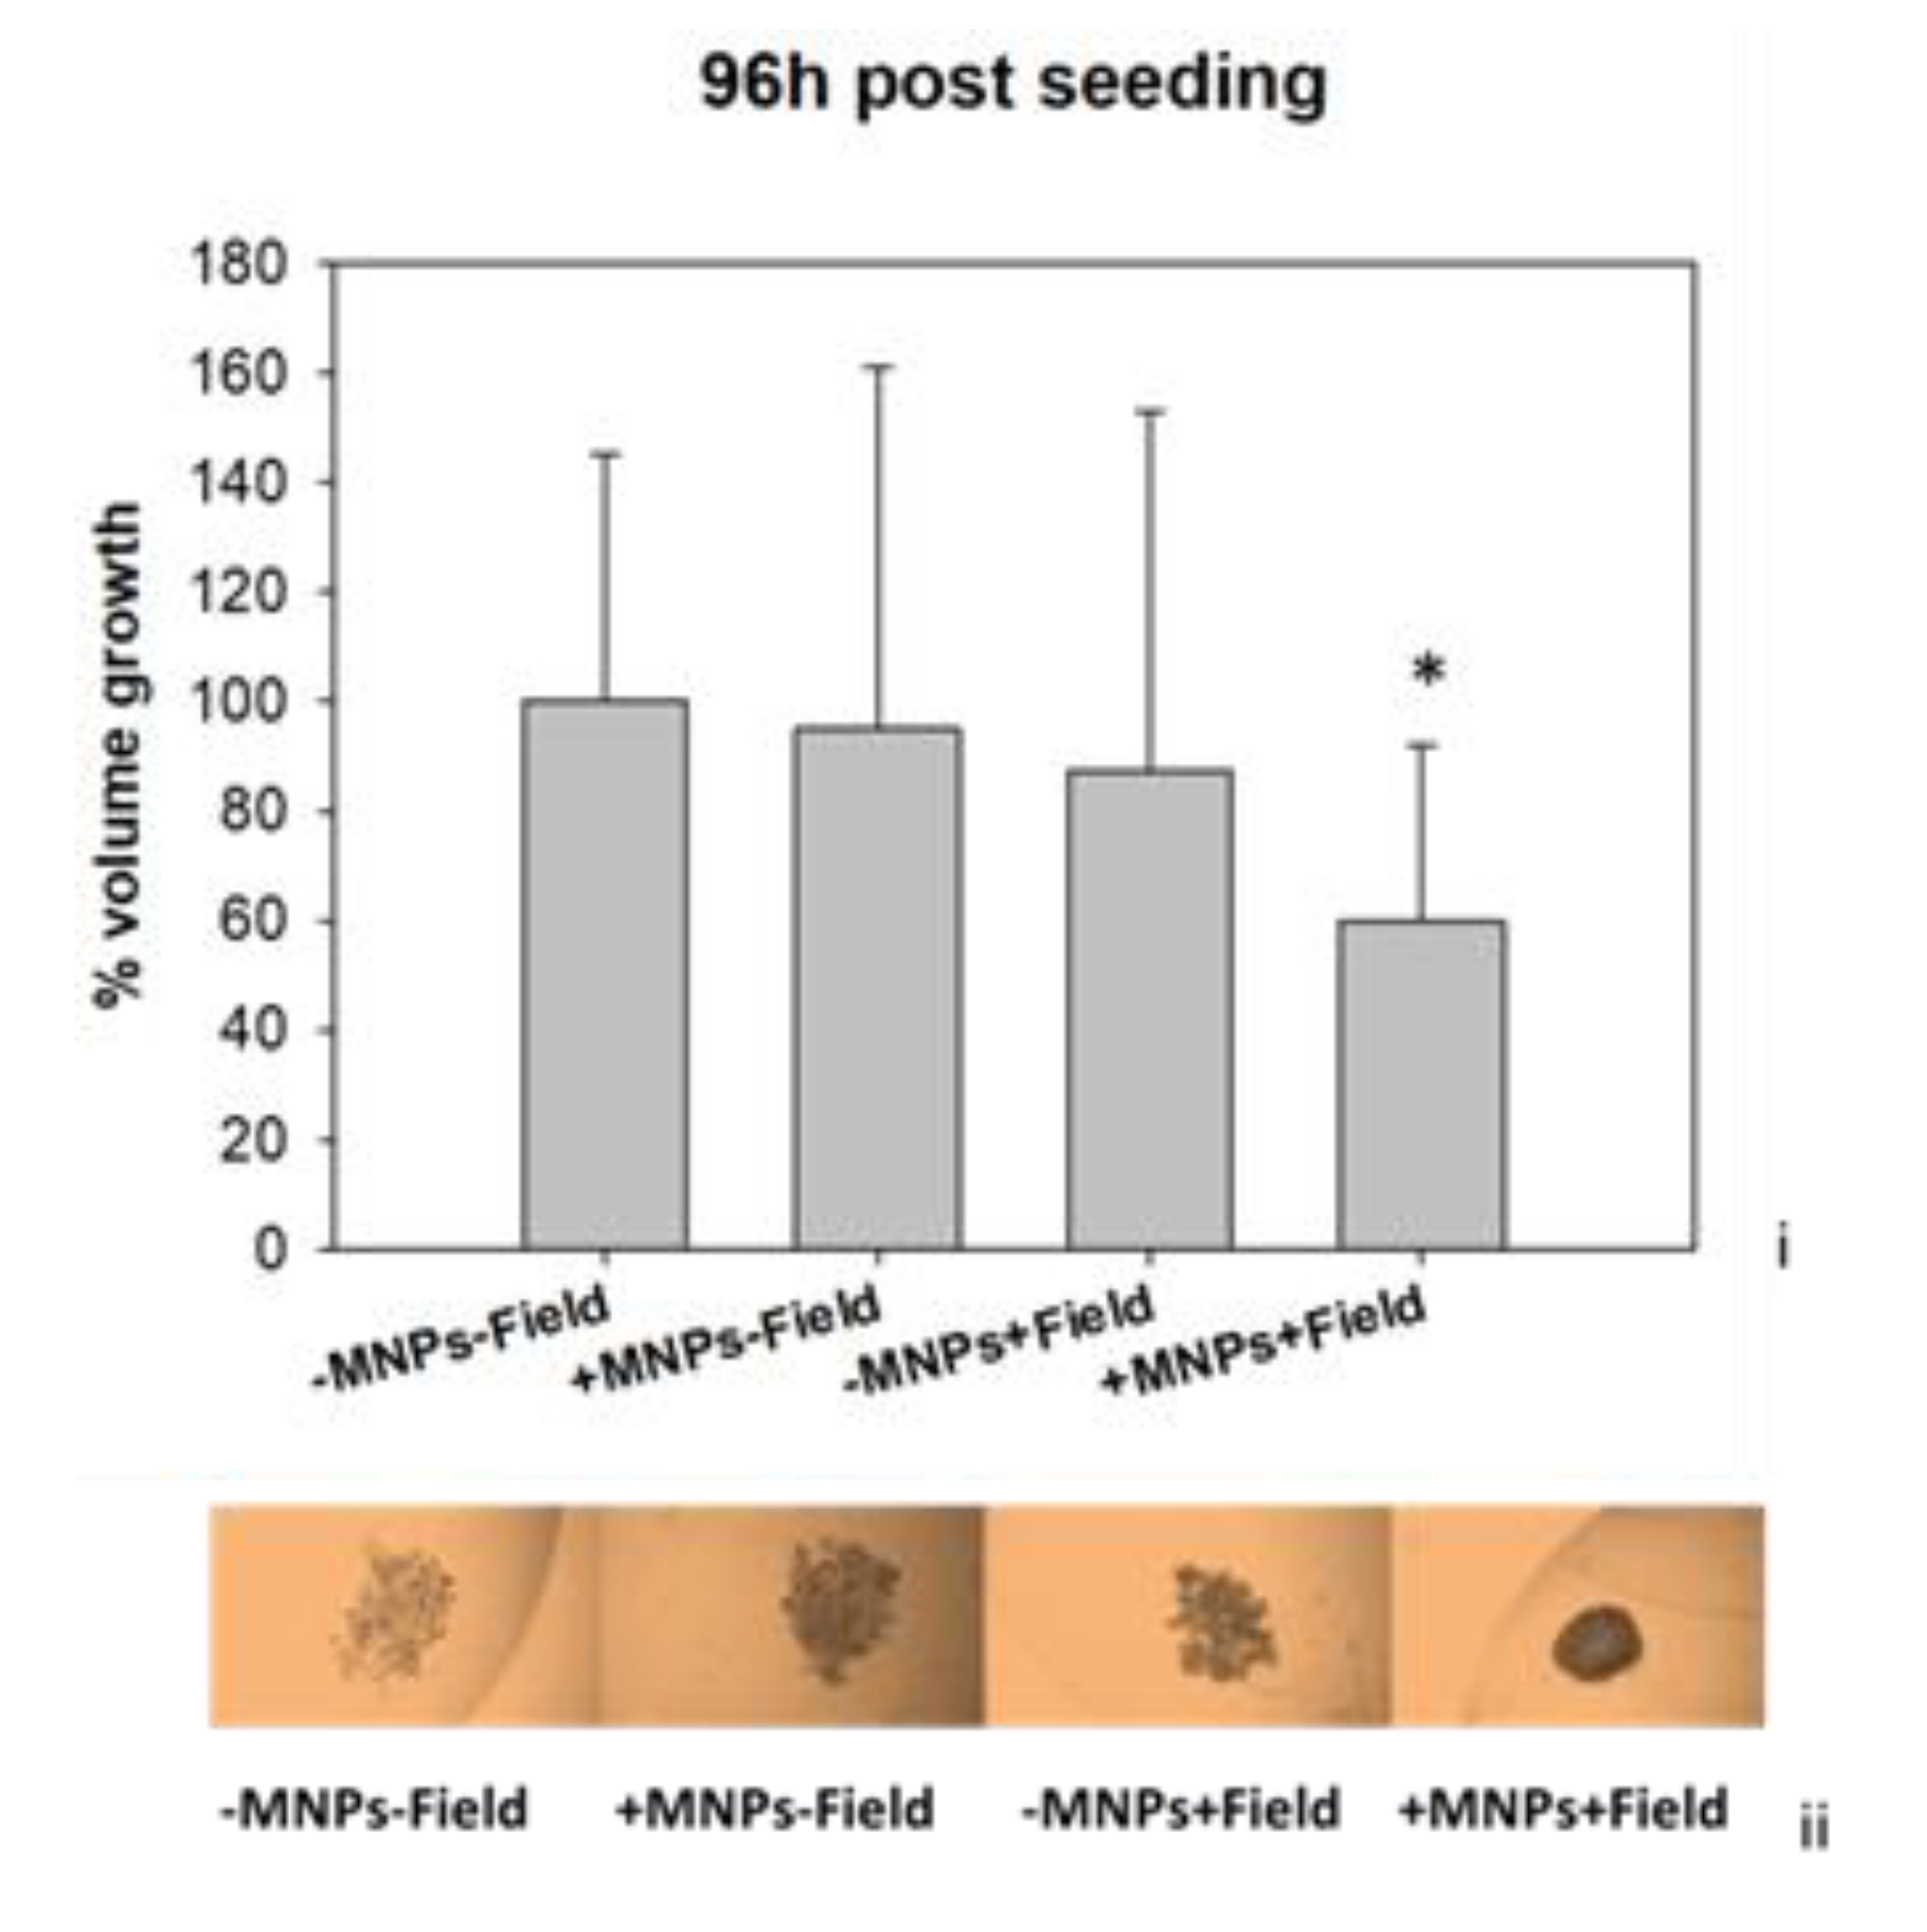
3.3. Magnetomechanical Stress Effects on 3D Tumor Spheroids
3.4. MNPs Accumulate in the Lysosomes
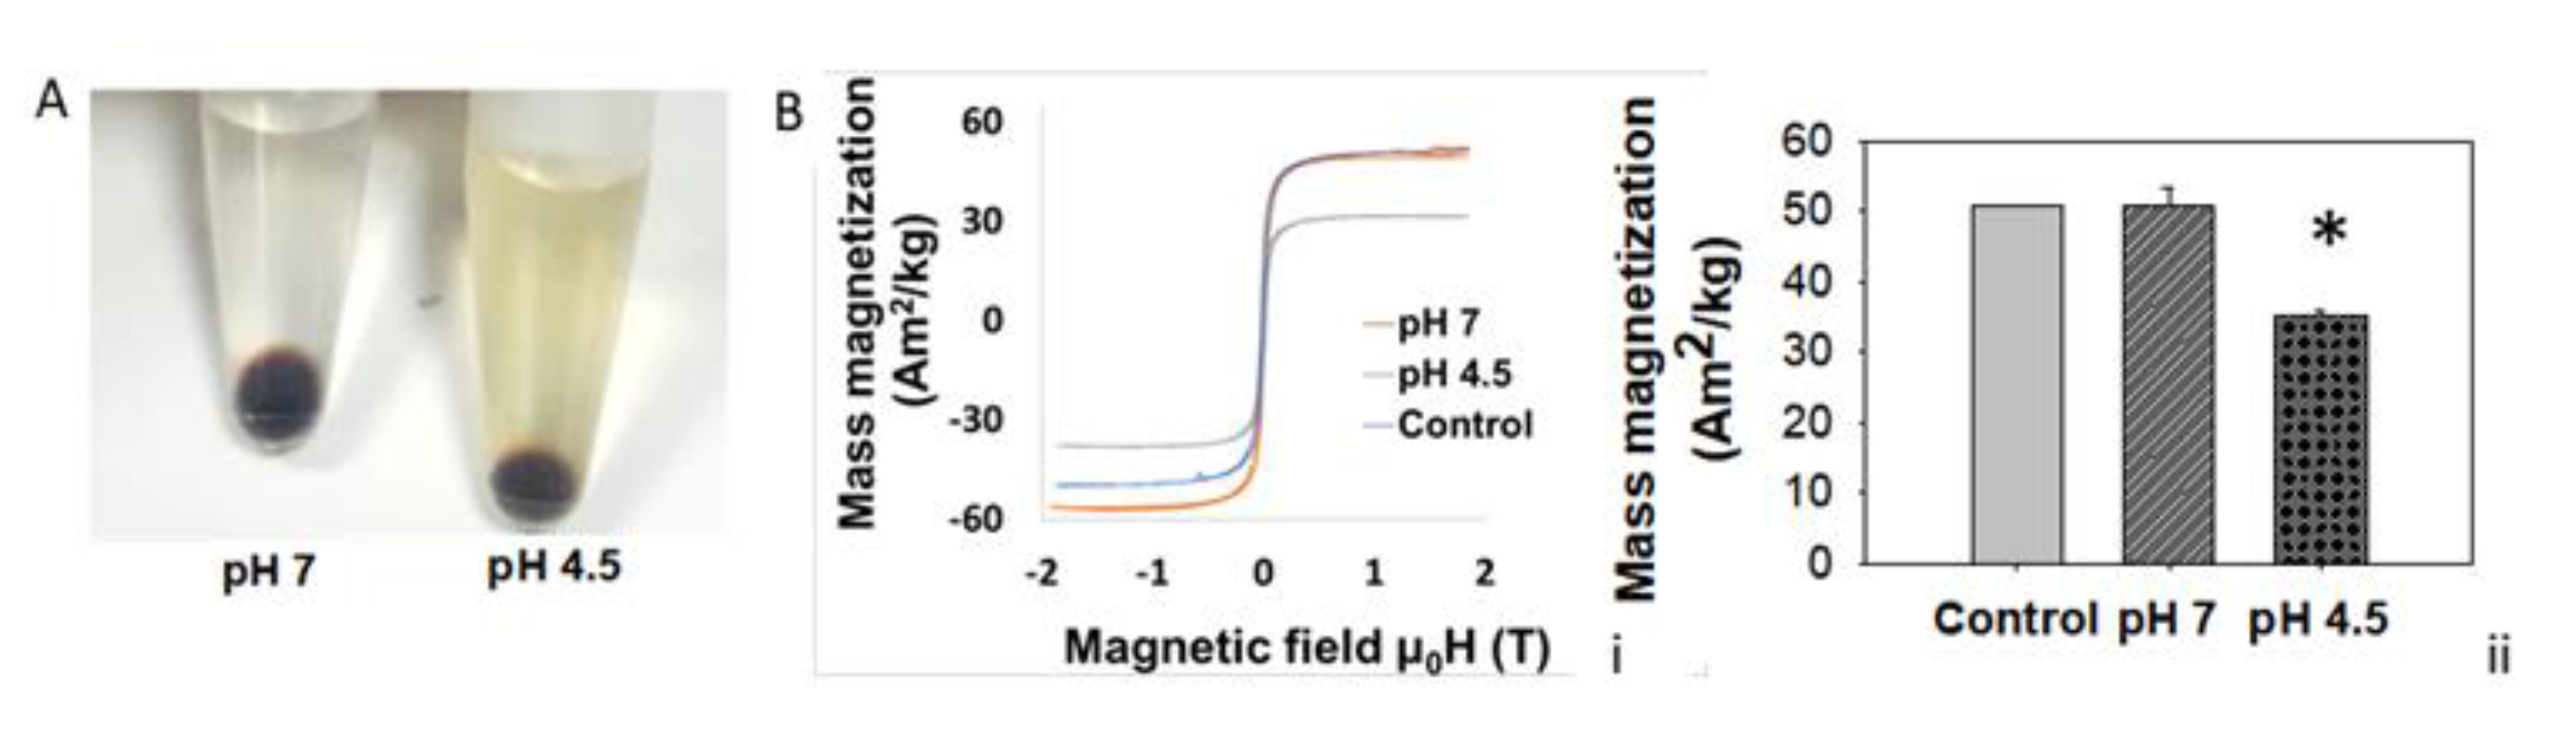
3.5. Lysosomal Acidic Conditions Affect MNPs’ Magnetic Properties
4. Discussion
5. Conclusions
Author Contributions
Funding
Institutional Review Board Statement
Informed Consent Statement
Data Availability Statement
Acknowledgments
Conflicts of Interest
References
- Goetzke, R.; Sechi, A.; De Laporte, L.; Neuss, S.; Wagner, W. Why the impact of mechanical stimuli on stem cells remains a challenge. Cell. Mol. Life Sci. 2018, 75, 3297–3312. [Google Scholar] [CrossRef]
- Urrutia, C.O.; Dominguez-García, M.V.; Flores-Estrada, J.; Laguna-Camacho, A.; Castillo-Cadena, J.; Flores-Merino, M.V. Mechanical Stimulation of Cells Through Scaffold Design for Tissue Engineering. Scaffolds Tissue Eng. Mater. Technol. Clin. Appl. 2017, 147, 9925. [Google Scholar] [CrossRef]
- Sun, J.; Chen, J.; Mohagheghian, E.; Wang, N. Force-induced gene up-regulation does not follow the weak power law but depends on H3K9 demethylation. Sci. Adv. 2020, 6, eaay9095. [Google Scholar] [CrossRef]
- Jain, R.K.; Martin, J.D.; Stylianopoulos, T. The Role of Mechanical Forces in Tumor Growth and Therapy. Annu. Rev. Biomed. Eng. 2014, 16, 321–346. [Google Scholar] [CrossRef]
- Cheng, G.; Tse, J.; Jain, R.K.; Munn, L.L. Micro-Environmental Mechanical Stress Controls Tumor Spheroid Size and Morphology by Suppressing Proliferation and Inducing Apoptosis in Cancer Cells. PLoS ONE 2009, 4, e4632. [Google Scholar] [CrossRef]
- Trepat, X. Viewpoint: Forcing Tumor Arrest. Physics 2011, 4, 85. [Google Scholar] [CrossRef]
- Montel, F.; Delarue, M.; Elgeti, J.; Malaquin, L.; Basan, M.; Risler, T.; Cabane, B. Stress Clamp Experiments on Multicellular Tumor Spheroids. Phys. Rev. Lett. 2011, 107, 188102. [Google Scholar] [CrossRef]
- Yu, H.; Mouw, J.K.; Weaver, V.M. Forcing form and function: Biomechanical regulation of tumor evolution. Trends Cell Biol. 2011, 21, 47–56. [Google Scholar] [CrossRef]
- Northcott, J.M.; Dean, I.S.; Mouw, J.K.; Weaver, V.M. Feeling stress: The mechanics of cancer progression and aggression. Front. Cell Dev. Biol. 2018, 6, 17. [Google Scholar] [CrossRef]
- Gahl, T.J.; Kunze, A. Force-Mediating Magnetic Nanoparticles to Engineer Neuronal Cell Function. Front. Neurosci. 2018, 12, 299. [Google Scholar] [CrossRef]
- Novoselova, I.P.; Neusch, A.; Brand, J.S.; Otten, M.; Safari, M.R.; Bartels, N.; Karg, M.; Farle, M.; Wiedwald, U.; Monzel, C. Magnetic nanoprobes for spatio-mechanical manipulation in single cells. Nanomaterials 2021, 11, 2267. [Google Scholar] [CrossRef]
- Zablotskii, V.; Lunov, O.; Dejneka, A.; Jastrabík, L.; Polyakova, T.; Syrovets, T.; Simmet, T. Nanomechanics of magnetically driven cellular endocytosis. Appl. Phys. Lett. 2011, 99, 183701. [Google Scholar] [CrossRef]
- Kauffmann, P.; Ith, A.; O’Brien, D.; Gaude, V.; Boué, F.; Combe, S.; Bruckert, F.; Schaack, B.; Dempsey, N.M.; Haguet, V.; et al. Diamagnetically trapped arrays of living cells above micromagnets. Lab. Chip. 2011, 11, 3153. [Google Scholar] [CrossRef]
- Zablotskii, V.; Syrovets, T.; Schmidt, Z.W.; Dejneka, A.; Simmet, T. Modulation of monocytic leukemia cell function and survival by high gradient magnetic fields and mathematical modeling studies. Biomaterials 2014, 35, 3164–3171. [Google Scholar] [CrossRef]
- Zhang, E.; Kircher, M.F.; Koch, M.; Eliasson, L.; Goldberg, S.N.; Renström, E. Dynamic magnetic fields remote-control apoptosis via nanoparticle rotation. ACS Nano. 2014, 8, 3192–3201. [Google Scholar] [CrossRef]
- Orr, A.W.; Helmke, B.P.; Blackman, B.R.; Schwartz, M.A. Mechanisms of Mechanotransduction. Dev. Cell 2006, 10, 11–20. [Google Scholar] [CrossRef]
- Leulmi, S.; Chauchet, X.; Morcrette, M.; Ortiz, G.; Joisten, H.; Sabon, P.; Livache, T.; Hou, Y.; Carrière, M.; Lequien, S.; et al. Triggering the apoptosis of targeted human renal cancer cells by the vibration of anisotropic magnetic particles attached to the cell membrane. Nanoscale 2015, 7, 15904–15914. [Google Scholar] [CrossRef]
- Cheng, Y.; Muroski, M.E.; Petit, D.C.M.C.; Mansell, R.; Vemulkar, T.; Morshed, R.A.; Han, Y.; Balyasnikova, I.V.; Horbinski, C.M.; Huang, X.; et al. Rotating magnetic field induced oscillation of magnetic particles for in vivo mechanical destruction of malignant glioma. J. Control. Release 2016, 223, 75–84. [Google Scholar] [CrossRef]
- Butcher, D.T.; Alliston, T.; Weaver, V.M. A tense situation: Forcing tumour progression. Nat. Rev. Cancer 2009, 9, 108–122. [Google Scholar] [CrossRef]
- Naud, C.; Thébault, C.; Carrière, M.; Hou, Y.; Morel, R.; Berger, F.; Diény, B.; Joisten, H. Cancer treatment by magneto-mechanical effect of particles, a review. Nanoscale Adv. 2020, 2, 3632–3655. [Google Scholar] [CrossRef]
- Kim, D.H.; Rozhkova, E.A.; Ulasov, I.V.; Bader, S.D.; Rajh, T.; Lesniak, M.S.; Novosad, V. Biofunctionalized magnetic-vortex microdiscs for targeted cancer-cell destruction. Nat. Mater. 2010, 9, 165–171. [Google Scholar] [CrossRef]
- Shen, Y.; Wu, C.; Uyeda, T.Q.P.; Plaza, G.R.; Liu, B.; Han, Y.; Lesniak, M.S.; Cheng, Y. Elongated nanoparticle aggregates in cancer cells for mechanical destruction with low frequency rotating magnetic field. Theranostics 2017, 7, 1735–1748. [Google Scholar] [CrossRef]
- Chen, M.; Wu, J.; Ning, P.; Wang, J.; Ma, Z.; Huang, L.; Plaza, G.R.; Shen, Y.; Xu, C.; Han, Y.; et al. Remote Control of Mechanical Forces via Mitochondrial-Targeted Magnetic Nanospinners for Efficient Cancer Treatment. Small 2020, 16, e1905424. [Google Scholar] [CrossRef]
- Martínez-Banderas, A.I.; Aires, A.; Teran, F.J.; Perez, J.E.; Cadenas, J.F.; Alsharif, N.; Ravasi, T.; Cortajarena, A.L.; Kosel, J. Functionalized magnetic nanowires for chemical and magneto-mechanical induction of cancer cell death. Sci. Rep. 2016, 6, 35786. [Google Scholar] [CrossRef]
- Wong, D.W.; Gan, W.L.; Liu, N.; Lew, W.S. Magneto-Actuated cell apoptosis by biaxial pulsed magnetic field. Sci. Rep. 2017, 7, 10919. [Google Scholar] [CrossRef]
- Spyridopoulou, K.; Makridis, A.; Maniotis, N.; Karypidou, N.; Myrovali, E.; Samaras, T.; Angelakeris, M.; Chlichlia, K.; Kalogirou, O. Effect of low frequency magnetic fields on the growth of MNP-treated HT29 colon cancer cells. Nanotechnology 2018, 29, 175101. [Google Scholar] [CrossRef]
- Maniotis, N.; Makridis, A.; Myrovali, E.; Theopoulos, A.; Samaras, T.; Angelakeris, M. Magneto-mechanical action of multimodal field configurations on magnetic nanoparticle environments. J. Magn. Magn. Mater. 2017, 470, 6–11. [Google Scholar] [CrossRef]
- Vichai, V.; Kirtikara, K. Sulforhodamine B colorimetric assay for cytotoxicity screening. Nat. Protoc. 2006, 1, 1112–1116. [Google Scholar] [CrossRef]
- Spyridopoulou, K.; Aindelis, G.; Lampri, E.; Giorgalli, M.; Lamprianidou, E.; Kotsianidis, I.; Tsingotjidou, A.; Pappa, A.; Kalogirou, O.; Chlichlia, K. Improving the Subcutaneous Mouse Tumor Model by Effective Manipulation of Magnetic Nanoparticles-Treated Implanted Cancer Cells. Ann. Biomed. Eng. 2018, 46, 1975–1987. [Google Scholar] [CrossRef]
- Foty, R. A simple hanging drop cell culture protocol for generation of 3D spheroids. J. Vis. Exp. 2011, 20, 4–7. [Google Scholar] [CrossRef]
- Grajek, W.; Olejnik, A. Epitelial cell cultures in vitro as a model to study functional properties of food. Pol. J. Food Nutr. Sci. 2004, 13, 5–24. [Google Scholar]
- Ahmed, D.; Eide, P.W.; Eilertsen, I.A.; Danielsen, S.A.; Eknæs, M.; Hektoen, M.; Lind, G.E.; Lothe, R.A. Epigenetic and genetic features of 24 colon cancer cell lines. Oncogenesis 2013, 2, e71. [Google Scholar] [CrossRef]
- Castle, J.C.; Loewer, M.; Boegel, S.; de Graaf, J.; Bender, C.; Tadmor, A.D.; Boisguerin, V.; Bukur, T.; Sorn, P.; Paret, C.; et al. Immunomic, genomic and transcriptomic characterization of CT26 colorectal carcinoma. BMC Genom. 2014, 15, 190. [Google Scholar] [CrossRef]
- Forn, M.; Díez-Villanueva, A.; Merlos-Suárez, A.; Muñoz, M.; Lois, S.; Carriò, E.; Jordà, M.; Bigas, A.; Batlle, E.; Peinado, M.A. Overlapping DNA methylation dynamics in mouse intestinal cell differentiation and early stages of malignant progression. PLoS ONE 2015, 10, e0123263. [Google Scholar] [CrossRef]
- Uray, I.P.; Uray, K. Mechanotransduction at the Plasma Membrane-Cytoskeleton Interface. Int. J. Mol. Sci. 2021, 22, 11566. [Google Scholar] [CrossRef]
- Wu, C.; Shen, Y.; Chen, M.; Wang, K.; Li, Y.; Cheng, Y. Recent Advances in Magnetic-Nanomaterial-Based Mechanotransduction for Cell Fate Regulation. Adv. Mater. 2018, 30, e1705673. [Google Scholar] [CrossRef]
- Paul, N.E.; Denecke, B.; Kim, B.; Dreser, A.; Bernhagen, J.; Pallua, N. The effect of mechanical stress on the proliferation, adipogenic differentiation and gene expression of human adipose-derived stem cells. J. Tissue Eng. Regen. Med. 2018, 12, 276–284. [Google Scholar] [CrossRef]
- Damm, T.B.; Franco-Obregón, M.; Egli, M. Gravitational force modulates G2/M phase exit in mechanically unloaded myoblasts. Cell Cycle 2013, 12, 3001–3012. [Google Scholar] [CrossRef]
- DiPaola, R.S. To arrest or not to G(2)-M Cell-cycle arrest: Commentary re: A. K. Tyagi et al., Silibinin strongly synergizes human prostate carcinoma DU145 cells to doxorubicin-induced growth inhibition, G(2)-M arrest, and apoptosis. Clin. Cancer Res. 2002, 8, 3311–3314. [Google Scholar] [PubMed]
- Lieftink, C.; Beijersbergen, R.L. It takes two to tango, and the right music: Synergistic drug combinations with cell-cycle phase-dependent sensitivities. EBioMedicine 2021, 69, 103448. [Google Scholar] [CrossRef]
- Stage, T.B.; Bergmann, T.K.; Kroetz, D.L. Clinical pharmacokinetics of paclitaxel monotherapy: An updated literature review. Clin. Pharmacokinet. 2018, 57, 7. [Google Scholar] [CrossRef] [PubMed] [Green Version]
- Johnson, T.I.; Minteer, C.J.; Kottmann, D.; Dunlop, C.R.; Fernández, S.B. de Q.; Carnevalli, L.S.; Wallez, Y.; Lau, A.; Richards, F.M.; Jodrell, D.I. Quantifying cell cycle-dependent drug sensitivities in cancer using a high throughput synchronisation and screening approach. EBioMedicine 2021, 68, 103396. [Google Scholar] [CrossRef]
- Xiong, X.; Sui, M.; Fan, W.; Kraft, A.S. Cell cycle dependent antagonistic interactions between paclitaxel and carboplatin in combination therapy. Cancer Biol. Ther. 2007, 6, 1067–1073. [Google Scholar] [CrossRef]
- Jin, D.; Tran, N.; Thomas, N.; Tran, D.D. Combining CDK4/6 inhibitors ribociclib and palbociclib with cytotoxic agents does not enhance cytotoxicity. PLoS ONE 2019, 14, e0223555. [Google Scholar] [CrossRef]
- Wang, X.; Deng, K.; Wang, C.; Li, Y.; Wang, T.; Huang, Z.; Ma, Y.; Sun, P.; Shi, Y.; Yang, S.; et al. Novel CDKs inhibitors for the treatment of solid tumour by simultaneously regulating the cell cycle and transcription control. J. Enzym. Inhib. Med. Chem. 2020, 35, 414–423. [Google Scholar] [CrossRef]
- Zheng, L.; Yang, Y.; Bao, J.; He, L.; Qi, Y.; Zhang, J.Z.H. Discovery of novel inhibitors of CDK2 using docking and physics-based binding free energy calculation. Chem. Biol. Drug Des. 2022, 99, 662–673. [Google Scholar] [CrossRef]
- Jing, L.; Tang, Y.; Xiao, Z. Discovery of novel CDK inhibitors via scaffold hopping from CAN508. Bioorg. Med. Chem. Lett. 2018, 28, 1386–1391. [Google Scholar] [CrossRef]
- Goel, S.; DeCristo, M.J.; McAllister, S.S.; Zhao, J.J. CDK4/6 inhibition in cancer: Beyond cell cycle arrest. Trends Cell Biol. 2018, 28, 911. [Google Scholar] [CrossRef]
- Juaid, N.; Amin, A.; Abdalla, A.; Reese, K.; Alamri, Z.; Moulay, M.; Abdu, S.; Miled, N. Anti-Hepatocellular Carcinoma Biomolecules: Molecular Targets Insights. Int. J. Mol. Sci. 2021, 22, 10774. [Google Scholar] [CrossRef] [PubMed]
- Suski, J.M.; Braun, M.; Strmiska, V.; Sicinski, P. Targeting cell-cycle machinery in cancer. Cancer Cell 2021, 39, 759–778. [Google Scholar] [CrossRef]
- Sherr, C.J.; Bartek, J. Cell Cycle–Targeted Cancer Therapies. Annu. Rev. Cancer Biol. 2017, 1, 41–57. [Google Scholar] [CrossRef]
- Tao, Y.; Zhang, P.; Girdler, F.; Frascogna, V.; Castedo, M.; Bourhis, J.; Kroemer, G.; Deutsch, E. Enhancement of radiation response in p53-deficient cancer cells by the Aurora-B kinase inhibitor AZD1152. Oncogene 2008, 27, 3244–3255. [Google Scholar] [CrossRef] [PubMed]
- Master, A.M.; Williams, P.N.; Pothayee, N.; Zhang, R.; Vishwasrao, H.M.; Golovin, Y.I.; Riffle, J.S.; Sokolsky-Papkov, M.; Kabanov, A.V. Summary for Policymakers. In Climate Change 2013—The Physical Science Basis; Intergovernmental Panel on Climate Change: Geneva, Switzerland; Cambridge University Press: Cambridge, UK, 2015; Volume 1, pp. 1–30. ISBN 9788578110796. [Google Scholar]
- Shen, H.; Tong, S.; Bao, G.; Wang, B. Structural responses of cells to intracellular magnetic force induced by superparamagnetic iron oxide nanoparticles. Phys. Chem. Chem. Phys. 2014, 16, 1914–1920. [Google Scholar] [CrossRef]
- Boya, P.; Kroemer, G. Lysosomal membrane permeabilization in cell death. Oncogene 2008, 27, 6434–6451. [Google Scholar] [CrossRef]
- Domenech, M.; Marrero-Berrios, I.; Torres-Lugo, M.; Rinaldi, C. Lysosomal Membrane Permeabilization by Targeted Magnetic Nanoparticles in Alternating Magnetic Fields. ACS Nano. 2013, 7, 5091–5101. [Google Scholar] [CrossRef]
- Connord, V.; Clerc, P.; Hallali, N.; El Hajj Diab, D.; Fourmy, D.; Gigoux, V.; Carrey, J. Real-Time Analysis of Magnetic Hyperthermia Experiments on Living Cells under a Confocal Microscope. Small 2015, 11, 2437–2445. [Google Scholar] [CrossRef]
- Lunov, O.; Uzhytchak, M.; Smolková, B.; Lunova, M.; Jirsa, M.; Dempsey, N.M.; Dias, A.L.; Bonfim, M.; Hof, M.; Jurkiewicz, P.; et al. Remote Actuation of Apoptosis in Liver Cancer Cells via Magneto-Mechanical Modulation of Iron Oxide Nanoparticles. Cancers 2019, 11, 1873. [Google Scholar] [CrossRef]
- Xiang, Y.; Li, N.; Liu, M.; Chen, Q.; Long, X.; Yang, Y.; Xiao, Z.; Huang, J.; Wang, X.; Yang, Y.; et al. Nanodrugs Detonate Lysosome Bombs. Front. Pharmacol. 2022, 13, 909504. [Google Scholar] [CrossRef] [PubMed]
- Tsiapla, A.; Uzunova, V.; Oreshkova, T.; Angelakeris, M. Cell Behavioral Changes after the Application of Magneto-Mechanical Activation to Normal and Cancer Cells. Magnetochemistry 2022, 8, 21. [Google Scholar] [CrossRef]
- Lopez, S.; Hallali, N.; Lalatonne, Y.; Hillion, A.; Antunes, J.C.; Serhan, N.; Clerc, P.; Fourmy, D.; Motte, L.; Carrey, J.; et al. Magneto-mechanical destruction of cancer-associated fibroblasts using ultra-small iron oxide nanoparticles and low frequency rotating magnetic fields. Nanoscale Adv. 2022, 4, 421–436. [Google Scholar] [CrossRef]
- Cost, A.L.; Ringer, P.; Chrostek-Grashoff, A.; Grashoff, C. How to Measure Molecular Forces in Cells: A Guide to Evaluating Genetically-Encoded FRET-Based Tension Sensors. Cell. Mol. Bioeng. 2015, 8, 96. [Google Scholar] [CrossRef] [Green Version]
- Gutiérrez, L.; Romero, S.; da Silva, G.B.; Costo, R.; Vargas, M.D.; Ronconi, C.M.; Serna, C.J.; Veintemillas-Verdaguer, S.; del Puerto Morales, M. Degradation of magnetic nanoparticles mimicking lysosomal conditions followed by AC susceptibility. Biomed. Eng. Biomed. Tech. 2015, 60, 417–425. [Google Scholar] [CrossRef] [PubMed]
- Mazuel, F.; Espinosa, A.; Luciani, N.; Reffay, M.; Le Borgne, R.; Motte, L.; Desboeufs, K.; Michel, A.; Pellegrino, T.; Lalatonne, Y.; et al. Massive Intracellular Biodegradation of Iron Oxide Nanoparticles Evidenced Magnetically at Single-Endosome and Tissue Levels. ACS Nano. 2016, 10, 7627–7638. [Google Scholar] [CrossRef] [PubMed]

Publisher’s Note: MDPI stays neutral with regard to jurisdictional claims in published maps and institutional affiliations. |
© 2022 by the authors. Licensee MDPI, Basel, Switzerland. This article is an open access article distributed under the terms and conditions of the Creative Commons Attribution (CC BY) license (https://creativecommons.org/licenses/by/4.0/).
Share and Cite
Spyridopoulou, K.; Aindelis, G.; Sarafidis, C.; Kalogirou, O.; Chlichlia, K. Magnetomechanical Stress-Induced Colon Cancer Cell Growth Inhibition. J. Nanotheranostics 2022, 3, 134-150. https://doi.org/10.3390/jnt3030010
Spyridopoulou K, Aindelis G, Sarafidis C, Kalogirou O, Chlichlia K. Magnetomechanical Stress-Induced Colon Cancer Cell Growth Inhibition. Journal of Nanotheranostics. 2022; 3(3):134-150. https://doi.org/10.3390/jnt3030010
Chicago/Turabian StyleSpyridopoulou, Katerina, Georgios Aindelis, Charalampos Sarafidis, Orestis Kalogirou, and Katerina Chlichlia. 2022. "Magnetomechanical Stress-Induced Colon Cancer Cell Growth Inhibition" Journal of Nanotheranostics 3, no. 3: 134-150. https://doi.org/10.3390/jnt3030010
APA StyleSpyridopoulou, K., Aindelis, G., Sarafidis, C., Kalogirou, O., & Chlichlia, K. (2022). Magnetomechanical Stress-Induced Colon Cancer Cell Growth Inhibition. Journal of Nanotheranostics, 3(3), 134-150. https://doi.org/10.3390/jnt3030010