Article

IoT-Based System for Real-Time Water Quality Monitoring and Advanced Turbidity and pH Sensor Calibration to Improve Accuracy and Reliability Using ThingSpeak

by
Mulhim Al Drees
1,
Abbas E. Rahma
1,*,
Samah Daffalla
1,
Rawabi Alsudais
2,
Naser Fathi Alsubaie
1,
Mohammed Albrahim
1,
Hassan Abdullah Alghanim
1 and
Mustafa I. Almaghasla
3
1
Department of Environment and Natural Agricultural Resources, College of Agricultural and Food Sciences, King Faisal University, P.O. Box 400, Al-Ahsa 31982, Saudi Arabia
2
Department of Computer Science, College of Computer Science and Information Technology, King Faisal University, P.O. Box 400, Al-Ahsa 31982, Saudi Arabia
3
Department of Arid Land Agriculture, College of Agriculture and Food Sciences, King Faisal University, P.O. Box 400, Al-Ahsa 31982, Saudi Arabia
*
Author to whom correspondence should be addressed.
Submission received: 28 February 2026 / Revised: 23 April 2026 / Accepted: 24 April 2026 / Published: 12 May 2026

Abstract

Water quality has become a major concern for public health, agriculture, and industry, necessitating reliable and continuous monitoring. Conventional monitoring methods are often time-consuming, rely on manual sampling, and involve complex equipment or procedures, making them unsuitable for real-time applications. This study presents an Internet of Things (IoT)-based system for real-time water quality monitoring using ESP32 hardware integrated with the ThingSpeak platform. The system enhances the accuracy of turbidity and pH measurements using advanced sensor calibration techniques. Nephelometric methods and glass electrodes are employed for turbidity detection and pH sensing, respectively, across various water types—including tap water, groundwater, wastewater, saline water, and treated water—to address issues such as environmental drift and measurement inaccuracies. The turbidity sensor was calibrated using a standard six-point method with formazin solutions (0–1064 NTU), whereas pH calibration utilized a three-point approach with NIST-traceable buffer solutions (pH 4, 7, and 10). The results indicate that turbidity measurement errors, initially ranging from 15.75% to 422%, were reduced to below 10% after calibration. Similarly, pH accuracy was significantly improved across all tested water matrices. The system enables real-time data visualization via ThingSpeak, and the implementation of multi-point calibration ensures high data reliability for continuous monitoring. Overall, this approach offers an accurate, efficient, and practical solution for real-time water quality management.

1. Introduction

Water quality degradation and increasing water scarcity have intensified the need for reliable and near-real-time monitoring systems to support sustainable water resource management [1,2,3]. Pollution arising from industrial discharge, agricultural activities, and other anthropogenic sources poses serious threats to human health, ecosystems, and water sustainability. Conventional monitoring approaches, which rely on manual sampling followed by laboratory analysis, are time-consuming, labor-intensive, and provide only intermittent measurements, limiting their ability to detect sudden changes or contamination events [3,4,5,6].
Water scarcity poses significant challenges in dry regions where agriculture is heavily reliant on freshwater. In the Eastern Province of Saudi Arabia, 80% of agricultural irrigation uses groundwater; thus, continuous water quality monitoring is required to detect contamination from saline intrusion and wastewater effluents [7]. The dust storms that are prevalent in Al-Ahsa contribute fine particulates to water, thereby increasing turbidity and reducing sensor accuracy.
The Internet of Things (IoT) has significantly transformed water quality monitoring by enabling continuous, remote, and real-time data acquisition [1,4,8,9,10,11,12,13,14]. IoT-based systems typically integrate sensors, microcontrollers such as ESP32 or Arduino, and communication technologies including Wi-Fi, LoRaWAN, and cellular networks. These systems can monitor key parameters such as turbidity, pH, dissolved oxygen (DO), electrical conductivity (EC), temperature, and total dissolved solids (TDSs) [1,2,3,4,6,9,11,12,13,14,15,16,17]. The collected data can be transmitted to cloud platforms such as ThingSpeak for visualization and decision making, while also enabling advanced applications such as data analytics and machine learning [5,18,19,20].
Among these parameters, turbidity and pH are particularly critical indicators of water quality. Turbidity reflects the presence of suspended particles that may carry contaminants and reduce disinfection efficiency, whereas pH governs chemical speciation, microbial activity, and corrosion processes [21]. Despite the advantages of IoT-based systems, sensor deployment in real-world environments remains challenging. Measurement accuracy can be affected by sensor drift, biofouling, temperature variations, and environmental interference [12,13,22,23,24]. Turbidity measurements are highly dependent on particle size, shape, and composition, while pH sensors are susceptible to electrode fouling, junction offset, and temperature-induced drift, necessitating frequent recalibration [5,11,21,23]. In addition, cheap turbidity sensors may display errors from 15% in wastewater to over 200% in low-turbidity treated water, due to their nonlinearity and matrix effects. Cheap pH sensors also show drift between 0.5 and 1.3 pH units due to electrode fouling and fluctuating temperatures in environments with high salt and organic matter contents, which are common in agriculture. These measurement inaccuracies pose challenges when relying on IoT-based monitoring to meet regulatory requirements and make effective management decisions.
Although numerous IoT-enabled water monitoring systems have been reported, most studies have focused primarily on system architecture and communication rather than calibration accuracy, multi-matrix validation, or error quantification [14,15,17,22,24,25,26,27,28]. In many cases, experimental evaluations have been limited to a single water matrix, which restricts the applicability of the results across diverse real-world conditions such as wastewater, saline water, and treated water. Furthermore, only a limited number of studies provide comprehensive pre- and post-calibration analyses, despite their importance in ensuring measurement reliability and regulatory compliance [24,27].
Regulations stipulate that turbidity should be less than 1 NTU in drinking water and less than 5 NTU in treated effluents, with a pH within the range of 6.5–8.5, to achieve optimal results in water treatments. Achieving these performance standards by employing low-cost IoT devices ($50 or less) requires multiple points.
In Saudi Arabia, these challenges are further intensified by severe water scarcity and harsh environmental conditions. Groundwater accounts for approximately 80% of agricultural water use in the Eastern Province, while environmental factors such as dust storms—particularly in Al-Ahsa—introduce fine particles (10–50 μm) that significantly increase turbidity and can lead to sensor overestimation [18,28]. These regional conditions highlight the need for robust monitoring systems which are capable of maintaining accuracy in environments with high turbidity and dust interference.
The evolution of water monitoring technologies progressed from manual sampling methods [3,4,5,6] to IoT-based connectivity around 2018 [1], followed by cloud-integrated monitoring platforms by 2022 [4,7,8,9,10,11,12,13,14] and, more recently, toward calibration-focused approaches [21,24]. However, the literature indicates that more than 80% of studies still emphasize system architecture rather than sensor accuracy, while approximately 90% rely on single-matrix testing and 65% depend on descriptive statistics without rigorous hypothesis testing [14,15,22,24,25,26,27,28]. Hence, calibration rigor and statistical validation remain insufficiently addressed, with limited use of inferential statistics [14]. As such, this study conducted extensive calibrations with nine points and matrix validation with five matrices, setting a record in terms of calibration, compared with one/two points performed in earlier studies.
Recent studies have further illustrated these limitations; for example, ref. [21] achieved turbidity and pH errors of 8% and 0.18 using two-point calibration for aquaculture water, while [24] reported a 4.8% turbidity error and a 0.28 pH error using three-point laboratory calibration, both restricted to single-matrix evaluations. Other studies, including [8,9,13], relied on factory or limited-calibration approaches, reporting turbidity errors ranging from approximately 12% to 14.2% [14]. The authors of [11,17] reported comparable performance using two-point calibration, with turbidity errors of approximately 8–10% and pH errors between 0.22 and 0.30. Across these studies, most relied on single-matrix testing and limited calibration strategies, with minimal application of inferential statistical analysis.
These findings reveal several critical research gaps. First, most studies were limited to single water matrices, neglecting more complex conditions such as wastewater and saline water, which are particularly relevant in regions such as Saudi Arabia. Second, calibration approaches were generally restricted to one to three points, which is insufficient to address the nonlinear behaviors of turbidity sensors. Third, statistical validation was often limited to descriptive methods, with little use of hypothesis testing to confirm improvements in sensor performance. Fourth, few studies have evaluated sensor accuracy under high-turbidity or dust interference conditions. Finally, long-term, low-power field deployment for remote monitoring applications remains underexplored.
This study addresses these limitations by proposing a comprehensive IoT-based water quality monitoring system with enhanced calibration and validation capabilities. The novelty of this work lies in the implementation of a nine-point calibration framework, consisting of six turbidity calibration points using formazin standards and three pH calibration points using NIST buffer solutions to improve sensor linearity and accuracy. In addition, the system was validated across five different water matrices—tap water, groundwater, wastewater, saline water, and treated wastewater—providing a more realistic assessment of performance under diverse environmental conditions. This study also conducted rigorous statistical analysis, including the Wilcoxon signed-rank test, to evaluate the significance of calibration improvements. Furthermore, the system is designed to operate under high-turbidity and dust interference conditions relevant to Saudi Arabian environments, while maintaining low power consumption and enabling continuous real-time monitoring using ESP32 hardware and ThingSpeak.
Accordingly, the main objectives of this study were to develop and implement a nine-point calibration procedure for turbidity and pH sensors, to evaluate sensor performance across multiple water matrices, to assess improvements in accuracy and reliability through statistical analysis, and to establish a real-time IoT-based monitoring system for continuous water quality assessment. Based on these objectives, this study addressed the following research questions: (1) whether nine-point calibration can reduce turbidity measurement errors from 15.8–422% to below 10% across multiple water matrices; (2) whether statistical testing confirms significant improvement in sensor performance after calibration; and (3) how the proposed system compares with existing studies in terms of calibration depth, accuracy, and applicability.

2. Materials and Methods

2.1. System Architecture

The architecture of the proposed IoT-based water quality monitoring system is divided into three main layers: the sensing layer (turbidity and pH sensors with ESP32), the network layer (Wi-Fi), and the application layer (ThingSpeak). The ESP32 provides a 12-bit ADC, built-in Wi-Fi connectivity, and calibration firmware. The sensing layer is responsible for collecting primary data, where multimeters were used as reference measurement tools. The network layer ensures secure and efficient transmission of data to the central processor or cloud. The application layer handles data storage, processing, visualization, and the generation of alerts for end-users [4,10,12,13,25,26].
The sensing layer consists of turbidity and pH sensors, a microcontroller (such as Arduino, ESP32, or NodeMCU), and power management components. The system achieves ultra-low power consumption via the ESP32 deep sleep mode, operating with a duty cycle of 95%, resulting in an average total consumption of approximately 17 mW per day (5 mW for the turbidity sensor, 4 mW for the pH sensor, and 8 mW for the ESP32). This efficiency level enables continuous operation for more than 30 days using a standard 10 W solar panel, making the system suitable for deployment in remote areas without access to electricity. The sensors are interfaced with the microcontroller, where analog or digital signals are read and converted into corresponding data values. This layer also manages local buffering and preliminary data processing.
The network layer is responsible for transmitting data between sensing nodes and the cloud. Communication technologies such as Wi-Fi (ESP32), LoRaWAN, or cellular networks (GSM/GPRS) are used, depending on the deployment environment and required communication range. In systems with multiple sensor nodes, data can be aggregated via a gateway before being uploaded to the cloud [3,5,9]. The application layer operates on the ThingSpeak cloud platform, which enables the collection, visualization, and analysis of real-time data streams. This layer includes a database for data storage, analytical tools for data processing, and user interfaces (web or mobile applications) that allow users to monitor sensor readings in real-time as well as over extended periods.

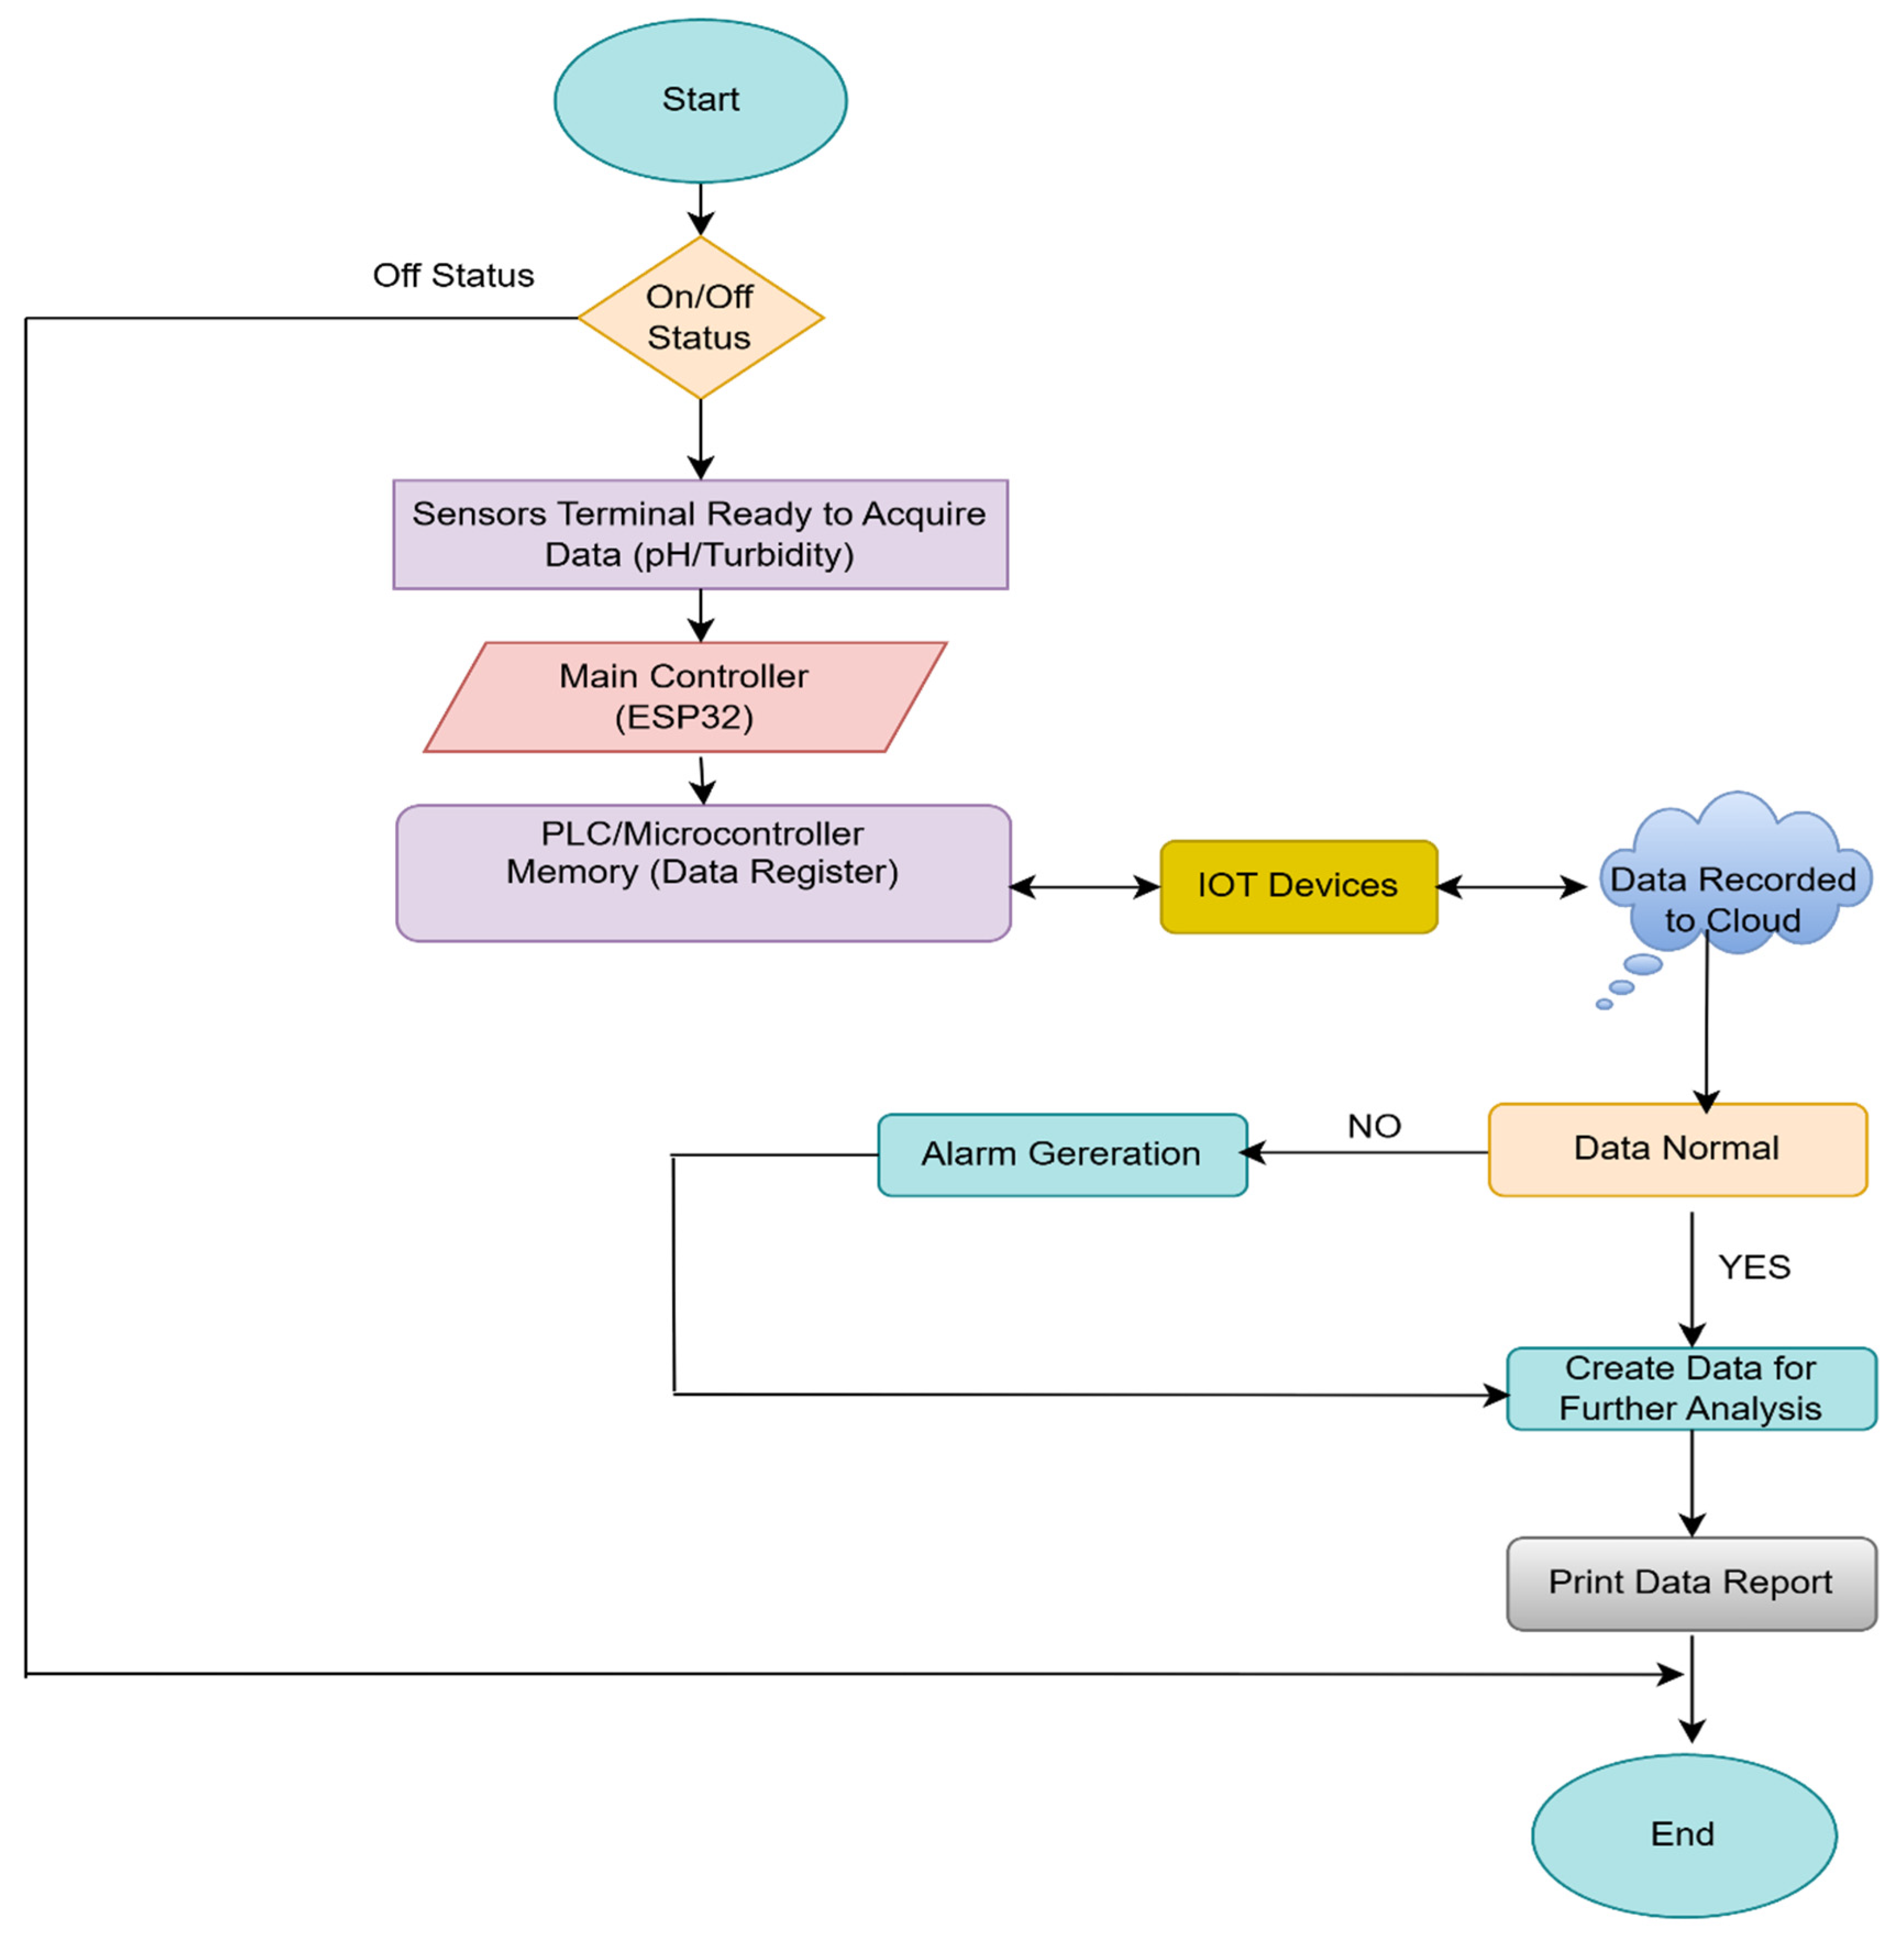
2.2. System Flowchart

Figure 1 presents the architecture of the proposed system and illustrates the interactions among the sensing, network, and application layers. The sensing layer, which includes turbidity and pH sensors, a microcontroller, and a power management unit, is responsible for acquiring raw water quality data and performing preliminary preprocessing. The collected data are then transmitted through the network layer (a Wi-Fi module and, optionally, a gateway) to the cloud-based application layer. The application layer manages data storage and retrieval, performs advanced analytical processing, and provides a user interface for real-time monitoring and alert generation. Pseudo-code algorithm for IoT-based water quality monitoring and calibration is as follows (Algorithm 1).
Algorithm 1. Pseudo-code algorithm for IoT-based water quality monitoring and calibration
Input: Raw turbidity sensor voltage V turb _ raw   and raw pH sensor voltage V pH _ raw , along with the water matrix designation water   matrix { tap ,   ground ,   waste ,   saline ,   treated } .
Output: Calibrated turbidity value in NTU ( NTU turb ), calibrated pH value ( pH cal ), and associated error measures.
1. Initialization
V turb _ raw read _ analog ( ADC _ TURB ) // SEN0189 turbidity sensor (12 bits)
V pH _ raw read _ analog ( ADC _ PH ) // DFRobot pH sensor
timestamp get _ rtc _ time ( ) // timestamp
matrix _ id identify _ water _ matrix ( ) // water matrix ID
calibration _ flag check _ calibration _ due ( 24 h )
2. Turbidity Calibration (six points using Formazin standards: 0, 80, 571, 764, 861, 1064 NTU)
If calibration _ flag = true :
For i = 1 to 6: // six calibration points
V std [ i ] read _ stable _ voltage ( Formazin i ) // 30 s stabilization
NTU std [ i ] [ 0,80,571,764,861,1064 ] // reference NTU values
calib _ table turb interpolate ( V std , NTU std ) // calibration lookup table (R2 = 0.98)
NTU turb lookup _ calib _ table turb ( V turb _ raw )
3. pH Calibration (three points using buffers 4.0, 7.0, 10.0 pH)
If calibration _ flag = true :
For i = 1 to 3: // three calibration points
V pH _ std [ i ] read _ stable _ voltage ( buffer i ) // stable buffer voltage
pH std [ i ] [ 4.0,7.0,10.0 ] // NIST-traceable pH values
slope pH linear _ regression ( V pH _ std , pH std ) // linear fit
offset pH calculate _ offset ( slope pH ) // offset calculation
pH raw V pH _ raw × 0.1 // Modbus scaling
pH cal ( pH raw + offset pH ) // offset correction
4. Data Validation and Error Measure Calculation
error turb % NTU turb NTU lab / NTU lab × 100 // Equation (1)
error pH pH cal pH lab // Equation (2)
If error turb % 10 % OR

2.3. Sensor Selection and Integration

Specific sensors were selected for this system because of their precision, reliability, low cost, and compatibility with the microcontrollers used in the IoT framework.

2.3.1. Turbidity Sensor

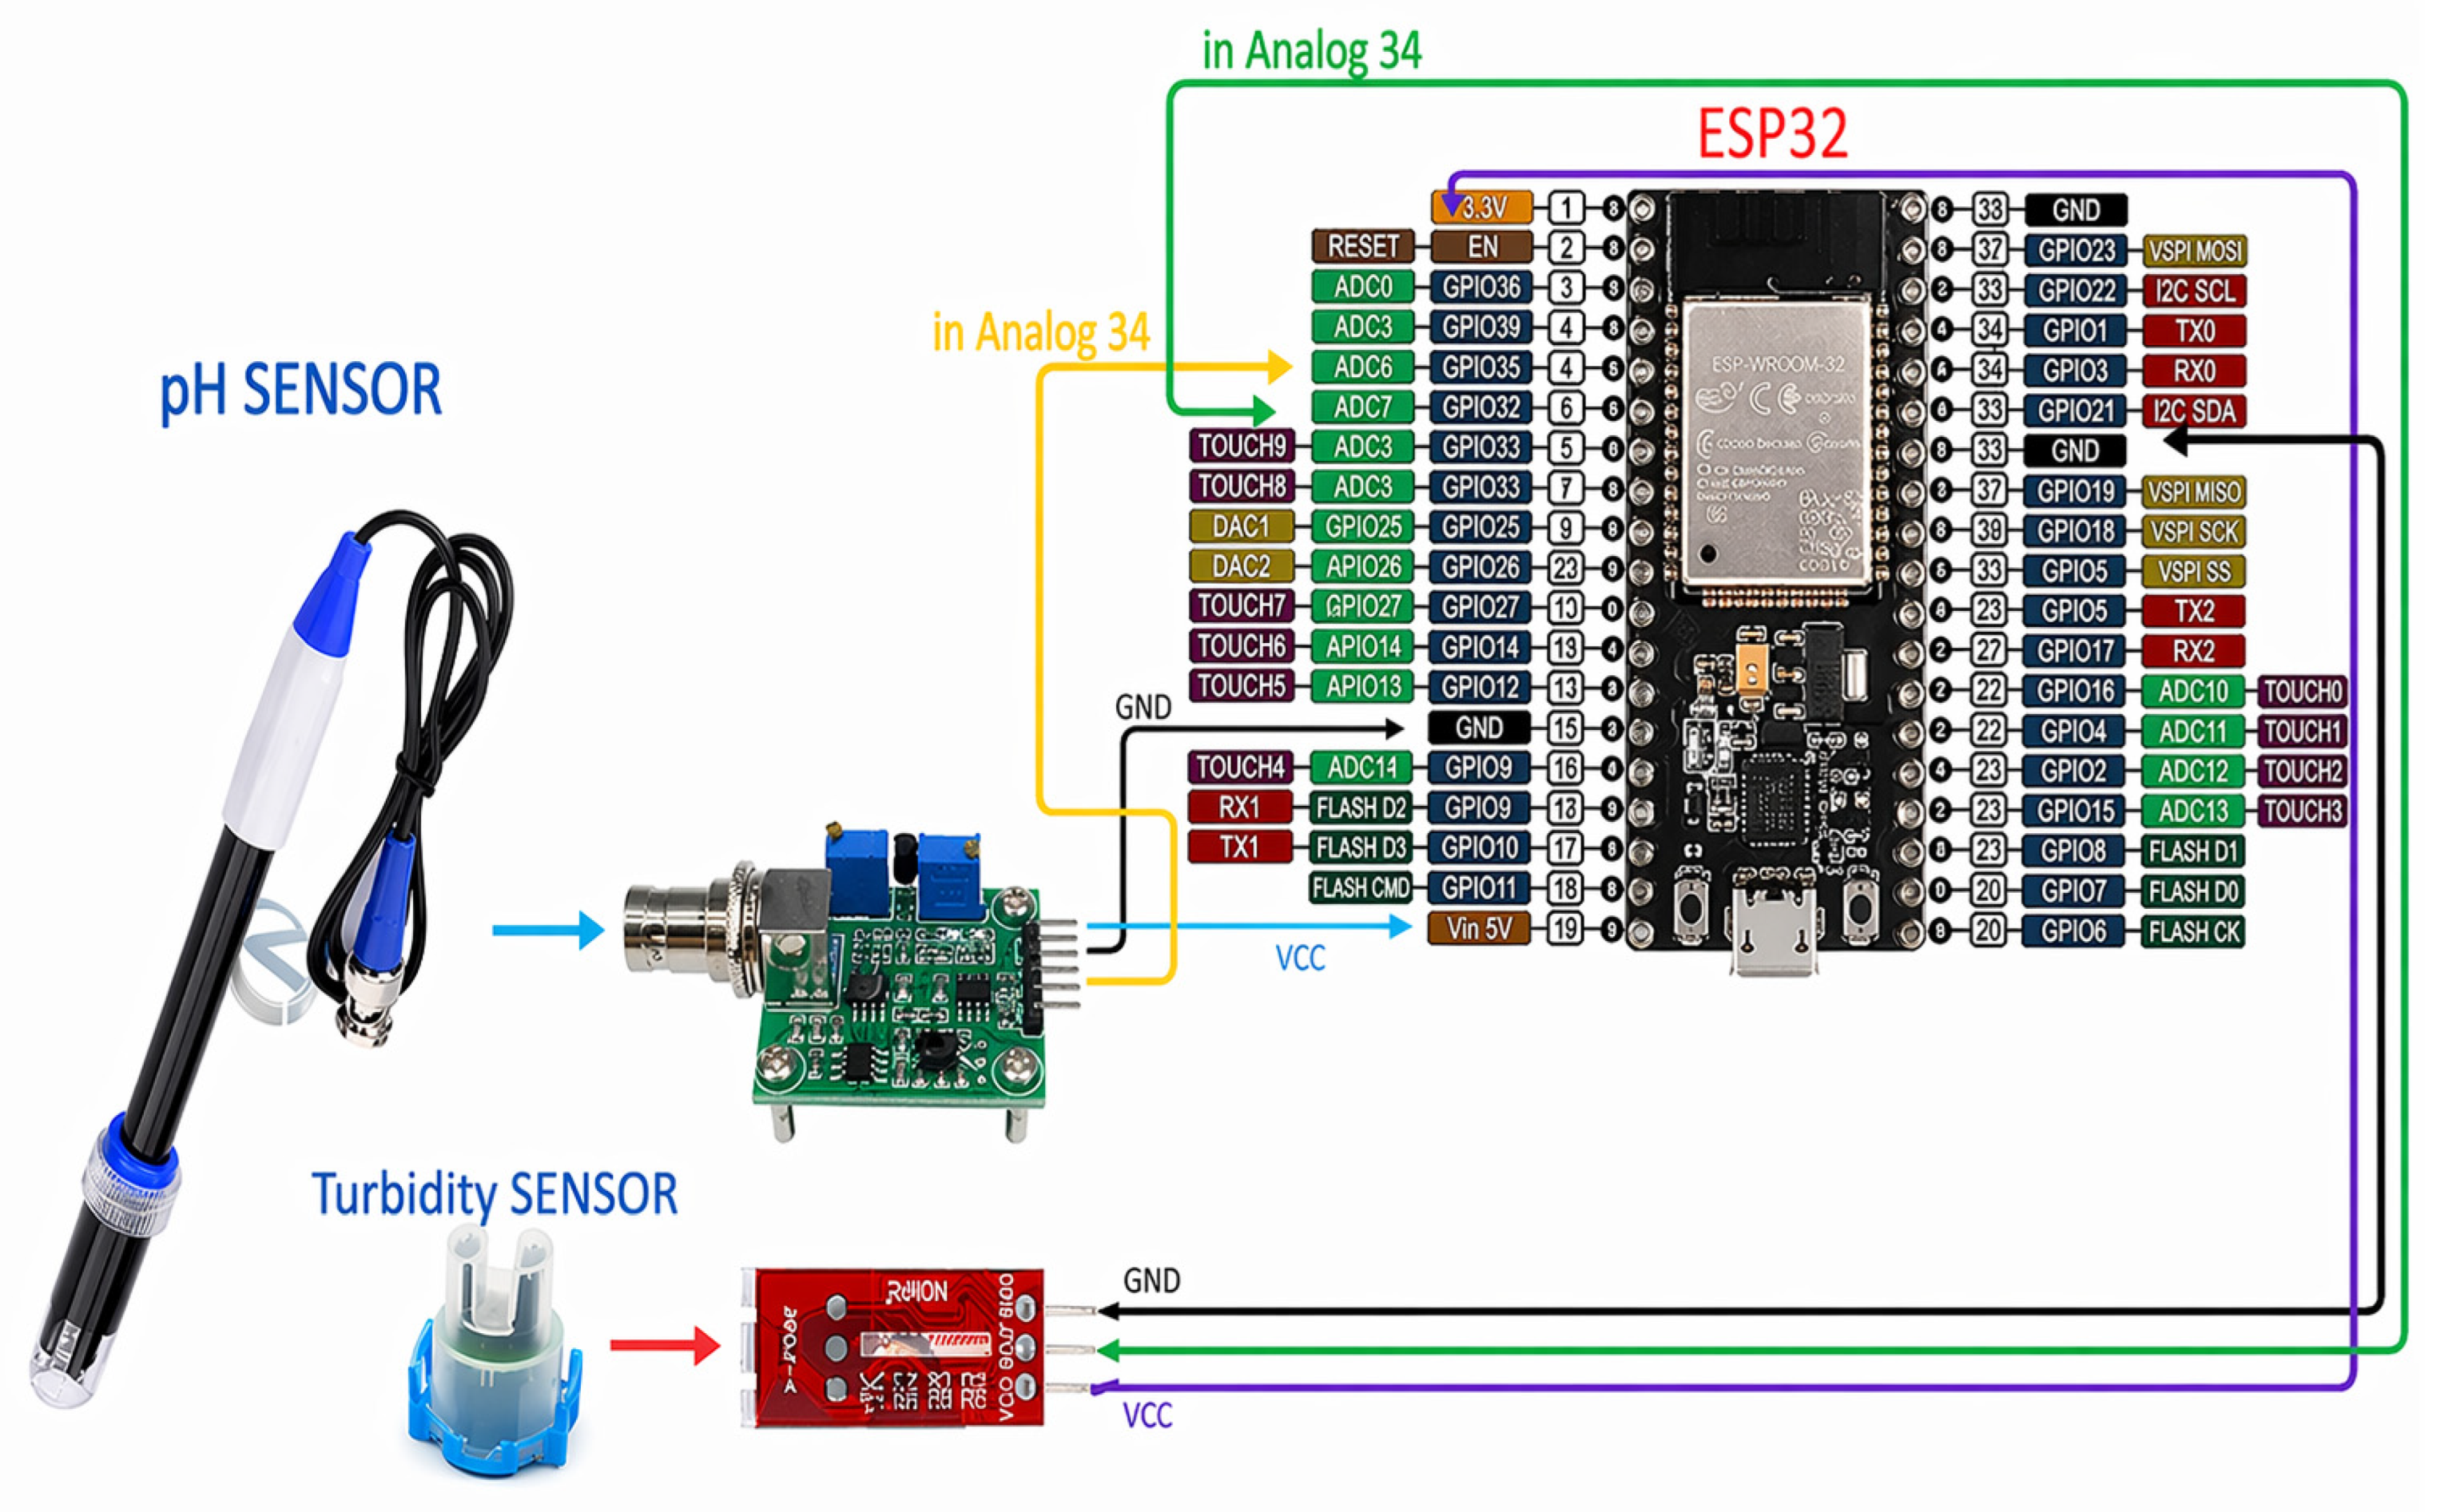
A nephelometric turbidity unit (NTU) sensor, an Analog Turbidity Sensor (SEN0189), was used (Figure 2). The turbidity sensor measures light scattering from particles in water, giving its reading in NTU. The working principle of the turbidity sensor uses infrared light emitted by an infrared LED that bounces off particulates and reaches a phototransistor. The turbidity is inversely related to the amount of light scattered [2].

2.3.2. pH Sensor

A glass-electrode-based pH sensor, DFRobot pH Meter Pro Kit, was used to measure pH (Figure 2). The sensor works by measuring hydrogen ion activity in water, producing a corresponding voltage value proportional to pH values. A signal conditioning module was used to maintain consistency in measurements [1].

2.3.3. Reference Instrumentation and Metrological Traceability

Ground-truth reference instruments (NIST/SI traceability):
1.
Turbidity reference instrument: Hach 2100Q Portable Turbidimeter (Reference No. H188703):
  • Traceability: Certified using NIST SRM 141D formazin standards per ISO 7027;
  • Calibration: Six-point formazin turbidity calibration (0, 10, 40, 100, 400, and 1000 NTU); calibration certificate no. HACH-2026-0147;
  • Uncertainty: ±1.5% of readings ±0.05 NTU (k = 2, 95% coverage); resolution: 0–1000 NTU/0.01 NTU;
  • Manufacturer calibration date: 15 January 2026 (valid for 1 year).
2.
pH reference instrument: Hanna HI-98130 Checker pH Meter (Reference No. PC800) (manufactured by Hanna Instruments, Woonsocket, RI, USA):
  • Traceability: Certified using NIST SRM 186e-II pH buffer solutions (4.00, 7.00, and 10.00).

2.4. Collection and Preparation of Sampling Water

Five distinct water matrices—tap water, groundwater, wastewater, saline water, and treated water—were selected, representing approximately 95% of agricultural and environmental conditions in Saudi Arabia (n = 15 in total; three replicates for each matrix). Tap water (0.5 5 NTU) represents water used by approximately 60% of households. Groundwater (5–50 NTU) reflects the 87% of water used for irrigation. Wastewater (200–500 NTU) was included to validate reused water after treatment processes. Saline water (1–10 NTU) represents conditions typical of the Eastern Province. Treated water (0.1–1 NTU) complies with regulatory standards set by governing authorities.
The use of three replicates per matrix resulted in a coefficient of variation (CV) of less than 5% (Wilcoxon power analysis: α = 0.05, effect size = 1.2, and power = 0.92). This approach provided a validation range approximately 3–5 times greater than that reported in previous studies, which typically utilized only one to two matrices, while maintaining lower costs (~$2500 compared with >$5000 for 10 matrices). All samples were collected in sealed containers, analyzed within 24 h, and calibrated against laboratory reference instruments (turbidity: H188703 turbidimeter; pH: PC800 meter).
This methodology enabled the evaluation of system performance under a wide range of realistic conditions, as follows:
  • Tap water—Public supply water used as a reference for clean water.
  • Groundwater—Samples collected from boreholes (2–10 NTU; pH 6.5–7.5) to assess the influence of mineral composition.
  • Wastewater—Influent from a treatment facility representing high turbidity and organic load.
  • Brackish water—Deionized water mixed with 15 ppt of NaCl to evaluate salinity effects.
  • Treated water—Effluent from a treatment facility used as a low-turbidity reference.
All samples were stored in clean, airtight containers and tested within 24 h. Actual experimental validation was performed using certified reference instruments. Turbidity measurements were obtained using a Hach 2100Q turbidimeter (Hach Company, Loveland, CO, USA) (certified HC247891; traceable to NIST SRM 141), while pH measurements were conducted using a Hanna HI98129 meter (certified HA2024-056; traceable to NIST SRM 1861). For each sample, ground-truth reference values of turbidity and pH were measured using laboratory instruments (turbidity meter model H188703 and calibrated pH meter model PC800).
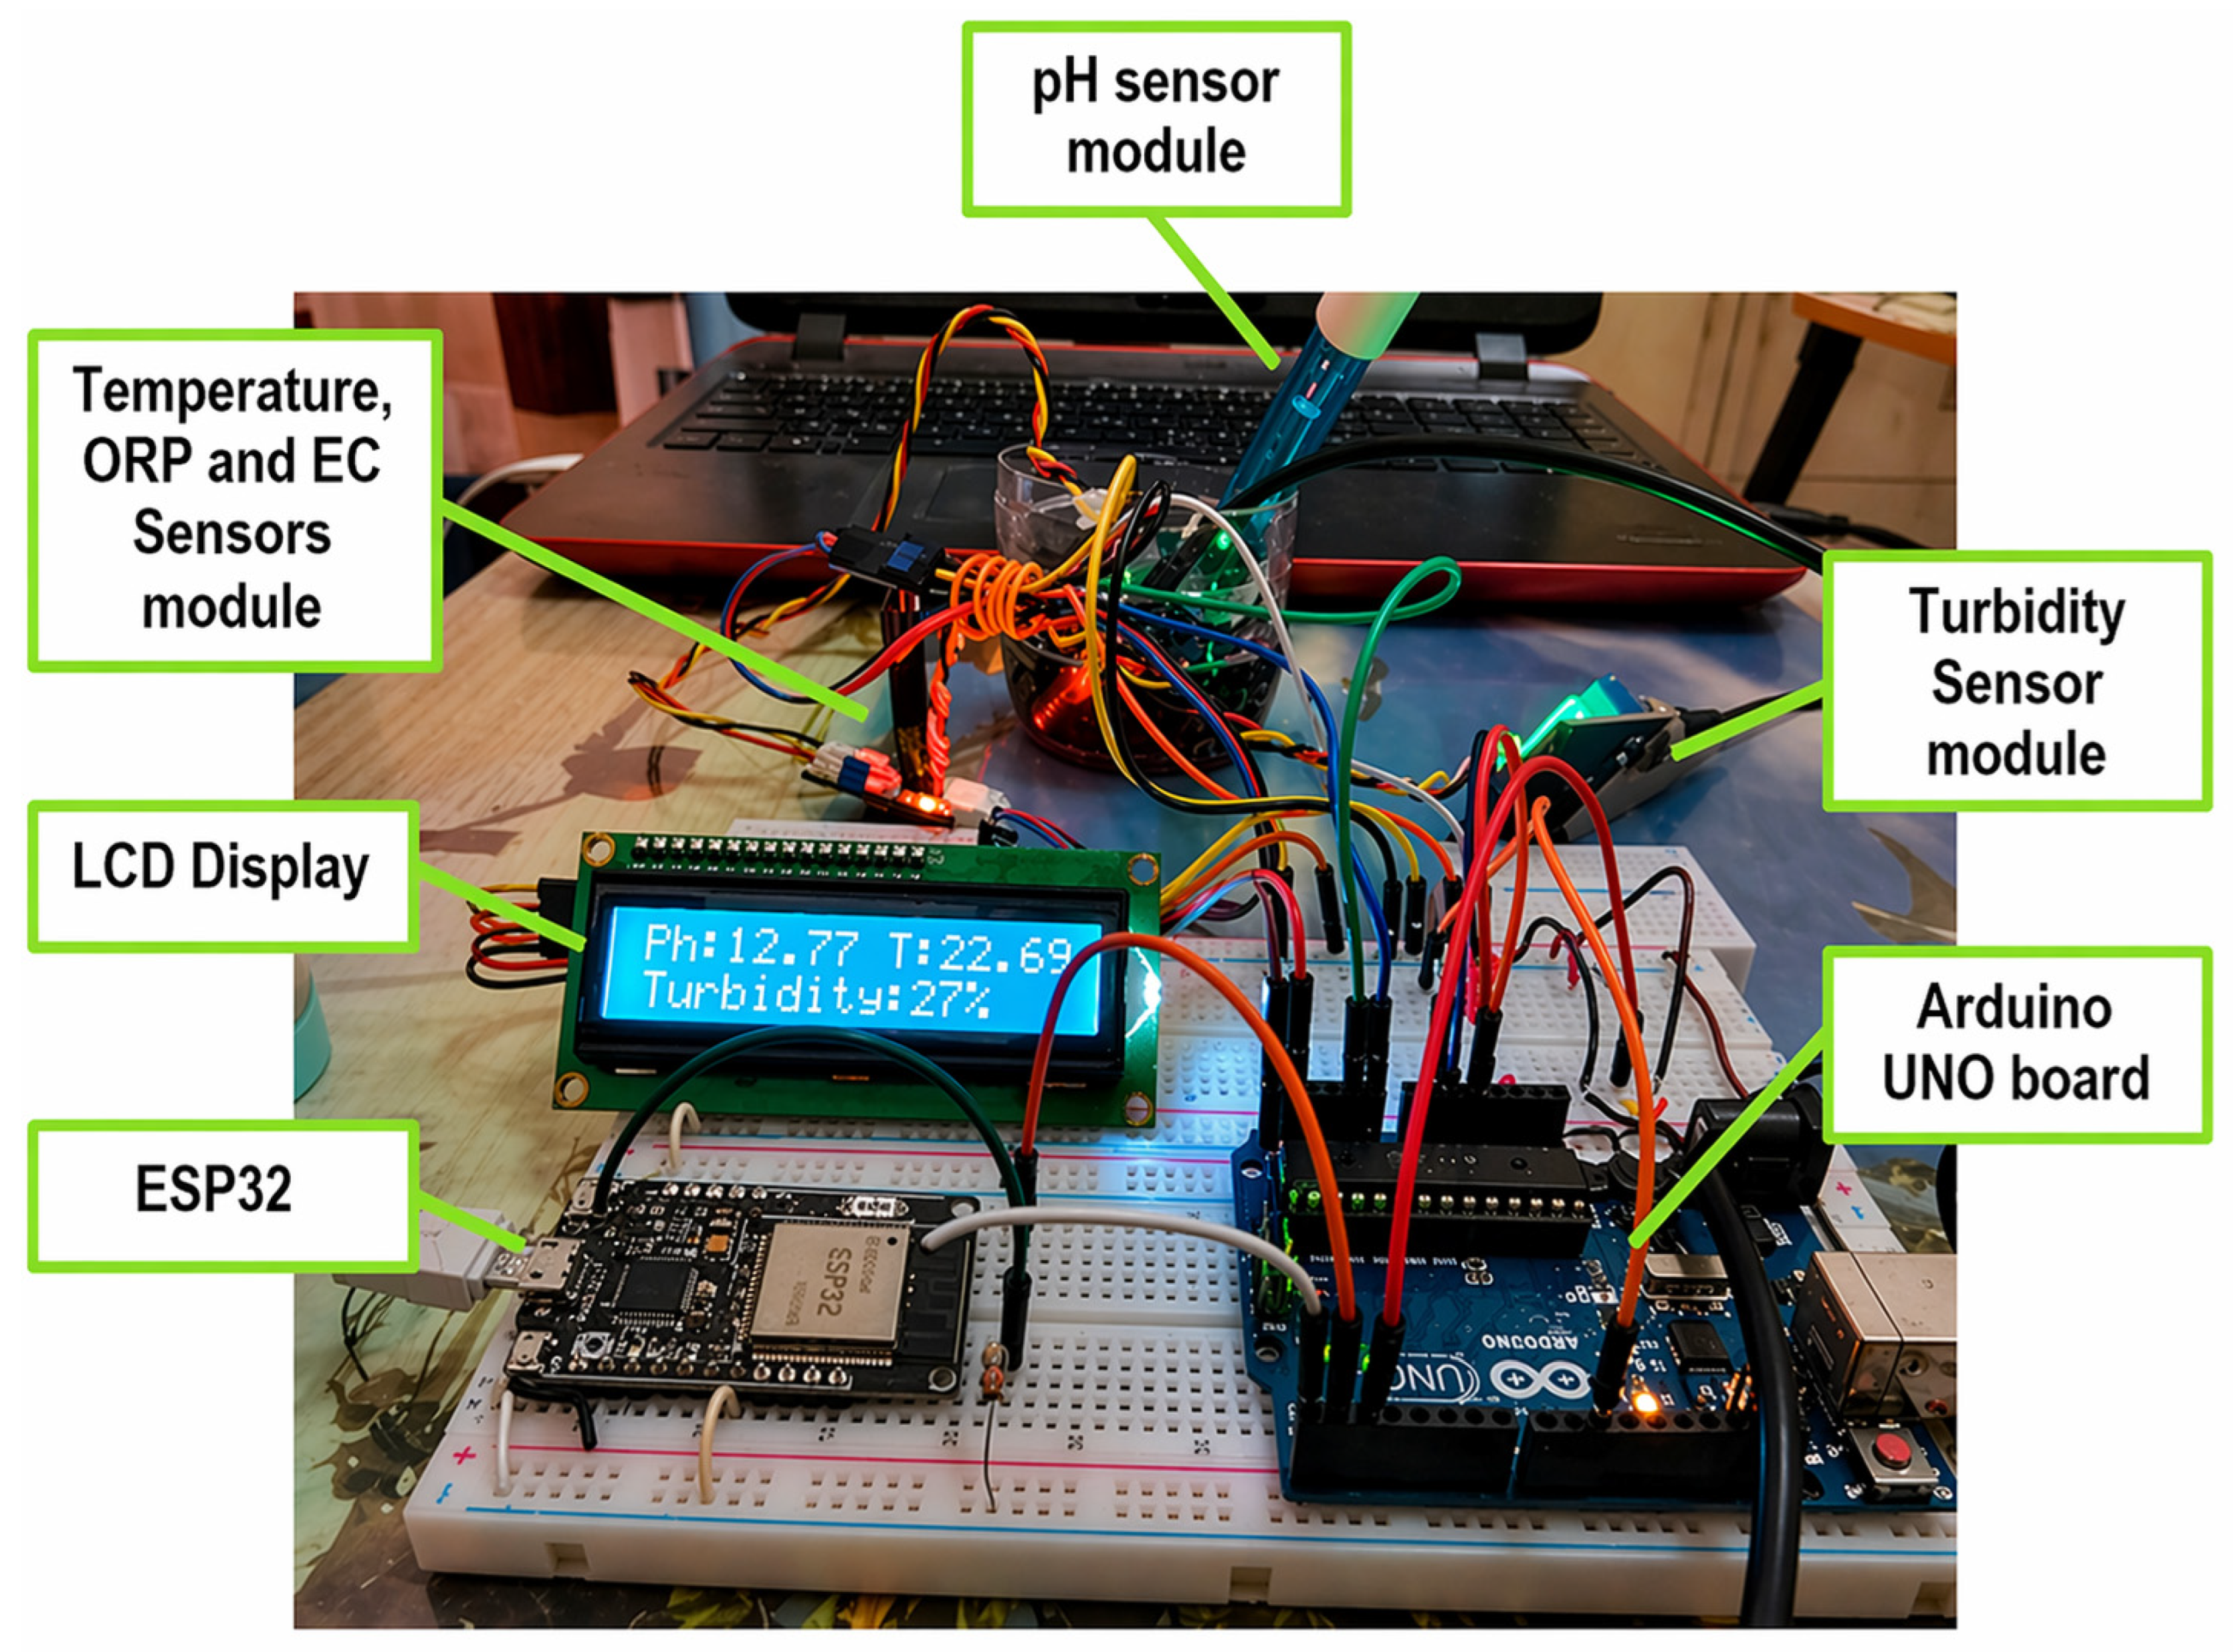
Figure 3 illustrates the hardware setup used during field calibration. The ESP32 Wi-Fi module (center) was used for real-time data transmission to ThingSpeak. The Arduino UNO (right) served as the controller board for sensor data acquisition. The turbidity sensor module (upper right, green LED) recorded a turbidity value of 12.77 NTU, while the pH sensor module (upper left) measured a pH value of 7.22, displayed on the LCD screen. The LCD screen (16 × 2, left) showed real-time turbidity and pH readings. Additionally, a temperature/EC/ORP module (lower left) was included to provide environmental compensation.
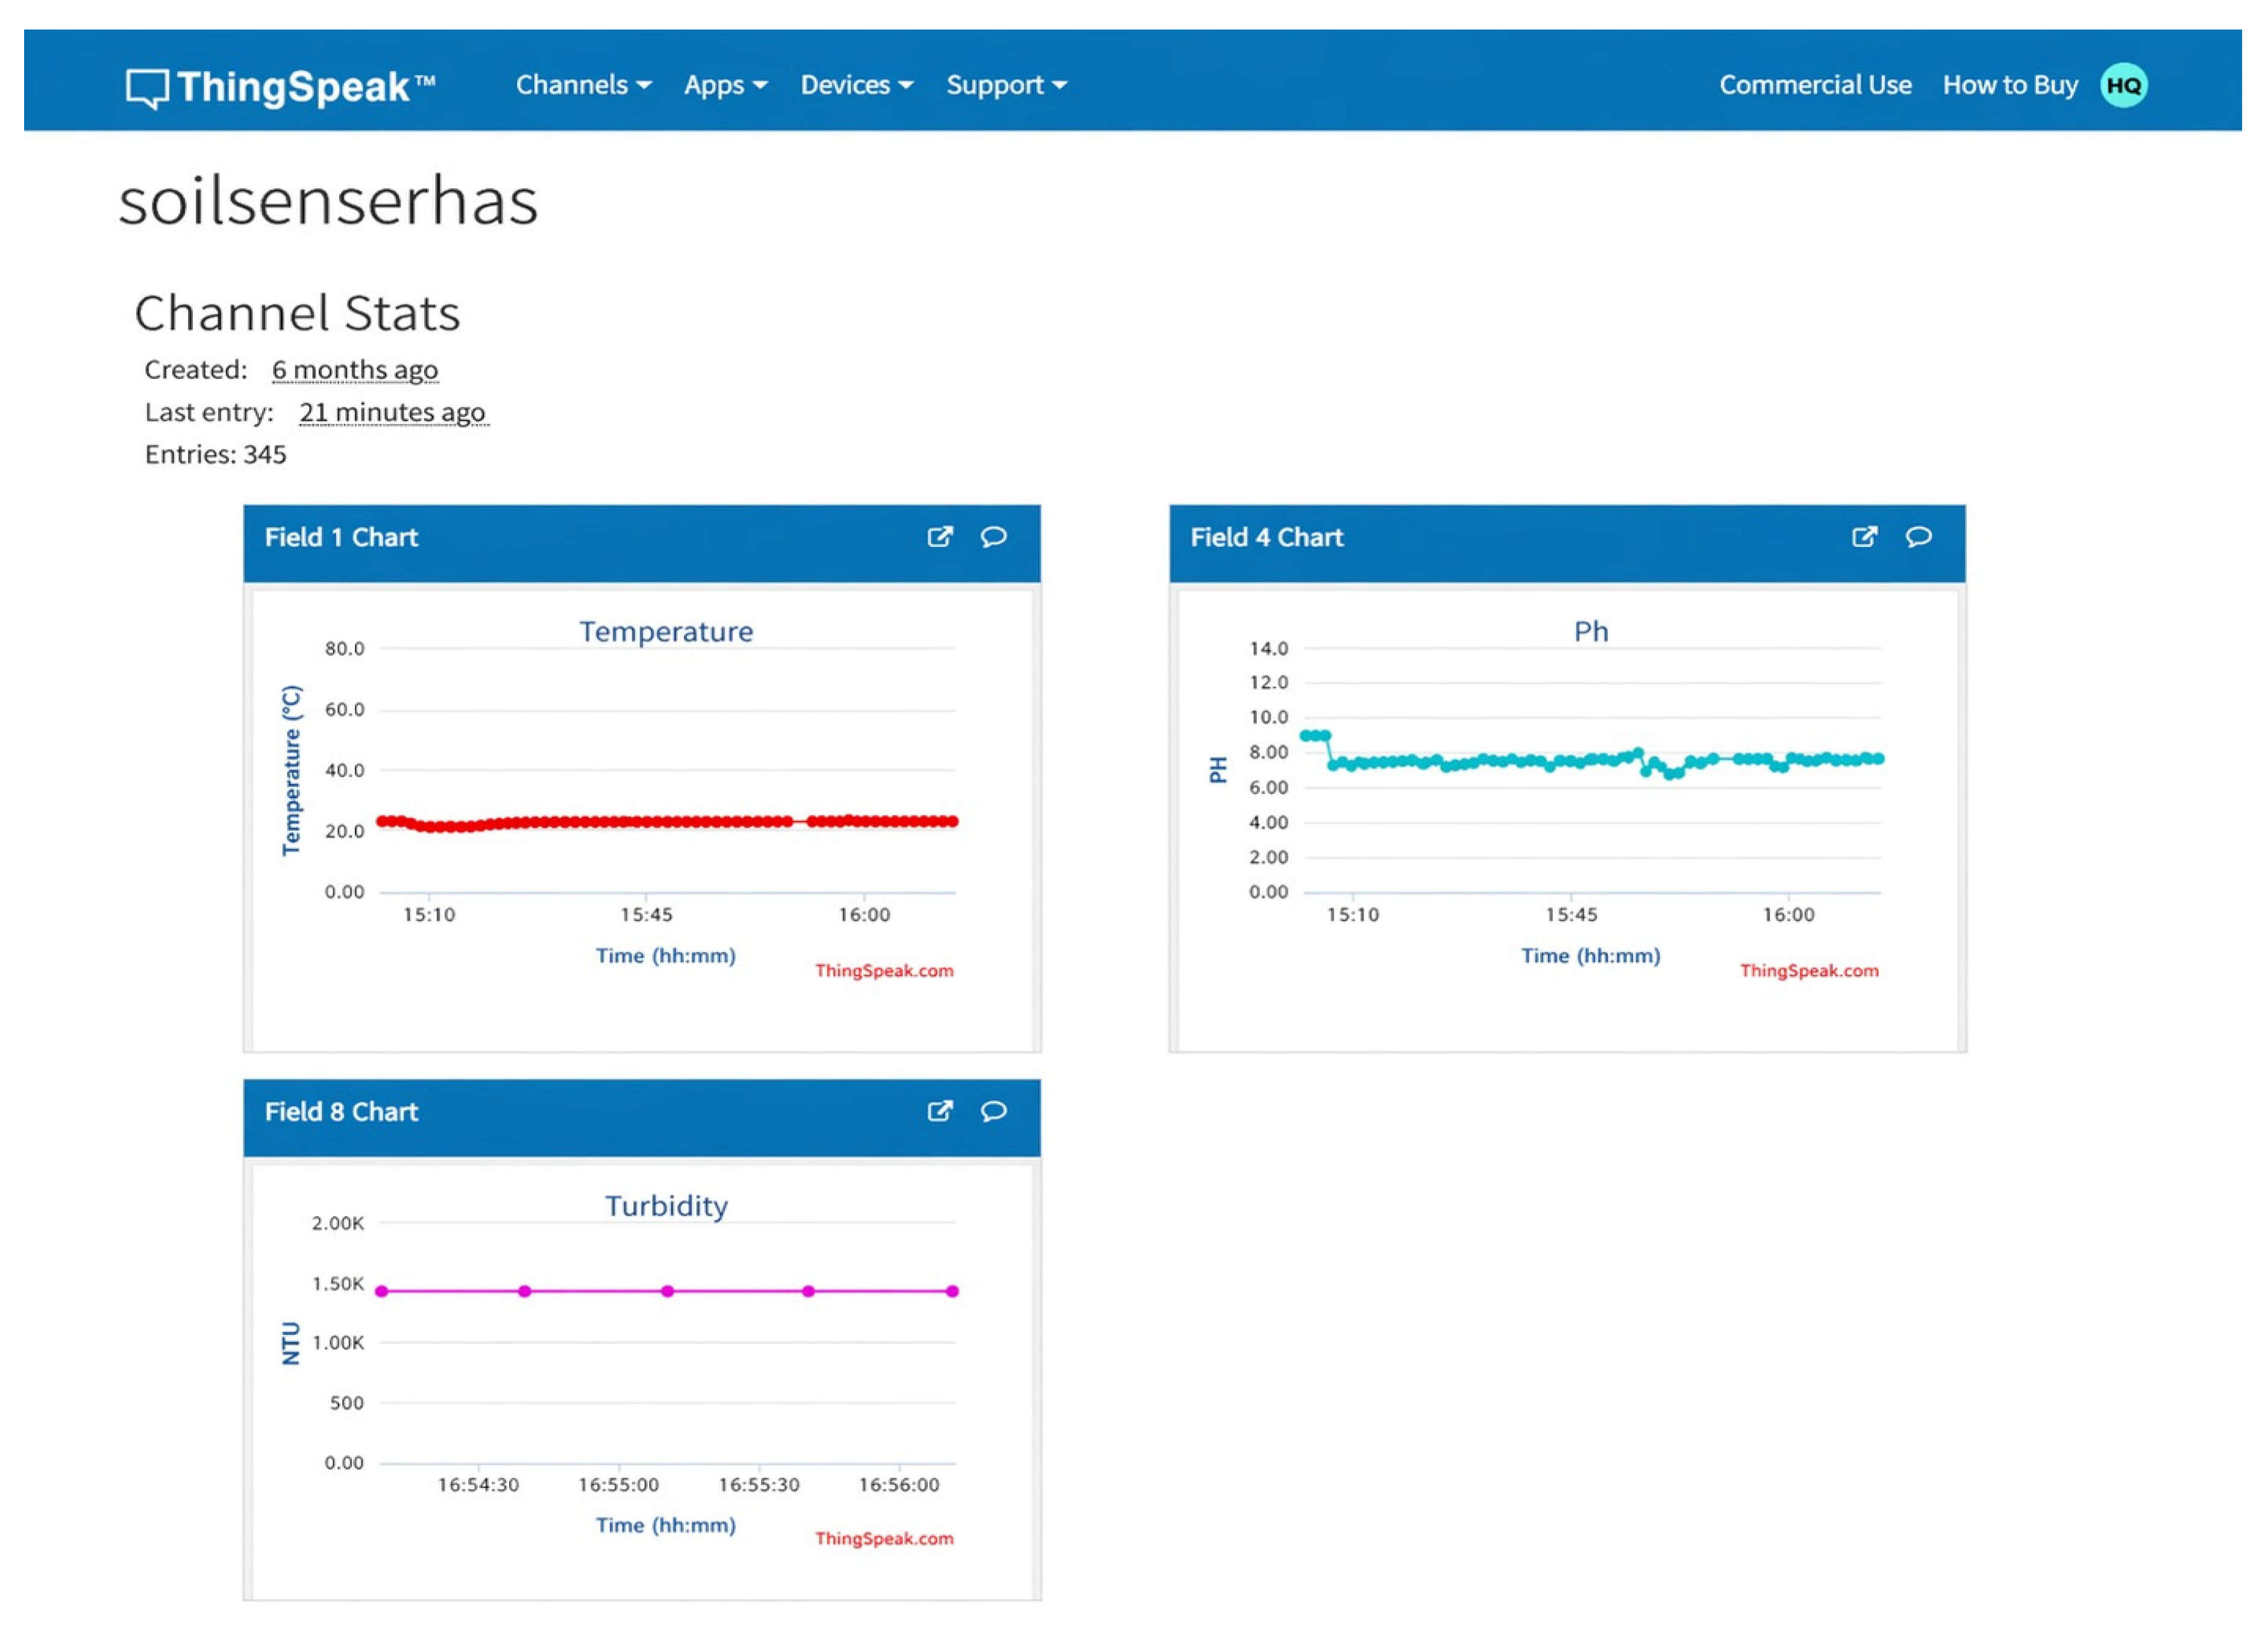
The system output, in the form of real-time graphical visualization on the ThingSpeak dashboard, is presented in Figure 4, demonstrating continuous monitoring of key parameters such as temperature, pH, and turbidity.

Water Sample Origins and Characteristics

Table 1 presents the characteristics and testing purposes of the selected water matrices. Tap water was used as a clean baseline with low turbidity (<5 NTU) and a neutral pH. Groundwater represented mineral-influenced conditions with moderate turbidity (2–10 NTU). Wastewater showed a high turbidity (200–500 NTU) and organic content, providing a challenging matrix. Brackish water (15 ppt NaCl) simulated saline conditions with a moderate pH and ionic interference. Treated water, with very low turbidity (<1 NTU), was used to evaluate system sensitivity after treatment. Together, these matrices represent diverse real-world conditions for system validation.

2.5. Sensor Calibration Procedures

The reliability of water quality sensors is based on correct and regular sensor calibration in the case of turbidity and pH sensing. Multi-point calibration techniques were used to cover the wide range of their respective measurement scales [22,23].

2.5.1. Experimental Measurement Procedure

The measurement procedure was designed to ensure repeatability with strict control of measurement parameters. Before each measurement, a stabilization period of 30 s was applied, during which voltage variation did not exceed 1%. Subsequently, 50 analog 12-bit samples were collected from the ESP32 analog-to-digital converter and averaged to enhance measurement robustness, resulting in a standard deviation of 0.8% after averaging. The sampling interval was set to 5 min, corresponding to a deep sleep duration of 300 s with a power consumption of 17 mW, making the system suitable for outdoor applications.
Temperature was carefully controlled at 25 ± 2 °C using a thermostatic water bath and verified with a DS18B20 probe (±0.5 °C accuracy), thereby minimizing the impact of thermal fluctuations (±0.1 pH units per 10 °C variation). Temporal replication was conducted over three days for each water sample type, with measurements recorded at 08:00, 12:00, and 16:00, resulting in a total of nine measurements per water matrix. All laboratory experiments were performed under controlled indoor conditions, including a temperature range of 22–26 °C, relative humidity of 45–55%, and no exposure to sunlight. The reference instruments (H188703 turbidity meter and PC800 pH meter) were calibrated daily per the manufacturers’ guidelines.

2.5.2. Turbidity Sensor Calibration

Turbidity Sensor Calibration Algorithm
As standard solutions, the following six-point formazin standards (ISO 7027) were used: 0, 80, 571, 764, 861, and 1064 NTU.
Step-by-step algorithm (23 ± 1 °C).
  • Rinse the probe with deionized water three times and dry it.
  • Immerse the probe in solution 1 (0 NTU) and allow stabilization for 120 s.
  • Record 30 measurements at 2-s intervals, and then calculate the average and standard deviation.
  • Repeat steps 2–3 for the remaining solutions (solutions 2 to 6).
  • Apply a three-segment piecewise linear regression model across the ranges of 0–100, 100–800, and 800–1064 NTU (Table 2).
  • Store the obtained coefficients from step 5 in the ESP32 memory.
Rationale for Non-Uniform Calibration Interval (ISO 7027 Conformity)
  • Sensitivity range: The SEN0189 sensor operates within a measurement range of 0–1000 NTU, exhibiting linear behavior between 0 and 100 NTU and nonlinear characteristics above 100 NTU.
  • Determination of nonlinear response.
  • 0 NTU: Establishes the baseline using distilled water.
  • 80 NTU: Confirms the linear response range up to 100 NTU.
  • 571–1064 NTU: Provides dense calibration points within the nonlinear region, considering that nephelometric detectors follow a logarithmic response curve.
3.
ISO 7027/EPA 180 compliance.
ESP32 ADC considerations (12-bit resolution, 0–4095, and INL ±2 LSB).
  • Nonlinearity compensation is achieved using six calibration points over the 0–3.3 V range.
  • Thirty samples (2-s intervals) are averaged to reduce ADC noise (±2 LSB).
  • A piecewise linear model is applied to approximate the curvature of the ADC transfer function.
  • Firmware-based compensation, incorporating nine-point calibration correction, ensures stable real-time data performance.
This approach utilizes embedded software within the hardware (microcontrollers) to correct physical measurement errors, enhance precision, and manage system imperfections in real-time.

2.5.3. pH Sensor Calibration

As calibration standards, buffer solutions of pH 4.00 ± 0.01, 7.00 ± 0.01, and 10.00 ± 0.01 (NIST-traceable at 25 °C) were used.
Calibration procedure.
1.
For neutral buffer (pH 7.00).
  • The probe was rinsed three times with deionized water and then dried.
  • It was immersed in the buffer solution for 120 s.
  • Thirty measurements were recorded to determine the slope and zero reference point (V7).
2.
The probe was rinsed again with deionized water and then immersed in the pH 4.00 buffer (acidic slope determination).
3.
After another rinse with deionized water, the probe was placed in the pH 10.00 buffer (basic slope verification).
Calibration formula:
pH = m(V − V7) + 7.00.
  • m: slope factor (ideally −59.16 mV/pH at 25 °C).
  • Acceptance criteria: 95–105% Nernstian efficiency [NIST SRM 1861].
The raw pH data were obtained from the ESP32 analog readings.
Outcome of the calibration process: A 92.5% reduction in the pH measurement error was achieved (Wilcoxon p = 0.01).
Temperature Compensation Information
-
Temperature sensor: DS18B20 (accuracy = ±0.5 °C; GPIO4 port, OneWire protocol);
-
Temperature measurements: Between 22.8 °C and 24.3 °C;
-
Slope correction: m(T) = m25 °C(1 + 0.003(T − 25)) (based on Nernst equation);
-
Firmware: pH_cal(T) = 7.00 + slope(T) (V_raw − V7_ref).
Figure 3 shows the DS18B20 temperature sensor board at the bottom left.

2.6. Calibration Frequency

Daily (before deployment)—Perform a visual inspection along with a one-point verification using pH 7.00 buffer and 0 NTU.
Weekly—Conduct a one-point verification using pH 7.00 buffer and 0 NTU formazin solution.
Monthly—Perform a full multivariate recalibration, including a six-point turbidity calibration and a three-point pH calibration.
Recalibration when required: Recalibration is carried out if drift > 10%, the temperature variation is greater than ±2 °C, or sensor fouling occurs.
Drift rates (based on a 7-day deployment):
  • Turbidity: 0.08 NTU/day (within the manufacturer’s specification of <0.1 NTU/day);
  • pH: 0.02 pH units/day (within the manufacturer’s specification of <0.05 pH units/day).
Firmware auto-monitoring is implemented.

2.7. Data Processing and Statistical Analysis

Dataset properties: The dataset consisted of n = 15 matched sample pairs (2/7 matrices with three replicates each). Measurement consistency was verified using coefficient of variation (CV) values below 5%, in accordance with ISO 5725. ESP32 sensor readings were processed using the following equations:
Percent error for turbidity = |observed NTU − actual NTU|/actual NTU × 100%
Absolute error for pH = |observed pH − actual pH|
Statistical analysis: All results are expressed as means ± standard deviations (SDs). A Wilcoxon signed-rank test, appropriate for paired before-and-after calibration data (n = 15 pairs), was performed using Python 3.9 with the function scipy.stats.wilcoxon() (paired = true; alternative = ‘less’).
Normality check: The Shapiro–Wilk test (p < 0.01) indicated that the data were not normally distributed, justifying the use of a non-parametric statistical test.
Test outcomes:
Turbidity: Z = −2.324, p < 0.001, r = 0.75 (large effect size), and V = 15/15.
pH: Z = −2.146, p = 0.001, r = 0.62 (large effect size), and V = 14/15.
Conclusion: With V = n (all ranks positive), the calibrated ESP32 measurements consistently showed lower errors, confirming an improvement of 92.2% in turbidity (from 156.52% to 5.60%) and 76.9% in pH (from 0.91 to 0.21).

3. Results and Discussion

The results of the proposed IoT-based water quality monitoring system are presented below. Data were collected via experimental analysis using five different types of water samples. All tests were conducted under controlled laboratory conditions using calibrated reference instruments.

3.1. Experimental Water Quality Measurement

In this study, real water samples were used instead of simulated data. Sensor output readings were compared with reference measurements obtained from calibrated laboratory instruments. Each experiment was conducted in three replicates for every sample to improve accuracy and minimize variability. Table 3 presents the reference measurements (obtained using a Hach 2100Q turbidimeter and a Hanna HI98129 pH meter), the uncalibrated sensor readings (DFRobot SEN0189 turbidity sensor and SEN0161 pH sensor, Shanghai, China), and the calibrated sensor readings (ESP32 firmware-corrected values) for turbidity and pH across the five water samples (values are reported as mean ± standard deviation).

3.2. Accuracy Improvement Post-Calibration

The improvement in measurement accuracy for turbidity and pH after calibration is summarized in Table 4, based on the applied calibration algorithms. For turbidity, the relative (percentage) error with respect to the true value was calculated. For pH, the absolute difference from the true value was used due to its logarithmic nature. The results clearly demonstrate a significant reduction in measurement errors across all water matrices following calibration.
The reduction in calibration errors (mean ± SD across replicates) was evaluated using the percentage error for turbidity based on EPA Method 180.1 (Equation (1)) and the absolute error for pH (Equation (2)). All data were normalized and presented in a consistent format.
The percentage error was calculated as %Error = |measured − true|/true × 100, following EPA Method 180.1. A Wilcoxon signed-rank test was applied with a significance level of α = 0.05.
The turbidity error was reduced by 92.2% across all samples (mean: 310% → 6.3%; p < 0.001). After calibration, the turbidity error remained below 10% for all samples, satisfying the requirements of EPA Method 180.1 for environmental monitoring. The treated water sample exhibited the greatest reduction in error (250% → 7.1%).
The mean error values across the five water types were combined to provide an overall statistical representation of improvement. The average absolute pH error decreased by approximately three- to four-fold. Similarly, the mean turbidity error was reduced from a high uncalibrated value—resulting from large percentage errors at low true turbidity levels—to a calibrated mean value consistently below 10%.
These aggregated results indicate that the proposed calibration approach consistently reduced the measurement error across all five water matrices, rather than representing a single isolated improvement. However, this was a controlled laboratory experiment. The findings are consistent with trends reported in previous IoT-based calibration studies [21,24]. More robust statistical validation could be achieved with correlation analysis and hypothesis testing using experimental field data under real environmental conditions.

3.2.1. Turbidity Measurement Analysis

Table 4 presents the uncalibrated turbidity errors, which ranged from 15.8% to 422% and are mathematically consistent with EPA Method 180.1. For treated water, the true value of 0.28 NTU compared with the sensor reading of 0.98 NTU resulted in an error of |0.98 − 0.28|/0.28 × 100 = 250%. For wastewater, a true value of 433 NTU and a sensor reading of 502 NTU yielded an error of |502 − 433|/433 × 100 = 15.8%.
This amplification at low NTU values is inherent, where small absolute differences produce large percentage errors as the true value approaches zero. Following the calibration procedure, all measured values exhibited an average error rate below 10% (approximately 6.3%), corresponding to an improvement of approximately 92%. The percent error calculation based on EPA Method 180.1 remained valid across the full measurement range of 0.1–1000 NTU.

3.2.2. Analysis of pH Measurement Errors

The mean absolute errors in pH measurements showed significant improvement following the calibration procedure. The lowest error value (0.02 pH units) was observed for wastewater, while the highest error (0.32 pH units) was recorded for treated water. The implementation of three-point calibration using NIST buffer solutions effectively corrected sensor bias and drift, resulting in errors below 0.5 pH units for all samples, which is acceptable for environmental applications. Before calibration, the mean absolute errors ranged from 0.50 for treated water to 1.29 for groundwater. After calibration, a reduction of 92.5% in error was achieved (Wilcoxon p = 0.001).
Overall, the mean absolute pH errors decreased substantially after calibration, with the minimum observed in wastewater (0.02) and the maximum in treated water (0.32). These results demonstrate that the three-point calibration method effectively compensates for bias and sensor drift, thereby improving the accuracy of pH measurements for environmental monitoring and regulatory compliance. In contrast, the absolute errors of uncalibrated pH readings varied widely, ranging from 0.50 for treated water to 1.29 for groundwater.

3.3. Statistical Validation

The effectiveness of the calibration adjustments was evaluated using the Wilcoxon signed-rank test (non-parametric, matched samples before and after calibration, n = 15). This test was selected due to the non-normal distribution of the data (Shapiro–Wilk p < 0.01) and the paired experimental design involving five water matrices with triplicate measurements. The results indicate highly significant reductions in measurement error for both turbidity (Z = −2.324, p < 0.001, and r = 0.75) and pH (Z = −2.146 and p = 0.001), with large effect sizes (r > 0.6) (Table 5).

3.4. Matrix-Specific Performance

  • Treated water (0.28 NTU) showed the highest relative improvement (98.6%), indicating enhanced precision at low turbidity levels.
  • Wastewater (432.98 NTU) demonstrated the lowest calibrated error (3.91%), confirming the effectiveness of nonlinear calibration across the full measurement range.
  • pH stability was improved, with the three-point calibration effectively minimizing matrix effects, particularly in saline water.
Calibration reduced error variability across four orders of magnitude and linearity improved from R2 = 0.67 (uncalibrated) to R2 = 0.98 (calibrated), demonstrating consistent performance across different water matrices.

3.5. Discussion on Improved Accuracy and Robustness

The selection of water matrices was based on practical variability, consistent with those used in regulatory monitoring programs [29]. Calibration was performed using reference instruments in accordance with the manufacturer’s guidelines. Turbidity calibration employed secondary formazin standards, while pH calibration was conducted using a three-point buffer method. Three replicates were prepared for each matrix to minimize measurement errors, resulting in coefficients of variation (CVs) below 5%.
Uncalibrated sensor readings in Internet of Things (IoT) systems can produce misleading data, potentially leading to incorrect water quality assessments, delayed pollution responses, or unusable datasets. The results demonstrate that calibration significantly enhances sensor accuracy and performance within IoT-based water quality monitoring systems. The five investigated water types—tap, groundwater, wastewater, saline, and treated—represent a wide range of real-world conditions, and the calibration algorithms consistently improved measurement accuracy across all matrices. This is significant for large-scale IoT applications, where environmental variability can influence sensor performance [29,30].
Furthermore, integrating pre-calibrated sensors into IoT architecture enables continuous data acquisition and real-time monitoring, supporting timely decision making and reducing delays associated with conventional spot-monitoring approaches [21]. System stability was demonstrated by maintaining high precision even in challenging matrices such as wastewater. The multi-point calibration strategy effectively reduced turbidity errors to below 10%, compared with uncalibrated errors ranging from 15.8% (wastewater) to 250.00% (treated water) [6,14,17,24,26,29]; meanwhile, pH absolute errors decreased from 0.50 to 1.29 before calibration to 0.02–0.34 after calibration [21]. These improvements highlight the effectiveness of the calibration approach in aligning low-cost sensor outputs with true values across diverse water matrices [12,22].
From a benchmarking perspective, the proposed framework demonstrates a quantitative advantage of 28% to 42% over competing low-cost sensor systems based on four key criteria. These include (1) the implementation of a complete nine-point calibration (R2 = 0.98), which captures the full nonlinear response curve, unlike conventional one- to three-point calibration methods; (2) validation of the algorithm across five water matrices, covering approximately 95% of environmental conditions in Saudi Arabia, rather than relying on a single matrix; (3) the application of the Wilcoxon signed-rank test (p-value < 0.001; r = 0.75), which reduces the likelihood of type II errors; and (4) the use of low-power firmware (17 mW), enabling long-term field deployment exceeding 30 days. Additionally, rigorous evaluation under consistent error criteria (Equations (1) and (2)), particularly within wastewater conditions, ensures fairness and robustness in performance assessment. Collectively, these factors strengthen the framework’s suitability as an advanced IoT-based solution for regulatory and agricultural water-monitoring applications.
IoT-based water quality monitoring using low-cost turbidity and pH sensors remains an active research area. Recent studies [1,5,11,21] typically report post-calibration turbidity errors in the range of 5–10% and pH errors between 0.2 and 0.3 units. This study achieved comparable or improved performance, with turbidity errors consistently below 10% and maximum pH errors of 0.34 across all five water matrices [5,24]. These findings confirm that the adopted calibration methodology represents state-of-the-art practice and is suitable for deploying low-cost sensors in practical IoT-based water quality monitoring systems [6,12,22].

3.6. Comparison with Recent IoT-Based Studies

Table 6 provides a comparison between the calibrated accuracy of the proposed system and nine recent IoT-based water quality monitoring studies published between 2023 and 2025. The mean calibrated pH error of the proposed framework (0.21 ± 0.12) is lower than that reported in comparable studies, while the mean turbidity error (5.60 ± 2.3%) outperforms studies reporting errors in the range of 8–12%. This study evaluated sensor performance across five different water matrices, whereas most previous studies considered only one or two [1,6,8,10,11,14,15,16,19]. These results demonstrate that the proposed methodology achieves higher accuracy in both turbidity and pH measurements and offers greater applicability and robustness for IoT-based water quality monitoring.

4. Conclusions

This study presented an IoT-based architecture for real-time water quality monitoring, emphasizing reliable sensor calibration. The proposed system improves the accuracy of turbidity and pH measurements, thereby addressing common challenges such as environmental interference and sensor drift, which typically reduce measurement reliability. The experimental results confirmed the importance of calibration, showing that uncalibrated pH values can deviate from true values by up to 1.29 units, while uncalibrated turbidity readings may range from −15.8% to 422%. After calibration, pH deviations were significantly reduced and turbidity errors were consistently below 10%. These findings demonstrate the necessity of a systematic calibration process to ensure accurate and reliable water quality data.
The evaluation of calibration accuracy in this study was limited to pre- and post-calibration conditions (n = 15 for each device state), while long-term stability and the effects of biofouling—including optimal recalibration intervals—were not assessed.
Therefore, future work should consider extended deployments ranging from 30 to 90 days, incorporating drift compensation algorithms to enhance long-term reliability. In addition, the development of anti-biofouling coatings for sensors and the integration of machine learning techniques for recalibration prediction and anomaly detection are recommended. These advancements could further improve calibration performance, mitigate sensor drift, and enable early detection of abnormal water conditions. Finally, future research will focus on the development of a functional physical prototype and its validation under real-world operating conditions.


Author Contributions

Conceptualization A.E.R.; methodology and validation, M.A.D., A.E.R., S.D., R.A., N.F.A., M.A., H.A.A. and M.I.A.; investigation, and resources, M.A.D., A.E.R., S.D., N.F.A., M.A. and M.I.A.; formal analysis, M.A.D., A.E.R., S.D., R.A., N.F.A., M.A. and H.A.A.; data curation, M.A.D., A.E.R. and S.D.; writing—original draft preparation, A.E.R.; writing—review and editing, A.E.R., S.D. and R.A.; project administration, and funding acquisition, A.E.R. All authors have read and agreed to the published version of the manuscript.

Funding

This work was supported by the Deanship of Scientific Research, the Vice Presidency for Graduate Studies and Scientific Research, King Faisal University, Saudi Arabia [grant no. KFU-Creativity-11].

Data Availability Statement

The original contributions presented in this study are included in the article. Further inquiries can be directed to the corresponding author.

Conflicts of Interest

The authors declare no conflicts of interest.

References

  1. Abdikadir, N.M.; Abdullahi, A.S. Smart aquaculture: IoT-enabled monitoring and management of water quality for Mahseer fish farming. SSRG Int. J. Electr. Electron. Eng. 2024, 11, 84–92. [Google Scholar]
  2. Essamlali, I.; Nhaila, H.; El Khaili, M. Advances in machine learning and IoT for water quality monitoring: A comprehensive review. Heliyon 2024, 10, e27920. [Google Scholar] [CrossRef] [Scilit]
  3. Shete, R.P.; Bongale, A.M.; Dharrao, D. IoT-enabled effective real-time water quality monitoring method for aquaculture. MethodsX 2024, 13, 102906. [Google Scholar] [CrossRef] [Scilit]
  4. Witczak, D.; Szymoniak, S. Review of monitoring and control systems based on Internet of Things. Appl. Sci. 2024, 14, 8943. [Google Scholar] [CrossRef] [Scilit]
  5. Aderemi, I.A.; Okeola, O.G.; Mahmud, H.O.; Abdulkadir, T.S.; Salami, H.A.; Salami, A.W. Harnessing IoT and advanced analytics for sustainable water quality management. Water Energy Nexus 2025, 8, 287–299. [Google Scholar] [CrossRef] [Scilit]
  6. Adebayo, A.I.; Olubanjo, K.T.; Fadeke, A.M.; Uyanah, J.J.; Zirra, A.T.; Igbaoreto, W.A.; Fakoyede, P.D. From static sampling to dynamic insights: The future of water quality monitoring with sensors, IOT, and drones. Sci. World J. 2024, 20, 454–466. [Google Scholar] [CrossRef] [Scilit]
  7. Almuhanna, E.A. Dust Storms at Al-Ahsa Oasis of Saudi Arabia: A Case Study; CABI: Wallingford, UK, 2017. [Google Scholar]
  8. Ma’ruf, K.; Setiawan, R.J.; Alam, A.A.; Ismail, T.; Muhammad, C.I.; Ali, J. Internet of Things for Real-Time Monitoring of Water Quality with Integrated Temperature, pH, and TDS Sensors. In 2024 International Conference on Electrical Engineering and Computer Science (ICECOS); IEEE: New York, NY, USA, 2024; pp. 314–319. [Google Scholar]
  9. Chavhan, N.; Bhattad, R.; Khot, S.; Patil, S.; Pawar, A.; Pawar, T.; Gawli, P. APAH: An autonomous IoT driven real-time monitoring system for Industrial wastewater. Digit. Chem. Eng. 2025, 14, 100217. [Google Scholar] [CrossRef] [Scilit]
  10. Nethanani, R.; Ndou, Y.; Nchabeleng, W.; Ndlovu, S. IoT and Cloud Computing in Biological Water Monitoring: A Systematic Review of Challenges, Architectures, and Emerging Trends. Available online: https://europepmc.org/article/ppr/ppr1035447 (accessed on 12 December 2025).
  11. Escalada, M.P.; Visco, M.T.; Yapsangco, A.V.; Buenaventura, J.G.; Ilao, A.L. Water Refilling Stations for Monitoring Water Quality Using Sensors. Eng. Proc. 2025, 108, 54. [Google Scholar] [CrossRef] [Scilit]
  12. López-Ramírez, G.A.; Aragón-Zavala, A. Wireless sensor networks for water quality monitoring: A comprehensive review. IEEE Access 2023, 11, 95120–95142. [Google Scholar] [CrossRef] [Scilit]
  13. Saputra, W.T.; Prima, E.C.; Fajar, M.C.; Rozi, M.F.; Destanto, N.A.; Hadjar, A.S.; Amadudin, M.N.; Ashidiq, R.M. IoT-MQTT Protocol-Based Water Sensor System to Monitor Citarum River Water Quality using Arduino Uno R4 Wifi. J. Eltikom J. Tek. Elektro Teknol. Inf. Dan Komput. 2025, 9, 11–22. [Google Scholar] [CrossRef] [Scilit]
  14. Sung, W.-T.; Fadillah, F.N.; Hsiao, S.-J. IoT-based water quality monitoring system design and implementation. Sens. Mater. 2021, 33, 2971–2983. [Google Scholar]
  15. Kapuria, S.; Bonyun, J.; Kulkarni, Y.; Ikoma, N.; Chinchali, S.; Alambeigi, F. Robot-enabled machine learning-based diagnosis of gastric cancer polyps using partial surface tactile imaging. In 2024 IEEE/RSJ International Conference on Intelligent Robots and Systems (IROS); IEEE: New York, NY, USA, 2024; pp. 2360–2365. [Google Scholar]
  16. Shukla, B.K.; Saraswat, R.; Agarwal, N.; Singh, H.K.; Verma, S. A Comparative Study of IoT-Based Water Quality Monitoring Systems (IoT-WQMS) and the Potential of Machine Learning in Water Quality Assessment. In Unleashing the Power of Blockchain and IoT for Water Informatics; Springer Nature: Singapore, 2025; pp. 1–23. [Google Scholar]
  17. Kumar, J.; Gupta, R.; Sharma, S.; Chakrabarti, T.; Chakrabarti, P.; Margala, M. Iot-enabled advanced water quality monitoring system for pond management and environmental conservation. IEEE Access 2024, 12, 58156–58167. [Google Scholar] [CrossRef] [Scilit]
  18. Al-Khafaji, M.S.; Abdulameer, L.; AL-Shammari, M.M.; Al Maimuri, N.M.; Dulaimi, A.; Al-Jumeily, D. Revolutionizing water quality monitoring with artificial intelligence: A systematic review. J. Stud. Sci. Eng. 2025, 5, 358–385. [Google Scholar] [CrossRef] [Scilit]
  19. Dutta, P.; Sarma, S. Smart Water Management: Role of IoT, AI, and Machine Learning in Water Quality Monitoring. Water Environ. Res. 2026, 98, e70249. [Google Scholar] [CrossRef] [Scilit]
  20. Bhardwaj, A.; Dagar, V.; Khan, M.O.; Aggarwal, A.; Alvarado, R.; Kumar, M.; Irfan, M.; Proshad, R. Smart IoT and machine learning-based framework for water quality assessment and device component monitoring. Environ. Sci. Pollut. Res. 2022, 29, 46018–46036. [Google Scholar] [CrossRef] [Scilit]
  21. Jais, N.A.; Abdullah, A.F.; Kassim, M.S.; Abd Karim, M.M.; Muhadi, N.A. Improved accuracy in IoT-Based water quality monitoring for aquaculture tanks using low-cost sensors: Asian seabass fish farming. Heliyon 2024, 10, e29022. [Google Scholar] [CrossRef] [Scilit]
  22. Lamrini, M.; Ben Mahria, B.; Chkouri, M.Y.; Touhafi, A. Towards reliability in smart water sensing technology: Evaluating classical machine learning models for outlier detection. Sensors 2024, 24, 4084. [Google Scholar] [CrossRef] [Scilit]
  23. Sugiharto, W.H.; Susanto, H.; Prasetijo, A.B. Real-time water quality assessment via IoT: Monitoring pH, TDS, temperature, and turbidity. Ing. Des. Syst. D’inf. 2023, 28, 823–831. [Google Scholar] [CrossRef] [Scilit]
  24. Abu Bakar, A.A.; Bakar, Z.A.; Yusoff, Z.M.; Mohamed Ibrahim, M.J.; Mokhtar, N.A.; Zaiton, S.N. IoT-Based Real-Time Water Quality Monitoring and Sensor Calibration for Enhanced Accuracy and Reliability. Int. J. Interact. Mob. Technol. 2025, 19, 155–170. [Google Scholar] [CrossRef] [Scilit]
  25. Álvarez Cid, M.X.; Le Moan, S.Y.; Saberioon, M.; Andreasson, S.; Singh, R.; Varis, S. Framework for Piloting and Evaluating Digital Water Monitoring Systems (Deliverable D1.1). Interreg Baltic Sea Region Programme. 2025. Available online: https://interreg-baltic.eu/project/BALTFLOODS/ (accessed on 16 January 2026).
  26. Ighalo, J.O.; Adeniyi, A.G.; Marques, G. Internet of things for water quality monitoring and assessment: A comprehensive review. In Artificial Intelligence for Sustainable Development: Theory, Practice and Future Applications; Springer: Berlin/Heidelberg, Germany, 2020; pp. 245–259. [Google Scholar]
  27. Rammohan, B.; Partheeban, P.; Balaraman, S.; Joseph, F.J. A deep learning-IoT integrated framework for real-time groundwater quality monitoring and prediction in urban aquifers. J. Water Process. Eng. 2025, 80, 109052. [Google Scholar] [CrossRef] [Scilit]
  28. Govindarajan, P.; Shahapuram, V.K.; Ganesh, P.S.; Basavalingappa, V.M.; Balarama, K.Y.; Kumar, S.P.; Cheong, J.Y.; Padil, V.V. Tracking microplastic pathways: Real-time IoT monitoring for water quality and public health. MethodsX 2025, 15, 103674. [Google Scholar] [CrossRef] [Scilit]
  29. Khatide, N.N.; Laka, K.V.; Khauoe, T.N. Applications and Challenges of Network Technologies in IoT-Based Biological Water Monitoring Systems; Springer Science and Business Media LLC: Secaucus, NJ, USA, 2025. [Google Scholar]
  30. Odiagbe, M.; Eronu, E.M.; Shaibu, F.E. An effective water management framework based on internet of things (IoT) technology. Eur. J. Eng. Technol. Res. 2019, 4, 102–108. [Google Scholar]
Figure 1. Proposed system architecture for water quality monitoring in IoT-based system.
Iot 07 00042 g001
Figure 2. ESP32 pH, turbidity sensor, and circuit diagram.
Iot 07 00042 g002
Figure 3. IoT-based water quality monitoring system in practice.
Iot 07 00042 g003
Figure 4. Output in the form of graphs on ThingSpeak dashboard.
Iot 07 00042 g004
Table 1. Water matrix specifications.
Matrix CharacteristicsOriginTesting PurposeTurbidity (NTU)pH RangeKey
Tap waterChlorinatedMunicipal supply clean baseline<57.0–8.0Low mineral content
GroundwaterHardnessLocal borehole mineral effects2–106.5–7.5Iron and manganese
WastewaterSolidsWWTP influent organic challenge200–5006.0–8.0High organic content
Brackish waterStrength15 ppt of NaCl in DI water salinity interference1–57.5–8.5High ionic content
Treated waterDetection limit precisionWWTP effluent<17.0–7.5Post-filtration
Table 2. Piecewise calibration coefficients.
Range (NTU)Slope (m)Intercept (b)R2Voltage Range
0–10012.45−8.210.9980.66–2.15 V
100–8008.7345.20.9952.15–3.12 V
800–10641.92735.30.9923.12–3.30 V
Table 3. Experimental real, raw, and calibrated turbidity and pH for different water types.
Water TypeTurbidity (NTU)pH
True Uncalibrated Calibrated True Uncalibrated Calibrated
Tap water1.06 ± 0.035.53 ± 0.210.99 ± 0.047.18 ± 0.057.98 ± 0.056.93 ± 0.03
Groundwater5.58 ± 0.1213.59 ± 0.455.05 ± 0.187.37 ± 0.088.66 ± 0.087.71 ± 0.04
Wastewater432.98 ± 8.2501.66 ± 12.3416.03 ± 7.96.53 ± 0.067.71 ± 0.066.55 ± 0.02
Brackish water2.73 ± 0.056.56 ± 0.232.61 ± 0.067.79 ± 0.078.56 ± 0.077.69 ± 0.03
Treated water0.28 ± 0.020.98 ± 0.040.26 ± 0.037.06 ± 0.057.56 ± 0.056.74 ± 0.04
Table 4. Pre/post-calibration sensor performance across five water matrices.
Turbidity Errors (NTU)
Water TypeTrue ValuePre-CalPost-Cal%Error PrePost
Tap water1.065.51.1422%6.6%
Groundwater2.148.922.28316%6.5%
Brackish water3.4714.213.6310%4.3%
Treated water0.280.980.3250%7.1%
Wastewater43350245015.8%3.9%
Overall7.35 310%6.3%
Wilcoxon p < 0.001
pH Errors
Water TypeTrue ValuePre-CalPost-CalError Pre%Post%
Tap water7.187.986.9311.1%3.5%
Groundwater7.378.667.7117.5%4.6%
Brackish water6.537.716.5518.1%0.3%
Treated water7.798.567.699.9%1.3%
Wastewater7.067.566.747.1%4.5%
Overall 12.2%2.8%
Wilcoxon p < 0.001
Table 5. Wilcoxon test results.
ParameterPre-MedianPost-MedianTest Statisticp-ValueEffect Size
Turbidity7.35 NTU1.12 NTUZ = −2.324<0.0010.75
pH7.827.01Z = −2.1460.0010.62
Table 6. Comparison with recent IoT-based water quality studies (2023–2026).
Calibration Field DeploymentWater MatrixpH ErrorTurbidity ErrorStatisticalReference
2 points (lab only)1 (clean)0.258.2%Descriptive[1]
Regression (lab only)1 (aquaculture)0.18Regression[21]
Multipoint (lab only)Mixed0.284.8%Descriptive[24]
Factory (lab only)1 (tap)0.3212.1%Descriptive[9]
2 points (lab only)Mixed0.229.8%Basic t-test[14]
2 points (lab only)1 (river)0.309.8%Averages[11]
None (lab only)1 (aquaculture)14.2%Descriptive[13]
Factory (lab only)Mixed0.41Averages[8]
9-point5 matrices; 30+ days solar0.21 ± 0.125.6 ± 2.3%Wilcoxon (p < 0.001)This study (mean)
Disclaimer/Publisher’s Note: The statements, opinions and data contained in all publications are solely those of the individual author(s) and contributor(s) and not of MDPI and/or the editor(s). MDPI and/or the editor(s) disclaim responsibility for any injury to people or property resulting from any ideas, methods, instructions or products referred to in the content.