Article

An IoT-Enabled Digital Twin Architecture with Feature-Optimized Transformer-Based Triage Classifier on a Cloud Platform

by
Haider Q. Mutashar
,
Hiba A. Abu-Alsaad
* and
Sawsan M. Mahmoud
Department of Computer Engineering, Mustansiriyah University, Baghdad 10052, Iraq
*
Author to whom correspondence should be addressed.
Submission received: 28 September 2025 / Revised: 14 November 2025 / Accepted: 19 November 2025 / Published: 26 November 2025

Abstract

It is essential to assign the correct triage level to patients as soon as they arrive in the emergency department in order to save lives, especially during peak demand. However, many healthcare systems estimate the triage levels by manual eyes-on evaluation, which can be inconsistent and time consuming. This study creates a full Digital Twin-based architecture for patient monitoring and automated triage level recommendation using IoT sensors, AI, and cloud-based services. The system can monitor all patients’ vital signs through embedded sensors. The readings are used to update the Digital Twin instances that represent the present condition of the patients. This data is then used for triage prediction using a pretrained model that can predict the patients’ triage levels. The training of the model utilized the synthetic minority over-sampling technique, combined with Tomek links to lessen the degree of data imbalance. Additionally, Lagrange element optimization was applied to select those features of the most informative nature. The final triage level is predicted using the Tabular Prior-Data Fitted Network, a transformer-based model tailored for tabular data classification. This combination achieved an overall accuracy of 87.27%. The proposed system demonstrates the potential of integrating digital twins and AI to improve decision support in emergency healthcare environments.

1. Introduction

Emergency departments (EDs) play a pivotal role in the healthcare system. They provide urgent medical care to patients in serious situations. Triage, a core process in EDs, is the systematic classification of patients based on the urgency and severity of their medical cases. It helps to ensure that the most critical patients receive the immediate care they need. However, in hospitals, EDs encountered problems due to limited resources and a large number of patients where emergency cases are unpredictable. In this case, there are many challenges, including overcrowding, delays in care, and mis-triage, which can directly endanger patients’ lives, in cases of under-triage, by causing delays in essential treatment, or over-triage, by leading to the unnecessary prioritization of non-urgent patients. These effects on clinical outcomes and resource utilization are significant [1,2]. In this study, we specifically address three key challenges: variability and inconsistent assessments by different clinicians, time pressure and delays during patient evaluations, and the lack of contextual awareness of patients’ conditions. Each of these factors contribute to mis-triage and impacts the accuracy, timeliness, and adaptability of emergency care. Many studies have demonstrated that the accuracy of triage protocols may not meet the accepted standard of optimal performance. In certain instances, the accuracy rate observed has been as low as 59% [3]. An additional study conducted in three hospitals in the southern United States demonstrated that the overall triage accuracy was 67%, with 25% under-triage and 8% over-triage [4]. How skilled staff were, how chaotic things were, plus how busy they were significantly impacted these numbers.
Recently, to address these challenges, the development and updating of advanced technologies such as Digital Twin (DT), the Internet of Things (IoT), Artificial Intelligence (AI), and cloud computing have been constantly advocated for. The DT represents the real-time, virtual counterpart of the ED, capturing the status of beds and the current physiological state of patients and associated clinical data. This digital model is continuously updated through IoT sensors and serves as the core mechanism for addressing the lack of tracking of patient conditions that evolve over time [5]. The IoTs offer some opportunity for monitoring patients in real time, through sensor-based wearable systems, in collecting vital signs such as heart rate, body temperature, oxygen saturation, etc., [6,7]. The term AI is used to define computer systems that are capable of simulating human reasoning, learning from data, and adapting to new situations. Machine learning (ML) and deep study [8,9] can be used to guide automated judgment procedures with earlier gathered information.
The integrated services of cloud infrastructure offer the basis of all such automated systems, providing the ground base for accommodating the other services and technology involved, allowing the focus of achieving scalable, reliable, secure, real-time processing of data [10]. The integration of these technologies thus offers the opportunity to create a scalable, automated real-time support system that could enhance the triage process in healthcare [11]. While studies have been initiated to digitize the EDs, the current triage in it lacks an accurate, adaptive real-time process. Most recent studies have developed ML-based solutions for triage but fail to concentrate on the objective design of the system, nor do they take into the environment and practical use of the system in a smart ED environment. In addition, a few studies effectively included the IoT, the DT, and the AI as part of a system that can represent accurately the condition of the patient in any given moment, automatically triaging the patient and staying scalable to real environments. In contrast, this research suggests a technical framework for real-time triage automation using a DT system for the planned proof of concept. This setup merges IoT sensors with the DT technology, simultaneously recording the patient's current status, enhanced for an AI model that allows the severity classification of the patients based on the established triage methods. It is worth standing out that there are different triage protocols which are used in several parts of the world. The most common triage protocols include the Australasian Triage Scale (ATS), the Canadian Triage and Acuity Scale (CTAS), the Manchester Triage System (MTS) in the UK, the Emergency Severity Index (ESI), the South African Triage Scale (SATS), and the Korean Triage and Acuity Scale (KTAS). The dataset employed in this study adheres to the KTAS protocol [12]. There are several options which can be explored to acquire the implementation of DT platforms in the cloud. One of these is the use of Google Cloud IoT Core with partner solutions. The other option is the use of Amazon Web Server IoT TwinMaker [13,14]. However, in this study, Microsoft Azure was used due to the fact of its being able to support the DT Definition Language (DTDL) that facilitates the modeling of the DT. Also, several other cloud services are offered by Azure, such as Azure functions, Azure DTs, and Azure IoT Hub. These services are critical for the successful implementation of the system [15,16,17]. Our solution is designed to be protocol-agnostic (e.g., KTAS, ESI, or MTS) and infrastructure-agnostic. In theory, if two countries adopt the same triage protocol, the patient assessment process should be consistent, and our system's core logic would remain valid. The difference in location would primarily necessitate retraining the AI model based on the locally adopted protocol. Additionally, the synthetic minority over-sampling technique, combined with the Tomek links (SMOTETomek v0.13.0) method, was used to address the issue of imbalanced data, and the Lagrange element optimization (LEO) method was used to optimize the process of feature selection [18]. The final triage prediction process was carried out using the Tabular Prior-Data Fitted Network (TabPFN v2.1.3), which is a transformer-based model for the classification of tabular data [19]. This combination ensures a cohesive and robust support system capable of predicting the level of triage in real time and thus reducing the response time to emergency cases. Additionally, to evaluate the performance of our prediction model, it is compared against several traditional classifiers, including decision trees, Random Forests, XGBoost, Support Vector Machines, logistic regression, K-Nearest Neighbors, Naive Bayes, and Microsoft Azure AutoML.
Previous DT healthcare works focused on monitoring, visualization, or prediction with conventional ML. A few works combined DTs with real-time IoT integration and advanced tabular transformers. In contrast, the present work proposes an architecture that combines IoT sensors, DT modeling, cloud workflow, and AI triage. It also uses TabPFN as a classifier with feature optimization and demonstrates a case study on the KTAS dataset and a small-scale local dataset, showing accuracy that outperforms baseline methods.
The rest of the paper is structured as follows: Section 2 will contain a review of the related works. The methodology is presented in Section 3, followed by data collection and preprocessing in Section 4. System evaluation is in Section 5. Section 6 and Section 7 will present results and discussion. Finally, conclusions and future works are presented in Section 8.

2. Related Work

The need for DTs and the associated technologies of the IoT has grown in many applications, especially in industry and healthcare [20]. For instance, in [21], the authors developed a model-based design-enhanced asset administration shell for generic production line design. This case demonstrates how standardized digital representation and consistent model integration can enable scalable DT deployment in complex manufacturing environments. A recent study in industrialization showed a successful new integration of DTs with spatial-temporal deep learning algorithms. This solution has improved the reliability of predictive models in real time, with improvements in the performance of the systems themselves and with a small amount of data sampling [22].
The primary use of DTs in healthcare is for individual patient modeling, health facility operational modeling, or medical device modeling. The use of DTs has been shown to improve personalized patient modeling due to the integration of data from electronic health records, wearable devices and imaging modalities. For instance, the authors in [23] propose a cloud-based data storage system using Amazon Web Services (AWSs) cloud capabilities that allows for the real-time processing of data. This architecture utilizes IoT sensors and message queuing telemetry transport (MQTT) for seamless data integration and efficient data flow. No predictive analytics or decision support systems are included in this analysis. Corral-Acero et al. [24] implemented a cardiac DT for the prediction of arrhythmia utilizing multimodal data. Their data demonstrates the feasibility of DTs regarding the cardiovascular patient population, where DT simulations were utilized for the diagnosis and subsequent treatment of heart diseases, based on the DT modeling of individual patients. While this data provides a tremendous insight into cardiac physiology, it is not utilized for the real-time emergency ED triaging of multiple patients, which is the ultimate goal of the authors. The present work proposes the utilization of a DT in the ED system level context as its goal. Using the integration of IoT and DT with ML in [25] enabled real-time patient monitoring and the prediction of a critical healthcare system. Researchers in another study developed a lightweight DT model optimized for edge-based health monitoring. They highlighted the potential of utilizing DTs in personalized healthcare, particularly in human DTs augmented with mobile AI-generated content. This integration has the potential to transform treatment planning and monitoring processes [26]. In [27], the authors present another personal DT system for emergency care that utilizes IoT sensors for vital sign monitoring and augmented reality to display patient data in real time. Each patient is linked to QR-based DTs, which enables informed treatment through live data and visual overlays. While these studies focus on integrating IoT and DT technologies into healthcare services, they lack decision-making mechanisms to improve ED services or minimize emergency response time.
A considerable number of researchers have employed transformer architecture for tabular data in the healthcare sector. For example, a tabular transformer generative adversarial network was proposed to generate synthetic data that can effectively consider the relationships between variables that may be present in the healthcare tabular dataset. Transformers have the capacity to examine the interrelationships among the columns in each record by means of a multi-attention mechanism. This approach has demonstrated significant promise in the field of healthcare, as evidenced by its capacity to generate artificial data that exhibits a high degree of similarity to authentic healthcare datasets [28]. In [29], the authors introduced CardioTabNet, a transformer-driven framework designed specifically for clinical cardiovascular data. The system utilizes the capabilities of the tab transformer architecture to efficiently extract the most impactful features from clinical data. Consequently, downstream classical models exhibited a substantial enhancement in performance.
Many studies have been conducted to develop a model training architecture for better automated triage classification. The authors in [29] developed a gradient boosting classification model and SMOTE for data balancing using the Canadian Triage and Acuity Scale. Another study has used a parallel structure for feature selection and an attention mechanism for feature extraction. They employed TransNet for classification [30]. Wang et al. [31] used a heterogeneous, data-driven ML model that included natural language processing to improve hospital triage efficiency. Feretzakis et al. [32] employed auto machine learning (autoML) to select the most suitable classification model based on performance. The selected classifier was a gradient boosting machine. The MIMIC-IV-ED dataset was utilized for the training phase. The primary objective was to predict hospitalization and admission outcomes. Feretzakis et al. [33] employed ED data to predict hospital admissions using ML algorithms. They explored the popular classifiers and obtained a strong result using a Random Forest classifier. Jiang et al. [34] employed data of 17,661 patients for the evaluation of several algorithms, including multinomial logistic regression, XGBoost, Random Forest, and gradient-boosted decision trees. The study shows the potential of ML algorithms to enhance the accuracy of the triage process in an emergency environment for cardiovascular conditions. The objective of the study was to predict patients with suspected cardiovascular disease in the ED. In [35], the authors proposed a stacking model for triage classification, combining multiple methods, including Support Vector Machines, gradient boosting machines, and logistic regression. The authors in this study utilized the KTAS dataset for model training. That said, most triage studies rely on private and locally sourced datasets for model training and do not provide a clear framework for integrating their models into real-world settings. In contrast, this study utilizes a public dataset and emphasizes the integration of DT technology within a smart environment, supported by a real-time classification system. It is important to note that this study constitutes the second stage of a larger research project, as previously mentioned. The objective of our previous study was to minimize emergency response time by providing a list of ranked hospitals based on arrival time and available beds, using an IoT-powered, DT-based framework [11]. The main aim of this study is to minimize the triage process time, effort, and errors once patients arrive.

3. Methodology

3.1. System Design Considerations

Most EDs around the world struggle with overcrowding, wherein the number of patients exceeds the capacity of the ED’s resources. Additionally, there are human triage errors; severity assignments variability has been observed by nursing personnel, as well as the potential of under-triaging and over-triaging critical patients, which leads to either endangering patients’ lives or draining ED resources. Several causes that contribute to the unreliability of triage processes in EDs are connected to human factors. The root causes of manual triage errors can be categorized into three main areas: human variability and inconsistent assessment, time pressure and assessment delays, and the lack of context and dynamic tracking. While there are efforts to digitalize EDs, they still frequently face difficulties due to scarce personnel, fluctuating bed space, or broken communication between monitoring devices. Because of these problems, assistance is needed to speed up decisions, improve uniformity, and better organize care [36,37,38].
Our system was designed to provide an automated decision-support structure for ED triage. The procedure that the ED will follow with the proposed system commences when the patient arrives and is registered. Upon arrival, the patient's vital signs, including heart rate, body temperature, and oxygen saturation, are automatically collected through IoT sensors. The transmission of these readings to the cloud is followed by their synchronization with the patient's DT, which is a virtual representation that reflects the patient's physiological condition in real time. Clinical staff members can access this DT via a user interface that displays all relevant data and permits the manual input of non-sensor information, such as age, gender, and arrival mode. After all the necessary data are entered, the system initiates the AI-based triage prediction model, which employs an analysis of the integrated physiological and contextual data to predict the triage level. The result is displayed immediately on the user interface, providing staff with an objective, data-driven triage recommendation. The predicted triage level is a critical factor in determining the patient's treatment priority and acceptable waiting time. This information is primarily used for resource allocation by assigning high-severity patients to available emergency beds and allocating staff attention accordingly. Lower-severity cases are then processed in accordance with a predetermined waiting time schedule, thereby facilitating the maintenance of a balanced equilibrium between the perceived urgency of patients and the availability of resources. It also provides situational awareness of hospital capacity through dynamic monitoring of bed occupancy. Finally, the system offers a decision support mechanism for patient routing via a DT representation of the hospitals and ED beds. This mechanism integrates patient and hospital information to minimize delays in care. The focus when initiating the system was on addressing the identified needs, with the objectives of reducing delays, minimizing human error, and enhancing resource allocation. To achieve this, it is required to implement an automated vital sign monitoring structure, a dynamic digital model to track patients and resources, and a reliable AI-based triage classification system.

3.2. System Overview

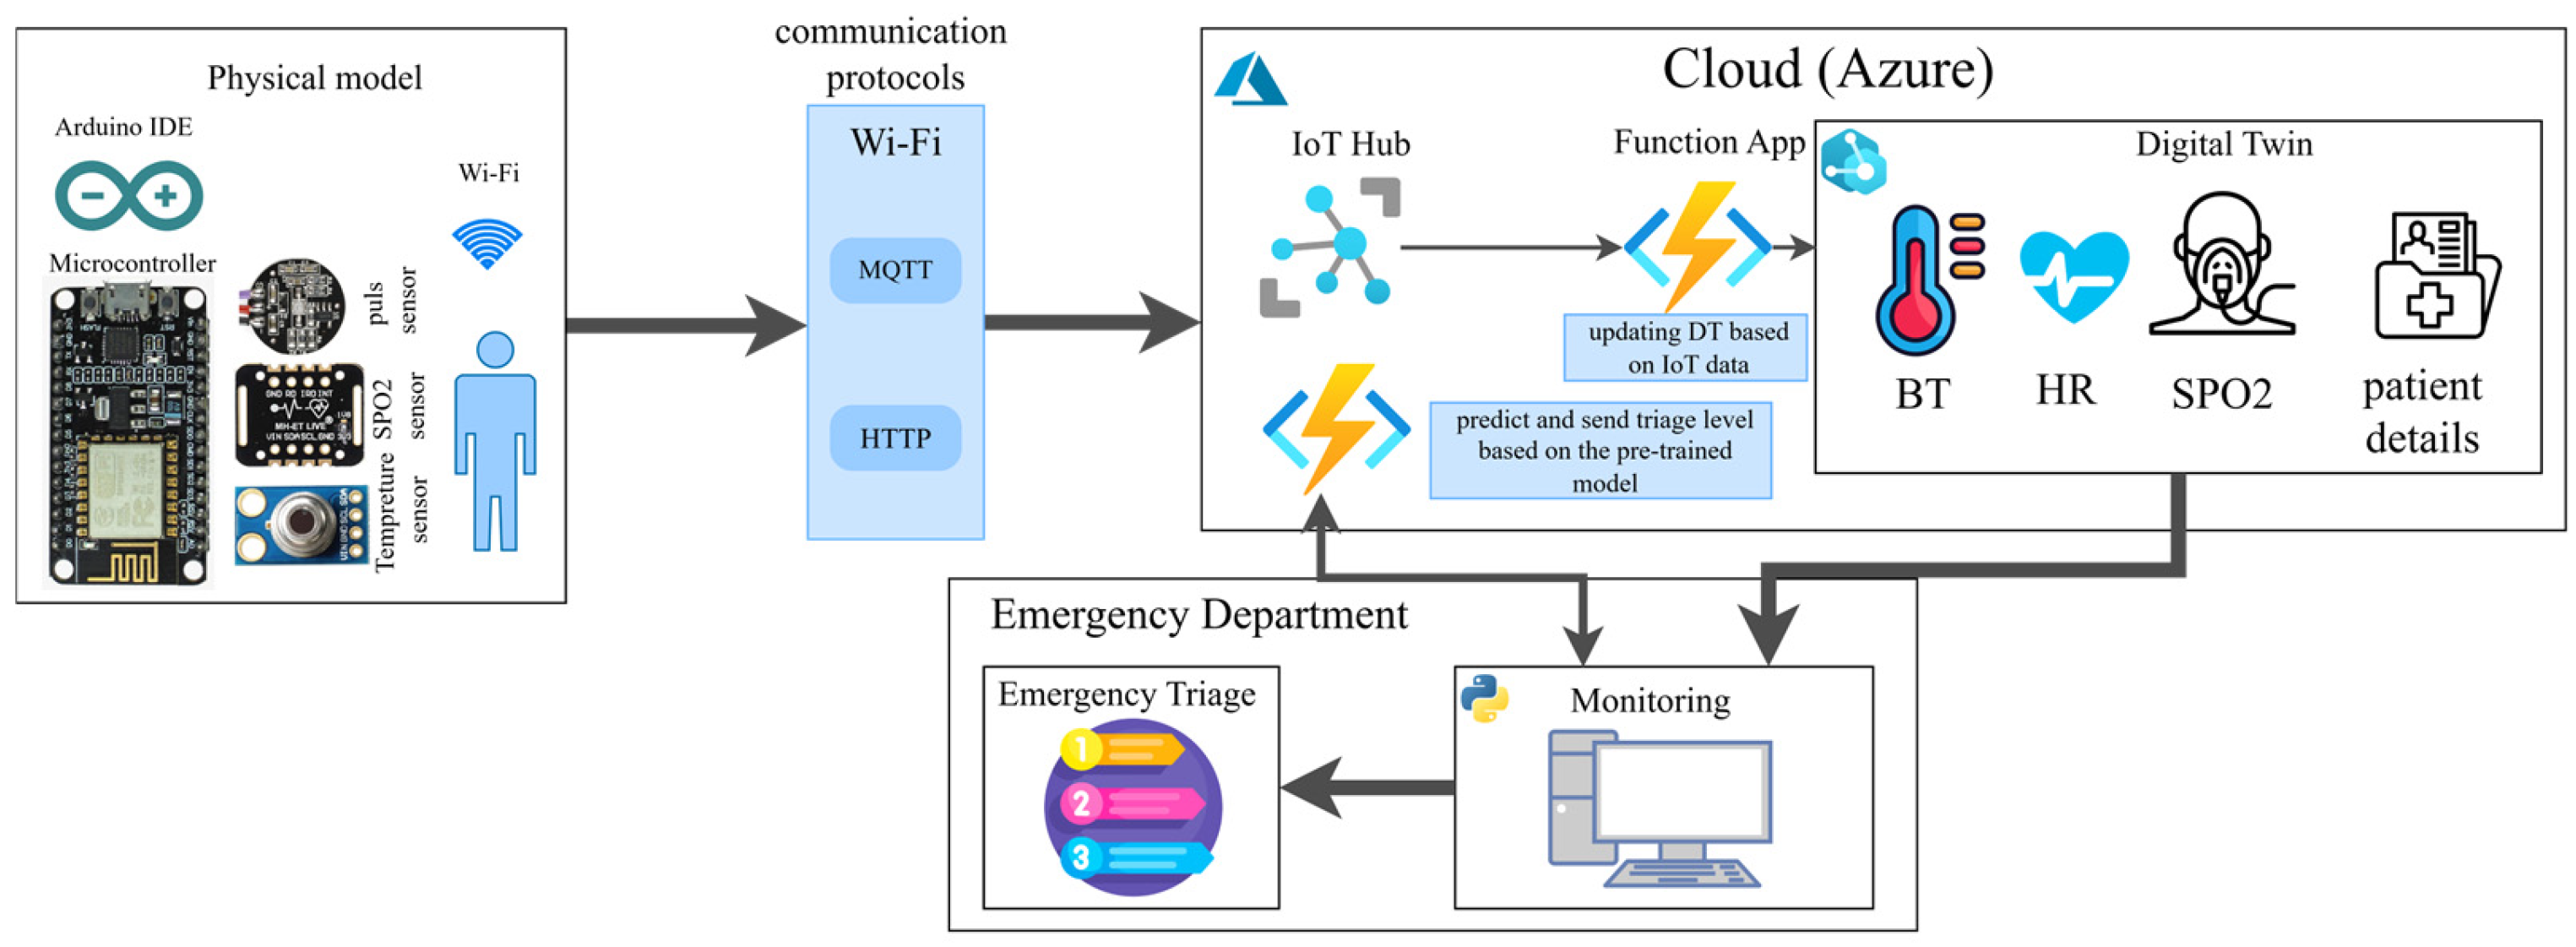
In this work, the emergency healthcare system utilizes DT technology with the objective of enhancing patients' experience both before and during ED admission. Figure 1 shows the overall structure of our automated triage prediction system based on IoT, AI, and DT models in the Azure cloud framework. In our previous work [11], a recommendation list of the nearby hospitals, ranked based on their available beds and the estimated arrival time, was compiled to minimize the emergency response time before a patient’s arrival. The objective was achieved by developing a DT model for the ED itself, encompassing attributes such as its name, location, and the number of available beds. An additional DT model was developed for the beds within the ED, incorporating attributes such as the bed ID and the availability status. The number of available beds in the DT of the ED is updated in real time based on the number of available beds in the ED. The state of the beds is also monitored using IoT sensors. The alteration in the status of the bed, whether it transitions from “available” to “not available” or vice versa, serves as a trigger for a function that updates the number of available beds in the DT of the ED. Due to logistical challenges and the complexity of obtaining necessary approvals (see Section System Limitations and Challenges), this part of the project was not implemented using actual sensors in real hospitals. Instead, a Python (v3.13) code was employed to simulate the bed status. In case of an emergency, the patient app enables users to report emergencies. The patient's location, the ED's location, and the number of available beds in the ED are used to calculate a ranked recommendation list of nearby hospitals that will be sent back to the patient. The execution of all computational operations, including the updating of the number of available beds and the ranking of hospitals, was performed through the utilization of trigger-based Azure app functions [11].
This work will concentrate on the patients after their arrival to the ED in the hospital, during which a third DT model is developed for the patient. Following the patient's arrival, the staff in the ED will collect basic information needed to find the triage level, including the patient's age, gender, method of arrival, pain scale, and mental state. The architecture of the DT-based automated triage classification system is shown in Figure 2. As can be seen in this figure, the physical model's information is transferred to the cloud via Wi-Fi, employing an MQTT protocol for IoT sensors and the Hypertext Transfer Protocol (HTTP) for other data transfers. Subsequently, the data is processed and utilized for DT updating, facilitating its application in classification. Also, vital signs such as heart rate (HR), body temperature, and SpO2 will be assembled using IoT sensors. The system's physical components for vital sign gathering consist of the following: an ESP 8266 microcontroller, a Max30102 for heart rate and SpO2 level, an MLX90614 for body temperature, and a pulse sensor (ARD-000697) for better heart rate accuracy. These sensors were employed due to their recognition and reliability in clinical healthcare monitoring applications [25,39,40]. A pretrained transformer-based AI model then will use the gathered data to predict the level of care required for the patient. This model is trained on dataset medical records using a public dataset and a small-scale local dataset, utilizing two of the known triage protocols. The primary objective of this model is to ensure efficient and effective management of resources within the healthcare system. The combination of DTs, IoT, AI, and cloud services gives the system the ability to deliver a responsive, intelligent, and data-driven emergency care workflow. This way, it can reduce the time for treatment, improve triage accuracy, scale with demand, and boost overall ED efficiency and patient outcomes.

3.3. DT Modeling

In this study, we employed Digital Twin Definition Language (DTDL) for modeling. DTDL is a JSON-LD-based language developed to describe the DT models of smart devices, assets, spaces, and environments. It is a standardized modeling framework that simplifies the modeling process. In this study, a new DT model was proposed for the patient that included vital sign readings and information on the patient’s age and gender, depending upon the dataset used. Also, two DT models were proposed for the pre-arrival of patients in the ED: one representing the ED and one for the beds within the ED [11]. These models are designed to convey a structural, data-driven representation of complex real-world processes to provide essential tools for real-time monitoring and decision support so as to enable predictive analysis in several fields [5].

3.4. IoT Devices

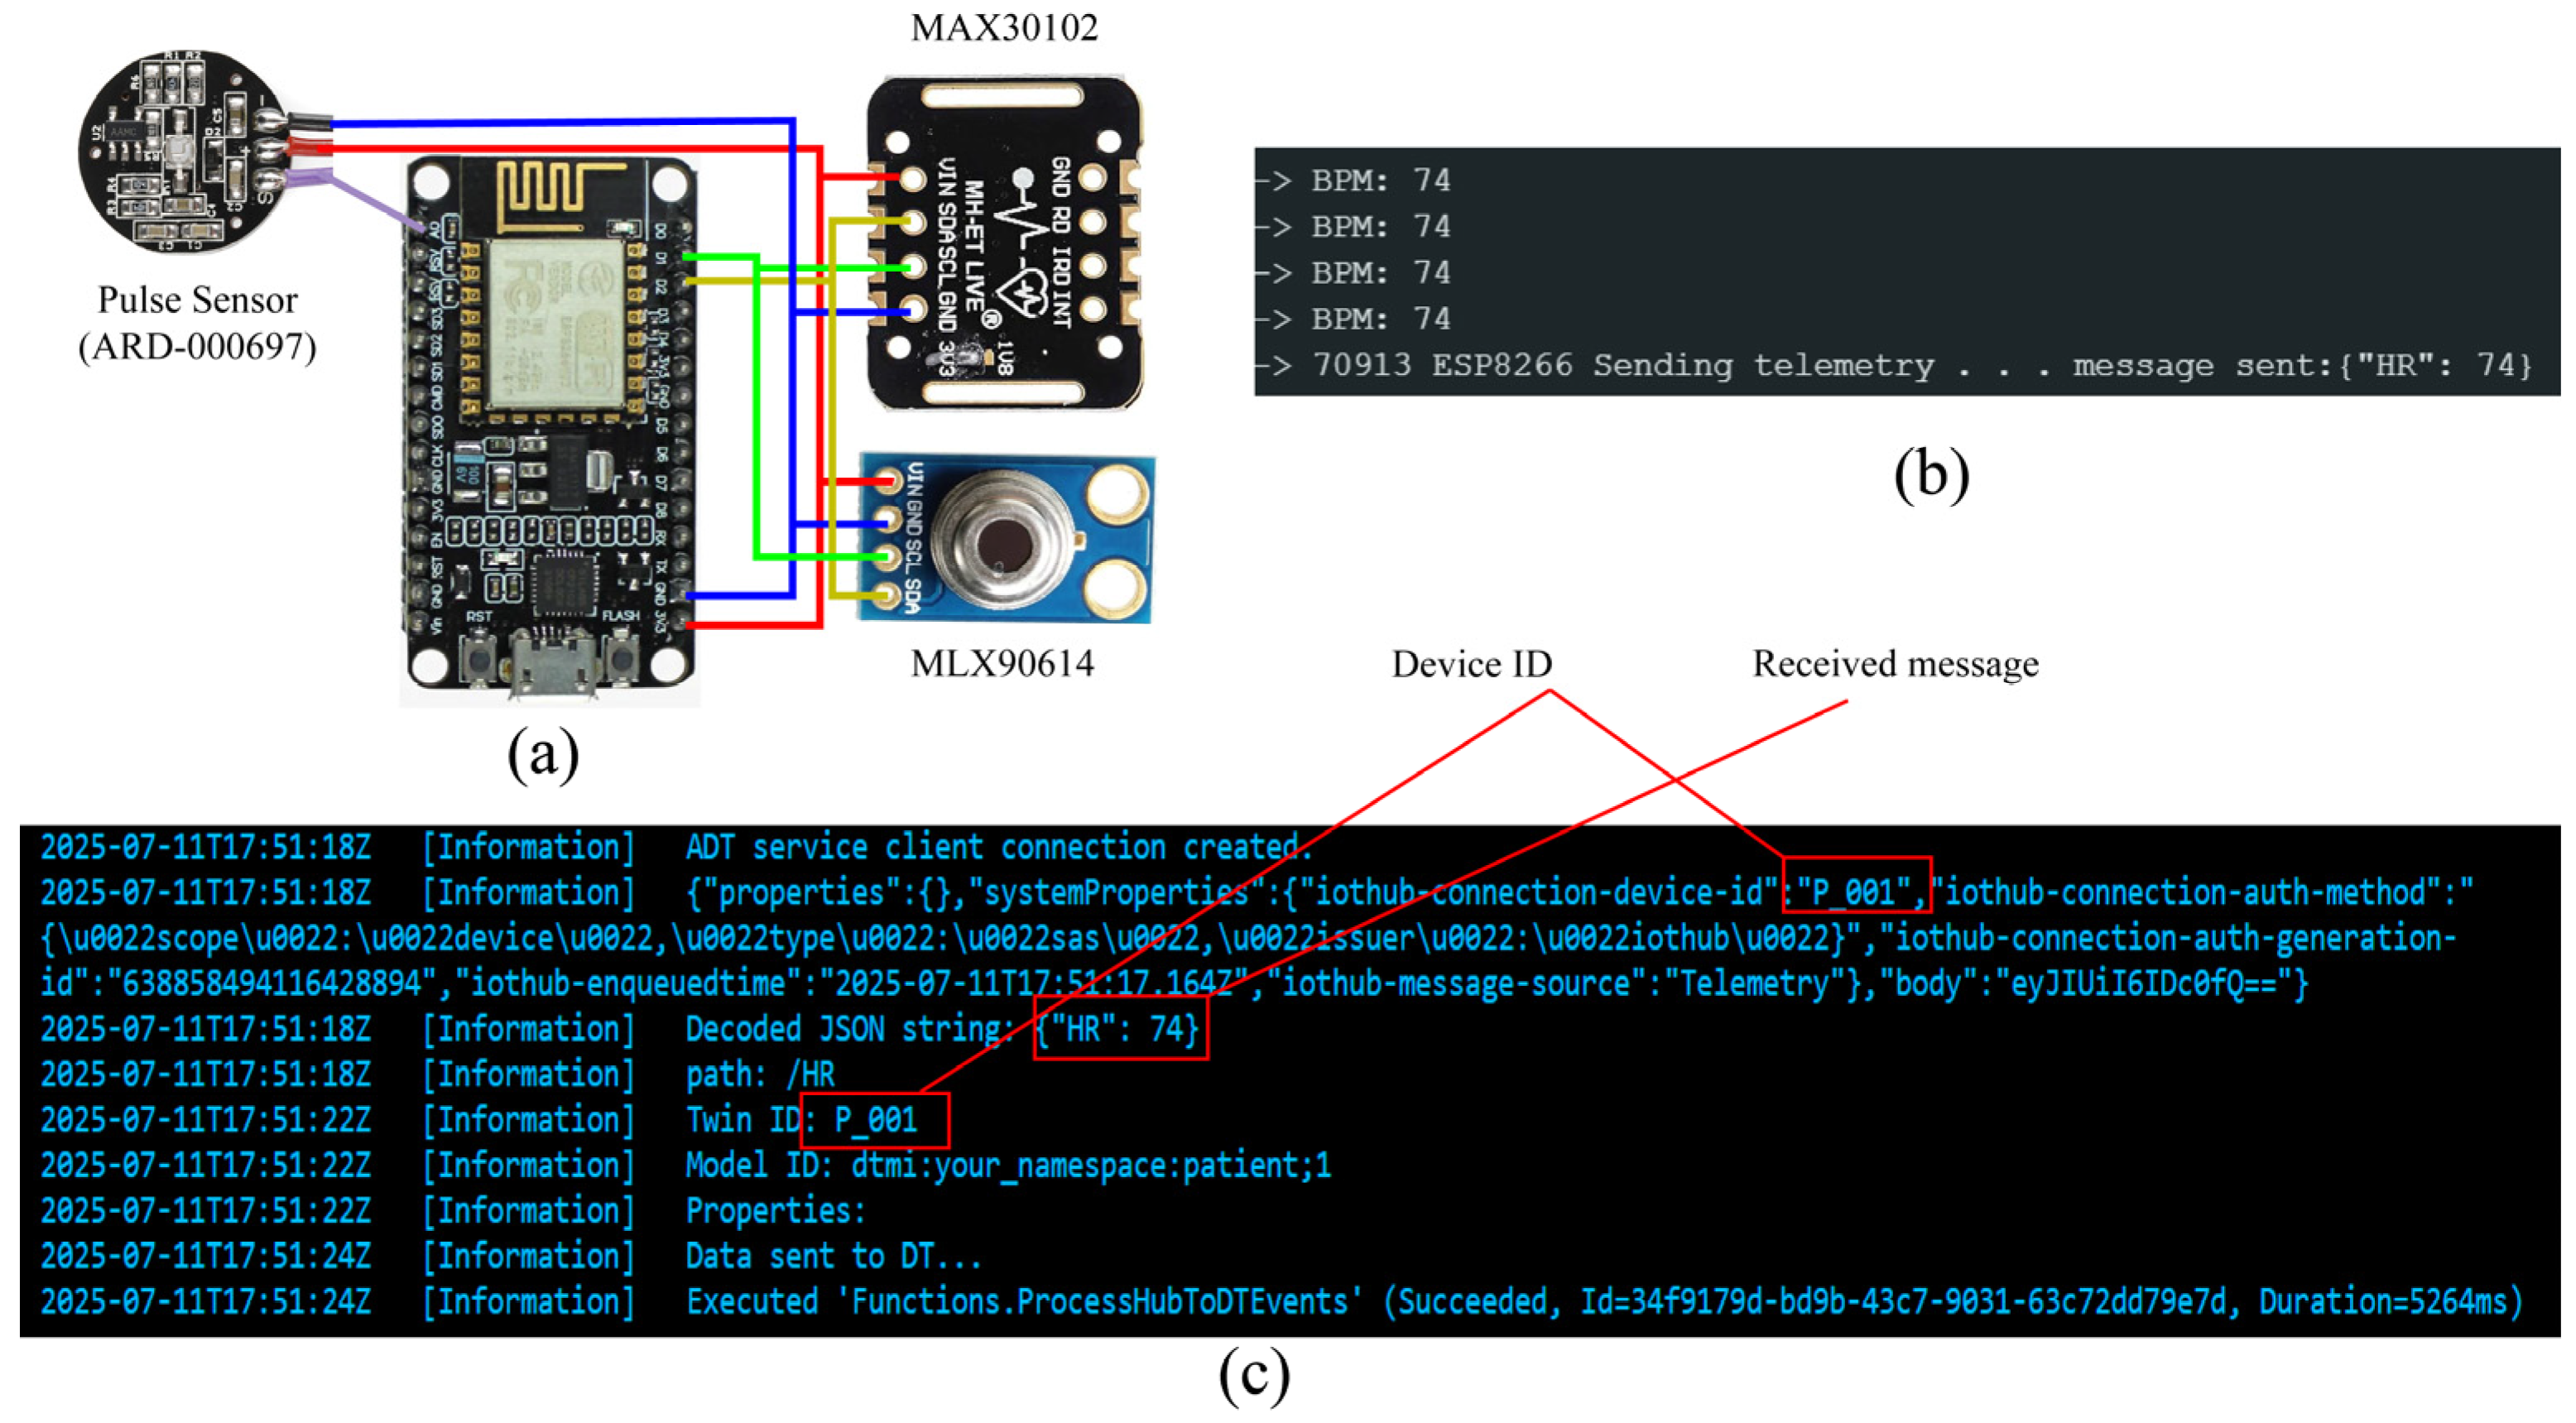
The proposed system utilizes a single microcontroller integrated with a set of IoT sensors. NodeMCU (local vendor, Baghdad, Iraq), which is based on ESP8266 (local vendor, Baghdad, Iraq), as shown in (Figure 3a), was employed as the core microcontroller. The role of these IoT devices is to collect real-time data from the patients and then send it to the cloud upon their arrival. This configuration maintains a low-cost, wireless, and portable solution for early triage classification using embedded sensors and cloud connectivity. Our objective is to automate collecting patients’ triage-related data, especially vital signs. For this reason, the system is primarily reliant on three sensors: the MLX90614, MAX30102, and ARD-000697 (local vendor, Baghdad, Iraq).
To facilitate synchronous data transmission with the microcontroller, these sensors utilize the I2C protocol, which is a process that is known for its minimal requirements for wiring and power consumption. The NodeMCU functions as the central unit for managing sensor readings and transmitting the collected data to the cloud via Wi-Fi in real time. The MLX90614 is a non-contact infrared sensor that can measure object temperature in the −70 °C to 380 °C range. It can read body temperature without contact, making it a good choice for situations involving overcrowding or understaffing. The Max30102 sensor is equipped with red and infrared light-emitting diodes (LEDs), along with a photodetector, that can measure the oxygen saturation (SpO2) and heart rate. Both sensors use the I2C communication protocol. On the other hand, the ARD-000697 sensor is an analog sensor that can generate a raw heart signal through the detection of fluctuations in blood flow across the skin. Since it is an analog sensor, it is connected to the analog pin of the ESP8266 and does not use the I2C protocol (see Figure 3a). The main sensor used for heart rate is the Max30102 due to its integrated SpO2 measurement and higher sampling stability. The ARD-000697 pulse sensor is utilized for verification and backup. Both readings are displayed in the system interface. However, only the primary (MAX30102) value is used to update the patient's DT instance. When a significant discrepancy happens (more than 10 bpm) between the two sensors, the system does not override either value. Instead, this discrepancy will be an indicator for medical staff intervention, suggesting re-evaluation of the readings or employing alternative measurement techniques. This configuration enhances the accuracy of HR measurements, given the potential for noise or poor finger placement in the Max30102 sensor. The energy consumption of each device is as follows: The ESP8266 NodeMCU requires an active Wi-Fi current of 70–120 mA, with a current of ~20 µA in deep sleep mode. The MAX30102 SpO2/HR sensor needs ~600 µA for measurement and ~0.7 µA for shutdown. The MLX90614 IR temperature sensor requires ~18 mA for active state and ~1.3 mA for sleep mode. The pulse sensors require ~1–5 mA of current. These numbers show a pragmatic estimate of these devices’ consumption in actual deployments [41,42,43]. To ascertain the total active current of the system, we should consider continuous sensor operation. The total active current of the system, including the NodeMCU (approximately 120 mA), the MLX90614 (approximately 18 mA), the MAX30102 (approximately 0.6 mA), and the ARD-000697 (approximately 3 mA), is approximately 140–150 mA. If a 3.7 V, 2000 mAh battery were used, this would provide approximately 12 h of operation, which is adequate for a typical ED shift. For fixed hospital use, the device can be powered continuously via USB or an external supply, meaning that power consumption can be overcome for deployment.
In the proposed architecture, each sensor is assigned to a designated reading phase using a turn-based scheduling approach. Algorithm 1 shows the data transmission operation using IoT devices. As this algorithm shows, the system cycles through the sensors at predefined intervals of 15 s (which can be adjusted if necessary) to ensure sufficient time for sampling and vital sign measuring. This turn-based strategy aids in gathering data from the patient while ensuring that the data is transmitted accurately and consistently. Additionally, it helps to avoid data corruption or bus lock-up, which may happen when various sensors are attached to the same I2C bus. Although this approach may appear suboptimal due to rapid changes that occur with vital signs in cases of emergencies, another alternative method can be employed that involves using a dedicated microcontroller for each sensor. However, employing this approach may lead to redundancy and suboptimal usage in terms of cost, power consumption, and the necessity of managing multiple API connections. The ESP8266 microcontroller can be programmed using the Arduino IDE. It also transmits data to the Azure IoT Hub using the MQTT protocol. Figure 3b shows an example of a raw sensor’s data sample displayed in the Arduino IDE serial monitor. This data is then processed and redirected to the Azure DT, as shown in Figure 3c. Data is transmitted in JSON format, with a timestamp for each metric. Real-time transmission implementation enables dynamic updates for each patient's DT instances. Automating the collection and transmission of vital signs data has been shown to minimize human errors and enhance the efficiency of triage classification processes. Using lightweight IoT sensors enhances portability, lowers costs, and simplifies integration within healthcare facilities.
Algorithm 1 Data transmission using IoT devices
Input:Wi-Fi information (ssid, password), device key
Output: send data to IoT Hub
1Initializeconnection: Initialize Wi-Fi and device key connection
2States ← {HR, Temperature, SPO2}//each sensor has its state
3Duration_start_time ← Current_time
4Duration_time ← 15000 ms//set the duration of each interval as 15 s
5While True:
6 If Curren_time – Duration_start_time > duration_time//if end of duration
7 Sent data (state) to IoT Hub//send the data after the end of the duration
8 Next State
9 Duration_start_time ← Current_time
10 End if
11 Switch state:
12 Case (HR):
13 HR ← pulse sensor//reading data from sensor
14 Case (Temperature):
15 Temperature ← MLX90614//reading data from sensor
16 Case (SPO2):
17 SPO2 ← MAX30102//reading data from sensor
18 End Switch
19End while

3.5. Cloud Computation Infrastructure

Microsoft Azure provides Azure functions as a serverless function to be utilized as the primary unit of computation processing for the system to ensure that the system has the capability to perform real-time data streaming and responsive callable processing. They are used to execute small pieces of logic code without needing management servers directly. This structure provides scalability, elasticity, low latency, and low-cost operation for IoT-driven systems. We built two main Azure functions, an event-triggered function, and an HTTP-triggered function, each designed to do specific tasks [16]. The first function is connected to the IoT Hub as an event-driven trigger. This function is initiated automatically when new data arrives. ESP8266 sends data to the IoT hub in JSON format, including critical parameters such as body temperature, HR, and oxygen saturation. When the message arrives, the function becomes activated, it passes the data, and executes an Azure DTs API call to update the corresponding DT instance representing a patient or an ED.
This process involves using the Azure DTs SDK for the implementation of property patching, where the twin's properties are updated in real time to align with the most recent incoming values. The function ensures that DT models remain the physical twins they represent. This dynamic mirroring is important for building a live, accurate, virtual representation of patient conditions in the triage system. This function also filters and validates the incoming data, thereby ensuring data consistency. Since it is running on a cloud infrastructure, it can scale to accommodate multiple messages concurrently. The second Azure function is an HTTP-triggered function that serves as an entry point to execute the triage classification interface. It hosts the pretrained triage classification model that was previously trained and optimized using a clinical dataset and exported in pkl format. This model can predict the patient’s triage level based on vital signs collected by IoT sensors and other basic information collected by hospital professionals. This function is activated using a basic user interface (UI) designed for hospital staff via HTTP POST request, carrying patient information in JSON format, based on the required data fields for the classification model. After this, the function executes the classification process and sends the result to the "triage" property in the patient's DT, finally appearing in the UI for the ED professionals. This function has been designed to be stateless and lightweight, ensuring operational efficiency and accessibility. This function is integrated into simple UIs, thereby facilitating on-demand triage classification. These two Azure functions form the base of the cloud intelligence layer of the system, enabling real-time DT synchronization and automated decision-making. We made sure that this architecture supports future extensions, such as the addition of more sensors or the augmentation of patient capacity within the hospital infrastructure. The utilization of a server-based triage system makes prioritizing patients according to their triage level faster and better. This enhancement is achieved by facilitating the delivery of rapid, accurate, and automated decisions, thereby easing staff burdens while improving healthcare services.

3.6. End User Interface

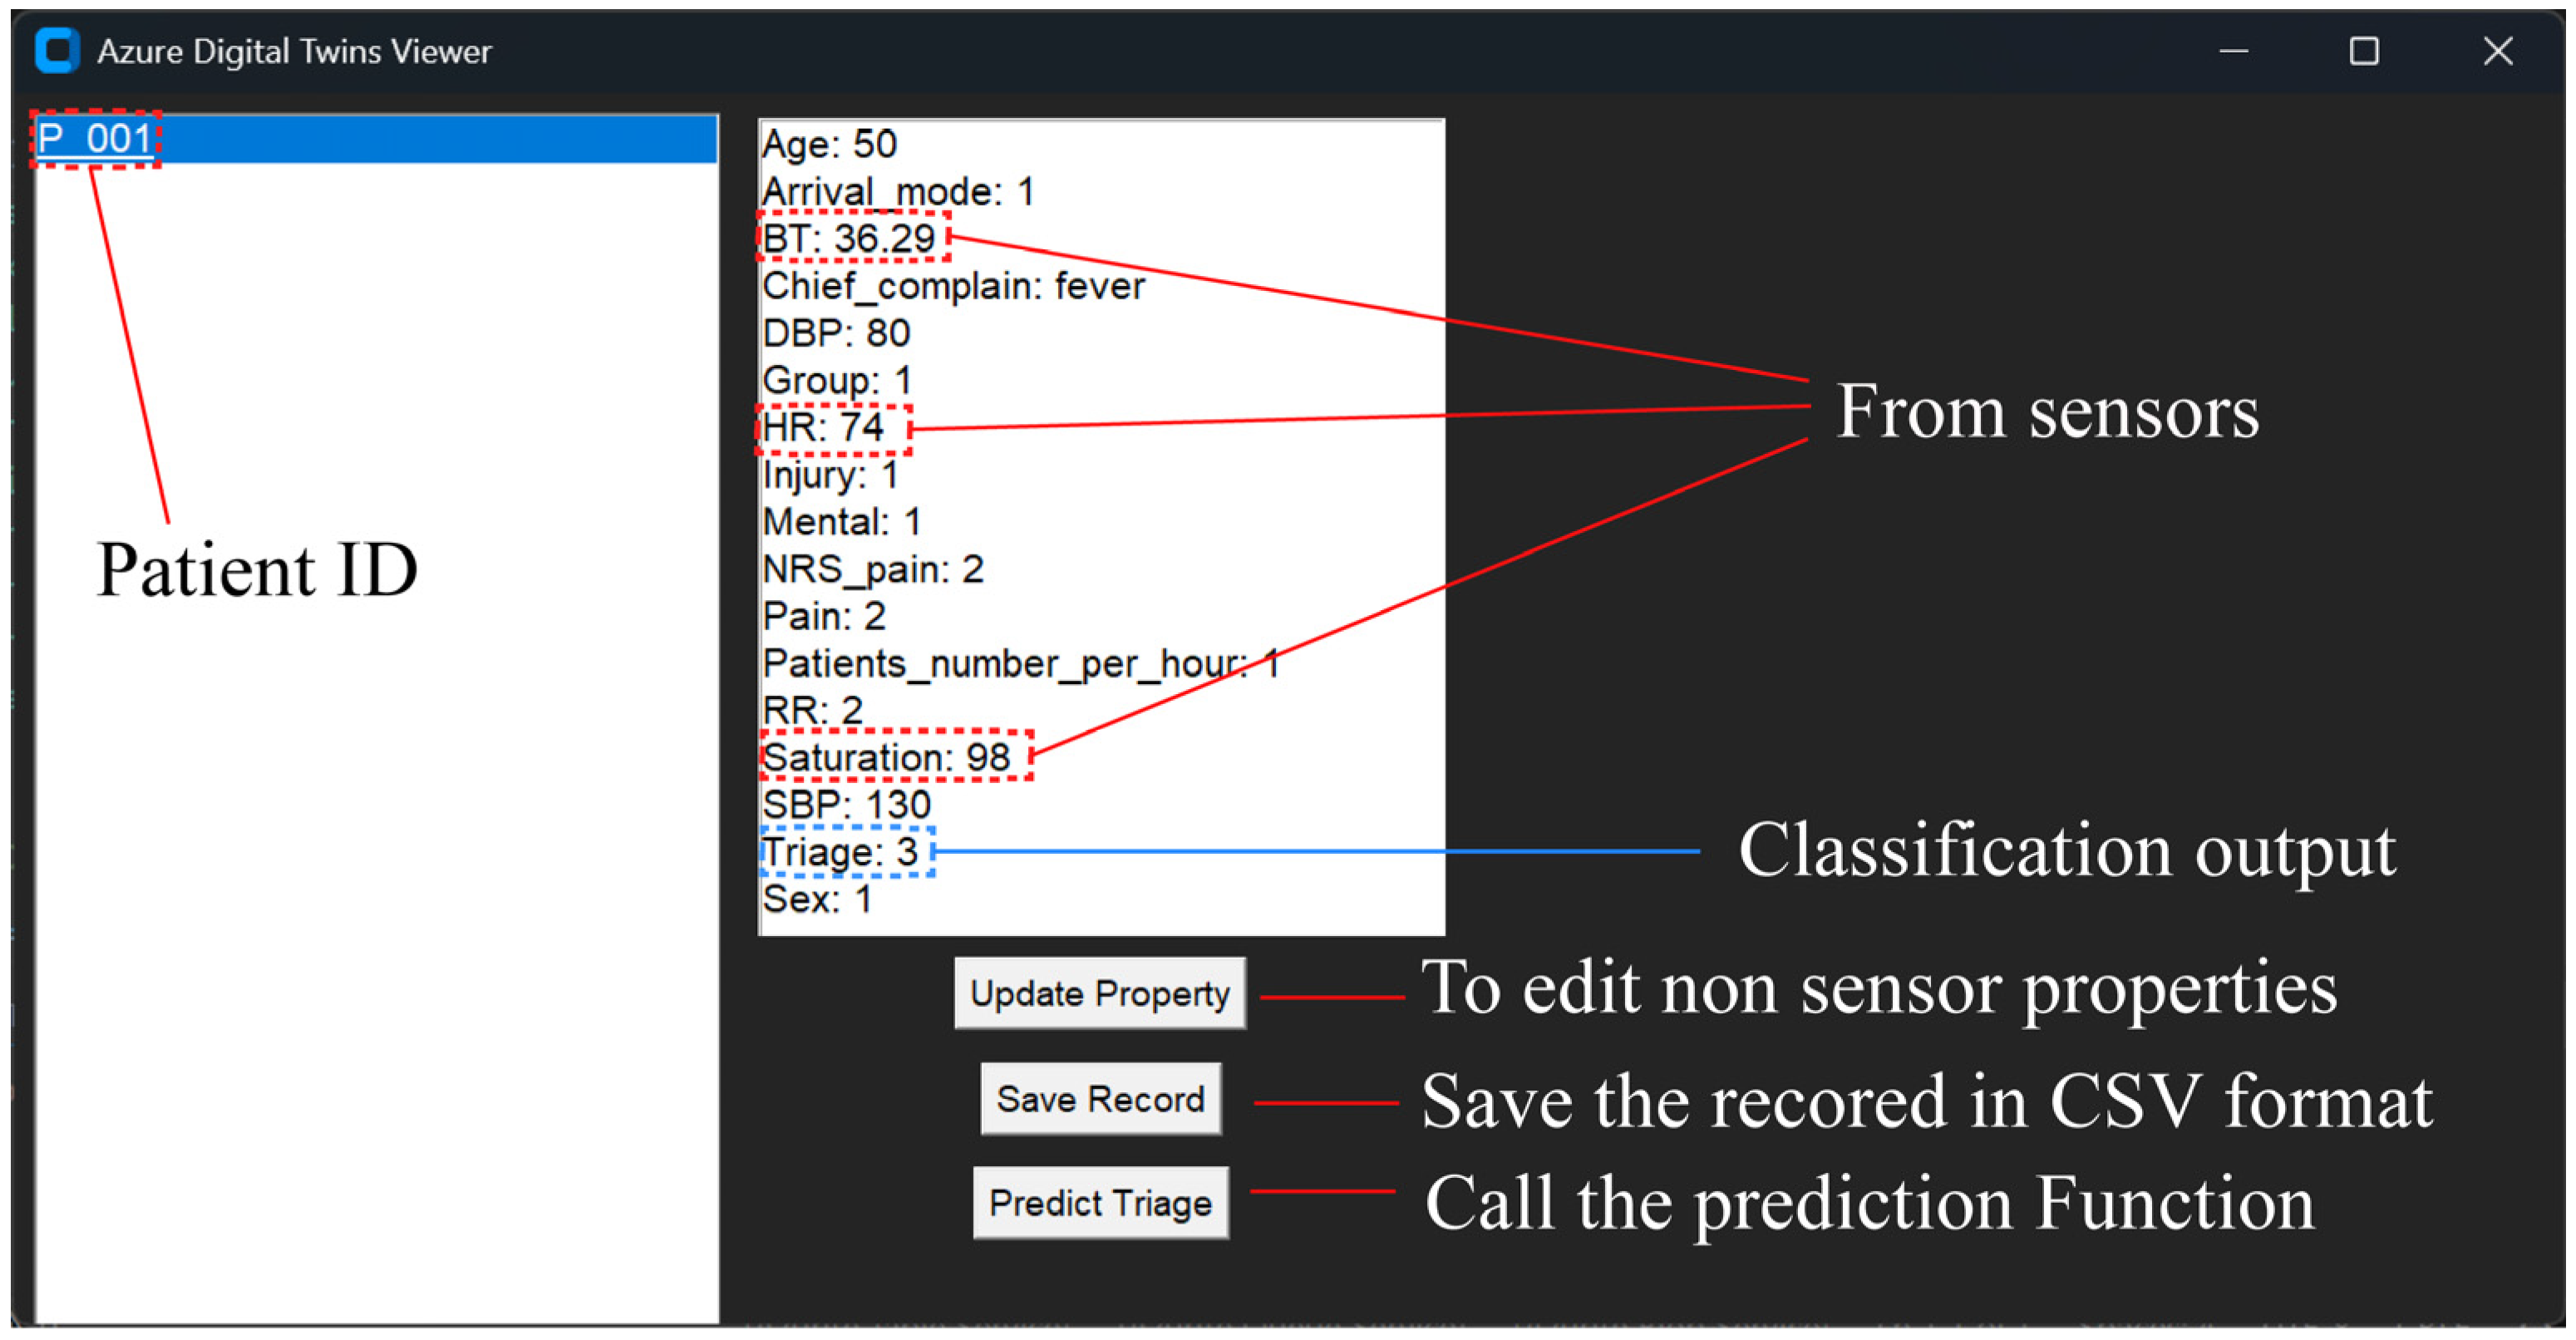
A basic UI was developed using the Python programming language for the end user, specifically for the benefit of hospital staff. As illustrated in Figure 4, the information from the DT is retrieved in real time and displayed in the UI. This UI also allows the user to input or modify non-sensor properties, such as age, gender, arrival mode, and others. Additionally, an “Update Property” button was incorporated into the UI. Upon clicking this button, the UI allows clinical staff to update and modify patient DT properties (both sensor-based and manually entered parameters). This feature enables medical staff to directly adjust patients’ information such as heart rate, blood oxygen saturation, and mental state in real time whenever necessary. Additionally, the user can save the patient in comma-separated values (.csv) format, enabling the utilization of the data as archived information later. A "Predict Triage" button was incorporated into the UI. When this button is clicked, the triage classification function is initiated, and the predicted value is added in the patient information section. The present UI was developed to serve as a foundational component, with the flexibility to undergo subsequent refinement to optimize user experience in future work. Its initial design was conceived to showcase the system's functionality from the perspective of the end user.

3.7. Classification Model

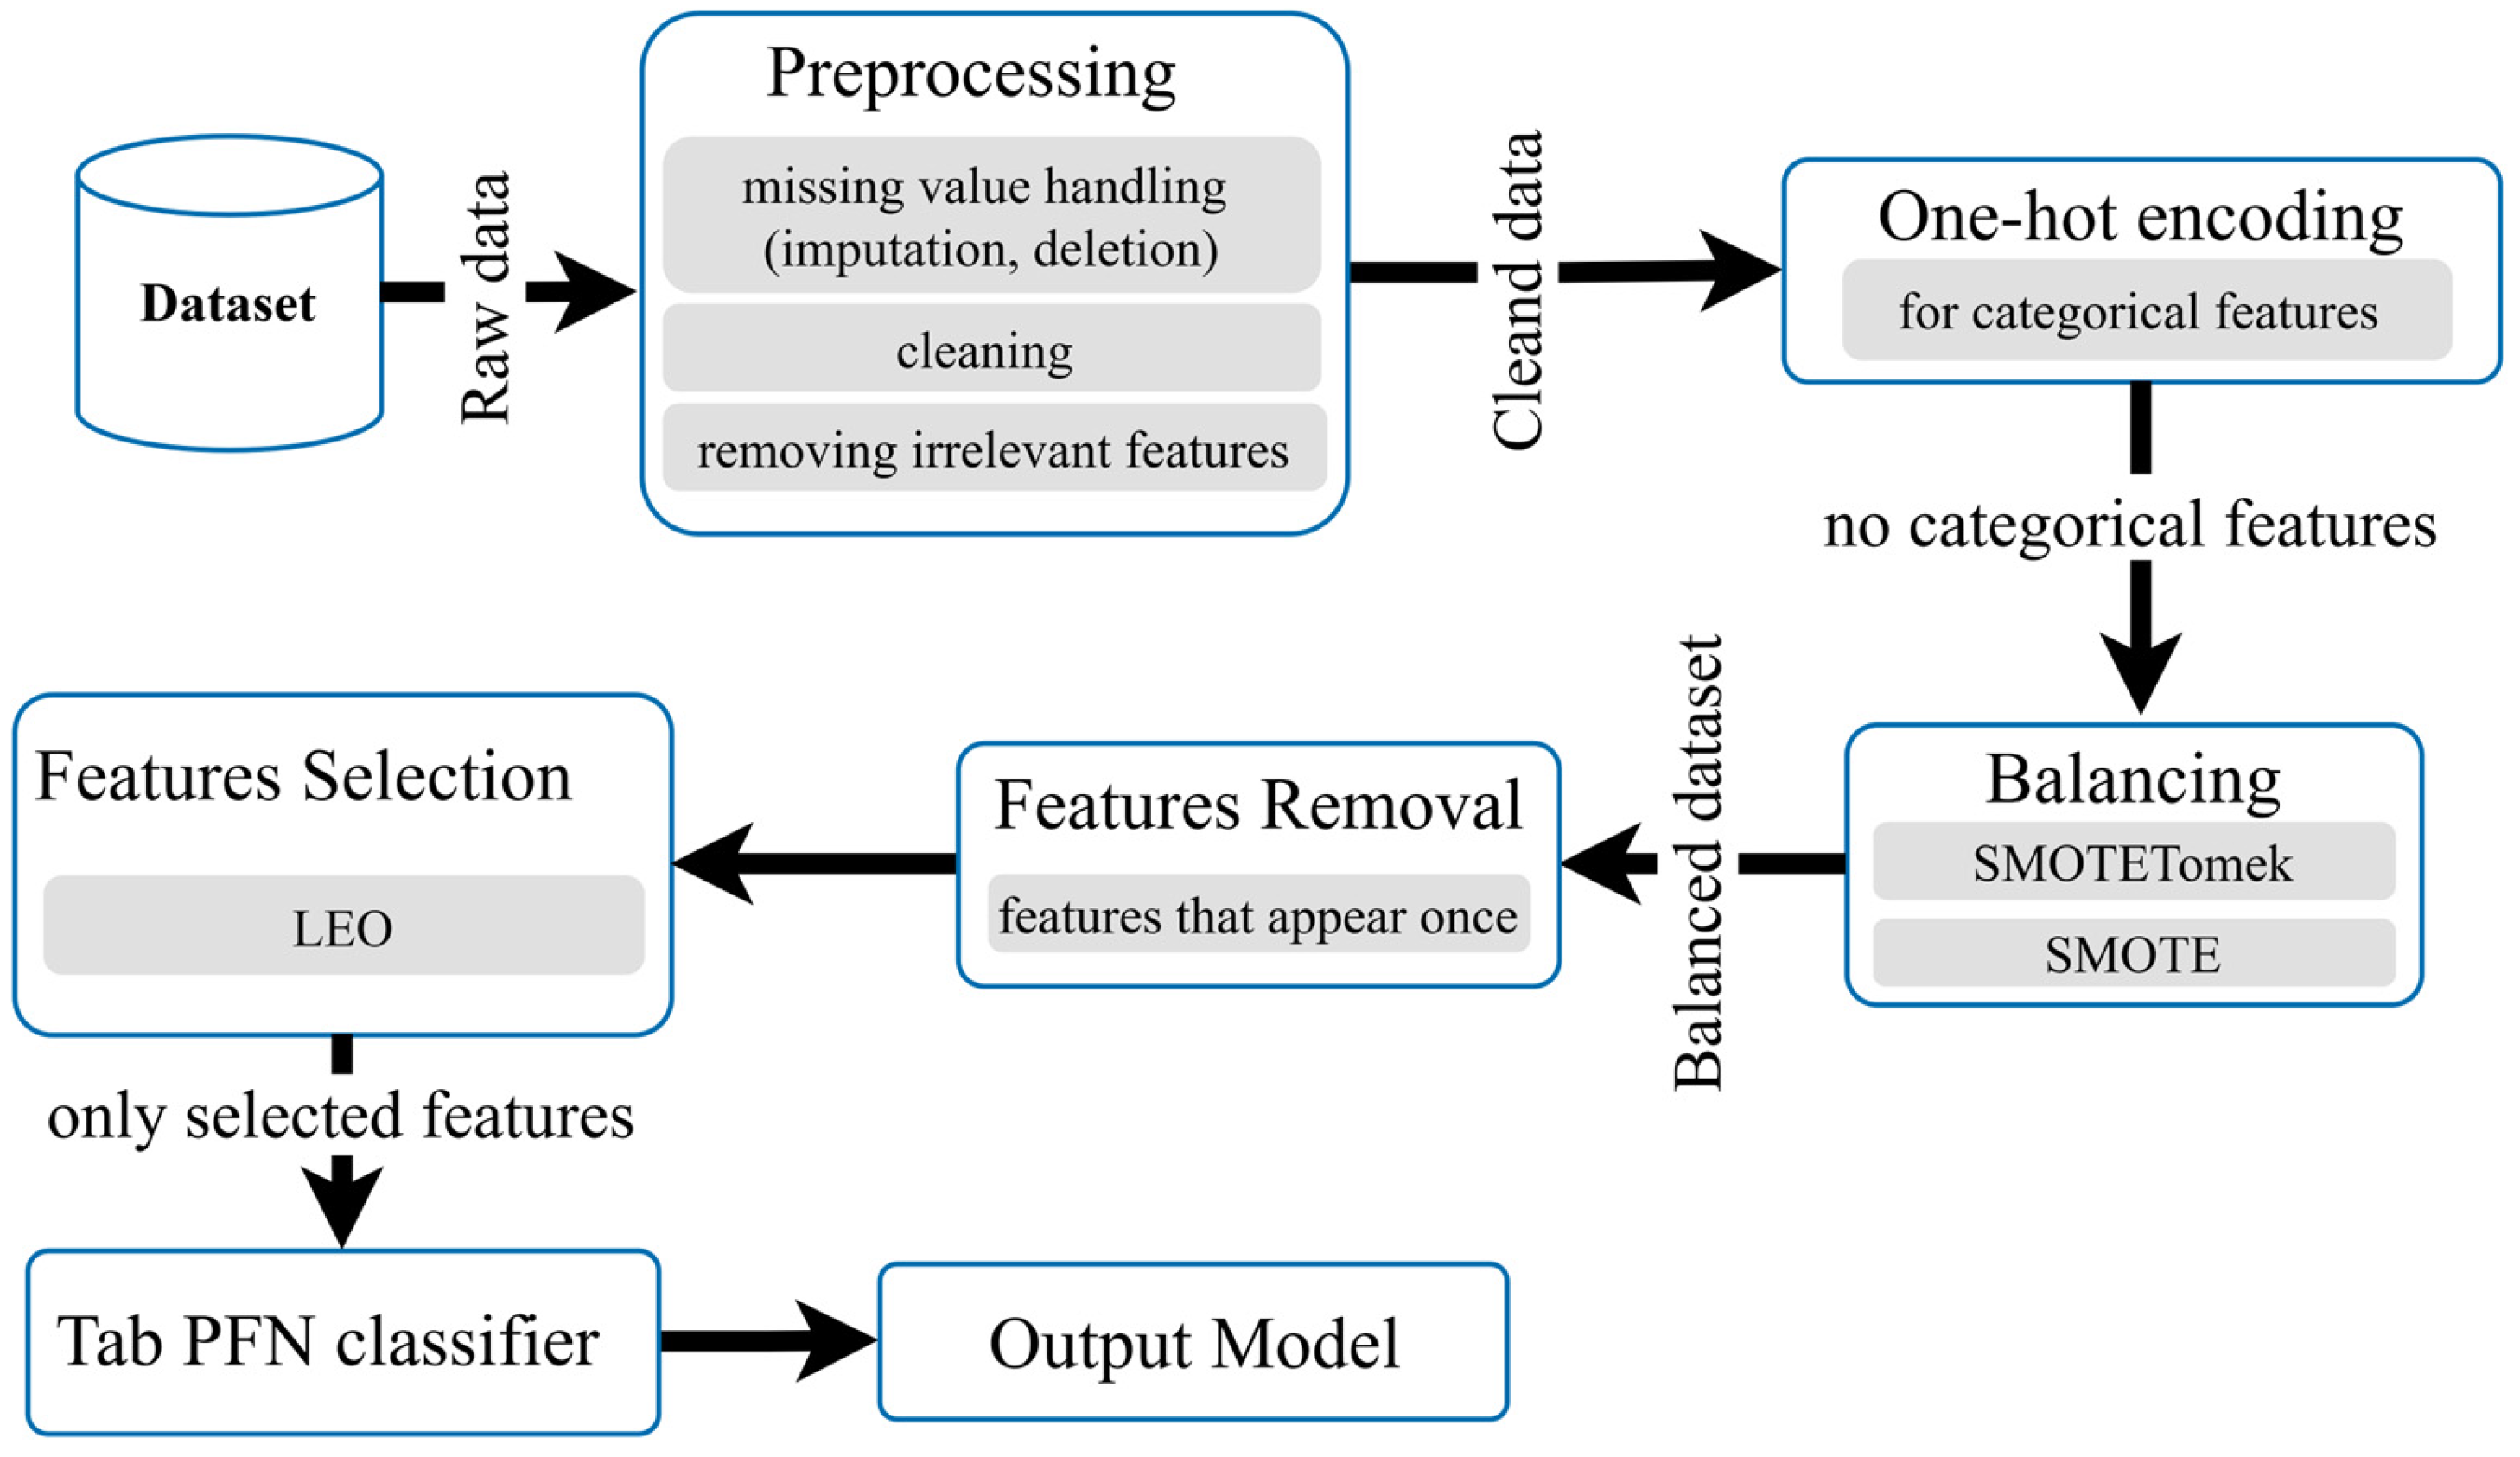
In this section, we will present a classification model that can predict the severity levels of patient triage. The model will utilize patient data collected from IoT sensors and the data inserted manually by staff using the UI. The model will then output the triage level which is based on the applied triage protocol. The initial phase of model training entailed the preprocessing of data and the implementation of the SMOTETomek algorithm for addressing imbalanced data, a common occurrence in medical datasets. Subsequently, the LEO [18] optimization algorithm was employed to identify the most informative features for the model. These features were then exploited to train the model based on TabPFN architecture [19]. Figure 5 illustrates the architecture of the classification model.

3.7.1. Data Balancing

Many medical datasets are characterized by an imbalanced class distribution, with a preponderance of records belonging to low-severity classes relative to critical cases. This phenomenon is also observed in triage datasets. Having an imbalanced dataset may lead to the potential of having a biased classification model towards the majority classes, resulting in an inaccurate representation of the data. To address this issue, the SMOTETomek technique was proposed. This technique is a hybrid approach that combines the synthesized minority oversampling technique (SMOTE) with Tomek link under-sampling. SMOTE generates new samples for minority classes by interpolating between existing samples and their Nearest Neighbors, thereby enhancing the representation of minority classes in the dataset [44]. The generated data samples using SMOTE can be represented as in Equation (1).
S s y n = r S K N N S f + S f
where Ssyn is the generated samples, r is random number between 0 and 1, SKNN is the k-Nearest Neighbor samples to the featured samples, and Sf is the feature samples [45].
A critical consideration in clinical data is the medical rationality of these synthetic samples, particularly for the critical class. SMOTE ensures that new samples are physiologically plausible by existing within the feature space of real data. The subsequent Tomek link under-sampling step serves as an inherent statistical verification mechanism that addresses this concern. Tomek's approach entails the extraction of samples from the boundaries between classes, thereby removing them from the majority classes. A Tomek link exists between two samples from different classes when each is the Nearest Neighbor of the other [46]. This hybrid strategy has been demonstrated to enhance the distribution and separability of the classes. The implementation of SMOTE in conjunction with Tomek has been shown to mitigate class imbalance, thereby reducing model bias.

3.7.2. Feature Selection and Optimization

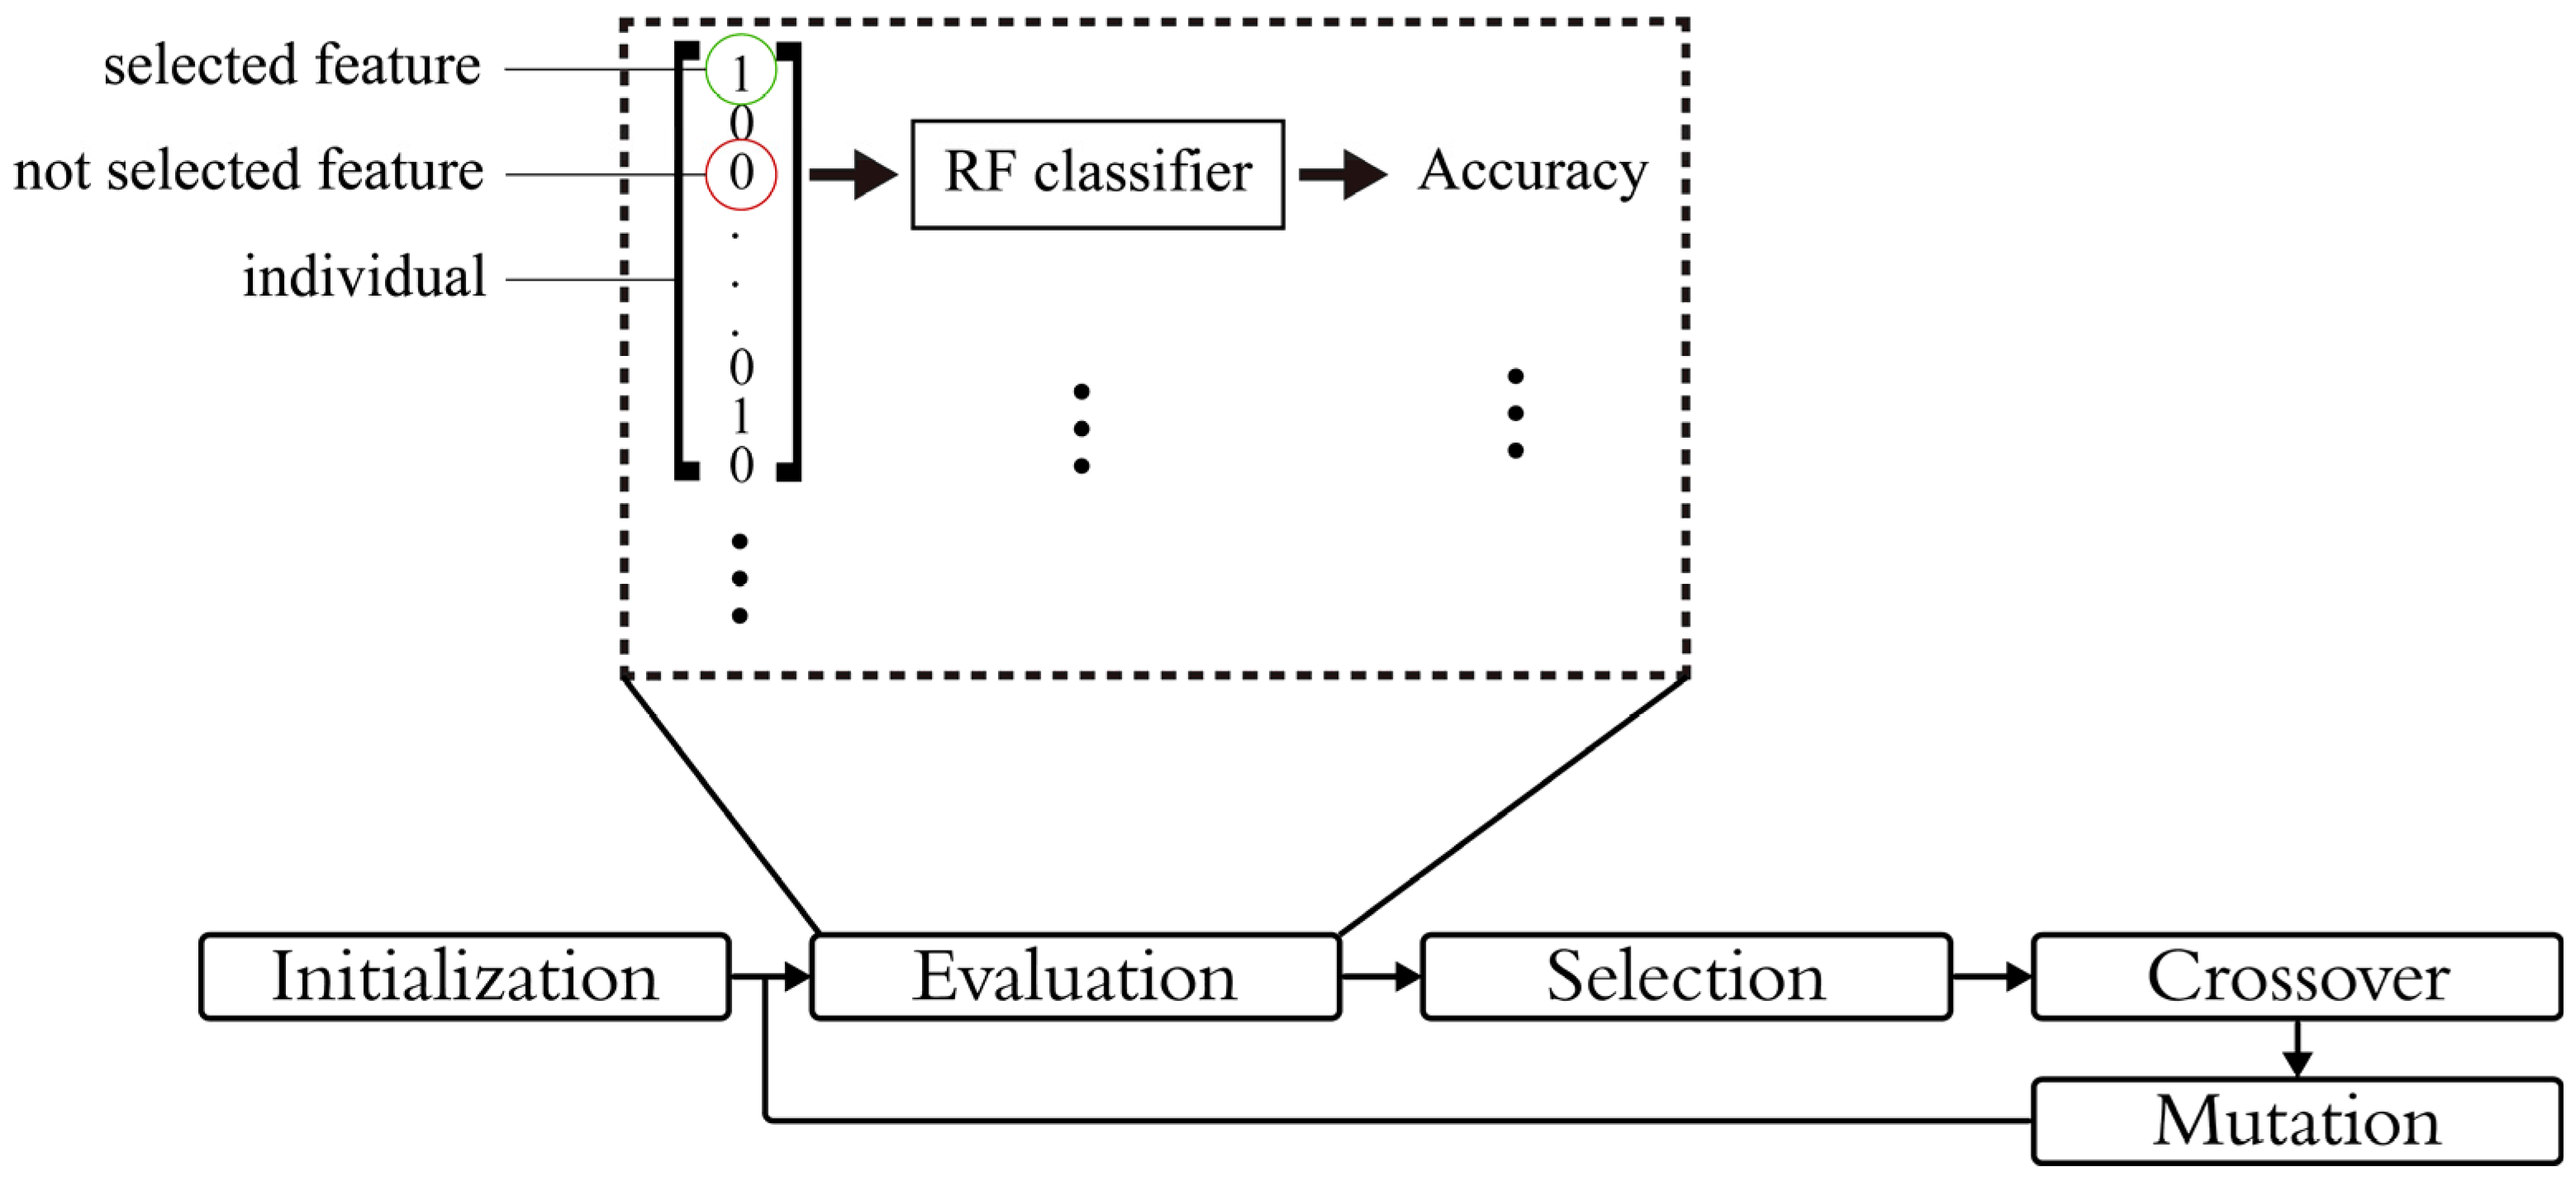
To enhance the performance of the model, feature selection techniques were employed. The objective was to ascertain the minimal set of input features that would improve the predictive accuracy. The initial step involved the removal of one-hot encoded features that possessed a value of 1 in a single record. These features contribute no additional information to the model and are often regarded as noise, which can result in overfitting. The resulting features were used to generate a binary selection vector, where the value of each bit of the vector determines whether a specific feature is included as an input to the classifier or not. An overview of the feature selection model is depicted in Figure 6.
In the optimization section, the LEO algorithm was employed. The LEO algorithm is a bio-inspired, self-adapting metaheuristic optimization algorithm that combines the Lagrange elementary principle with the immune response system in humans [18]. As stated in Algorithm 2, each individual in the population used in this algorithm is a binary selection vector representing a subset of potential selected features. The algorithm's fitness is evaluated using a lightweight classifier (Random Forest was used in this step) on the selected features, and its performance is assessed using its accuracy. LEO is an evolutionary mechanism that operates through a group-based framework encompassing three fundamental processes: selection, crossover, and mutation. Crossover, a process of genetic combination, yields new individuals by combining two high-performance individuals. Mutation, on the other hand, introduces random fluctuations into the feature selection bit, thereby enhancing the diversity and variability within the population (see Figure 6 and Algorithm 2).
Algorithm 2 LEO-based feature selection
Input:dataset, features, population size, max iterations, crossover pressure, mutation probability
Output: best feature subset
1Representation: each individual is a binary vector
2Initialization: Generate initial population of random binary vectors
3While stopping condition is not met
4 Fitness evaluation: based on lightweight classifier (RF)
5 Selection:
6 Sort the population based on fitness
7 Select the first half and divide it into two groups fd and sd
8 If fd include parents
9 Ifpopulation highest fitness <= fd highest fitness
10 new population = fd
11 else
12 new population = sd
13 End if
14 else
15 New population = sd
16 End if
17 Crossover: implementation of Equations (2) and (3)
18 Mutation: implementation of Equation (4)
19End while
Let SA and SB be the two parents’ vectors; Equations (2) and (3) will be used to generate new individuals Q1 and Q2 in the crossover phase.
Q 1 = ( S A S B ) 2 + S B 1 2 ( a S A + 2 S B 1 + a 2 S A S B 1 )
Q 2 = ( S B S A ) 2 + S A 1 2 ( a S B + 2 S A 1 + a 2 S B S A 1 )
where a is the Lagrange multiplier, a random scalar parameter drawn from a uniform interval [0.2, 0.3] in the original implementation. In the mutation phase, the original algorithm utilizes the Gaussian mutation technique. However, this approach is not applicable in the context of our study, as we are employing binary vectors as individual units. Therefore, a binary flip based on mutation probability will be utilized instead, as demonstrated in Equation (4).
Q i = 1 Q i , w i t h   m u t a t i o n   p r o b a b l i t y   o f   P m ,   Q i ,
The computational cost of the LEO feature selection process stems from evaluating multiple feature subsets with a k-fold Random Forest classifier. Let P denote the population size, G the number of features, I the number of iterations, k the number of cross-validation folds, E the number of estimators (trees) in the Random Forest, and S the number of training samples. The approximate costs are as follows:
Per-candidate fitness:
Tcost ≈ K×O (train RF)≈K×O(E×Strain) ×costtree).
Per-iteration:
O(P × Tcost + P × G + PlogP ), which is typically dominated by O(P × Tcost).
Total (all iterations):
O(I × P × Tcost) ≈ O(I × P × k × E × Strain × costtree).
Space complexity:
O(P × G) for the population plus
O(S × G) for the dataset in memory.
In our configuration, P = 50, I = 100, G = 423, and k = 3.
These values (P = 50, I = 100) were selected empirically after multiple pilot trials to ensure stable convergence and balanced computational cost. A population size of 50 and 100 iterations were found to produce consistent feature subsets without overfitting. This approach helped identify the highly informative features and reduced the dimensionality of the input space while improving model performance.

3.7.3. Classification

In the classification task, the selected features will be used to train a predictive model capable of assigning patients to their triage level. The classifier employed in this manner is TabPFN. TabPFN is a transformer-based model designed for tabular data. Traditional transformer-based classifiers for tabular data generally require substantial datasets; however, TabPFN is pretrained on millions of synthetic tasks, enabling expeditious inference with limited datasets. TabPFN approximates Bayesian inference across a wide range of small-scale classification problems. It accomplishes this by learning from millions of synthetic tasks during pretraining [19]. In this study, two interface strategies were utilized: TabPFN subsample, which performs random subsampling to enhance generalization, and TabPFN tree, which performs decision tree-like partitioning. For the subsampled ensemble, we have used 32 estimators with a maximum of 10,000 samples per inference step, consistent with memory constraints. The subsample had 32 estimators with ensemble averaging. Each of these used up to 10,000 randomly selected samples for each step of the inference process. The maximum prediction duration was one minute. For the tree TabPFN classifier, the implemented configuration was executed with adaptive tree expansion, node fitting enabling a maximum node sample size of 10,000, and an overall prediction time limit of 60 s. The maximum of 10,000 samples per inference step was employed for the balance between memory usage and runtime efficiency. This is because larger sample sizes frequently exceeded the 16 GB GPU memory available in the Colab environment that is utilized for experimental purposes. This constraint does not affect the accuracy of the model, since TabPFN is designed to perform approximate Bayesian inference with multiple randomized subsamples. A total of 32 estimators and a maximum sample size of 10,000 per inference step were used to reflect a trade-off between accuracy and runtime. This way, we can ensure stability and generalization within an affordable computational cost. By using this approach, the selected features are passed directly to the classifier, and the output will be the triage level.

4. Data Collection and Preprocessing

In this study, we employed data derived from research that assessed the accuracy of ED triage using KTAS and examined the factors contributing to mis-triage [12]. The data is well-organized with a structure that assures the information obtained pertains to our objectives. The data includes 1267 patient admission records to EDs from October 2016 to September 2017. There are 24 variables: chief complaints, vital signs documented in initial nursing records, and clinical outcomes. Authentication of the KTAS dataset was performed by three triage specialists: a certified emergency nurse, a KTAS provider, and an instructor.
We chose this data because it is one of the few public datasets that meet the standards for academic research. It is important to note that most triage datasets are generally private and institution-specific. This is due to concerns regarding patient privacy and the restrictions imposed by ethical standards. Thus, KTAS provides an excellent opportunity for the proof-of-concept validation. While it is limited in size, it offers structured triage labels that are consistent with international standards, facilitating reproducibility and comparison in research settings.
In addition to the KTAS data, we directed our efforts across three hospitals in Baghdad, Iraq, from May to August 2025 and conducted a small-scale data collection. This effort resulted in 248 patient records with vital signs and assigned triage levels according to MTS protocol. The collection of this data was conducted in concert with local emergency medical physicians. The dataset provided an opportunity to test the model under local clinical conditions. However, two limitations must be noted. First, the sample size is modest. Second, triage levels in some Iraqi EDs are not always consistently or systematically assigned, which may affect annotation quality. For these reasons, we present this dataset as a supplementary validation and retain KTAS as the principal benchmark.
The preprocessing phase entails the preparation of the dataset for ML training by removing irrelevant, incomplete, or unavailable information. Features that lack valuable information for the model, such as patients' names, identifiers, or other administrative information, are to be removed. Features that will be available only after triage, such as triage outcomes or patient disposition post-ED, are also to be removed to avoid data leakage and ensure the model works under realistic conditions. A two-stage strategy was employed to address missing values. Initially, records containing missing values in the categorical features were eliminated, as inputting such values may introduce uncertainty or noise. For numerical features, missing values were assigned using the median of that feature's values. This approach ensures robustness and reduces sensitivity to outliers compared to the mean. Categorical features were encoded using one-hot encoding, a method that converts each value into a binary vector format [47]. This transformation ensures the compatibility of the data with the subsequent processing steps, such as feature selection and classification, which require numerical values. Table 1 shows the selected features from the KTAS dataset and provides a brief description of each feature. After preprocessing, the dataset contains 1246 records and 423 variables after applying one-hot encoding on the only categorical feature, Chief_complain.

5. System Evaluation

The evaluation of the triage classification model was conducted using a variety of evaluation metrics. These metrics were selected to provide a more comprehensive understanding of the model's performance. The first metric is accuracy, which represents the proportion of correctly classified samples relative to the total number of samples, as shown in Equation (2). The second is precision, which is the ratio of correctly predicted positive samples to all predicted positive samples, as seen in Equation (3). Equation (4) shows that the third metric is recall, which is the correctly positive samples relative to the actual positive samples. The final metric is F1 score, which is the harmonic mean of precision and recall, as can be seen in Equation (5).
A c c u r a c y = T P + T N T P + T N + F P + F N
P r e c e s i o n = T P T P + F P
R e c a l l = T P T P + F N
F 1   s c o r e = 2 × p r e c e s i o n × r e c a l l p r e c e s i o n + r e c a l l
where TP is the number of samples that the model predicted true and the actual class is true, TN is the number of samples that the model predicted false and the actual class is false, FP is the number of samples that the model predicted true and the actual class is false, and FN is the number of samples that the model predicted false and the actual class is true [48]. In addition, we used two visual metrics to achieve a clearer understanding of how well the system performed. The first metric is the confusion matrix, which shows an overview of the predicted labels as compared to the actual labels. The second metric is the receiver operating characteristic (ROC) curve, which displays the trade-off between the true positive rate and the false positive rate using a range of different thresholds. It is noteworthy that the evaluation of the proposed architecture was made using the implementation of 10-fold cross-validation, which involves the division of data into 10 equal segments. Nine of these segments are used for training, while the remaining segment is used for testing. The testing segment is alternated for 10 iterations. The mean accuracy is subsequently calculated from each execution as the overall accuracy. On other hand, the other metrics assessment is executed using a model that is randomly seeded, with 80% of the data allocated for training and the remaining 20% for testing. These metrics were employed across a range of configurations, including diverse balancing and feature selection strategies for the purpose of comparative analysis.
Regarding the IoT system performance, the system evaluation was performed within a controlled laboratory environment rather than an actual ED. We chose this approach for several reasons, which are discussed in detail in the system limitations and challenges section. The evaluation focused on key aspects including logical functionality, usability, data input processes, DT synchronization, and the latency of triage prediction. The test was performed in a controlled environment, so several assumptions were made to make sure the test environment was consistent and could be repeated. The simulated bed availability data were assumed to accurately represent real-time hospital conditions. IoT sensor readings were considered reliable and free from significant noise or signal loss. The KTAS dataset was assumed to provide consistent and standardized triage labels. Network latency and cloud response times were assumed to remain stable under the observed test load. We also assumed that each patient record was processed on its own. We assumed that EDs followed a triage protocol that worked with the KTAS categories. These assumptions will be revisited in future real-world deployments to validate performance under more variable operational conditions. This evaluation also shows how the proposed system solves the problems that were identified. By automating vital data collection and applying consistent decision logic, it helps to reduce variability and inconsistent assessments among clinicians. The real-time synchronization between IoT devices and DTs mitigates delays and supports faster decisions under time pressure. Additionally, the DT is updated regularly, which allows the system to track changes in patients' conditions. This helps to make sure that the triage results are accurate and can be adjusted as needed.

6. Results

This section will present the assessment of the classification model's performance and the examination of the integrated system's functionality. This includes the IoT data retrieval, cloud processing via Azure functions, DT synchronization, and the end UI.

6.1. Classifcation Model Performance

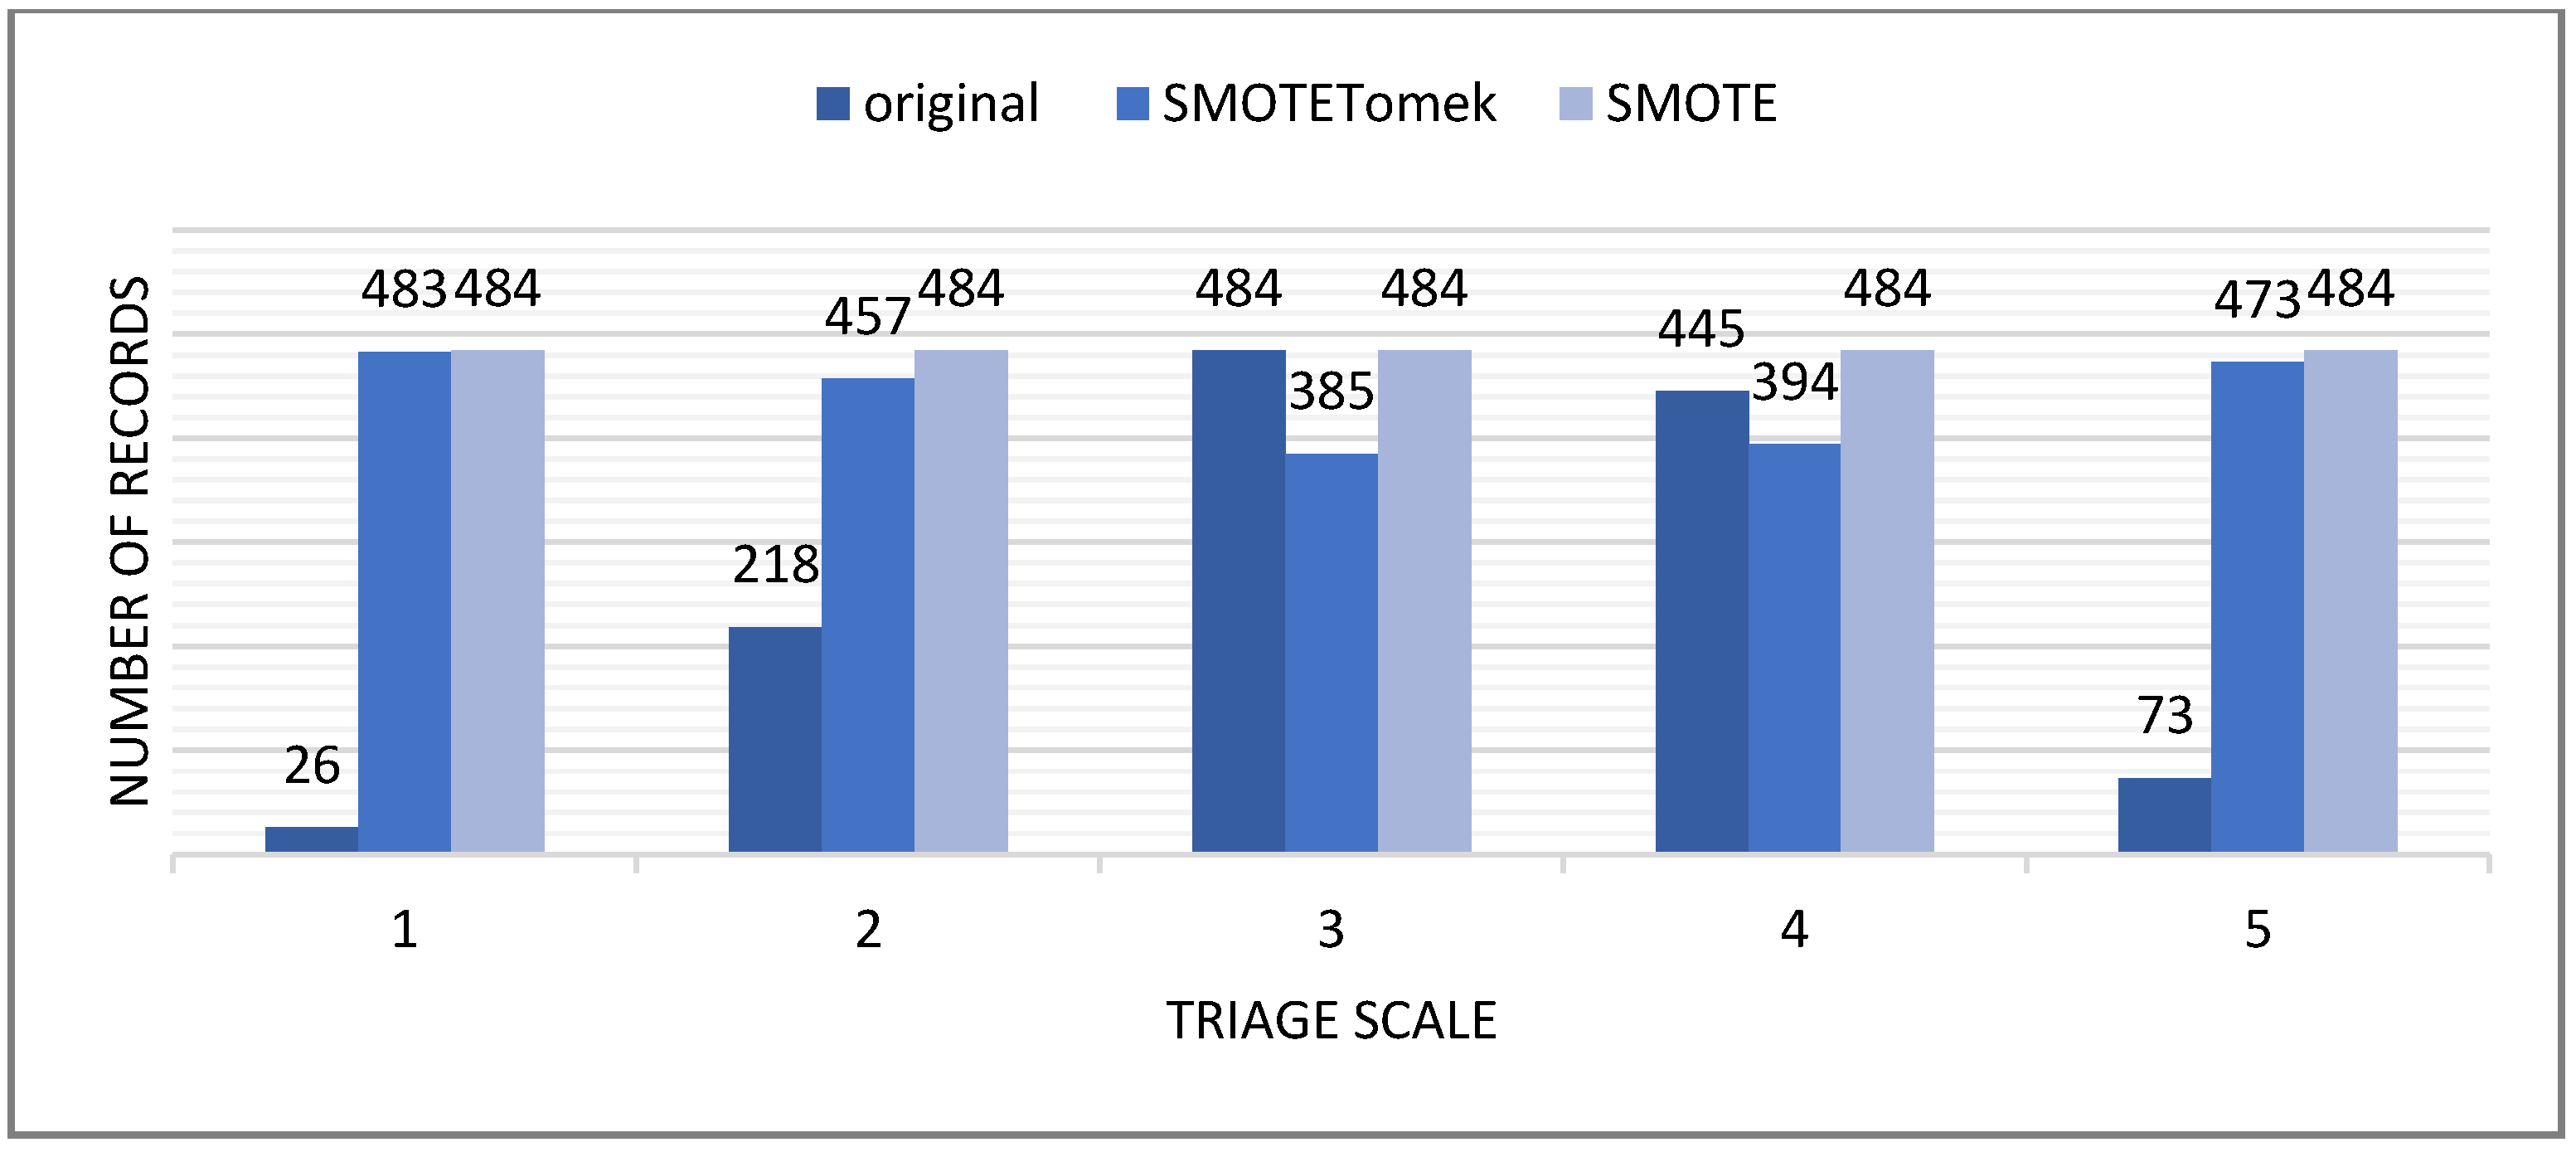
After preprocessing, the data is balanced using the hybrid SMOTE and Tomek method. Equation (1) formalizes the interpolation process used to create synthetic minority samples. This method ensures a balanced distribution of classes and avoids model bias. To illustrate the effect of these operations, Figure 7 presents the class distribution of the original dataset with SMOTE and SMOTETomek. After applying SMOTETomek, the dataset contains 2192 records with 423 features. Then, after removing one-hot encoded features that appear only once, meaning they have only one true value in the entire dataset, the number of features decreases to 189. This number of features decreases again when the LEO algorithm is used for feature selection, resulting in 67 features. This data is then used to train the classification model using Subsampled PFN and Tree PFN.
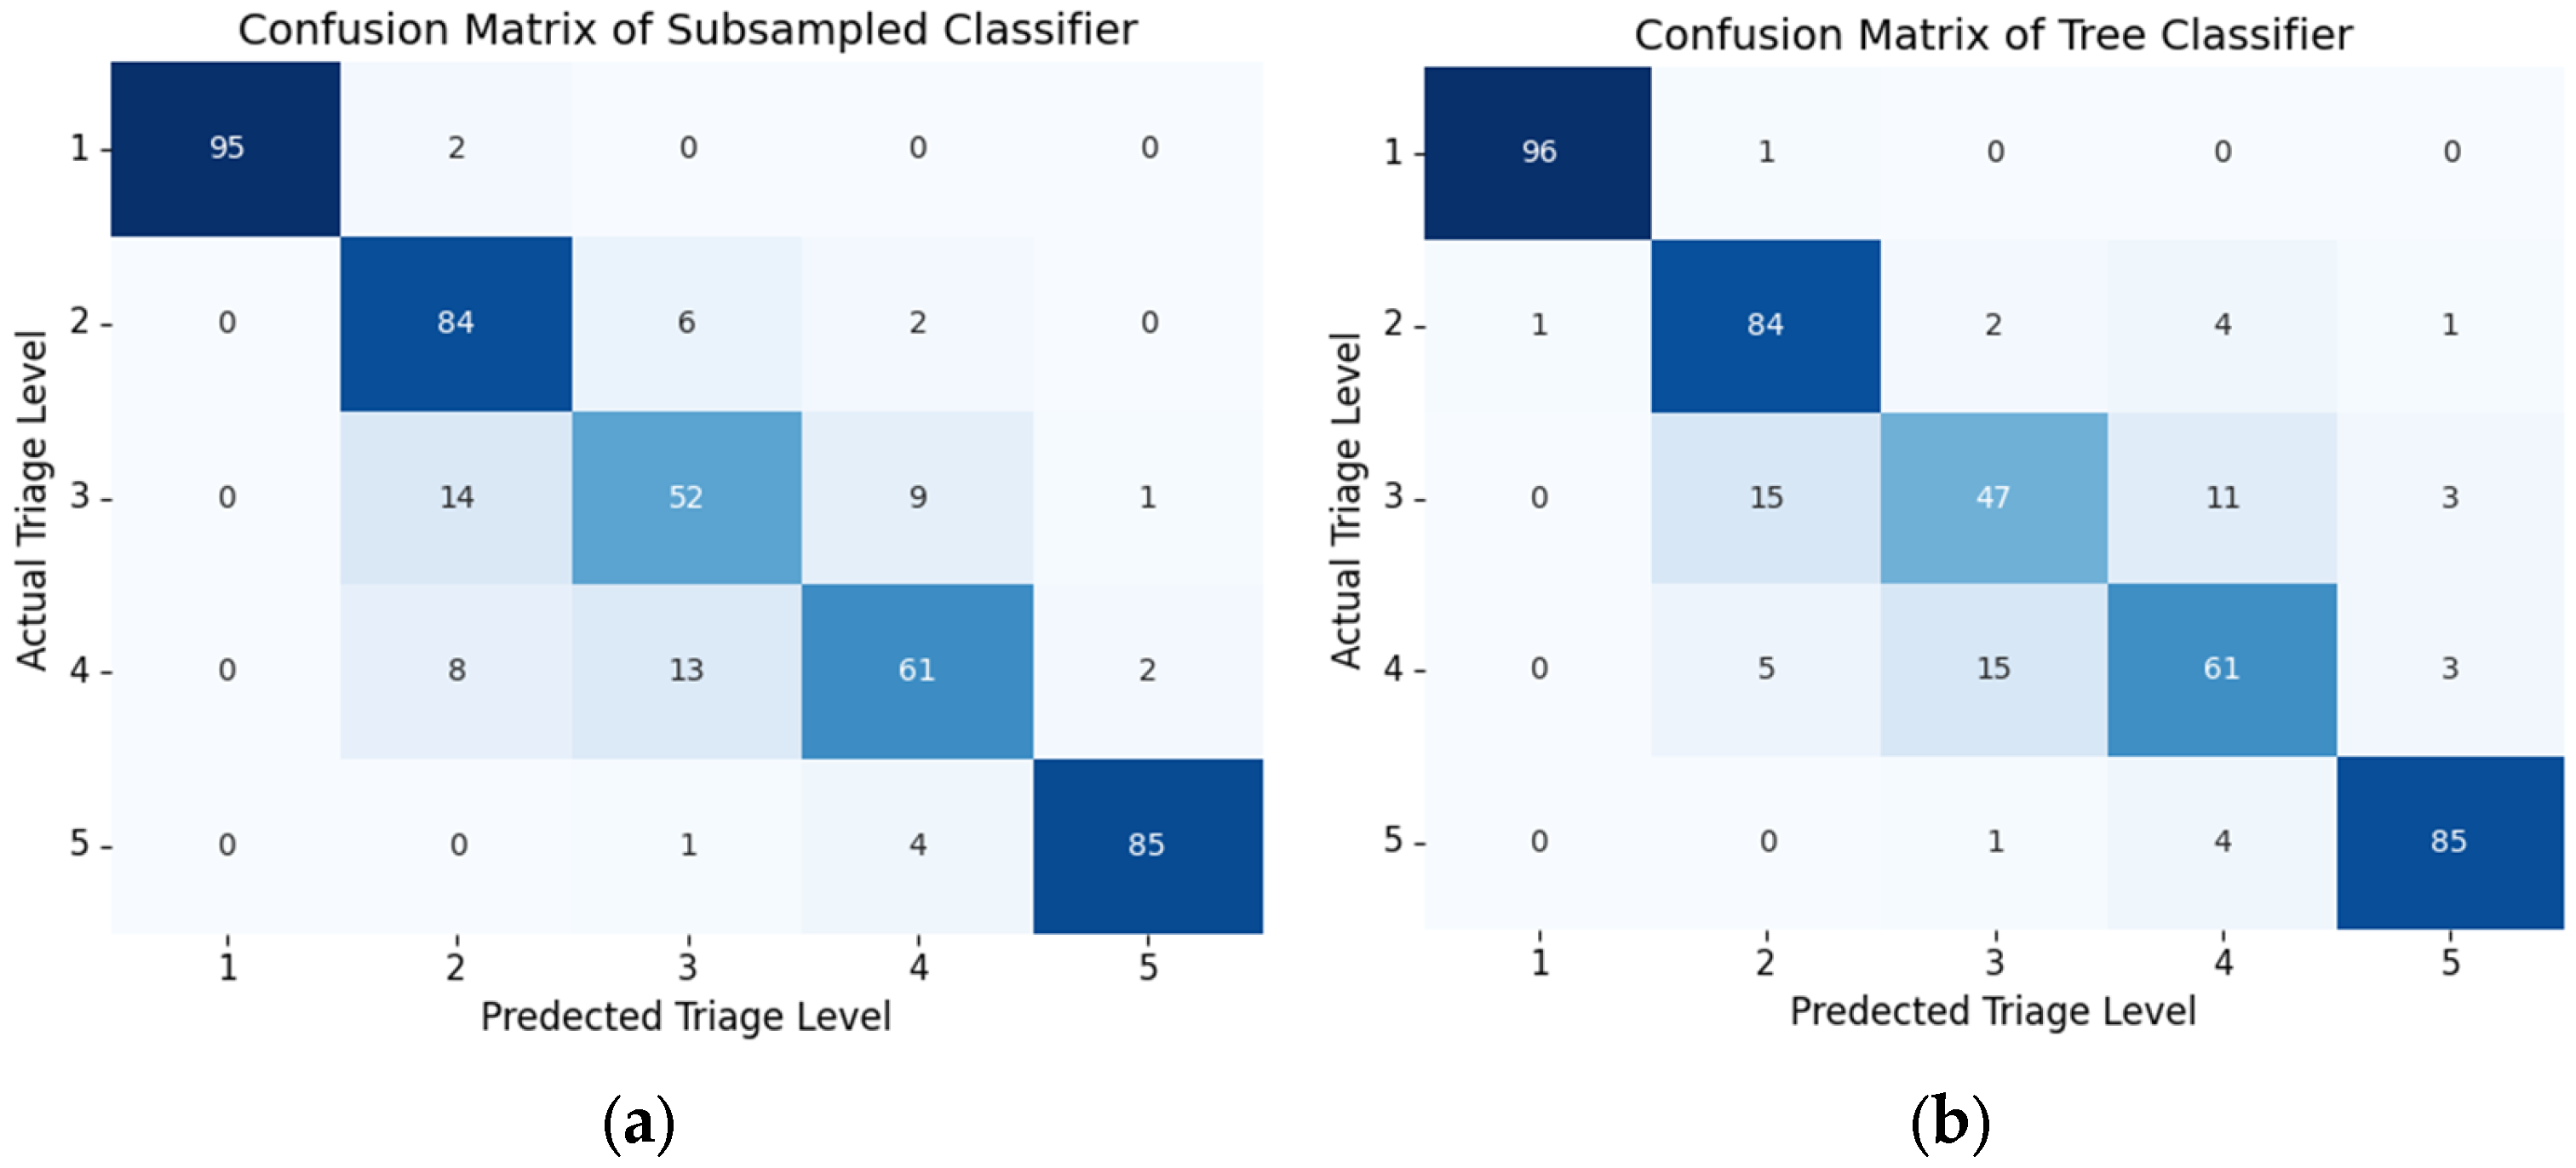
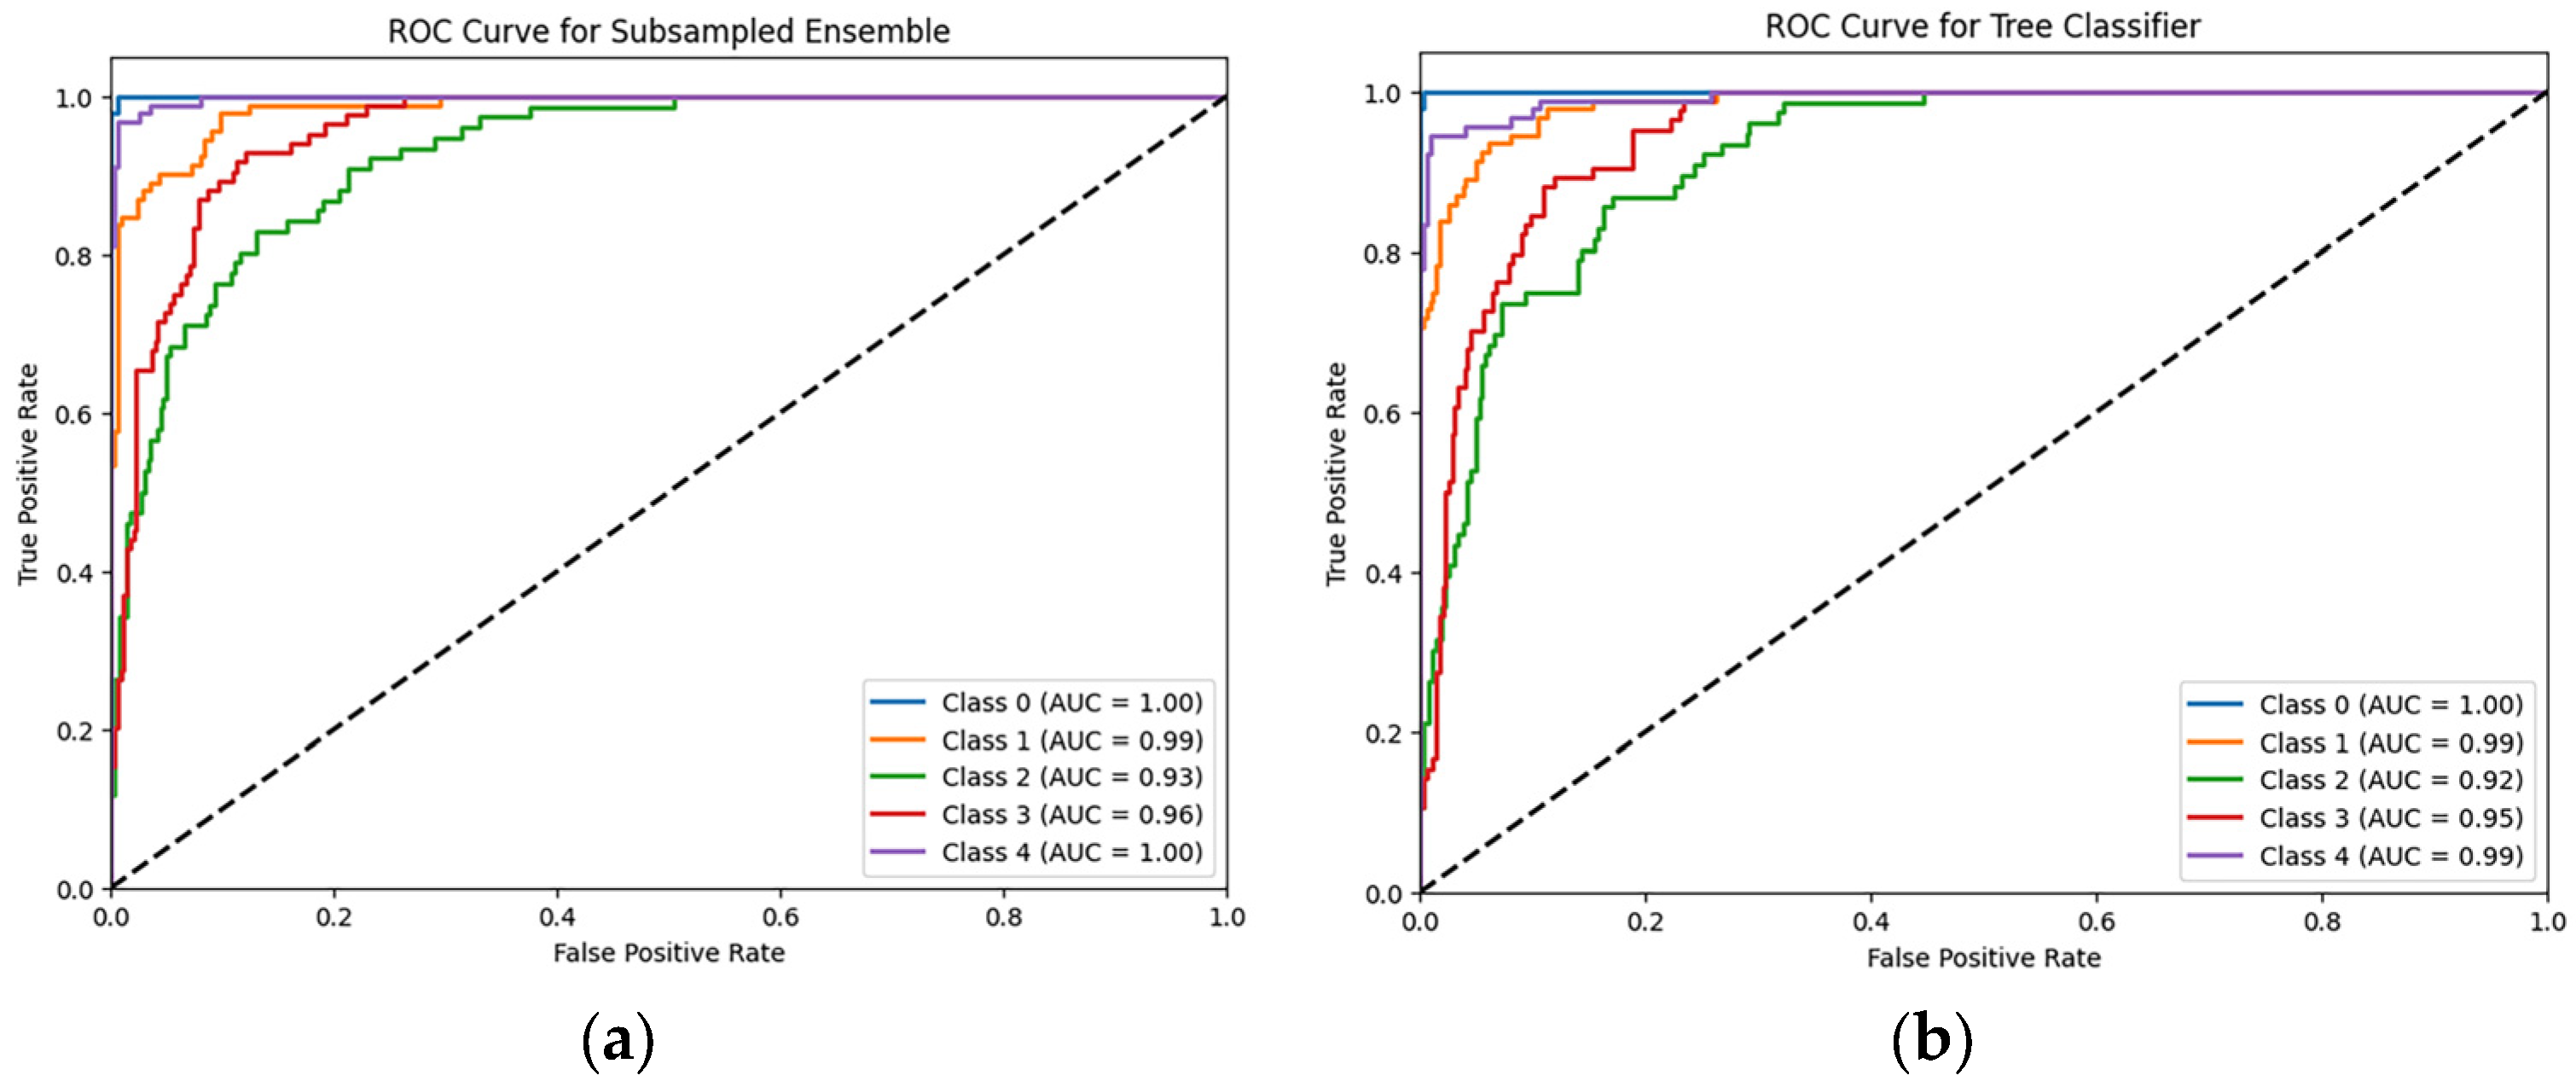
The best result was achieved using the subsampled classifier with 87.27% accuracy using 10-fold cross-validation. The arrangement of the steps in this way ensures the removal of the columns with a single occurrence prior to the use of LEO. This reduction in the number of records entering the LEO system leads to enhanced outcomes. Figure 8 and Figure 9 show the confusion matrix and ROC curve for both classifiers. ROC curves are a means of illustrating the trade-offs between sensitivity and specificity in contexts related to the processes of under-triage and over-triage. As indicated by the confusion matrix, it appears that the classes that exhibited superior outcomes were those that were more significantly impacted by the implementation of the balancing techniques. This is because the samples generated by these techniques lack the same degree of diversity present in the actual data.
In addition, to validate our prediction model, it is compared with several traditional classifiers. Table 2 shows the proposed method’s results compared to standard classifiers only, such as decision trees (DTs), Random Forests (RFs), XGBoost, Support Vector Machine (SVM), logistic regression (LR), K-Nearest Neighbors (KNNs), Naive Bayes (NB), and the result of the stacking model by the authors in [35]. These results demonstrated that the proposed structure exhibited superior performance in comparison to its counterparts. The approximate Bayesian inference approach enhances the structure's resilience to imbalanced and noisy clinical data.
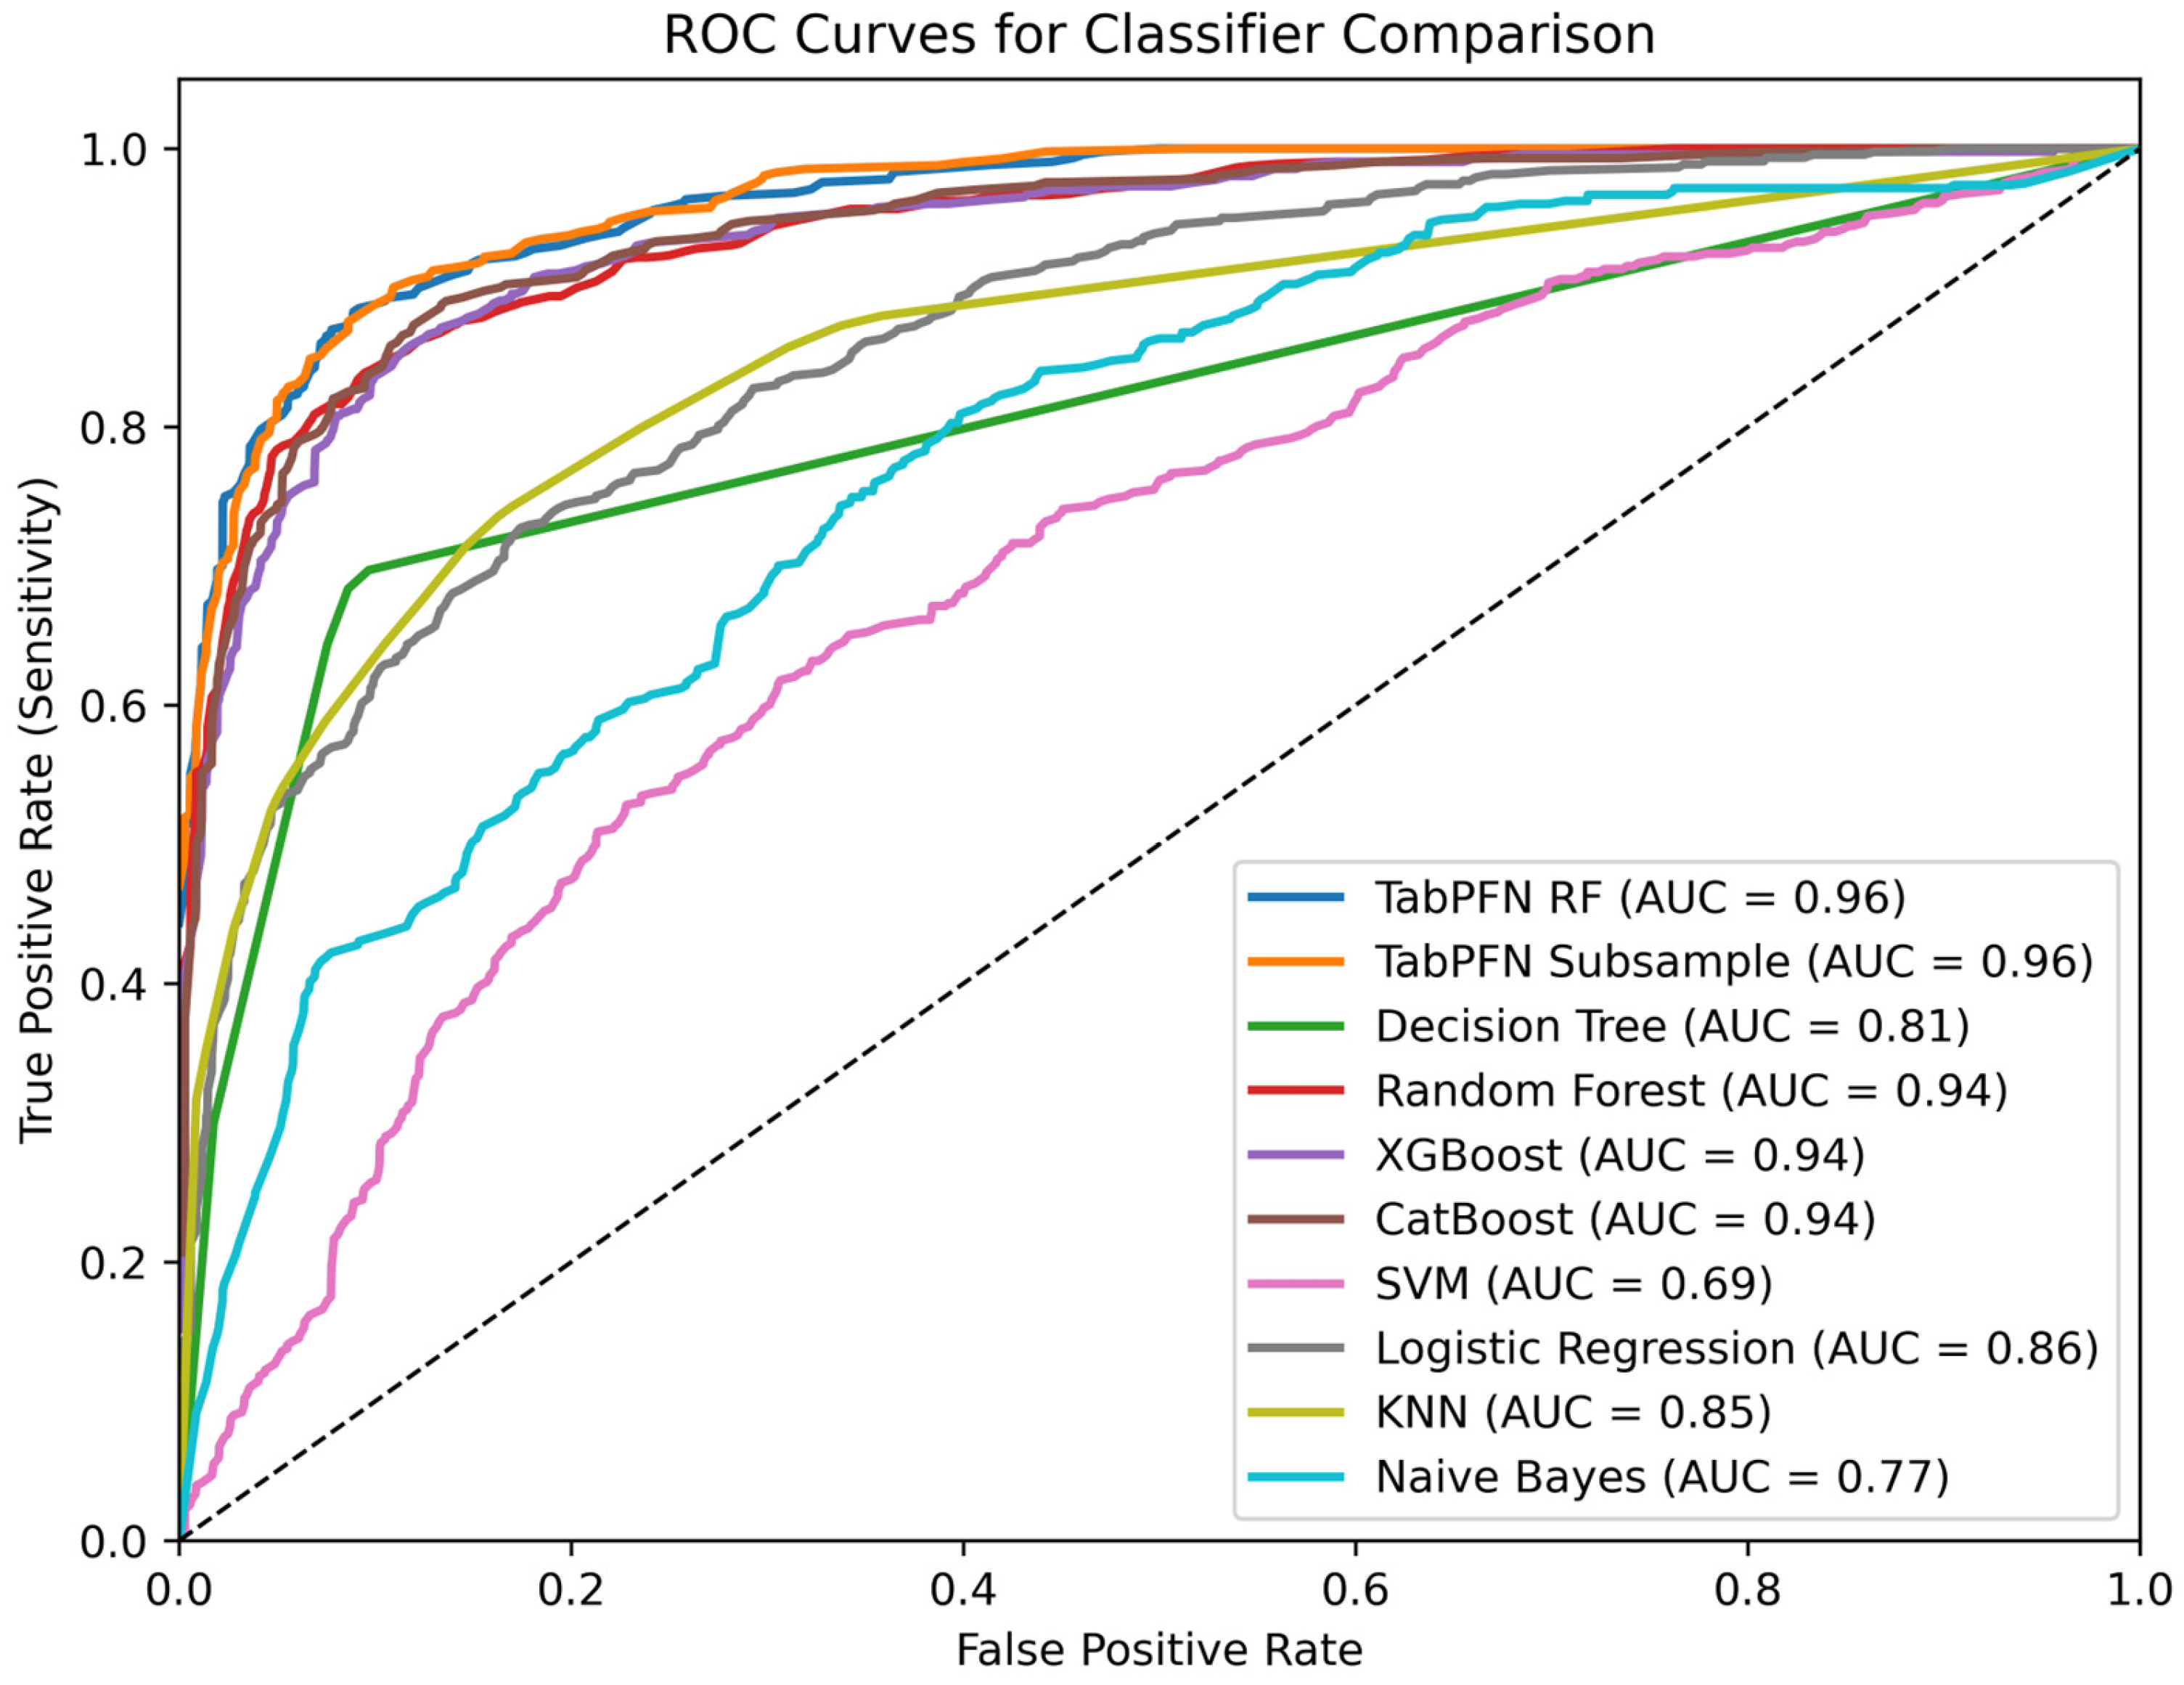
To evaluate the contribution of different methodologies to the mis-triage problem, a comparison was made between baseline models and TabPFN using ROC. As demonstrated in Figure 10, TabPFN consistently attains elevated AUC values across diverse triage levels, thereby signifying its superior discriminatory capability and diminished risk of mis-triage. It is noteworthy that, in contrast to Table 2, Figure 10 was executed posterior to the implementation of balancing and feature selection operations on all the classifiers.
On the smaller Baghdad dataset, TabPFN achieved a higher accuracy of 95.55%, 95.55% recall, 95.7 precision, and 95.57% F1-score, suggesting that the model can adapt to local patient profiles and triage practices. However, this improvement in accuracy may give rise to concerns regarding overfitting. We hypothesize that this enhancement in accuracy may be indicative of characteristics inherent to the dataset rather than indicative of superior generalization. Notably, many clinicians have observed that triage levels are frequently assigned in a non-standardized manner in Iraq, which may compromise the reliability of the assigned labels.
This paper explores several workflow configurations by modifying the balancing techniques and adjusting the sequence of steps following one-hot encoding, as shown in Figure 11. Table 3 presents a comparison among models with disparate configurations. It also demonstrates the impact of feature selection with LEO and data balancing with SMOTE and Tomek. The reduced feature set enhances interpretability by emphasizing the most influential clinical features that contribute to triage classification. This approach enables the alignment of the model with clinical reasoning, as opposed to the indiscriminate reliance on the entire feature set.
The best result was obtained from Model 6, which performed the feature removal operation before the feature selection. This way, the optimization algorithm had fewer features to choose from, resulting in better performance.
The baseline accuracy of the most effective conventional model, XGBoost (66.00%), will be used as the initial point of comparison, while the TabPFN on raw data (70.80%) will serve as the starting point for feature and balancing comparison. The transition from XGBoost (66.00%) to TabPFN (70.80%) alone results in a 4.80% enhancement, thereby substantiating the marked superiority of the transformer-based approach in the context of this tabular data. The application of SMOTETomek to the TabPFN model yielded the most substantial enhancement, with a 10.07% increase (from 70.80% to 80.87%), thereby substantiating its pivotal function in mitigating class imbalance bias for patients deemed critical. In the raw TabPFN model, using LEO enhanced accuracy by a margin of 0.80%. LEO added an additional 5.01% (from 80.87% to 85.88%) when applied to the SMOTETomek-balanced data. This shows that the primary value of LEO lies not solely in its reduction in features, but rather in its optimization of the feature set within the intricate and balanced feature space that is shaped by SMOTETomek. These results indicate that using SMOTETomek and LEO (contributing a combined 15.08% to the TabPFN model) is imperative to attaining the final state-of-the-art accuracy of 85.88%.
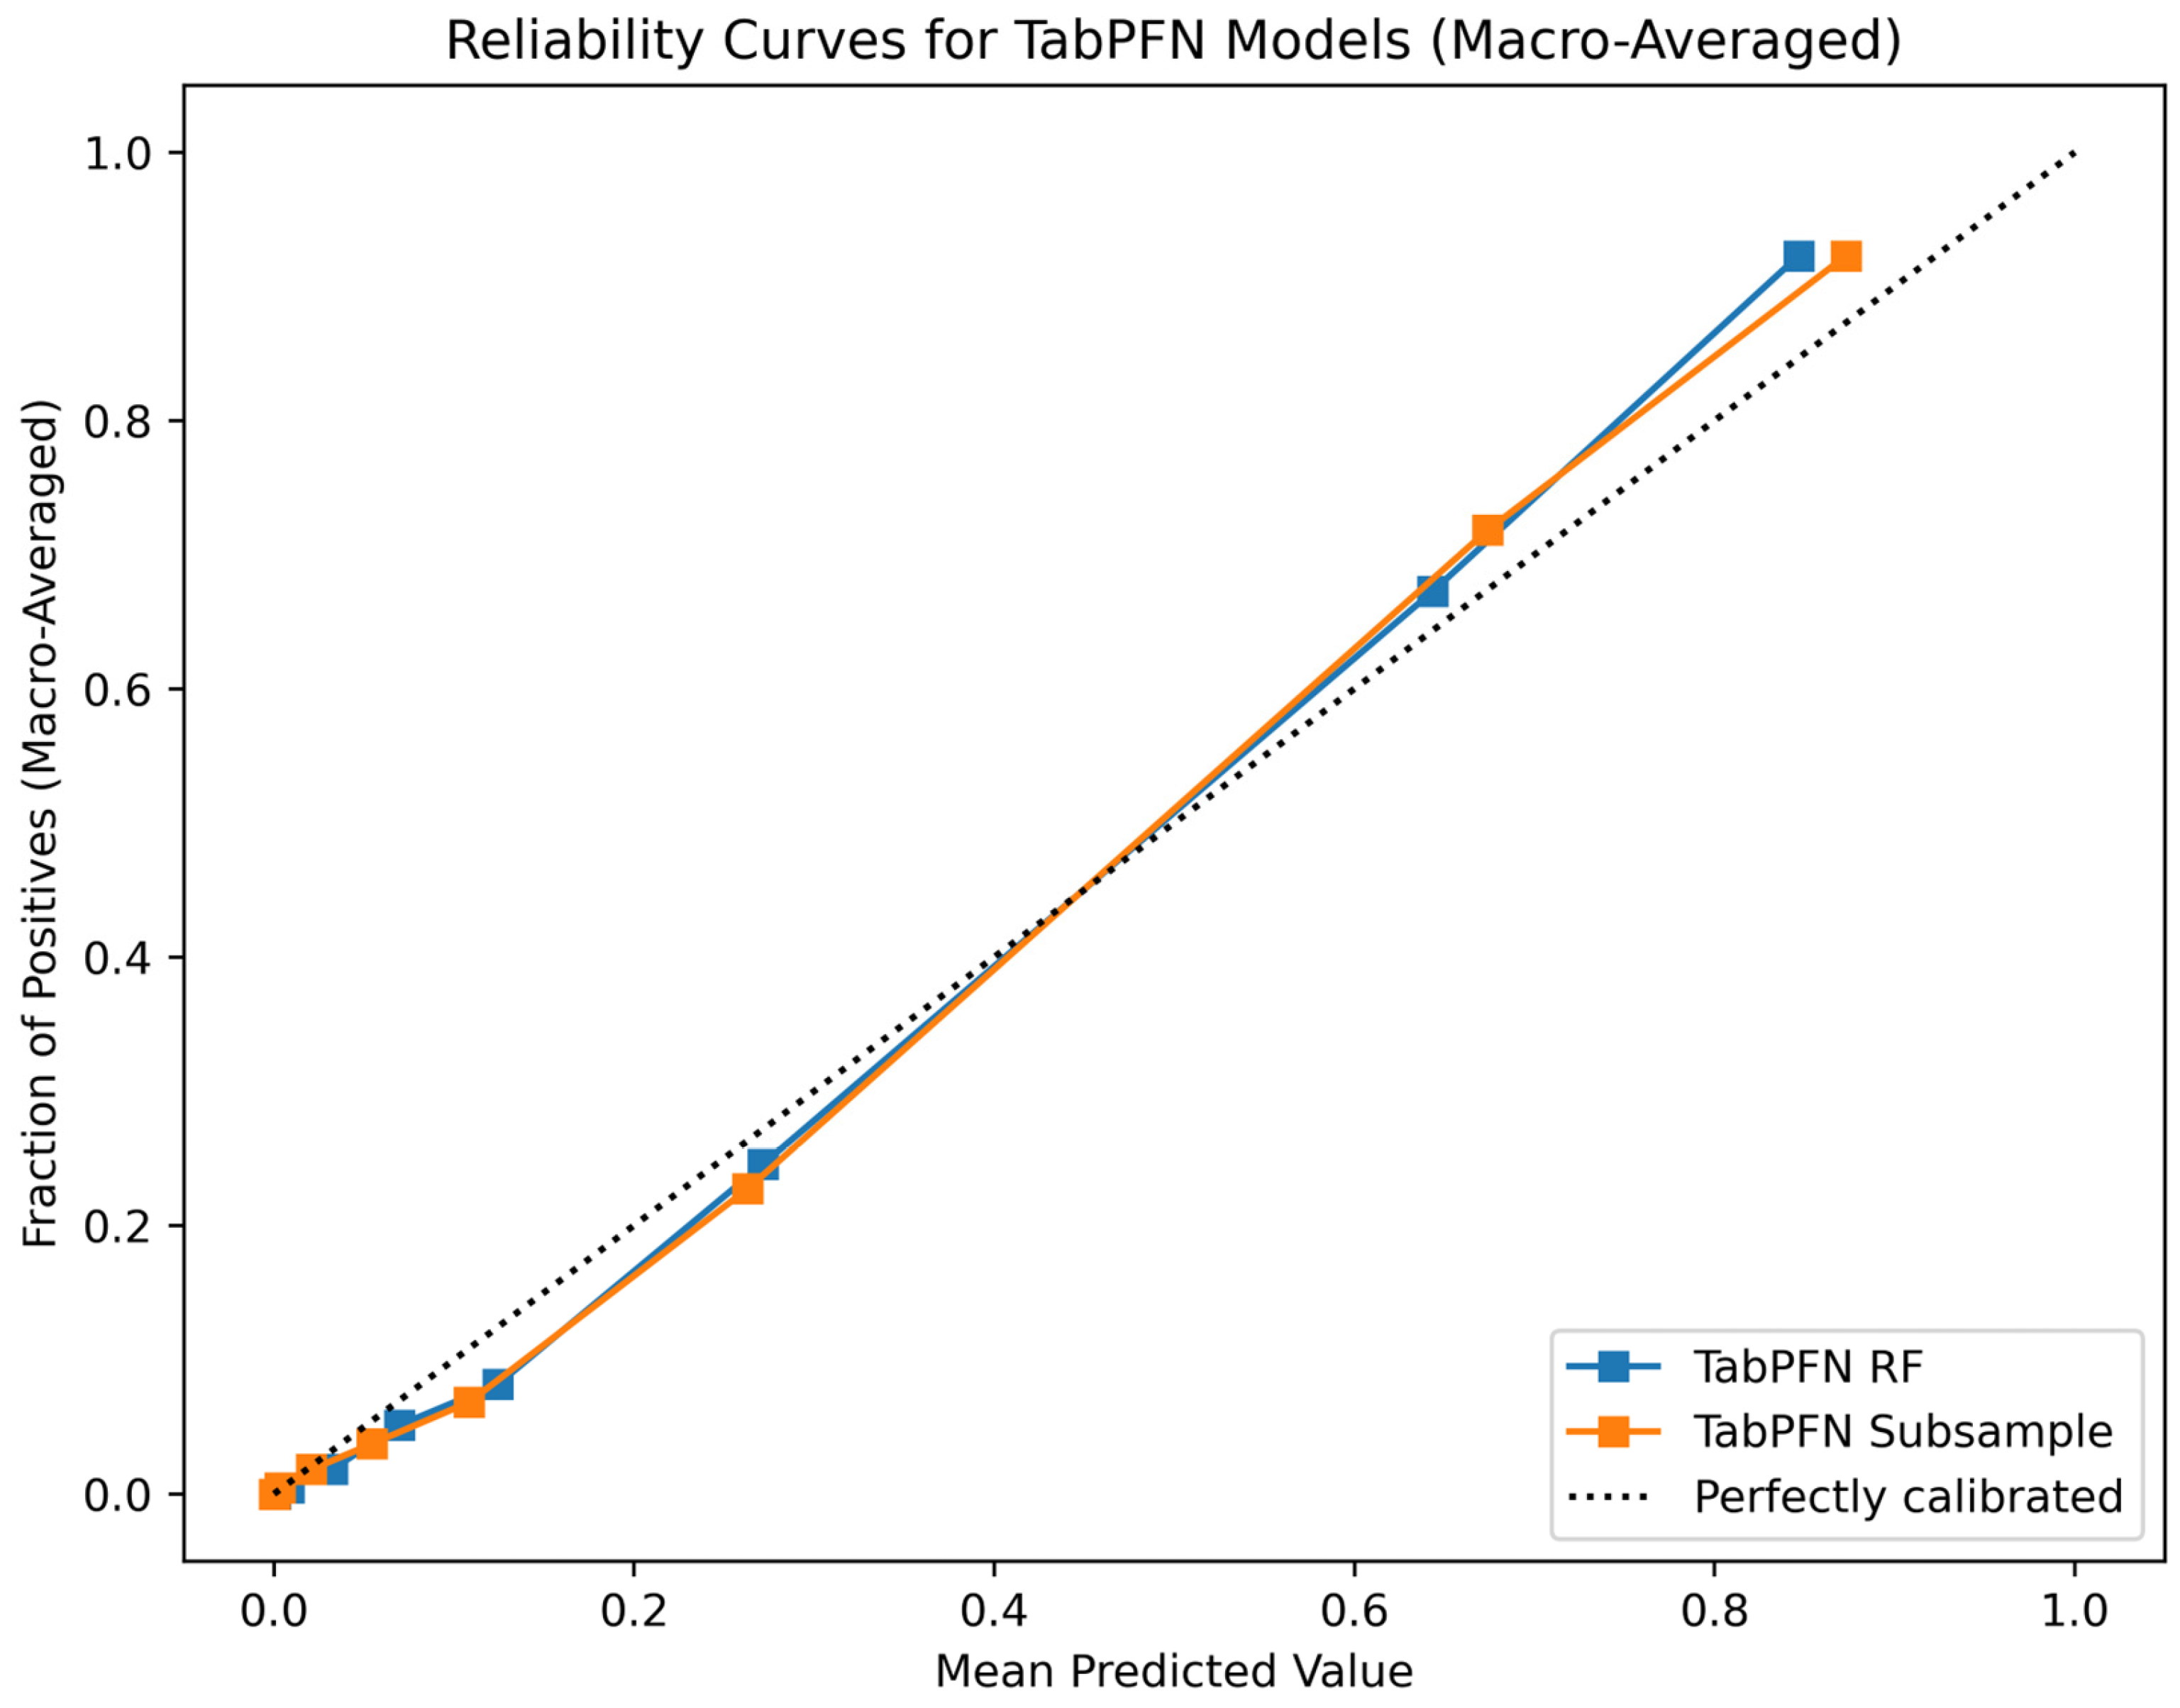
Furthermore, we employed a reliability curve analysis to assess the calibration between the predicted triage probabilities and the actual triage outcomes, as shown in Figure 12. This analysis shows an alignment across probability intervals, indicating a high degree of concordance between the predicted and observed triage probabilities. From a clinical perspective, false negatives (under-triage) represent the most critical error, as they can result in delays in treatment for patients with genuine needs for urgent care. On the other hand, false positives (i.e., over-triage) may cause suboptimal emergency resources usage but do not endanger patient safety.
TabPFN provides inductive priors that reduce overfitting on small clinical datasets, due to its pretraining on millions of synthetic tabular tasks. It approximates Bayesian predictive inference, producing better calibrated probabilities and useful uncertainty estimates. The computation cost of each step was as follows: The LEO execution for feature selection was on a local machine (Intel i7-8650U, 16 GB RAM, integrated GPU (local vendor, Baghdad, Iraq)) and took approximately 42 minutes to identify the top N features. As expected, this runtime varies according to hardware, dataset size, and number of features. TabPFN training and inference were executed on Google Colab (T4 GPU), with each run requiring approximately one minute to complete on our dataset. It should be noted that the computation cost of TabPFN is contingent upon both the hardware and the dataset, yet it is evident that TabPFN demonstrates a high degree of efficiency in its transformer architecture. Compared with the training and testing process for all the classifiers, which was less than one minute in the Google Colab environment, our method is more computationally demanding. However, in this case, we focused on the accuracy and reliability of the models rather than on computational efficiency.

6.2. IoT System Performance

Regarding the performance of the IoT system, the latency of data updating is contingent upon local internet infrastructure and cloud region proximity. The present study was conducted in Iraq, Baghdad, with the servers located in the eastern United States. An average of approximately four s was measured for IoT Hub to DT updates (bed status and patient information), and an average of approximately two s for triage prediction inference. As indicated in previous studies on the application of IoT in healthcare, end-to-end delays of less than 10 s are considered acceptable for real-time monitoring and triage decision support. Therefore, this measured latency meets the responsiveness requirement for near-real-time clinical workflows [49]. This latency was measured under single connection conditions. However, Azure IoT Hub and functions use a serverless, event-driven model in which each device message is processed independently and can automatically scale with demand. This architecture can support thousands of simultaneous device messages with near-linear scalability. Minor delays may occur under heavy network congestion or regional bandwidth limits.

7. Discussion

The approaches mentioned in the previous section are based on rule-based systems and a threshold alarm, compared to traditional monitoring systems with DT approaches, and can be effective in situations where immediate alarm triggering is necessary without context. In contrast, DT monitors the patient's condition in real time and is capable of integrating multiple variables at one time, which facilitates predictive modeling and patient-specific decision support, which extends beyond just threshold breach alarms. Although the main reason for choosing Azure over its competitors was due to its native DT and IoT support, which facilitate modeling and synchronization, Azure offers healthcare support compliance, including HIPAA and GDPR. In contrast, AWS provides alternative tools, such as AWS IoT TwinMaker and SageMaker for ML integration. In some cases, using the hospital network locally can reduce delays and improve data privacy in areas where the cloud is not available. Nonetheless, given the necessity of substantial IT resources, hardware redundancy, and ongoing maintenance for local infrastructure, the selection of an appropriate solution should ultimately be contingent upon regional constraints and the institutional capacity of the IT department. The proposed cloud-based design leverages elasticity, automatic scaling, and integrated analytics services of the cloud, rendering it more suitable for multi-hospital emergency systems. A potential compromise may be offered by hybrid architecture, which could enable partial on-premises processing for latency-sensitive tasks while retaining cloud-level orchestration and analytics. Conversely, centralized monitoring systems depend on periodic manual data entry or bedside monitors that are proprietary to the hospital and linked to its central system. While these systems are generally reliable, they are often considered rigid, costly, and not an easy choice for integrating with cloud-based predictive analytics platforms.

System Limitations and Challenges

In this study, patient monitoring and bed availability were demonstrated through lab-based or simulated data configurations and not through direct deployment in a hospital environment. This decision was made due to the work's nascent proof-of-concept stage and the ethical and logistical challenges that come with immediate clinical integration. Specifically, deploying the bed occupancy monitoring component, which was implemented in our previous work, in hospitals and validating it in the current study would have necessitated approvals and concurrent access from multiple hospitals in the same region at the same time, which was not feasible within the current scope.
The current implementation was trained on KTAS data, and its predicted triage levels reflect KTAS-specific criteria. The transition of healthcare providers to hospitals that utilize alternative triage frameworks, such as ESI or MTS, will need the implementation of retraining or fine-tuning on local datasets. The sensors selected for this study (MLX90614 for temperature, MAX30102 and ARD-000697 for heart rate, and SpO2) have been used in prior healthcare IoT studies. However, using these sensors in actual EDs is challenging. In emergency situations, the environment is characterized by noise and chaos. Patients move around, devices can disconnect, and wireless networks experience congestion. These conditions can lead to signal loss or sensor failure. Robust error-checking, redundancy, and fallback communication pathways are therefore important. Integrating the system with cloud infrastructure raises privacy concerns. In the process of transmitting patient data to cloud infrastructures, it is crucial to think about following the rules and the dangers of unauthorized access and possible data breaches. To protect the patients’ data, it is necessary to utilize end-to-end encryption, optimization of data anonymization whenever feasible, and rigorous enforcement of role-based access control mechanisms to safeguard data integrity and maintain patient trust. The way our system is set up now does not require personal information for triage predictions, so it follows data minimization rules. We only process data that is relevant to the triage. That means that the vital signs and the level of severity are considered. We anonymize all the data so that no one can trace it to a particular person. This provides more security by combining anonymity with cryptography. Since the system will be implemented in a medical environment, informed consent must be provided by the patients before their data can be processed. The ethics committee has reviewed and approved this. Patients have to provide information on the amount of data collected, the period the data will be stored, and the purpose. They have to agree before the monitoring of vital signs can begin.
For such systems to be deployed successfully, they must gain the trust of clinicians and should work to align the workflow. It is imperative that the integration of such systems be strictly designed to facilitate, rather than impede, the daily triage practices of clinicians. These systems’ deployment in the hospitals depends on whether they can work with the electronic health record systems that already exist, whether they follow the rules for medical devices, and whether they meet the privacy security requirements. To facilitate clinical adoption, it is recommended to follow this three-phase integration roadmap: (1) Extended validation and data governance under ethical and privacy regulations must be implemented. (2) Regulatory alignment with ISO and IEC standards for medical device software, including risk management. (3) Pilot deployment with user acceptance testing among clinicians and emergency staff is essential. This staged approach is designed to ensure both regulatory compliance and clinical usability prior to large-scale hospital integration.
This staged approach is designed to ensure both regulatory compliance and clinical usability prior to large-scale hospital integration.
Having said this, the present system should be comprehended as a feasibility demonstration of the IoT, DT, and AI pipeline. Feature work efforts will center on the implementation of experimental projects, encompassing the deployment of sensor hardware and the utilization of ED environments, as well as the gradual incorporation into hospital IT infrastructures. This approach will facilitate the evaluation of the system's performance under authentic, real-world conditions.

8. Conclusion and Future Work

The aim of this study is to develop a real-time triage support system that proactively addresses the challenges that were previously identified. Through unified AI-driven evaluations, clinicians can reduce variability and inconsistent assessments, minimize time pressure with automated data collection and rapid processing, and keep track of changing patient conditions with real-time DT updates. This system utilizes the IoT to create instances of the DT for patients and to update that information in real time. The patient's vital signs were collected using IoT sensors. The hospital staff manually entered other information into a basic UI. This data is then used to predict the patient's triage level using a pretrained classification model. The model was trained using a public dataset that employs the KTAS triage system. After the preprocessing stage, SMOTETomek was used to balance the data, LEO was used to select features, and TabPFN was used for classification. This combination yielded an overall accuracy of 87.27%, as determined by 10-fold cross-validation. To further assess our prediction model’s performance, we compare it with several standard classifiers, such as decision trees, Random Forests, XGBoost, Support Vector Machines, logistic regression, K-Nearest Neighbors, Naive Bayes, and Microsoft Azure AutoML. This system has been shown to be a reliable and accurate solution for ED challenges, such as mis-triage and overcrowding. It has also been shown to minimize emergency response time, as well as human errors. By combining real-time monitoring and AI decision support, the system provides timely and reliable predictions about the severity of an emergency, with the potential to improve emergency healthcare services for patients. In the future, we will focus on providing dashboards for patients that are affordable and easy to use. Efforts will also be directed toward system validation in a real-world hospital environment by measuring and enhancing system performance in domains such as latency, usability, and security. Further potential avenues may include the extension of the system to facilitate comprehensive clinical decision-making that extends beyond triage.

Author Contributions

The authors confirm their contributions to the paper as follows: H.A.A.-A. and S.M.M. were responsible for the conceptualization and design of the study. H.Q.M. conducted the literature review, developed the methodology, implemented the analysis software, prepared the original draft, and validated the results. Supervision and project administration were carried out by H.A.A.-A. and S.M.M. All authors have read and agreed to the published version of the manuscript.

Funding

This research received no external funding.

Data Availability Statement

The authors confirm that the data supporting the findings of this study is available within the article.

Acknowledgments

The authors gratefully acknowledge the support provided by Mustansiriyah University (www.uomustansiriyah.edu.iq) in Baghdad, Iraq, for this work. We also extend our sincere thanks to Baghdad Teaching Hospital, Al-Sha’ab Hospital, Imam Ali Hospital, Al-Alamy Private Hospital, and Dowaly Private Hospital in Baghdad for their valuable assistance and cooperation.

Conflicts of Interest

The authors declare no conflicts of interest.

Abbreviations

The following abbreviations are used in this manuscript:
SMOTESynthetic Minority Oversampling Technique
EDEmergency Department
DTDigital Twin
IoTInternet of Things
AIArtificial Intelligence
MLMachine Learning
ATSAustralasian Triage Scale
CTASCanadian Triage and Acuity Scale
MTSManchester Triage System
ESIEmergency Severity Index
SATSSouth African Triage Scale
KTASKorean Triage and Acuity Scale
DTDLDigital Twin Definition Language
SMOTETomekSynthetic Minority Oversampling Technique Combined with Tomek Links
LEOLagrange Element Optimization
TabPFNTabular Prior-Data Fitted Network
MQTTMessage Queuing Telemetry Transport
HTTPHyper-text Transfer Protocol
HRHeart Rate
SpO2Oxygen Saturation
I2CInter-Integrated Circuit
SDKSoftware Development Kit
UIUser Interface
CSVComma-separated Values
SsynGenerated Samples
rRandom Number between 0 and 1
SKNNk-Nearest Neighbor Samples
SfFeature Samples
ROCReceiver Operating Characteristic
AUCArea Under Curve

References

  1. Samadbeik, M.; Staib, A.; Boyle, J.; Khanna, S.; Bosley, E.; Bodnar, D.; Lind, J.; Austin, J.A.; Tanner, S.; Meshkat, Y.; et al. Patient flow in emergency departments: A comprehensive umbrella review of solutions and challenges across the health system. BMC Health Serv. Res. 2024, 24, 274. [Google Scholar] [CrossRef] [PubMed]
  2. Abu-Alsaad, H.A.; Al-Taie, R.R.K. NLP analysis in social media using big data technologies. TELKOMNIKA (Telecommun. Comput. Electron. Control) 2021, 19, 1840. [Google Scholar] [CrossRef]
  3. Suamchaiyaphum, K.; Jones, A.R.; Markaki, A. Triage Accuracy of Emergency Nurses: An Evidence-Based Review. J. Emerg. Nurs. 2024, 50, 44–54. [Google Scholar] [CrossRef] [PubMed]
  4. Suamchaiyaphum, K.; Jones, A.R.; Polancich, S. The accuracy of triage classification using Emergency Severity Index. Int. Emerg. Nurs. 2024, 77, 101537. [Google Scholar] [CrossRef] [PubMed]
  5. Singh, M.; Fuenmayor, E.; Hinchy, E.P.; Qiao, Y.; Murray, N.; Devine, D. Digital twin: Origin to future. Appl. Syst. Innov. 2021, 4, 36. [Google Scholar] [CrossRef]
  6. Siam, A.I.; Almaiah, M.A.; Al-Zahrani, A.; Elazm, A.A.; El Banby, G.M.; El-Shafai, W.; El-Samie, F.E.A.; El-Bahnasawy, N.A. Secure Health Monitoring Communication Systems Based on IoT and Cloud Computing for Medical Emergency Applications. Comput. Intell. Neurosci. 2021, 2021, 8016525. [Google Scholar] [CrossRef]
  7. Georgieva-Tsaneva, G.; Cheshmedzhiev, K.; Tsanev, Y.-A.; Dechev, M.; Popovska, E. Healthcare Monitoring Using an Internet of Things-Based Cardio System. IoT 2025, 6, 10. [Google Scholar] [CrossRef]
  8. Da’Costa, A.; Teke, J.; Origbo, J.E.; Osonuga, A.; Egbon, E.; Olawade, D.B. AI-driven triage in emergency departments: A review of benefits, challenges, and future directions. Int. J. Med. Inform. 2025, 197, 105838. [Google Scholar] [CrossRef]
  9. Saleh, B.J.; Al_Taie, R.R.K.; Mhawes, A.A. Machine Learning Architecture for Heart Disease Detection: A Case Study in Iraq. Int. J. Online Biomed. Eng. (iJOE) 2022, 18, 141–153. [Google Scholar] [CrossRef]
  10. Morais, D.; Pinto, F.G.; Pires, I.M.; Garcia, N.M.; Gouveia, A.J. The influence of cloud computing on the healthcare industry: A review of applications, opportunities, and challenges for the CIO. Procedia Comput. Sci. 2022, 203, 714–720. [Google Scholar] [CrossRef]
  11. Mutashar, H.Q.; Mahmoud, S.M.; Abu-Alsaad, H.A. Cloud-based Digital Twin Framework and IoT for Smart Emergency Departments in Hospitals. Eng. Technol. Appl. Sci. Res. 2025, 15, 22269–22277. [Google Scholar] [CrossRef]
  12. Moon, S.H.; Shim, J.L.; Park, K.S.; Park, C.S. Triage accuracy and causes of mistriage using the Korean Triage and Acuity Scale. PLoS ONE Public Libr. Sci. 2019, 14, e0216972. [Google Scholar] [CrossRef] [PubMed]
  13. DTDL Models-Azure Digital Twins|Microsoft Learn [Internet]. Available online: https://learn.microsoft.com/en-us/azure/digital-twins/concepts-models (accessed on 17 July 2025).
  14. Cloud Computing Services|Microsoft Azure [Internet]. Available online: https://azure.microsoft.com/en-us/ (accessed on 17 July 2025).
  15. Azure IoT Hub Documentation|Microsoft Learn [Internet]. Available online: https://learn.microsoft.com/en-us/azure/iot-hub/ (accessed on 14 October 2024).
  16. Azure Functions Documentation|Microsoft Learn [Internet]. Available online: https://learn.microsoft.com/en-us/azure/azure-functions/ (accessed on 26 October 2024).
  17. What is Azure Digital Twins?-Azure Digital Twins|Microsoft Learn [Internet]. Available online: https://learn.microsoft.com/en-us/azure/digital-twins/overview (accessed on 17 July 2025).
  18. Aladdin, A.M.; Rashid, T.A. LEO: Lagrange elementary optimization. Neural. Comput. Appl. 2025, 37, 14365–14397. [Google Scholar] [CrossRef]
  19. Hollmann, N.; Müller, S.; Eggensperger, K.; Hutter, F. TabPFN: A Transformer That Solves Small Tabular Classification Problems in a Second. arXiv 2023, arXiv:2207.01848. [Google Scholar] [CrossRef]
  20. Alshathri, S.; El-Din Hemdan, E.; El-Shafai, W.; Sayed, A. Digital Twin-Based Automated Fault Diagnosis in Industrial IoT Applications. Comput. Mater. Contin. 2023, 75, 183–196. [Google Scholar] [CrossRef]
  21. Lu, Q.; Shen, X.; Zhou, J.; Li, M. MBD-Enhanced Asset Administration Shell for Generic Production Line Design. IEEE Trans. Syst. Man Cybern. Syst. 2024, 54, 5593–5605. [Google Scholar] [CrossRef]
  22. Wu, Z.; Ma, C.; Zhang, L.; Gui, H.; Liu, J.; Liu, Z. Predicting and compensating for small-sample thermal information data in precision machine tools: A spatial-temporal interactive integration network and digital twin system approach. Appl. Soft Comput. 2024, 161, 111760. [Google Scholar] [CrossRef]
  23. Wang, E.; Tayebi, P.; Song, Y.-T. Cloud-Based Digital Twins’ Storage in Emergency Healthcare. Int. J. Networked Distrib. Comput. 2023, 11, 75–87. [Google Scholar] [CrossRef]
  24. Corral-Acero, J.; Margara, F.; Marciniak, M.; Rodero, C.; Loncaric, F.; Feng, Y.; Gilbert, A.; Fernandes, J.F.; Bukhari, H.A.; Wajdan, A.; et al. The “Digital Twin” to enable the vision of precision cardiology. Eur. Heart J. 2025, 41, 4556–4564. [Google Scholar] [CrossRef]
  25. Jameil, A.K.; Al-Raweshidy, H. A digital twin framework for real-time healthcare monitoring: Leveraging AI and secure systems for enhanced patient outcomes. Discov. Internet Things 2025, 5, 37. [Google Scholar] [CrossRef]
  26. Chen, J.; Yi, C.; Du, H.; Niyato, D.; Kang, J.; Cai, J.; Shen, X. A Revolution of Personalized Healthcare: Enabling Human Digital Twin with Mobile AIGC. Available online: https://haptx.com (accessed on 6 January 2025).
  27. Ramya, M.C.; Elamathi, S.; Nithya, D.; Priyadarshini, K.; Suganthini, S. IoT-Powered Digital Twin Solution for Real-Time Health Monitoring [Internet]. Available online: www.ijert.org (accessed on 1 July 2025).
  28. Kang, H.Y.J.; Ko, M.; Ryu, K.S. Tabular transformer generative adversarial network for heterogeneous distribution in healthcare. Sci. Rep. 2025, 15, 10254. [Google Scholar] [CrossRef] [PubMed]
  29. Hall, J.N.; Galaev, R.; Gavrilov, M.; Mondoux, S. Development of a machine learning-based acuity score prediction model for virtual care settings. BMC Med. Inf. Decis. Mak. 2023, 23, 200. [Google Scholar] [CrossRef] [PubMed]
  30. Xiao, Y.; Zhang, J.; Chi, C.; Ma, Y.; Song, A. Criticality and clinical department prediction of ED patients using machine learning based on heterogeneous medical data. Comput. Biol. Med. 2023, 165, 107390. [Google Scholar] [CrossRef] [PubMed]
  31. Wang, B.; Li, W.; Bradlow, A.; Bazuaye, E.; Chan, A.T.Y. Improving triaging from primary care into secondary care using heterogeneous data-driven hybrid machine learning. Decis. Support Syst. 2023, 166, 113899. [Google Scholar] [CrossRef]
  32. Feretzakis, G.; Sakagianni, A.; Anastasiou, A.; Kapogianni, I.; Tsoni, R.; Koufopoulou, C.; Karapiperis, D.; Kaldis, V.; Kalles, D.; Verykios, V.S. Machine Learning in Medical Triage: A Predictive Model for Emergency Department Disposition. Appl. Sci. 2024, 14, 6623. [Google Scholar] [CrossRef]
  33. Feretzakis, G.; Karlis, G.; Loupelis, E.; Kalles, D.; Chatzikyriakou, R.; Trakas, N.; Karakou, E.; Sakagianni, A.; Tzelves, L.; Petropoulou, S.; et al. Using Machine Learning Techniques to Predict Hospital Admission at the Emergency Department. J. Crit. Care Med. 2022, 8, 107–116. [Google Scholar] [CrossRef]
  34. Jiang, H.; Mao, H.; Lu, H.; Lin, P.; Garry, W.; Lu, H.; Yang, G.; Rainer, T.H.; Chen, X. Machine learning-based models to support decision-making in emergency department triage for patients with suspected cardiovascular disease. Int. J. Med. Inform. 2021, 145, 104326. [Google Scholar] [CrossRef]
  35. Araouchi, Z.; Adda, M. TriageIntelli: AI-Assisted Multimodal Triage System for Health Centers. Procedia Comput. Sci. 2024, 251, 430–437. [Google Scholar] [CrossRef]
  36. Mebrahtu, T.F.; Skyrme, S.; Randell, R.; Keenan, A.-M.; Bloor, K.; Yang, H.; Andre, D.; Ledward, A.; King, H.; Thompson, C. Effects of computerised clinical decision support systems (CDSS) on nursing and allied health professional performance and patient outcomes: A systematic review of experimental and observational studies. BMJ Open 2021, 11, e053886. [Google Scholar] [CrossRef] [PubMed]
  37. Ahmed Abdalhalim, A.Z.; Nureldaim Ahmed, S.N.; Dawoud Ezzelarab, A.M.; Mustafa, M.; Ali Albasheer, M.G.; Abdelgadir Ahmed, R.E.; Galal Eldin Elsayed, M.B. Clinical Impact of Artificial Intelligence-Based Triage Systems in Emergency Departments: A Systematic Review. Cureus 2025, 17, e85667. [Google Scholar] [CrossRef] [PubMed]
  38. Stone, E.L. Clinical Decision Support Systems in the Emergency Department: Opportunities to Improve Triage Accuracy. J. Emerg. Nurs. 2019, 45, 220–222. [Google Scholar] [CrossRef] [PubMed]
  39. Alasmary, H. ScalableDigitalHealth (SDH): An IoT-Based Scalable Framework for Remote Patient Monitoring. Sensors 2024, 24, 1346. [Google Scholar] [CrossRef] [PubMed]
  40. Yew, H.T.; Wong, G.X.; Wong, F.; Mamat, M.; Chung, S.K. IoT-Based Patient Monitoring System. Int. J. Comp. Commun. Instrum. Engg. 2024, 4, 19–43. [Google Scholar] [CrossRef]
  41. MLX90614 family Single and Dual Zone Infra Red Thermometer in TO-39 Features and Benefits. 2013. Available online: https://www.alldatasheet.com/datasheet-pdf/pdf/859400/MAXIM/MAX30102.html (accessed on 1 July 2025).
  42. Akintade, O.O.; Yesufu, T.K.; Kehinde, L.O. Development of Power Consumption Models for ESP8266-Enabled Low-Cost IoT Monitoring Nodes. Adv. Internet Things 2019, 09, 1–14. [Google Scholar] [CrossRef]
  43. Jang, D.-H.; Cho, S. A 43.4μW photoplethysmogram-based heart-rate sensor using heart-beat-locked loop. In Proceedings of the 2018 IEEE International Solid-State Circuits Conference-(ISSCC), San Francisco, CA, USA, 11–15 February 2018; IEEE: New York, NY, USA, 2018; pp. 474–476. [Google Scholar] [CrossRef]
  44. Yu, L.; Zhou, R.; Chen, R.; Lai, K.K. Missing Data Preprocessing in Credit Classification: One-Hot Encoding or Imputation? Emerg. Mark. Financ. Trade 2022, 58, 472–482. [Google Scholar] [CrossRef]
  45. Pradipta, G.A.; Wardoyo, R.; Musdholifah, A.; Sanjaya, I.N.H.; Ismail, M. SMOTE for Handling Imbalanced Data Problem: A Review. In Proceedings of the 2021 Sixth International Conference on Informatics and Computing (ICIC), Jakarta, Indonesia, 3–4 November 2021; IEEE: New York, NY, USA, 2021; pp. 1–8. [Google Scholar] [CrossRef]
  46. Swana, E.F.; Doorsamy, W.; Bokoro, P. Tomek Link and SMOTE Approaches for Machine Fault Classification with an Imbalanced Dataset. Sensors 2022, 22, 3246. [Google Scholar] [CrossRef]
  47. Tuysuzoglu, G.; Dogan, Y.; Ozturk Kiyak, E.; Ersahin, M.; Ghasemkhani, B.; Ulas Birant, K.; Birant, D. Joint Tomek Links (JTL): An Innovative Approach to Noise Reduction for Enhanced Classification Performance. IEEE Access 2025, 13, 123059–123082. [Google Scholar] [CrossRef]
  48. Shadeed, G.A.; Tawfeeq, M.A.; Mahmoud, S.M. Deep learning model for thorax diseases detection. TELKOMNIKA (Telecommun. Comput. Electron. Control) 2020, 18, 441. [Google Scholar] [CrossRef]
  49. García-Valls, M.; Palomar-Cosín, E. An Evaluation Process for IoT Platforms in Time-Sensitive Domains. Sensors 2022, 22, 9501. [Google Scholar] [CrossRef]
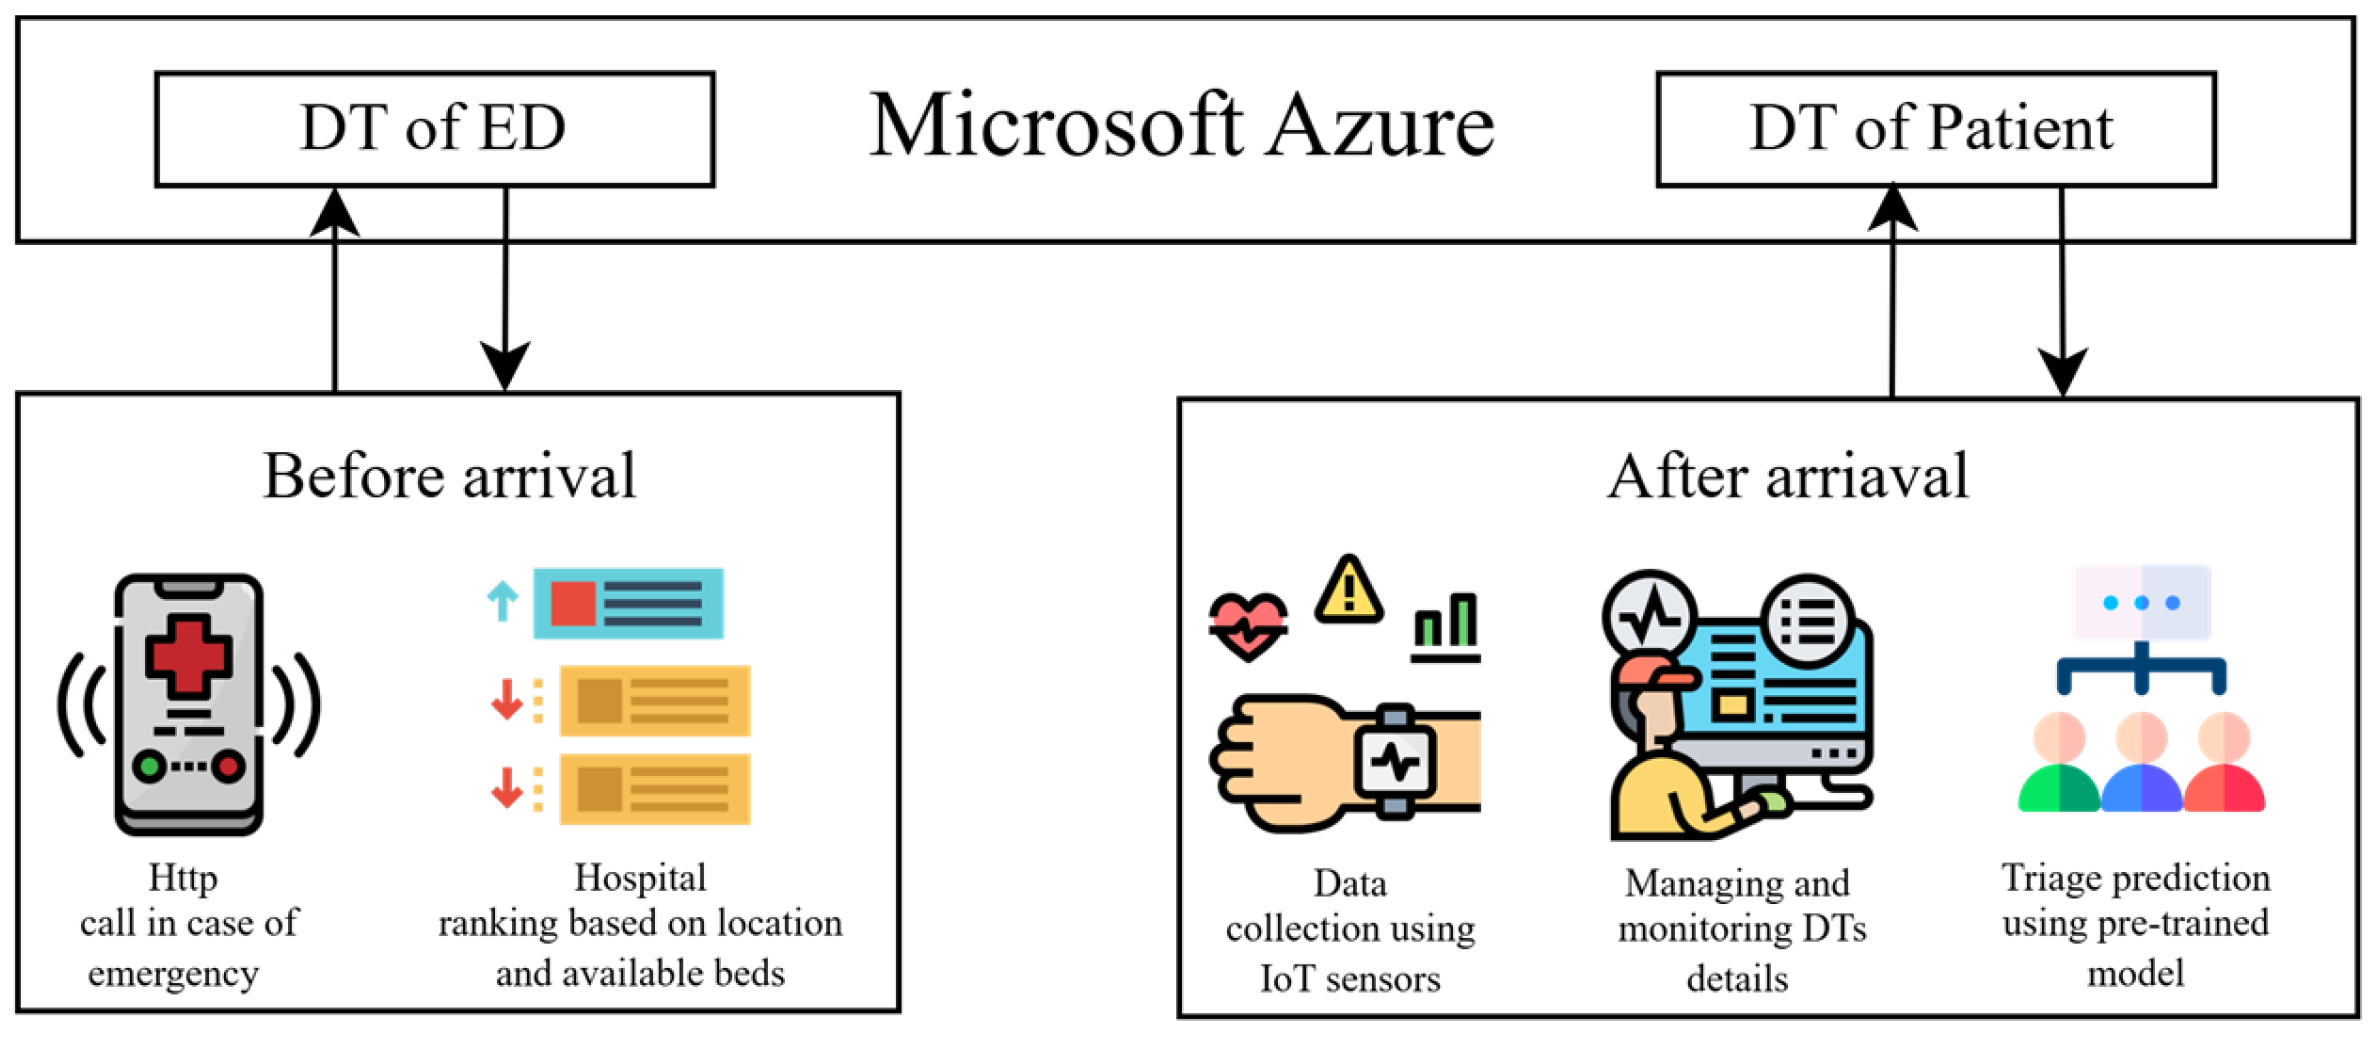
Figure 1. Proposed automated Triage prediction system based on IoT, AI, and DT models in Azure cloud framework.
Iot 06 00073 g001
Figure 2. Architecture of DT-based automated triage classification system.
Iot 06 00073 g002
Figure 3. Data transmission from sensors to DT: (a) sensor’s configuration; (b) message of HR sensor reading being sent to IoT Hub; (c) message received in Azure Function after an IoT message arrives, then the patient’s DT is updated.
Iot 06 00073 g003
Figure 4. A basic UI showing patient information and buttons to update properties, save records, and predict triage.
Iot 06 00073 g004
Figure 5. Classification Model Architecture.
Iot 06 00073 g005
Figure 6. An overview of feature selection model.
Iot 06 00073 g006
Figure 7. Classes distribution of the original dataset, after applying SMOTETomek, and after applying only SMOTE.
Iot 06 00073 g007
Figure 8. Confusion matrix for (a) Subsampled PFN and (b) Tree PFN classifiers.
Iot 06 00073 g008
Figure 9. ROC curve for (a) Subsampled PFN with average AUC as 96.62% and (b) Tree PFN with average AUC as 96.22%.
Iot 06 00073 g009
Figure 10. ROC comparison between baseline classifiers and the TabPFN classifier, showing superior discriminatory capability in both subsample and tree-based models.
Iot 06 00073 g010
Figure 11. Multiple configurations of the workflow. The blue boxes in this figure represent the operation of removing features that appeared only once. The orange boxes represent the feature selection optimization step, and the pink boxes represent the training step.
Iot 06 00073 g011
Figure 12. Reliability curve showing the relationship between predicted triage probabilities and actual triage outcomes for both RF(Tree) and subsample TabPFN. The near-diagonal alignment indicates that predicted probabilities closely match observed triage outcomes, demonstrating good model calibration.
Iot 06 00073 g012
Table 1. Features description of the selected features after preprocessing.
FeatureFeature Description
GroupED type [1 = local ED, 2 = reginal ED]
SexPatient's gender, 1 for male and 2 for female
AgePatient's age
Patients number per hourNumber of patients in each hour
Arrival mode1 for walking, 2 for public ambulance, 3 for private vehicle, 4 for private ambulance, and 5,6,7 for other
InjuryReason visit, 1 for No and 2 for Yes
Chief_complainThe patient's complaint
MentalMental state, 1 for alert, 2 for verbal response, 3 for pain response, and 4 for unresponsive
PainPatient has pain, 1 for Yes and 0 for No
NRS_painPatient pain based on nurses’ assessment [1–10]
SBPSystolic blood pressure in mmHg
DBPDiastolic blood pressure in mmHg
HRHeart rate in beats per minute (bpm)
RRRespiratory rate in breaths per minute (breaths/min)
BTBody temperature in °C
SaturationOxygen in blood
KTAS_expertTriage scale [1,2,3 = emergency, 4,5 = non-emergency]
Table 2. Comparison with standard classifiers.
MethodAccuracy %Recall %Precision %F1-Score %
DT57 ± 1.8757 ± 1.7857 ± 1.6457 ± 1.64
RF57 ± 1.9357 ± 1.5757 ± 1.8457 ± 1.66
XGBoost66 ± 2.3266 ± 1.867 ± 1.8965 ± 1.87
SVM54 ± 3.6954 ± 2.2256 ± 4.3951 ± 2.93
LR66 ± 2.6566 ± 2.6669 ± 2.7966 ± 2.77
KNN60 ± 2.7360 ± 3.3563 ± 3.9357 ± 3.58
NB28 ± 6.0328 ± 5.4555 ± 3.9331 ± 3.58
Stacked model [35]80.0573.2680.2774.41
Subsampled PFN85.88 ± 2.4286 ± 2.2286 ± 2.4186 ± 2.28
Tree PFN84.97 ± 2.1285 ± 1.8685 ± 285 ± 1.97
Table 3. Comparison between models with different configurations with SMOT only and SMOTE and Tomek.
ConfigurationClassifierAccuracy %Recall %Precession %F1-Score %
Preprocessing
only
Subsampled PFN70.8 ± 2.2871 ± 4.8574 ± 9.7370 ± 4.58
Tree PFN70.8 ± 1.6771 ± 3.1172 ± 6.5770 ± 2.29
Without data
balancing
Subsampled PFN71.2 ± 2.1371 ± 3.1873 ± 7.7370 ± 2.48
Tree PFN71.6 ± 3.3572 ± 3.2571 ± 9.870 ± 2.81
SMOTE only
Model 1Subsampled PFN83.26 ± 1.4284 ± 1.4583 ± 1.4383 ± 1.45
Tree PFN79.55 ± 0.8780 ± 0.8680 ± 0.7179 ± 0.77
Model 2Subsampled PFN84.09 ± 1.1785 ± 1.2484 ± 1.1684 ± 1.21
Tree PFN81.40 ± 0.8282 ± 0.9481 ± 0.9181 ± 0.95
Model 3Subsampled PFN84.09 ± 1.4885 ± 1.5784 ± 1.5484 ± 157
Tree PFN80.58 ± 1.681 ± 1.6581 ± 1.7981 ± 1.72
without LEOSubsampled PFN82.23 ± 1.5282 ± 1.4682 ± 1.6382 ± 1.56
Tree PFN79.13 ± 1.2179 ± 1.1479 ± 1.2879 ± 1.18
SMOTE and Tomek
Model 4Subsampled PFN84.51 ± 1.9484 ± 1.5385 ± 1.7284 ± 1.66
Tree PFN84.28 ± 1.6784 ± 1.3584 ± 1.4584 ± 1.48
Model 5Subsampled PFN84.97 ± 1.985 ± 1.4185 ± 1.5185 ± 1.48
Tree PFN84.28 ± 1.6984 ± 1.2984 ± 1.5284 ± 1.43
Model 6Subsampled PFN85.88 ± 2.4286 ± 2.2286 ± 2.4186 ± 2.28
Tree PFN84.97 ± 2.1285 ± 1.8685 ± 285 ± 1.97
without LEOSubsampled PFN80.87 ± 1.9481 ± 1.4681 ± 1.5981 ± 1.51
Tree PFN78.59 ± 2.0578 ± 2.1279 ± 2.2178 ± 2.29
Disclaimer/Publisher’s Note: The statements, opinions and data contained in all publications are solely those of the individual author(s) and contributor(s) and not of MDPI and/or the editor(s). MDPI and/or the editor(s) disclaim responsibility for any injury to people or property resulting from any ideas, methods, instructions or products referred to in the content.