Article

Case-Based Data Quality Management for IoT Logs: A Case Study Focusing on Detection of Data Quality Issues

by
Alexander Schultheis
1,2,*,
Yannis Bertrand
3,
Joscha Grüger
1,2,
Lukas Malburg
1,2,
Ralph Bergmann
1,2 and
Estefanía Serral Asensio
4
1
German Research Center for Artificial Intelligence (DFKI), Branch Trier University, 54296 Trier, Germany
2
Artificial Intelligence and Intelligent Information Systems, Trier University, 54296 Trier, Germany
3
Department of Business Informatics and Operations Management, Faculty of Economics and Business Administration, Ghent University, 9000-9052 Ghent, Belgium
4
Research Centre for Information Systems Engineering (LIRIS), KU Leuven, Warmoesberg 26, 1000 Brussels, Belgium
*
Author to whom correspondence should be addressed.
IoT 2025, 6(4), 63; https://doi.org/10.3390/iot6040063 (registering DOI)
Submission received: 3 July 2025 / Revised: 10 September 2025 / Accepted: 12 September 2025 / Published: 23 October 2025

Abstract

Smart manufacturing applications increasingly rely on time-series data from Industrial IoT sensors, yet these data streams often contain data quality issues (DQIs) that affect analysis and disrupt production. While traditional Machine Learning methods are difficult to apply due to the small amount of data available, the knowledge-based approach of Case-Based Reasoning (CBR) offers a way to reuse previously gained experience. We introduce the first end-to-end Case-Based Reasoning (CBR) framework that both detects and remedies DQIs in near real time, even when only a handful of annotated fault instances are available. Our solution encodes expert experience in the four CBR knowledge containers: (i) a vocabulary that represents sensor streams and their context in the DataStream format; (ii) a case base populated with fault-annotated event logs; (iii) tailored similarity measures—including a weighted Dynamic Time Warping variant and structure-aware list mapping—that isolate the signatures of missing-value, missing-sensor, and time-shift errors; and (iv) lightweight adaptation rules that recommend concrete repair actions or, where appropriate, invoke automated imputation and alignment routines. A case study is used to examine and present the suitability of the approach for a specific application domain. Although the case study demonstrates only limited capabilities in identifying Data Quality Issues (DQIs), we aim to support transparent evaluation and future research by publishing (1) a prototype of the Case-Based Reasoning (CBR) system and (2) a publicly accessible, meticulously annotated sensor-log benchmark. Together, these resources provide a reproducible baseline and a modular foundation for advancing similarity metrics, expanding the DQI taxonomy, and enabling knowledge-intensive reasoning in IoT data quality management.

1. Introduction

With the advent of the Internet of Things (IoT) industrial context [1], more companies are equipping their production processes with sensors and actuators, thus realizing the Smart Manufacturing paradigm [2]. This enables benefits such as more precise control of the process, a more profound understanding of how the process works, and the identification of process improvements (e.g., for the use case of Predictive Maintenance (PredM) [3,4]). Since the accuracy of advanced control and optimization algorithms is directly proportional to data quality, these benefits are highly dependent on the analysis of sensor data, which is known to suffer from many Data Quality Issues (DQIs), such as missing data due to faulty sensors or noise due to difficult environmental conditions [5,6,7]. Failing to detect issues in the process due to, e.g., missing data can lead to process execution errors (such as defects or disasters) and incorrect process analysis (leading to inefficiencies and delays). For this reason, DQIs must be identified and resolved before data analysis can be performed. This has to be carried out before higher-level events are abstracted from the sensor data, which form the basis for Artificial Intelligence (AI) analysis and Process Mining (PM) [8,9,10].
Previous research [11] identifies various challenges for DQIs that can be investigated using AI methods. Conventional approaches typically focus either on the detection of sensor DQIs, i.e., by using anomaly and outlier detection with isolation forests [12], local outlier factor [13], or Artificial Neural Networks (ANNs) [14]), or on handling and solving them, i.e., imputation methods such as spline fitting, association rule mining [15], or data smoothing to remove noise. In addition, Teh et al. [6] mention methods to detect and solve DQIs simultaneously, such as principal component analysis [16] and ANNss [17]. However, such techniques are data-intensive, and for the domains where DQIs usually occur, few error data are available, as these have to be recognized and processed mostly manually [18]. It is often not possible to train suitable Machine Learning (ML) models [19] on such small databases. Therefore, instead of a data-driven AI method, the usage of a knowledge-driven approach is suitable that does not attempt generalization based on limited data but instead directly reuses experience [20]. An established AI method for reusing the collected experience is Case-Based Reasoning (CBR) [21,22].
To bridge this gap, we propose an end-to-end framework for the detection and handling of DQIs in sensors based on CBR in this paper. This framework enables the automation of these two steps by reusing the already accumulated experience knowledge. The retrieved cases encapsulate prior experience, explicitly describing the fault source, thus containing a certain explanation in themselves [23]. Another advantage of using CBR is its interactive nature, which keeps human experts in the loop [24], who therefore remain responsible for the decision based on the results of the CBR application. In DQI management, this human role is particularly important for solving and evaluating. The applicability of this framework is evaluated based on a case study. In this paper, we refer to a case study as a small-scale, preliminary evaluation that checks whether the proposed CBR approach can be applied in practice and reveals potential issues before a full study is conducted.
The remainder of this paper is structured as follows. First, Section 2 presents relevant background for this work, focusing on IoT-enhanced Business Process Management (BPM), DQIs, and CBR. Then, in Section 3, related work is introduced. Section 4 outlines the design of a CBR solution for DQI detection and resolution in IoT. The overall approach is presented and then introduced in more detail following the CBR knowledge containers [25]. Building upon this, Section 5 validates the approach in a feasibility test based on a Smart Manufacturing scenario. Finally, Section 6 concludes the paper and outlines future work.

2. Foundations

This section presents the background required for this work. In Section 2.1, the Industrial IoT is introduced and positioned within process management and BPM. Subsequently, DQIs that occur in IoT data from such environments are presented in Section 2.2. The patterns and methods for recognizing these DQIs are presented in Section 2.3. Finally, CBR is introduced in Section 2.4 and the particularly relevant subfield of Temporal Case-Based Reasoning (TCBR) in Section 2.5 as the preferred solution method in this paper, and its use for this area of application is justified.

2.1. Industrial IoT for Business Process Management

The IoT can be defined as a “[g]roup of infrastructures interconnecting connected objects and allowing their management, data mining and the access to the data they generate” [26]. Building on this interconnected infrastructure, Smart Manufacturing, realized through the Industrial Internet of Things (IIoT), leverages this connectivity to integrate shop floor data with enterprise-level decision-making [2]. In this context, the concept of a smart factory acts as a manufacturing solution that provides flexible and adaptive production processes that will solve problems arising in a production facility with dynamic and rapidly changing boundary conditions [27]. Typical hardware components of smart factories comprise sensors and actuators that are composed of more complex devices, machines, and stations of a production line [28]. These components represent key sources of sensor data, which are fundamental to IIoT applications. Importantly, the data generated often take the form of time series, capturing continuous measurements that reflect the dynamic state of production processes within smart factories.
Besides the application domain, the following characteristics of the IIoT can be determined following Boyes et al. [29] in comparison with consumer-oriented IoT setups:
(1)
The IIoT typically focuses on large, complex assets such as machines or production lines.
(2)
IIoT systems can perform autonomous adaptation of system behavior without human intervention.
(3)
IIoT systems enable real-time monitoring of the operational processes they support.
(4)
The IIoT enables the explicit pursuit of economic value, e.g., higher productivity or lower energy consumption.
These properties make high-quality sensor data indispensable because autonomous control loops and real-time optimization leave little room for manual cleaning. Such requirements for data quality are particularly relevant for several application goals of the IIoT, including real-time condition monitoring, PredM, quality management, and worker safety [30].
In this context, many of the benefits of the IoT are realized by supporting and analyzing production processes using IoT-enhanced BPM. IoT-enhanced BPM is the field of research that investigates the integration of IoT technologies with traditional BPM and process control systems, with the aim of enhancing process automation, flexibility, and overall performance [31]. Research in the field spans dedicated modeling languages (see, e.g., Schultheis et al. [32] for an overview and analysis of requirements), middleware linking shop floor signals with manufacturing-execution systems, and analytics techniques that exploit sensor streams during and after process execution. Recent examples that illustrate the momentum of IoT-aware process analytics are, e.g., Scheibel and Rinderle-Ma [33], Rodríguez-Fernández et al. [34], Ehrendorfer et al. [35].
In a manufacturing context, Scheibel and Rinderle-Ma [33] outline an approach to derive decision rule patterns from time series sensor data by automatically featuring the sensor data and training a decision tree to learn the rules. A different problem is addressed by Rodríguez-Fernández et al. [34], who present an approach for IoT-enhanced deviation detection. They argue that traditional conformance checking cannot consider data that change over time independently of the events of the process (i.e., time series data). Subsequently, they proposed a method to detect patterns in the time-series data directly. Finally, a first contribution toward IoT-enhanced process outcome prediction is presented by Ehrendorfer et al. [35]. They propose a classification of context data types and their integration with process models to enable runtime assessment of context data’s impact on process outcomes through stage-based segmentation and gradual refinement.

2.2. Data Quality Issues in the Industrial IoT

The field of data quality in IoT systems encompasses a wide range of aspects, including the identification of issues related to data quality in IoT systems and the implementation of cleansing methods [5,6,36]. In IoT applications, sensors are often exposed to extreme environmental conditions, constrained computational and energy resources, intermittent connectivity, and mechanical wear, all of which may induce errors such as calibration drift, packet loss, or complete device failure [6]. As a consequence, IoT sensors may experience reduced accuracy, calibration loss, sensor failures, improper device placement, range limitations, and data packet loss, leading to various types of errors in the generated data and complicating further analysis. As a result, these sensor-related faults contribute to the occurrence of various types of failures in the generated data, thereby complicating subsequent analysis. Moreover, although previous research has focused a lot on manufacturing settings, Figure 1 shows that data quality is a concern in all types of IoT environments.
In their study, Teh et al. [6] conducted a comprehensive review of the sensor data quality literature, identifying a range of failure types in descending order of occurrence: outliers, missing data, bias, drift, noise, constant value, uncertainty, and stuck-at-zero. If these errors remain unaddressed, they can lead to the generation of inaccurate data, rendering subsequent analyses unreliable and ultimately leading to erroneous decision-making. Complementary taxonomies further delineate DQIs into categories such as missing, incorrect, imprecise, and irrelevant data, as proposed by Bose et al. [37]. Verhulst [38] explores additional aspects of DQIs within a taxonomy, including the completeness and accuracy of time series in event logs. Neglecting these errors results in flawed data, which can lead to unreliable analyses and ultimately erroneous decisions [36]. To prevent misguided decision-making, it is important to assess the underlying data quality. To quantify these dimensions, Kuemper et al. [39] introduced measures for sensor data quality: completeness, timeliness, plausibility, artificiality, and concordance.

2.3. Patterns of Data Quality Issues in Business Process Management

In BPM, so-called PM relies on an event log that records all events occurring within the process under analysis over a specific time period [40]. To perform PM, each recorded event must contain at a minimum the following elements: a label describing the activity that was carried out, a case ID to identify the process instance each event is associated with, and a timestamp marking when the event occurred. DQIs in PM primarily concern errors, inconsistencies, and missing information within event logs. Bose et al. [37] suggest categorizing these issues along two dimensions: the type of problem (such as incorrect, irrelevant, imprecise, or missing data) and the specific event log entity affected (including cases, events, event–case relationships, case attributes, positions, activity names, timestamps, resources, and event attributes). The authors argue that issues related to events, timestamps, and activity names are particularly critical and thus warrant a more detailed examination. Suriadi et al. [41] expanded on this framework by identifying eleven event log quality issues, presented as imperfection patterns. For each pattern, they outline a typical cause, provide an example, and establish a connection to a corresponding quality issue described by Bose et al. [37] to address the issue.
Although virtually all previous research applying BPM with IoT data had to tackle DQIs, the existing body of literature specifically addressing IoT DQIs in BPM is still scarce. Bertrand et al. [36] reviewed the IoT-BPM literature to describe the IoT DQIs and the event log DQIs encountered by previous research. The results indicate that the most often reported DQIs, i.e., noise, outliers, and missing data, correspond to the most often reported issues in IoT in general by Teh et al. [6]. Based on this state of affairs, patterns relating IoT DQIs with the resulting event log DQIs are derived. More specifically, these patterns are of the shape:
Sensor   Fault     Sensor   DQI Event   Log   DQI ( s ) .
For example, one of the patterns describes the following:
Unstable   Environment     Noisy   Sensor   Data Incorrect   Case   ID .
One concrete example of the occurrence of this pattern in the literature is in Brzychczy and Trzcionkowska [42], which derived event logs from sensors attached to a drilling machine in a mine. Unfortunately, the sensors produced noisy data, making it difficult to recognize the start and end activities of the mining process and resulting in some incorrect case IDs in the log derived from the sensor data.

2.4. Case-Based Reasoning

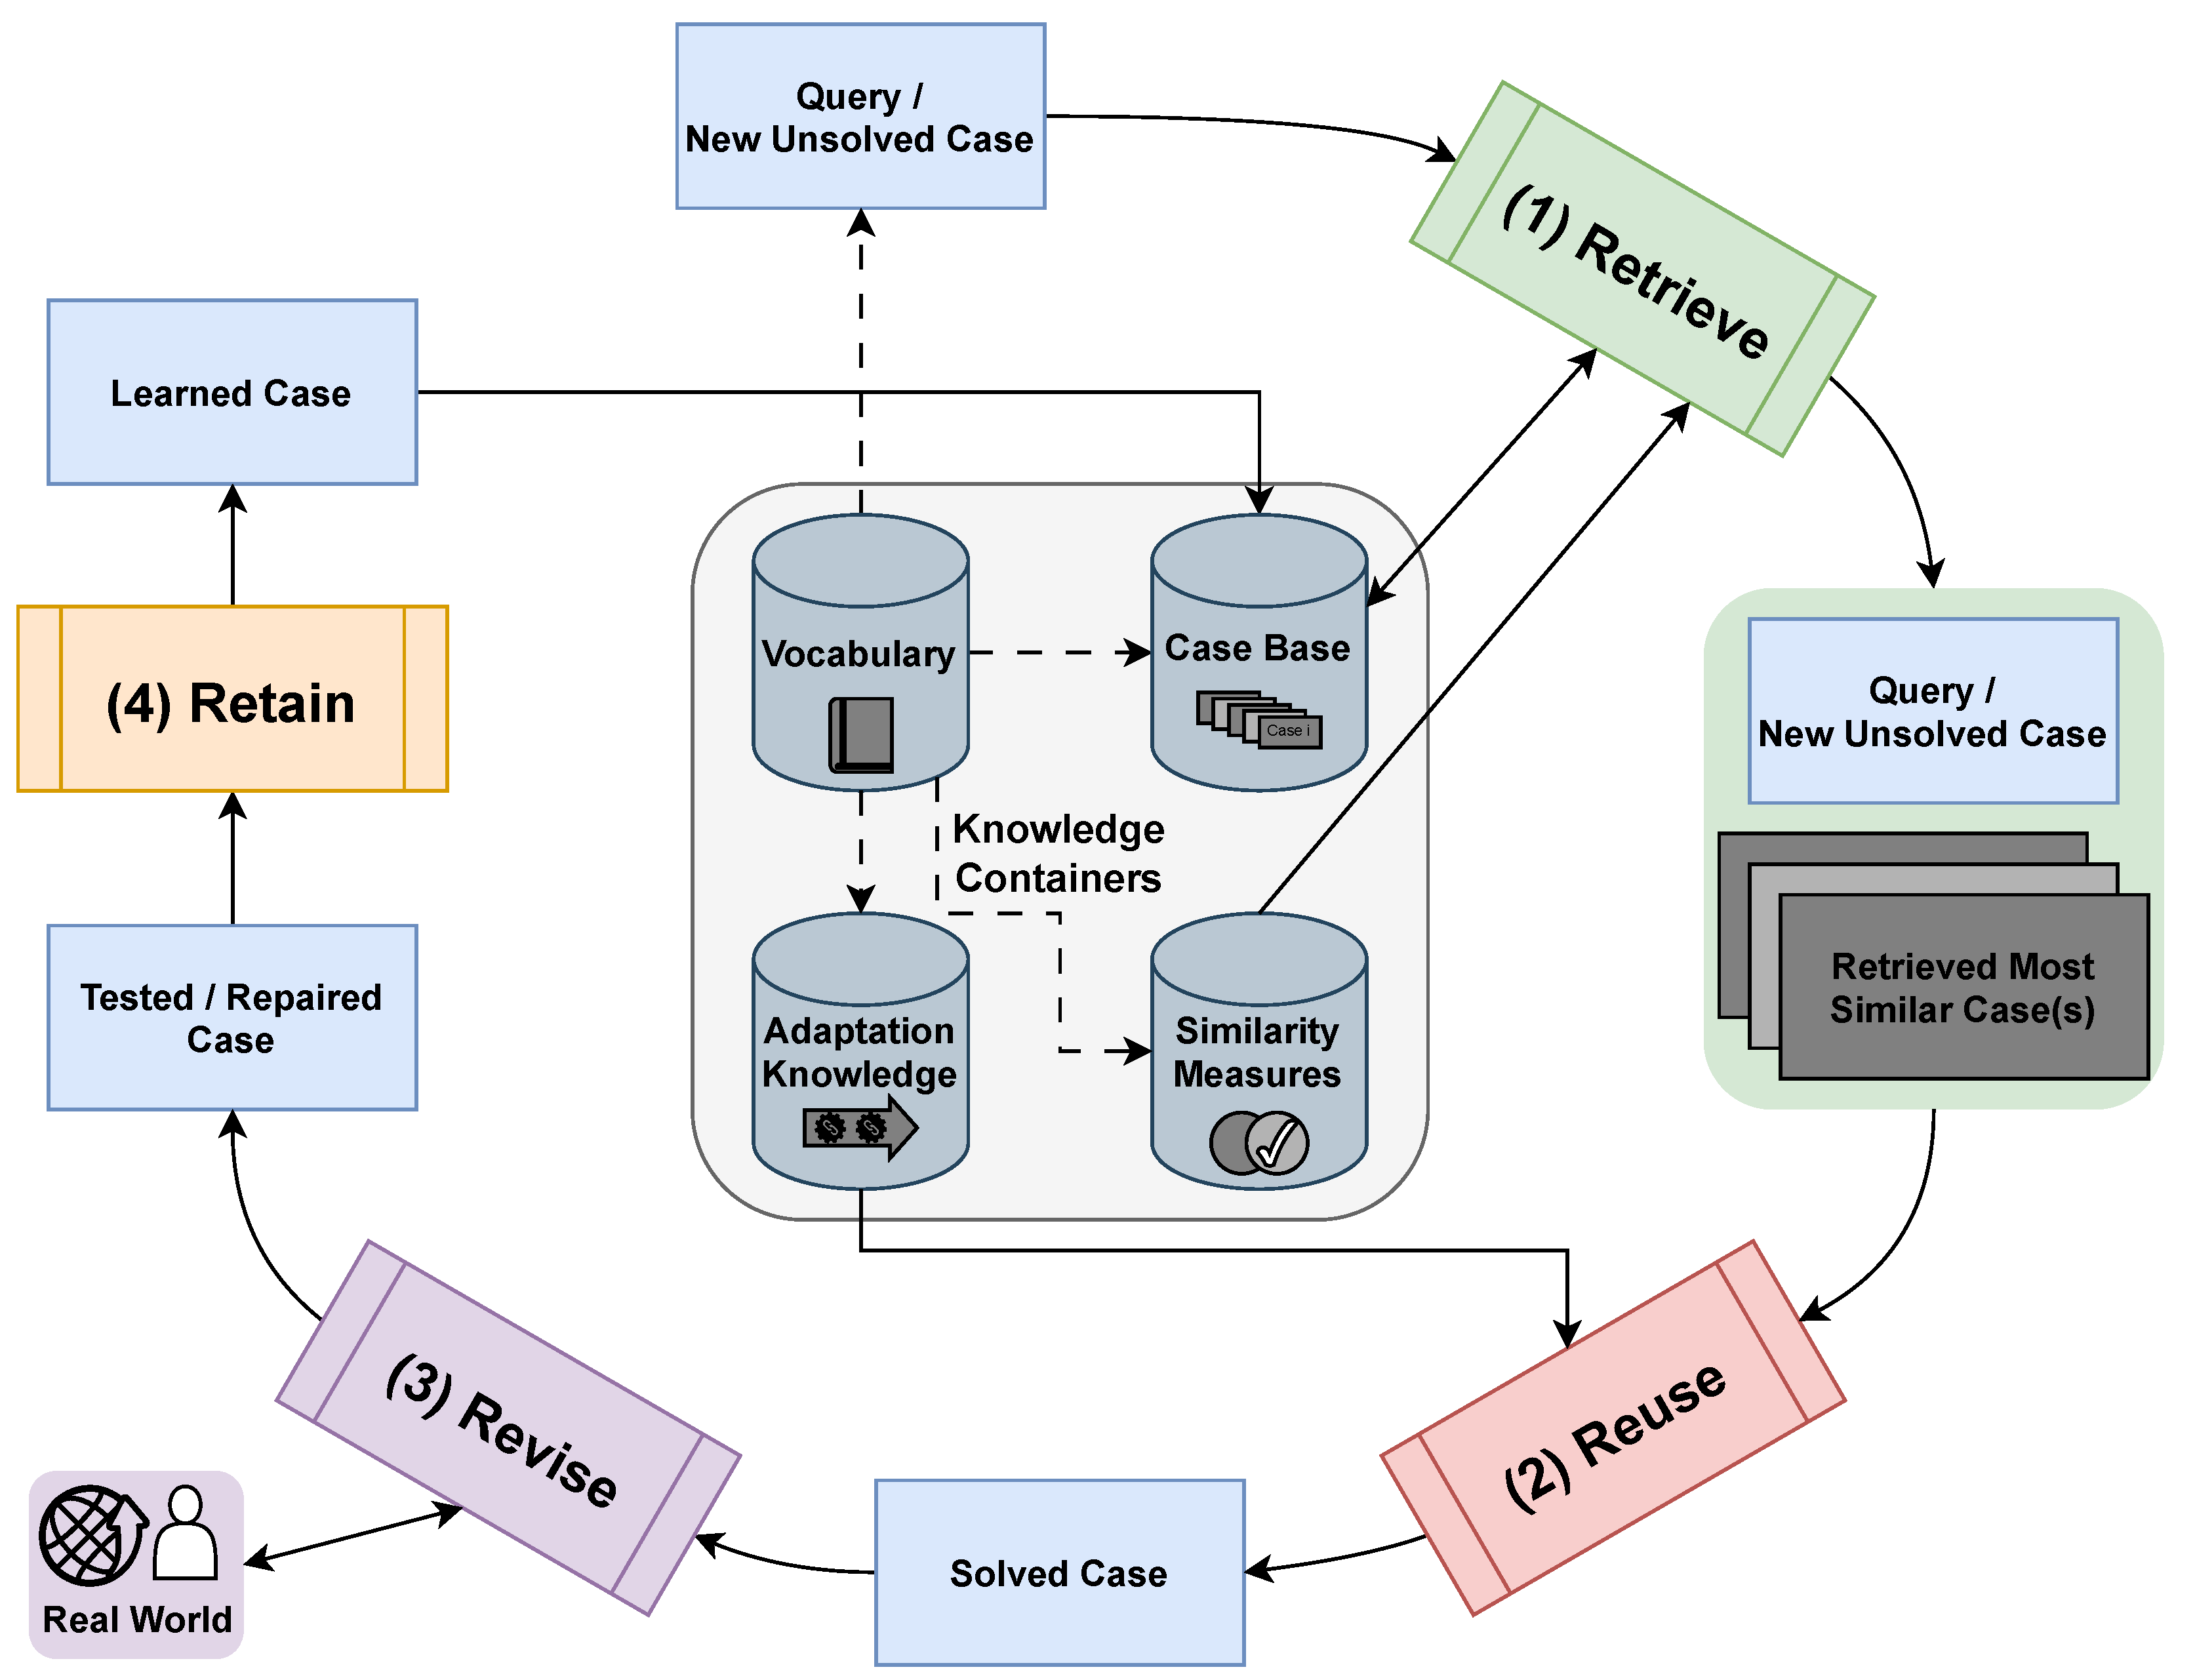
CBR [21] is an AI methodology [43] for problem-solving, assuming that similar problems have similar solutions and, thus, that solutions from previous experienced situations (also called cases) can be reused in current ones [21,44]. The core concept here is so-called similarity, which describes how suitable a stored problem is for a new problem. The knowledge required to apply CBR is managed in four different containers [25]. The cases are stored and organized in the case base. Their structure is defined by the vocabulary as a separate container. Methods for determining similarities are specified using the similarity measures container, as well as methods for adapting cases to new problems as the adaptation knowledge container. The CBR methodology follows the sequential steps described in the CBR cycle [21], illustrated and connected to the knowledge containers in Figure 2. At the beginning, a retrieval ( 1 ) is performed, in which the knowledge stored in the case base is retrieved using similarity measures to determine suitable cases for a new problem. Based on the most similar cases, their solutions are reused in the reuse phase ( 2 ) and, if necessary, adapted to the new problem. On this basis, a new solution is suggested, which is evaluated for its suitability for the new problem in the revise phase ( 3 ) and, if necessary, returned to the previous phases. A suitable solution is combined with the problem to form a new case and added to the case base in the retain phase ( 4 ) . In this way, a CBR system learns continuously.
In contrast to AI techniques that are based on data-driven ML methods, such as Deep Neural Networks, CBR can also be used if only small amounts of data are available. Utilizing the CBR methodology leads to a self-learning approach without requiring explicit retraining, as needed for neural networks. For this purpose, the CBR methodology is especially suitable for application scenarios in which only a few data or, more precisely, experienced situations are available, such as for DQIs in BPM. In IoT environments, it is typically the case that the data produced by sensors is in good condition and only a few experienced situations with patterns of DQIs are available, making the sole use of data-driven techniques less advantageous. In addition, finding DQIs in IoT sensor data or during process execution in BPM is a laborious task, mostly performed manually. This in turn requires in-depth knowledge by experts, whose knowledge can then be captured and stored in the form of cases representing this experiential knowledge in CBR.

2.5. Temporal Case-Based Reasoning

TCBR [45,46] deals with the representation of temporal relationships in cases and their management within the CBR methodology. Cases in TCBR are based on sequences of certain attributes related to the time dimension and consist of several attributes representing the measured sensor values and a corresponding solution, for example, a classification or a recommendation. Various forms of case representation are used to populate the vocabulary and, based on this, to fill the case base [47]. TCBR is used in various applications such as classification and error detection, prediction, or medicine [47]. In each use case, the underlying data is complex, resulting in challenges in filling the knowledge containers [25]. The application of TCBR requires the definition of a suitable vocabulary to model sensor data and the selection of suitable similarity measures to enable the correct reuse of experiential knowledge.
Although there are methods such as episodes, graphs, or event sequences, time series are the most widely used form of representation in TCBR [47]. In addition, the IoT data generated during production can be processed directly. In most CBR applications, time series data are represented symbolically and summarized as feature vectors. Simplified forms of representation, such as temporal abstraction [48], can be used to reduce the volume of the data. These methods abstract time series to a higher level by aggregating data points, thus reducing computational complexity. However, this abstraction results in a loss of information, which may be inappropriate for certain applications, especially DQI [49]. Typically, a case representing IoT sensor data contains one or more time series [47], which are local attributes aggregated into a higher-level case.
To identify similar time series, appropriate similarity measures must be defined based on the chosen vocabulary [47]. Table 1 provides a classification of similarity measures, focusing on syntactic comparison of time series. These measures do not incorporate domain knowledge, making them knowledge-poor [50]. In contrast, there are also knowledge-intensive similarity measures that consider not only the syntax but also the semantics of the time series (e.g., as shown by Nakanishi et al. [51]). However, such semantic similarity measures for time series have not yet been utilized in TCBR. The categorization of similarity measures follows the local–global principle [22] (pp. 106–107), where the similarities of individual attribute values are computed and then aggregated into a global similarity score. At the local level, similarity measures focus on the specific point in time and its corresponding value. These measures can be either knowledge-poor or -intensive, like the global measures, depending on the particular use case. Since multiple time series may be available for most sensor data cases, the similarity scores between these time series can be combined at a global level, yielding a single overall similarity value. Additionally, the concept of a knowledge container for adaptation is explored within the TCBR framework [52]. However, since no complex adaptation algorithms are required for the approach in this paper, it will not be further discussed here. The relevant approach is the null adaptation, which simply transfers the attribute or attributes proposed as the solution in the CBR without any modification. If the adaptation is not to be based solely on the most similar case, it can be extended through methods such as voting. One such method is Majority Voting, where the solution is determined by the absolute majority of the most similar cases selected.

3. Related Work

This chapter presents related work, focusing on approaches for data quality management. Here, Section 3.1 starts with an overview of more generic approaches to data quality management found in the IoT data processing literature, before going more in depth in Section 3.2 over a limited number of recent approaches dedicated to data quality management in the context of IoT BPs.

3.1. Data Quality Management for IoT Systems

Although IoT data quality is acknowledged as a problem in IoT-enhanced BPM [11,31,36], there is little literature proposing methods to address data quality in this context. However, the broader IoT data processing literature has paid much attention to data quality. Zhang et al. [55] reviewed approaches to data quality management applied to the IoT. In their paper [55], first cover general-purpose data quality management frameworks that can be applied to IoT use cases, most of them being derived from two seminal approaches. First is the Total Data Quality Management (TDQM) cycle, which comprises four main steps: defining, measuring, analyzing, and enhancing data [56,57]. Second is the related Total Information Quality Management (TIQM) cycle, which focuses on three main steps: evaluation, improvement, and improvement management and monitoring [58].
Next to these general-purpose data quality management frameworks, some dedicated approaches for IoT data quality management have been proposed. They are typically less self-contained than the general-purpose approaches, possibly due to the relative recency of the IoT research domain and the complexity and versatility of IoT use cases, making it difficult to devise comprehensive frameworks. Among them, Geisler et al. [59] developed an IoT data quality management framework based on TDQM, which utilizes an ontology of DQIs to evaluate and monitor the data quality of data streams. Then, Perez-Castillo et al. [60] proposed a data quality management framework for sensor networks, structured along the steps of the plan–do–check–act cycle [61]. The same authors also present a set of best practices for IoT data quality in [62]. Next to these, Chakraborty et al. [63] introduces a privacy-preserving, automated framework to assess the quality of time series IoT sensor data in smart city contexts, using six objective metrics based on standard data quality dimensions. Operating within a zero-trust architecture and secure enclaves, the system identifies common data issues without human input, though it lacks error explanations and corrective strategies and may struggle with sparse anomalies in long time series. Finally, Kim et al. [64] proposed adapting the Data Quality Management Process Reference Model to the specificities of IoT scenarios in five steps:
(1)
Identify target profiles to manage sensor data faults;
(2)
Monitor the conditions of connected products and detect abnormal conditions;
(3)
Identify sensor data faults;
(4)
Determine the causes of the identified sensor data faults; and
(5)
Remove the determined causes.
For a recent, in-depth discussion of these approaches, we redirect the reader to Zhang et al. [55]. However, these frameworks typically only take in limited input from the users and, as mentioned earlier, the IoT-specific frameworks are usually ad hoc and focus on particular tasks of data quality management.

3.2. Approaches for Data Quality Management in IoT Business Process Management

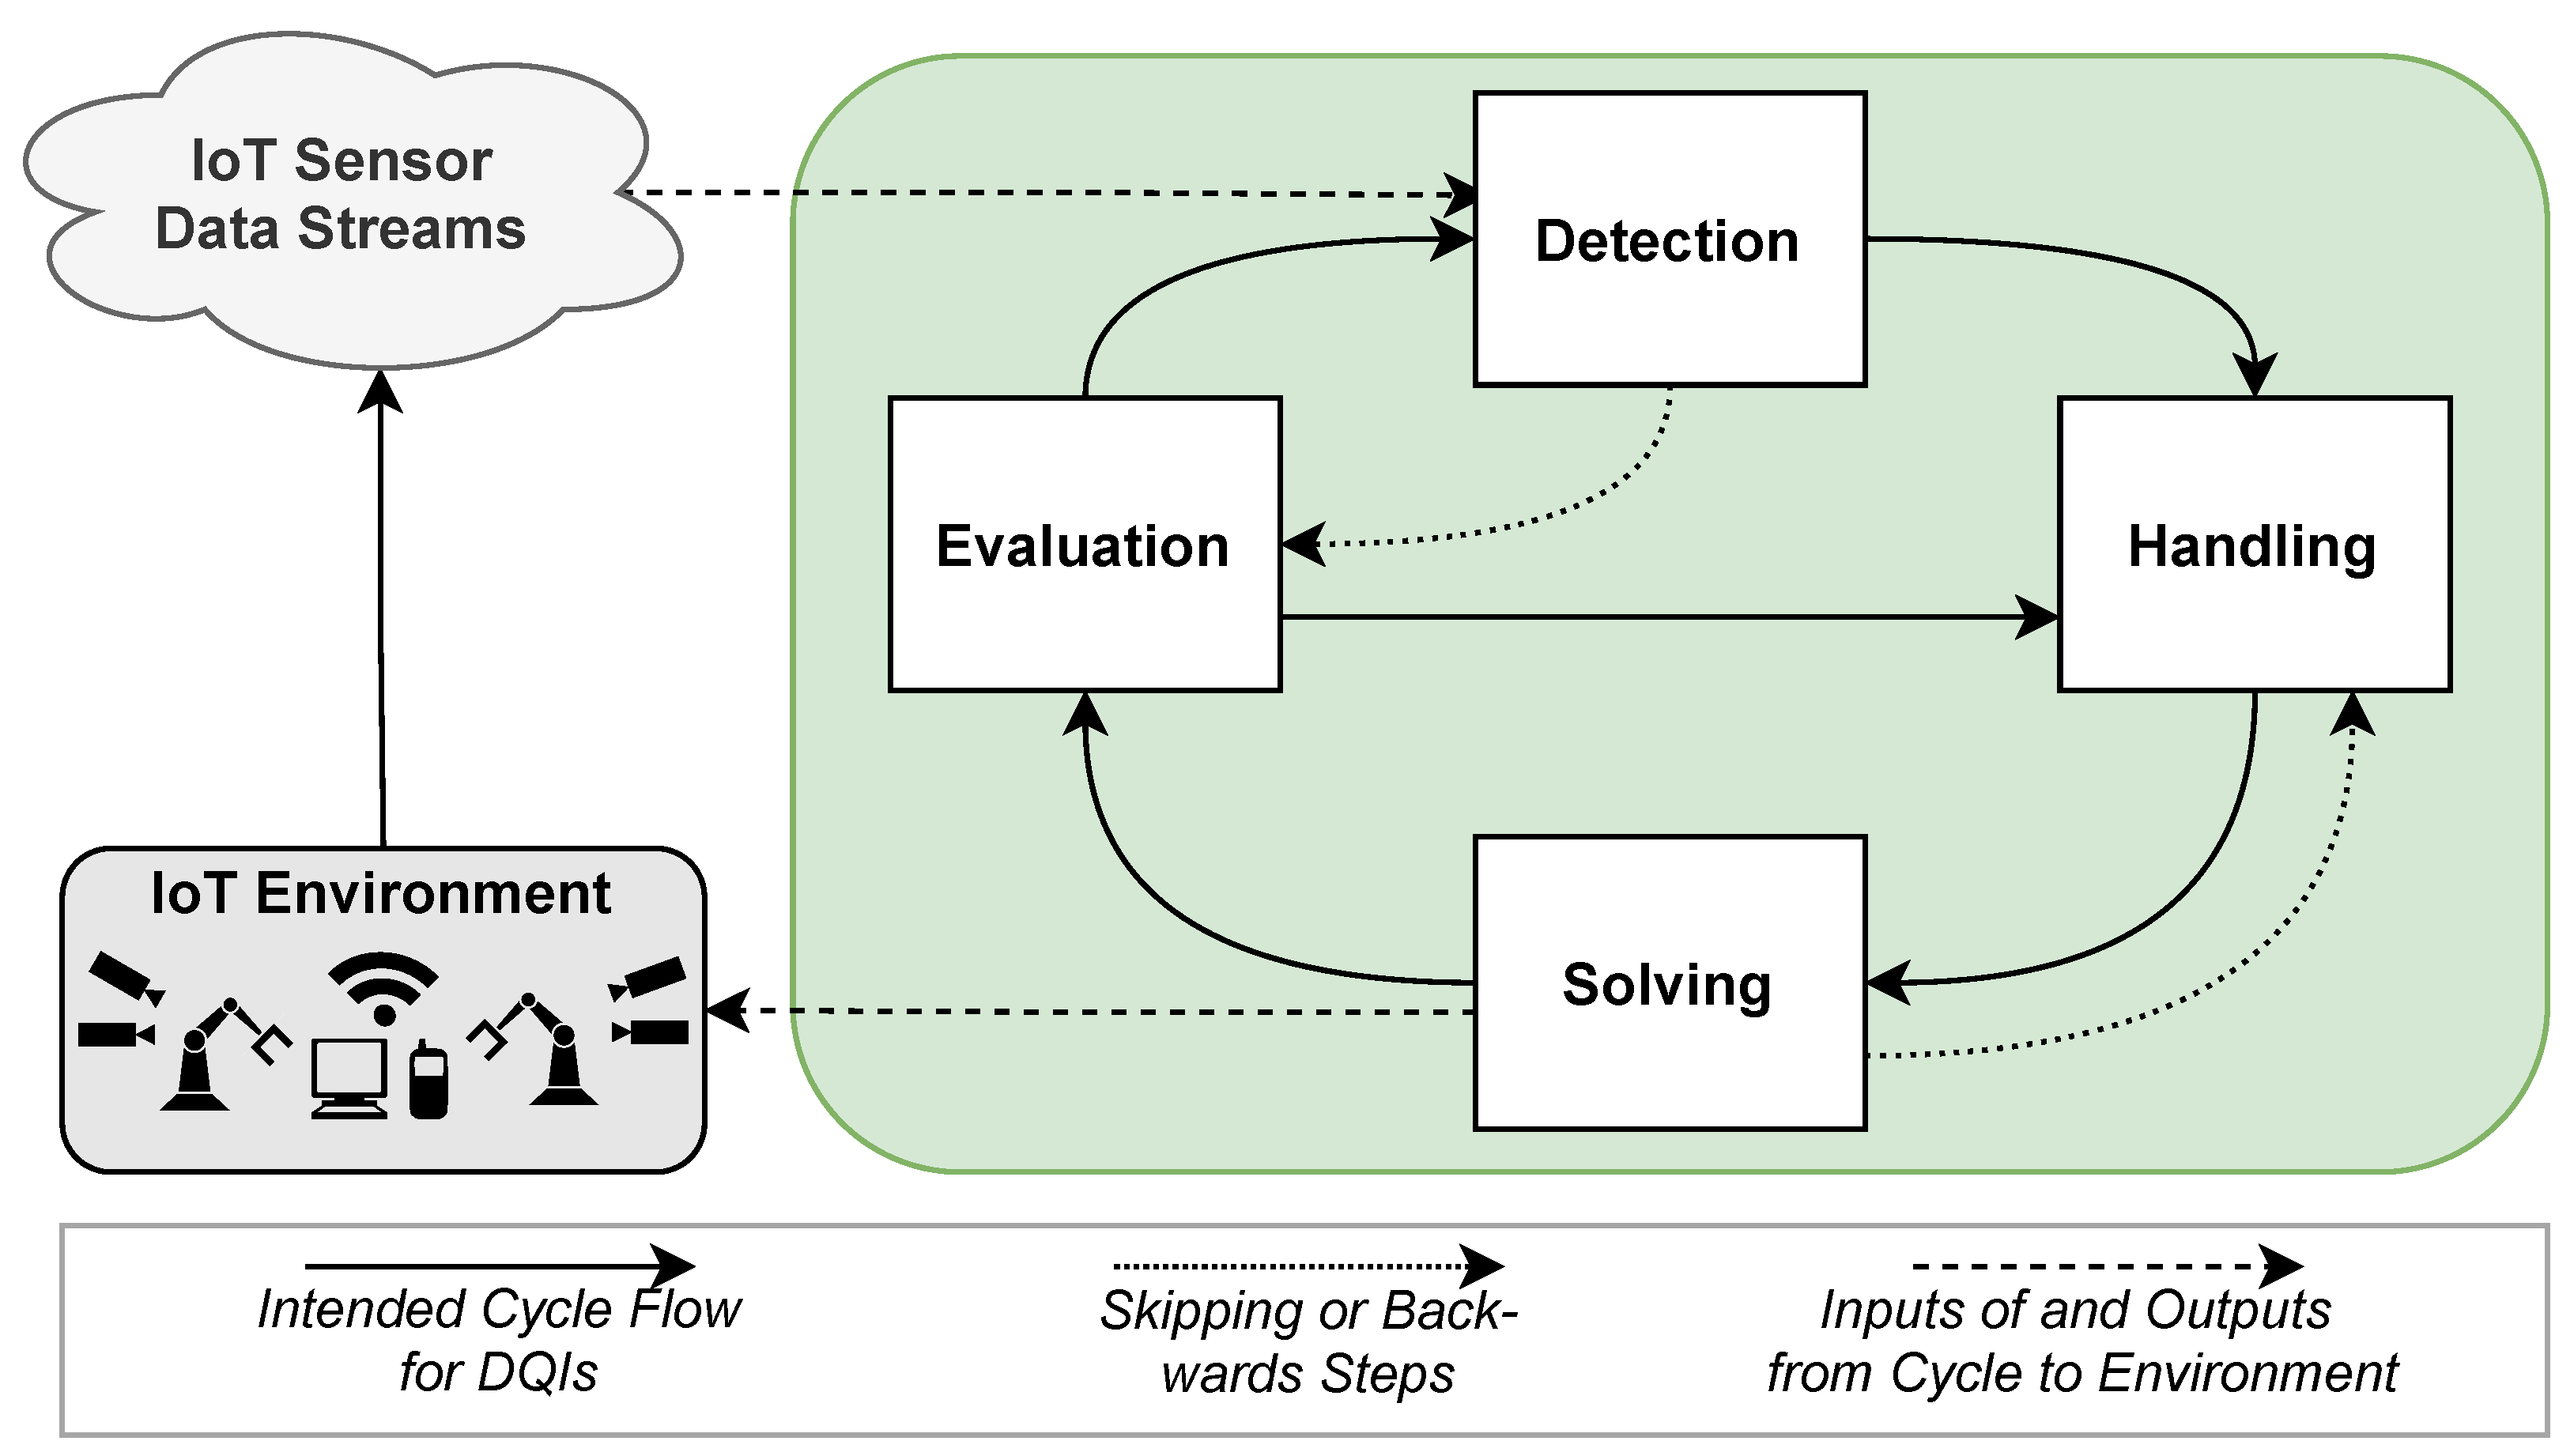
A newer, more abstract cycle view—the Data Quality Management Cycle (DQMC)—was introduced by Bertrand et al. [11]. They identified a framework for data quality management comprising four steps, depicted in Figure 3: detection, handling, solving, and evaluation. In the remainder of this section, we discuss each of these steps in more detail.
1.
The Detection phase involves monitoring incoming sensor data to identify and classify potential DQIs. This step can use techniques for DQI detection mentioned earlier, such as local outlier factor [13] or isolation forests [12]. When issues are detected, the data is forwarded to the handling phase for further processing.
2.
In the Handling phase, action recommendations are developed based on the previously classified DQIs. These recommendations aim to address both the underlying hardware components causing the issues and the necessary event log cleaning procedures, such as smoothing for denoising.
3.
The Solving phase prioritizes and schedules the recommended actions through a process that identifies duplications and interdependencies [65]. Implementation may occur automatically, semi-automatically, or manually. If an action proves unfeasible, the issue is redirected to the handling task.
4.
Finally, the Evaluation phase verifies whether the implemented solutions have successfully resolved the DQIs and thoroughly cleaned the log. This stage also examines whether new DQIs have emerged due to the applied data cleaning techniques. If quality remains insufficient, the process evaluates whether the initial detection and classification were accurate and whether the executed actions effectively addressed the problems. When necessary, the detection and handling tasks may be reinitiated.
This framework represents a systematic approach to identifying, addressing, and validating solutions for data quality management in IoT environments.
Furthermore, Seiger et al. [66] used TCBR with activity signatures to classify IoT sensor data in a smart factory, enabling analysts to assess signature quality and address DQIs from fine-grained IoT data variations [66]. The method is lightweight, efficient, and outperforms complex ML models on data variation, making it suitable for processing high volumes and velocities of data [11]. However, it requires intensive manual knowledge management and only indicates that DQIs might occur. Furthermore, it would struggle with issues like missing values or time shifts because such patterns would be ignored by the signatures. Finally, Corrales et al. [67] proposed a CBR approach for data cleaning. More specifically, they developed a framework that takes as input the metadata of a dataset to recommend data cleaning techniques for a specific data analysis task (classification or regression). The main contribution of the approach lies in the detection of potential DQIs through case retrieval. However, here, the analysis is only carried out at the metadata level, and CBR is used to identify the cleaning algorithms.

4. Case-Based Detection of Data Quality Issues

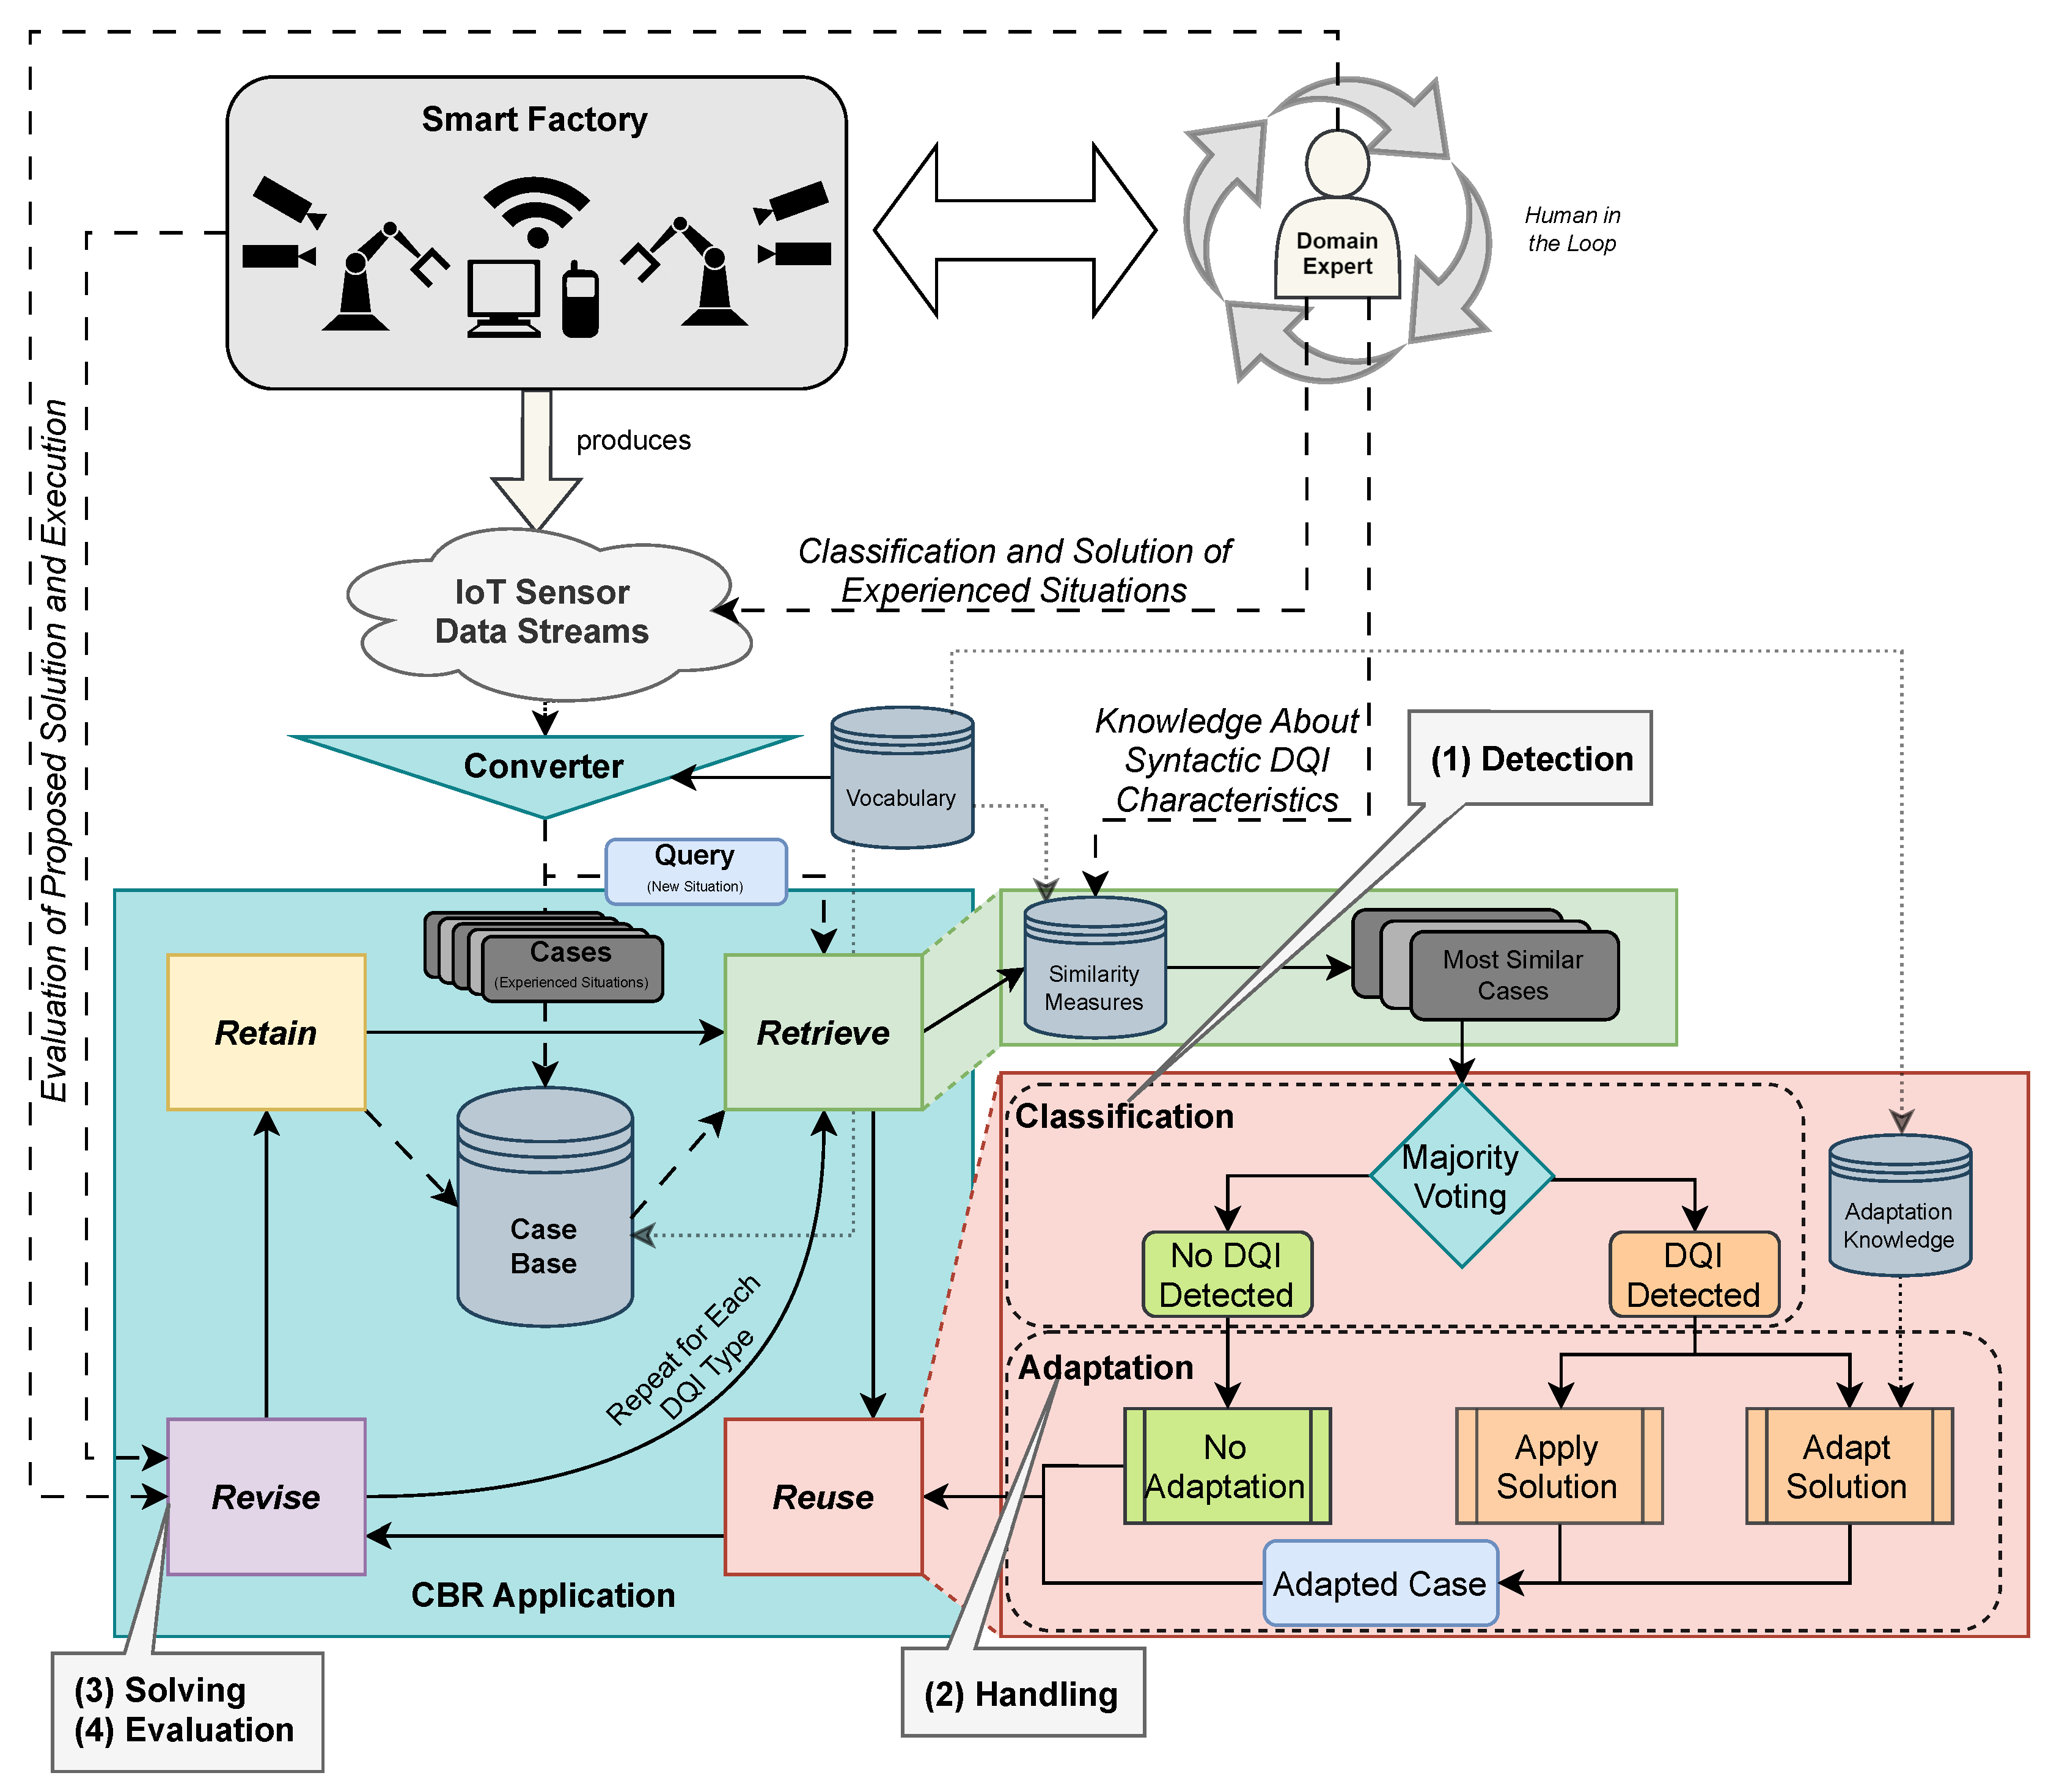
This section presents the TCBR framework for the automated identification, handling, and solving of DQIs in event logs. To this end, we propose a case-based approach tailored to the demands of IoT-driven Smart Manufacturing environments, aiming to enable near-real-time processing and evaluation of sensor data. The approach continuously monitors data streams to detect potential DQIs and draws on previously encountered similar cases to recommend appropriate handling strategies. By design, the method addresses key challenges in data quality management: it excels in dealing with rare DQIs, where conventional ML techniques often falter due to insufficient training data. Through the reuse of historical cases and solution strategies, it promotes effective knowledge transfer across heterogeneous machines or operational settings. The case base evolves by incorporating user feedback, enabling continuous refinement of the underlying knowledge. Moreover, the approach supports flexible reasoning in scenarios where the root cause of a DQI is ambiguous or multiple plausible solutions exist, thereby facilitating transparent and experience-driven decision-making. First, we present the overarching approach illustrated in Figure 4 in Section 4.1. Subsequently, this section follows the structure of the procedure model for creating a CBR system according to Malburg et al. [47]: In Section 4.2, the vocabulary for the DQI domain based on the data stream format [68] is introduced, on which also the case the base can be filled. Section 4.3 describes how the similarity measures were derived and presents these methods for the three most common DQI types. Building on this, Section 4.4 presents how these retrieval results can be used for the detection of DQIs and reused to solve identified DQIs.

4.1. Procedure of Using Case-Based Reasoning for DQI Detection

Figure 4 presents the case-based approach for identifying DQIs in IoT sensor data. This data originates from a smart factory (see Section 2.1) and is collected automatically. Domain experts must be involved to identify failures in an initial data set, as well as the syntactic similarity measures for the DQI types to identify. If a DQI is present, it is classified, and a procedure to fix the causing reason as well as repair the data is stored. Using any converter, these are transferred to the vocabulary of a CBR system (see Section 4.2) and stored in the case base there. After this is once initialized, new event data is transferred to the CBR system, categorized according to the 4R cycle by Aamodt and Plaza [21] (see Section 2.4), as a converted query directly. This determines the most similar cases in the retrieval phase, using suitable similarity measures (see Section 4.3). In the reuse phase (see Section 4.4), the current event data is first classified based on these retrieval results to determine whether a DQI is present or not. The retrieval and this first adaptation step address the detection phase according to the DQMC [11] (see Section 3.1). If there is no DQI, no adaptation is necessary. If a DQI type is available, the remediation approach from the retrieved cases can be used or adapted to the present DQI type. This step corresponds to the handling phase of the DQMC.
In the revise phase, the categorization and the possible solution procedure can be presented to a domain expert who reviews this decision and tries to apply the suggested method, which corresponds to the DQMC solving phase. Furthermore, the DQMC evaluation phase is also covered by the revise phase, as this expert directly assesses whether the approach works or not. Depending on the number of DQI cases stored, these first three steps of the CBR cycle are run several times before the retain phase is reached. This is because specific similarity measures for a DQI type are triggered in the retrieve phase. If, for example, data is examined for three DQI types, retrieval, reusage, and revision take place three times in succession. It is possible that no DQI or various DQIs are available for a case at the same time. In the retain phase, either the error-free case without the failure label is saved or the DQI case with the failure classification and the correction is made. If the domain expert has found the solution to be unusable in the DQMC evaluation, the new case is forgotten, and adjustments can be made to the similarity measures in order to re-initiate the CBR approach and optimize the results.

4.2. Vocabulary for Case Description

As described in the procedure model for creating a CBR system [47], a suitable vocabulary must be defined after pre-processing the time series data. The next knowledge container of the case base is filled with the IoT data based on the structure specified by the knowledge container of the vocabulary. To draft a vocabulary that is as generic as possible, it must be compatible with common formats from the IoT sector. The DataStream format [68] offers a flexible, structured solution for integrating IoT sensor data with process events across different contexts (single activity, group of activities, or trace), enabling joint analysis of process and IoT data. This extension of the eXtensible Event Stream (XES) standard [69,70] is developed to link IoT data with process events while simultaneously integrating the semantic context [68]. It enables the standardized representation of IoT-enriched event logs by storing extensive sensor data in events or traces, making the data suitable for subsequent analysis processes. As demonstrated in manufacturing and public transportation case studies, the DataStream format permits direct embedding of IoT data in event logs, establishing a uniform foundation for future data-oriented analysis tools while reducing data extraction and transformation efforts. Therefore, this CBR approach is based on this format. Other formats for representation of IoT sensor data can also be used, as this approach is generic, but then they require a transformation to the following vocabulary or an adapted case representation.
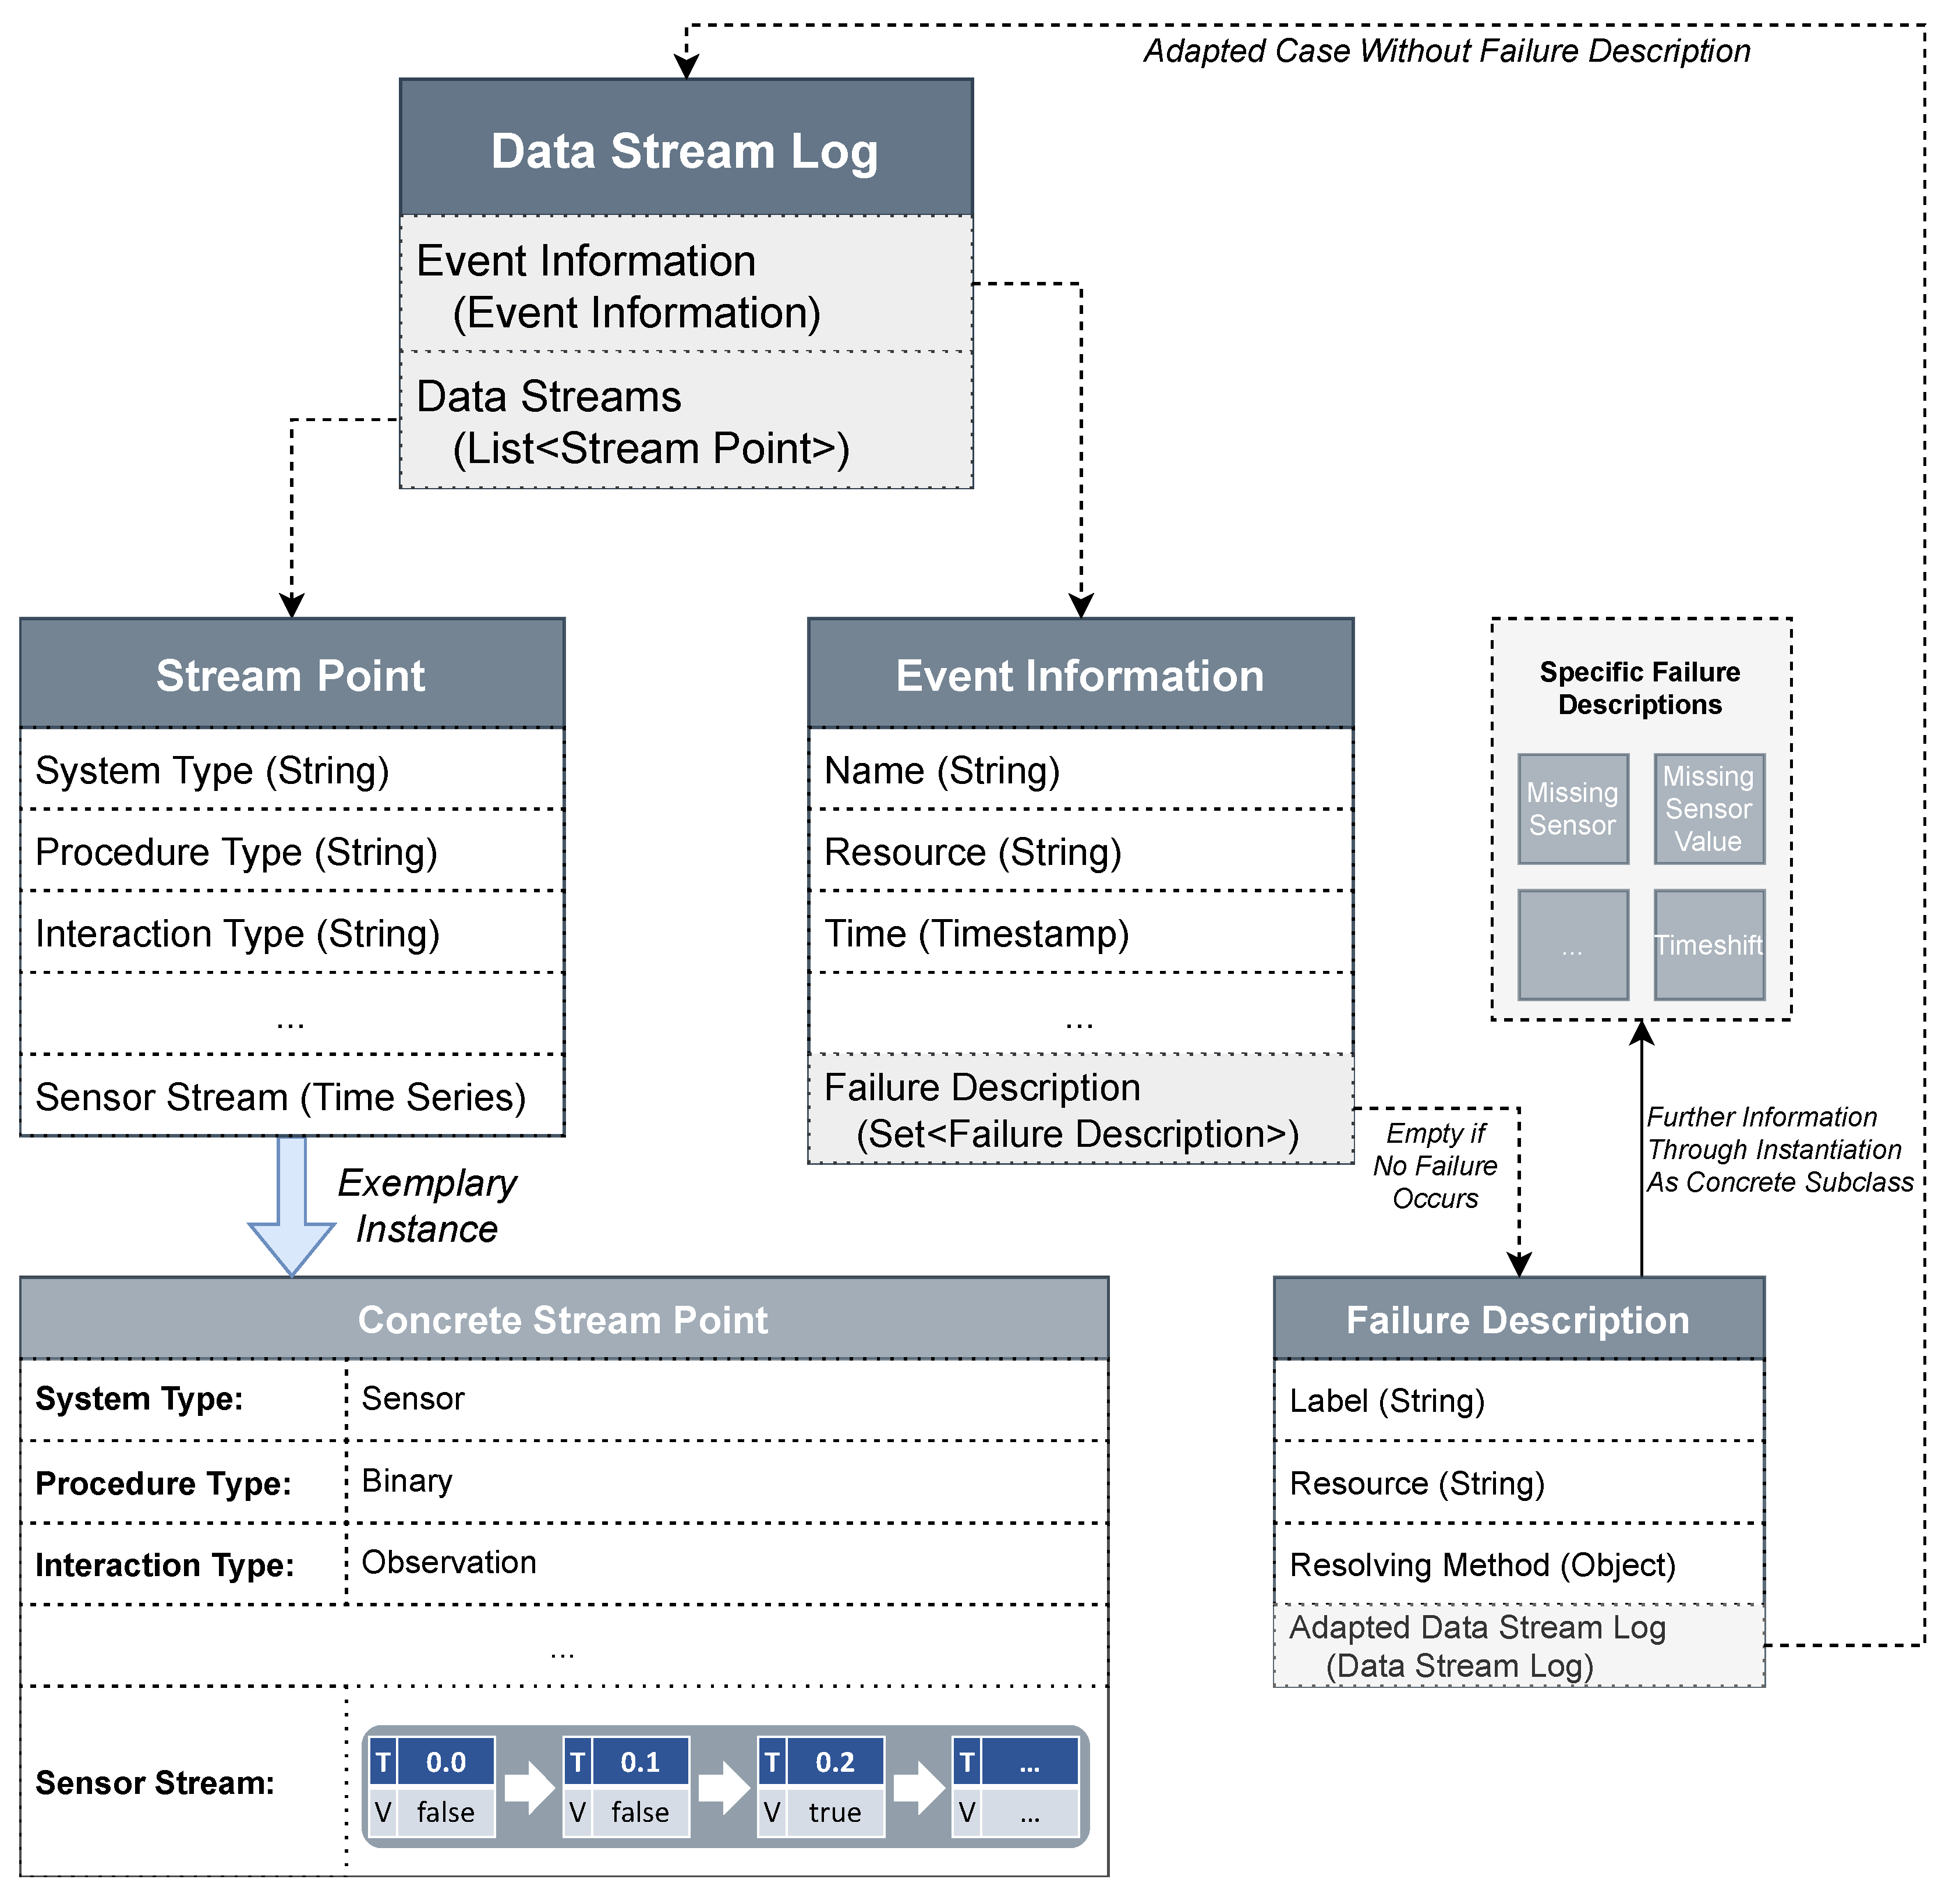
To build the vocabulary, the attributes from the DataStream format are matched to an object-oriented case representation. The specified vocabulary is illustrated in Figure 5. This is an extended version, the predecessor of which we have already presented in previous work for the DQI context [49]. Each recorded event log is represented as a case, which consists of meta information regarding this event and the actual data streams. The information contains various attributes such as the name, the available resource, the initial timestamp when the event started, and a failure description if a DQI has occurred. This is a subclass that is instantiated in subclasses for the respective DQI types. In addition to the description of the failure, the applied solution and the resulting adapted case are also stored, which in turn is another object of the case class. The solution can be stored in various forms, e.g., a reference to an algorithm to be applied or a description of the domain expert. In addition to this information about the event, the data streams are also contained at the top level. This is a list of individual stream points, each of which represents a sensor. This sensor contains information about the IoT asset on which it is located, as well as the actual time series of a sensor stream. This can take various forms, such as coordinates, e.g., of a workpiece or a machine asset, measured as numerical values or the states of machines, like, e.g., light barriers or switches, as Boolean values. The time series each contains a timestamp, which refers to a specific time point. These timestamps are not well suited for calculating similarity, as the sensors generally do not wear out within short time intervals (e.g., in a few weeks) and the time of process execution should not matter in a factory in closed areas. What is much more relevant is how much time has passed since the start of the process. This information is therefore stored in the case instead of the timestamp, so time series recorded at different time points can be compared with each other based on this distance. The time series are stored unchanged and are not pre-processed, such as abstraction [48] or the removal of irrelevant data points [47]. Such pre-processing would make it impossible to recognize DQI-specific patterns, such as missing values [49]. Additional semantic information that is not included in this vocabulary is not considered initially. For example, dependencies e.g., between different, mutually influencing stream points, are not modeled but are left out for this state of research.
At this stage, precise annotation by a domain expert is essential to ensure accurate identification of a DQI its specific type. This manual annotation constitutes the initial filling of the case base and forms the foundation for applying the CBR approach. As the CBR cycle progresses, the case base is incrementally expanded during the retain phase by adding new cases if appropriate. The data utilized remain unaltered, real-world datasets, as clearly identifiable signatures of DQI failures (e.g., those discussed by Seiger et al. [66]) are often unavailable or lack generalizability. These steps constitute the initial establishment of the two knowledge containers, namely the vocabulary and the case base.

4.3. Similarity Measures for Data Quality Issues

According to the procedure model [47], the next knowledge container to be specified is the similarity measures, which must be aligned with the previously defined vocabulary. These measures are investigated to assess the degree of similarity between a new problem and previously solved problems represented as cases within the case base. The similarity assessment constitutes the core mechanism of CBR, as it serves as a proxy for utility and thus addresses the central challenge of experience management—namely, the effective reuse of relevant experiences to solve new problems [22] (pp. 93–100). The quality of the similarity measures is therefore of critical importance: only well-designed similarity measures ensure that the case with the highest expected utility is selected for a given problem. Consequently, accurately modeled similarity measures are essential to ensure that case selection reflects the current understanding of the underlying utility function. This is particularly significant in the context of the DQI application, where the appropriateness and precision of similarity evaluation directly impact the effectiveness of the system.
The conceptualization of the similarity measures for identifying DQIs in time series data was guided by two core considerations: the availability of expert-derived experience knowledge and the limited amount of labeled failure data available in real-world industrial settings. First, the design leverages experience-based knowledge accumulated through prior domain-specific observations and manual DQI resolution. Instead of relying on purely statistical or opaque ML-based similarity models, we aimed to capture this expert understanding in the form of interpretable, modular similarity functions. Second, we deliberately selected and adapted established, domain-independent similarity measures, such as weighted variants of Dynamic Time Warping (DTW), because they are well-understood, widely supported, and capable of capturing temporal distortions, which are characteristic of several DQI types. This approach promotes generalizability across domains and allows transparent integration with the case vocabulary. Importantly, we deliberately avoided training ML models for this task. The reason for this is the scarcity of labeled fault data, especially for specific DQI patterns in industrial IoT environments. To train accurate, generalizable models, a much larger corpus of annotated fault cases would be required than is currently possible. In addition, the interpretability of machine-learned similarity measures is limited, which can affect user confidence and human diagnosis.
In this case study, we therefore relied on the knowledge of domain experts to explore appropriate similarity measures. To this end, we conducted research from the IoT Lab Trier (https://iot.uni-trier.de/ (accessed on 11 September 2025)) and from the Research Centre for Information Systems Engineering (LIRIS) at the KU Leuven (https://feb.kuleuven.be/research/decision-sciences-and-information-management/liris/liris (accessed on 11 September 2025)). Furthermore, we obtained ongoing feedback from the Internet of Processes and Things (IoPT) initiative (https://zenodo.org/communities/iopt/about (accessed on 11 September 2025)). The experts consulted have extensive experience with the characteristics of DQIs, acquired through many years of work within the domain of data quality management. Given that each DQI type exhibits distinct characteristics and focal points, the CBR approach is explicitly applied separately for each DQI type (as already stated in Section 4.1). Accordingly, the similarity measure is tailored in each iteration, such that the CBR application serves solely to determine whether a specific DQI type is present and how it might be addressed. Due to the unique nature of the DQI types under investigation, representative DQIs are identified for detailed analysis, which is also suggested by the literature:
  • Missing Data, which are widely regarded as the most prevalent issue in sensor data—excluding outliers, which are frequent but represent intrinsically valid observations [6,7]. This general problem is captured by two specific DQIs: Missing Sensor Values and Missing Sensors.
  • Noise, which is another topmost issue affecting sensor data [6,7]. This issue is represented with the DQI type of Time Shifts, which consists of measurements whose timestamp was tampered with.
The characteristics of the identified types of DQIs were discussed in detail with domain experts. These issues represent failures that cannot be detected solely through syntactic analysis but require the incorporation of semantic information available within the case. Accordingly, similarity measures were developed that are primarily based on syntactic features and—where necessary—enhanced with semantic components. These measures are specifically tailored to address the unique challenges associated with each type of DQI. The designed measures were iteratively presented to the experts and their suitability for the domain was discussed. The measures were only finalized after approval by the domain experts.
In the following, the local similarity measures designed for all three identified DQI types are presented. Since the DataStream sensor data are structured as object-oriented cases comprising multiple hierarchical levels, the applied similarity measures follow the local–global aggregation principle (see Section 2.5). For the case representation presented in Figure 5, this is performed iteratively from the lowest to the highest level. The aggregation is based on weights that are defined by domain experts. Similarity measures of different knowledge intensities are to be used for the individual attributes according to their characteristics. For example, knowledge about attributes such as System Type or Procedure Type (for Stream Point) and Resource (for Event Information) comes from a taxonomy for the respective Smart Manufacturing environment. Other attributes, particularly Boolean values, are evaluated through direct equality comparisons. Numerical values are based on a distance-based similarity. The failure description is not considered in the similarity calculation, as this is usually empty in a query and represents the solution part for the case. A significant proportion of the weight is assigned to the sensor streams within the stream points, as the occurrence of DQIs can be observed in the time series available there. Therefore, the global similarity between the cases must be sufficiently influenced by this local similarity to ensure the distinction between error-free and DQI progression.
As all other similarity measures depend on the different DQI types, these special versions can be found in the following chapters. An overview of the challenges of each of the three types of DQI and the proposed solution can be found in Table 2.

4.3.1. Missing Sensor Values

The DQI failure of missing sensor values is present if one or more values that should have been observed are not contained in the time series [49]. Therefore, it is classified as a missing data failure [37] and addresses a completeness issue [38]. The origin of this DQI can be the sensor itself or a loss in data transmission. Depending on the cause, the failure must be addressed in different ways, such as manual recalibration or data imputation [71,72]. The failure can manifest in the time series in two ways. The first is when the time series logs data at fixed intervals, and one or more values are missing. The secod is when only value changes are logged, so missing values are noticeable only if a state transition or value change has not been recorded. Therefore, pattern-based approaches for identifying this DQI cannot be used exclusively or only under the assumption that data is always recorded at regular intervals.
To identify a suitable, similar DQI case, similarities to the currently available sensor time series must be calculated. A syntactic similarity of the time series is sufficient, and semantic information can be taken from the attribute values of the case (see Figure 5). Figure 6 shows two time series for which a similarity is calculated. In the query, a sensor value is missing, but not in the case. Using a traditional similarity measure, this undesired mapping would occur, and the missing value would not be identified because of a still high similarity value for both time series. In previous work [49], a weighted version of the DTW algorithm is introduced as a suitable similarity measure for this assumption. Therefore, we use the following measure for the time series.
s i m S e n s o r S t r e a m ( q , c ) = s i m w e i g h t e d ( q , c )   with   D T W   as   s i m t r a d
This is based on the DTW algorithm [54], which can identify stretching and compression in time series without a negative influence on the resulting similarity values. For this type of DQI, this provides the advantage that cases in which values are recorded at different intervals are recognized as similar [49]. However, because of this property, individual missing values within long time series are hardly significant. If there is a missing constant value, this failure cannot be identified with the similarity measure. However, the negative consequences of a DQI do not occur, as the analysis and subsequent steps are not affected. If one or more different values are missing, the weights integrated in DTW should ensure that there is sufficient selectivity in the similarity values. To ensure the influence of this measure on the overall similarity value, this similarity should be sufficiently weighted in relation to the other meta attributes regarding the stream point. Therefore, the resulting mapping shown in Figure 7 is desired.

4.3.2. Missing Sensors

The DQI of missing sensors occurs when a complete sensor is missing in a problem or case description. This means that either the time series itself is unavailable or the entire stream point is absent (see Figure 5). Hence, this type of DQI can explicitly be classified as a missing data failure [37], directly addressing a completeness issue [38]. Within the DataStream format, metadata typically stores information regarding the number of available stream points. However, it cannot be assumed that this is necessarily correct or always available. For example, there are logs in which irrelevant data streams are deliberately omitted (e.g., in the context of PredM [4]), as these only cause unnecessary data volumes and increased computing effort for the analysis. Moreover, to enhance applicability, the similarity approach must remain sufficiently generic to function effectively even in data formats lacking explicit metadata regarding the number of available stream points.
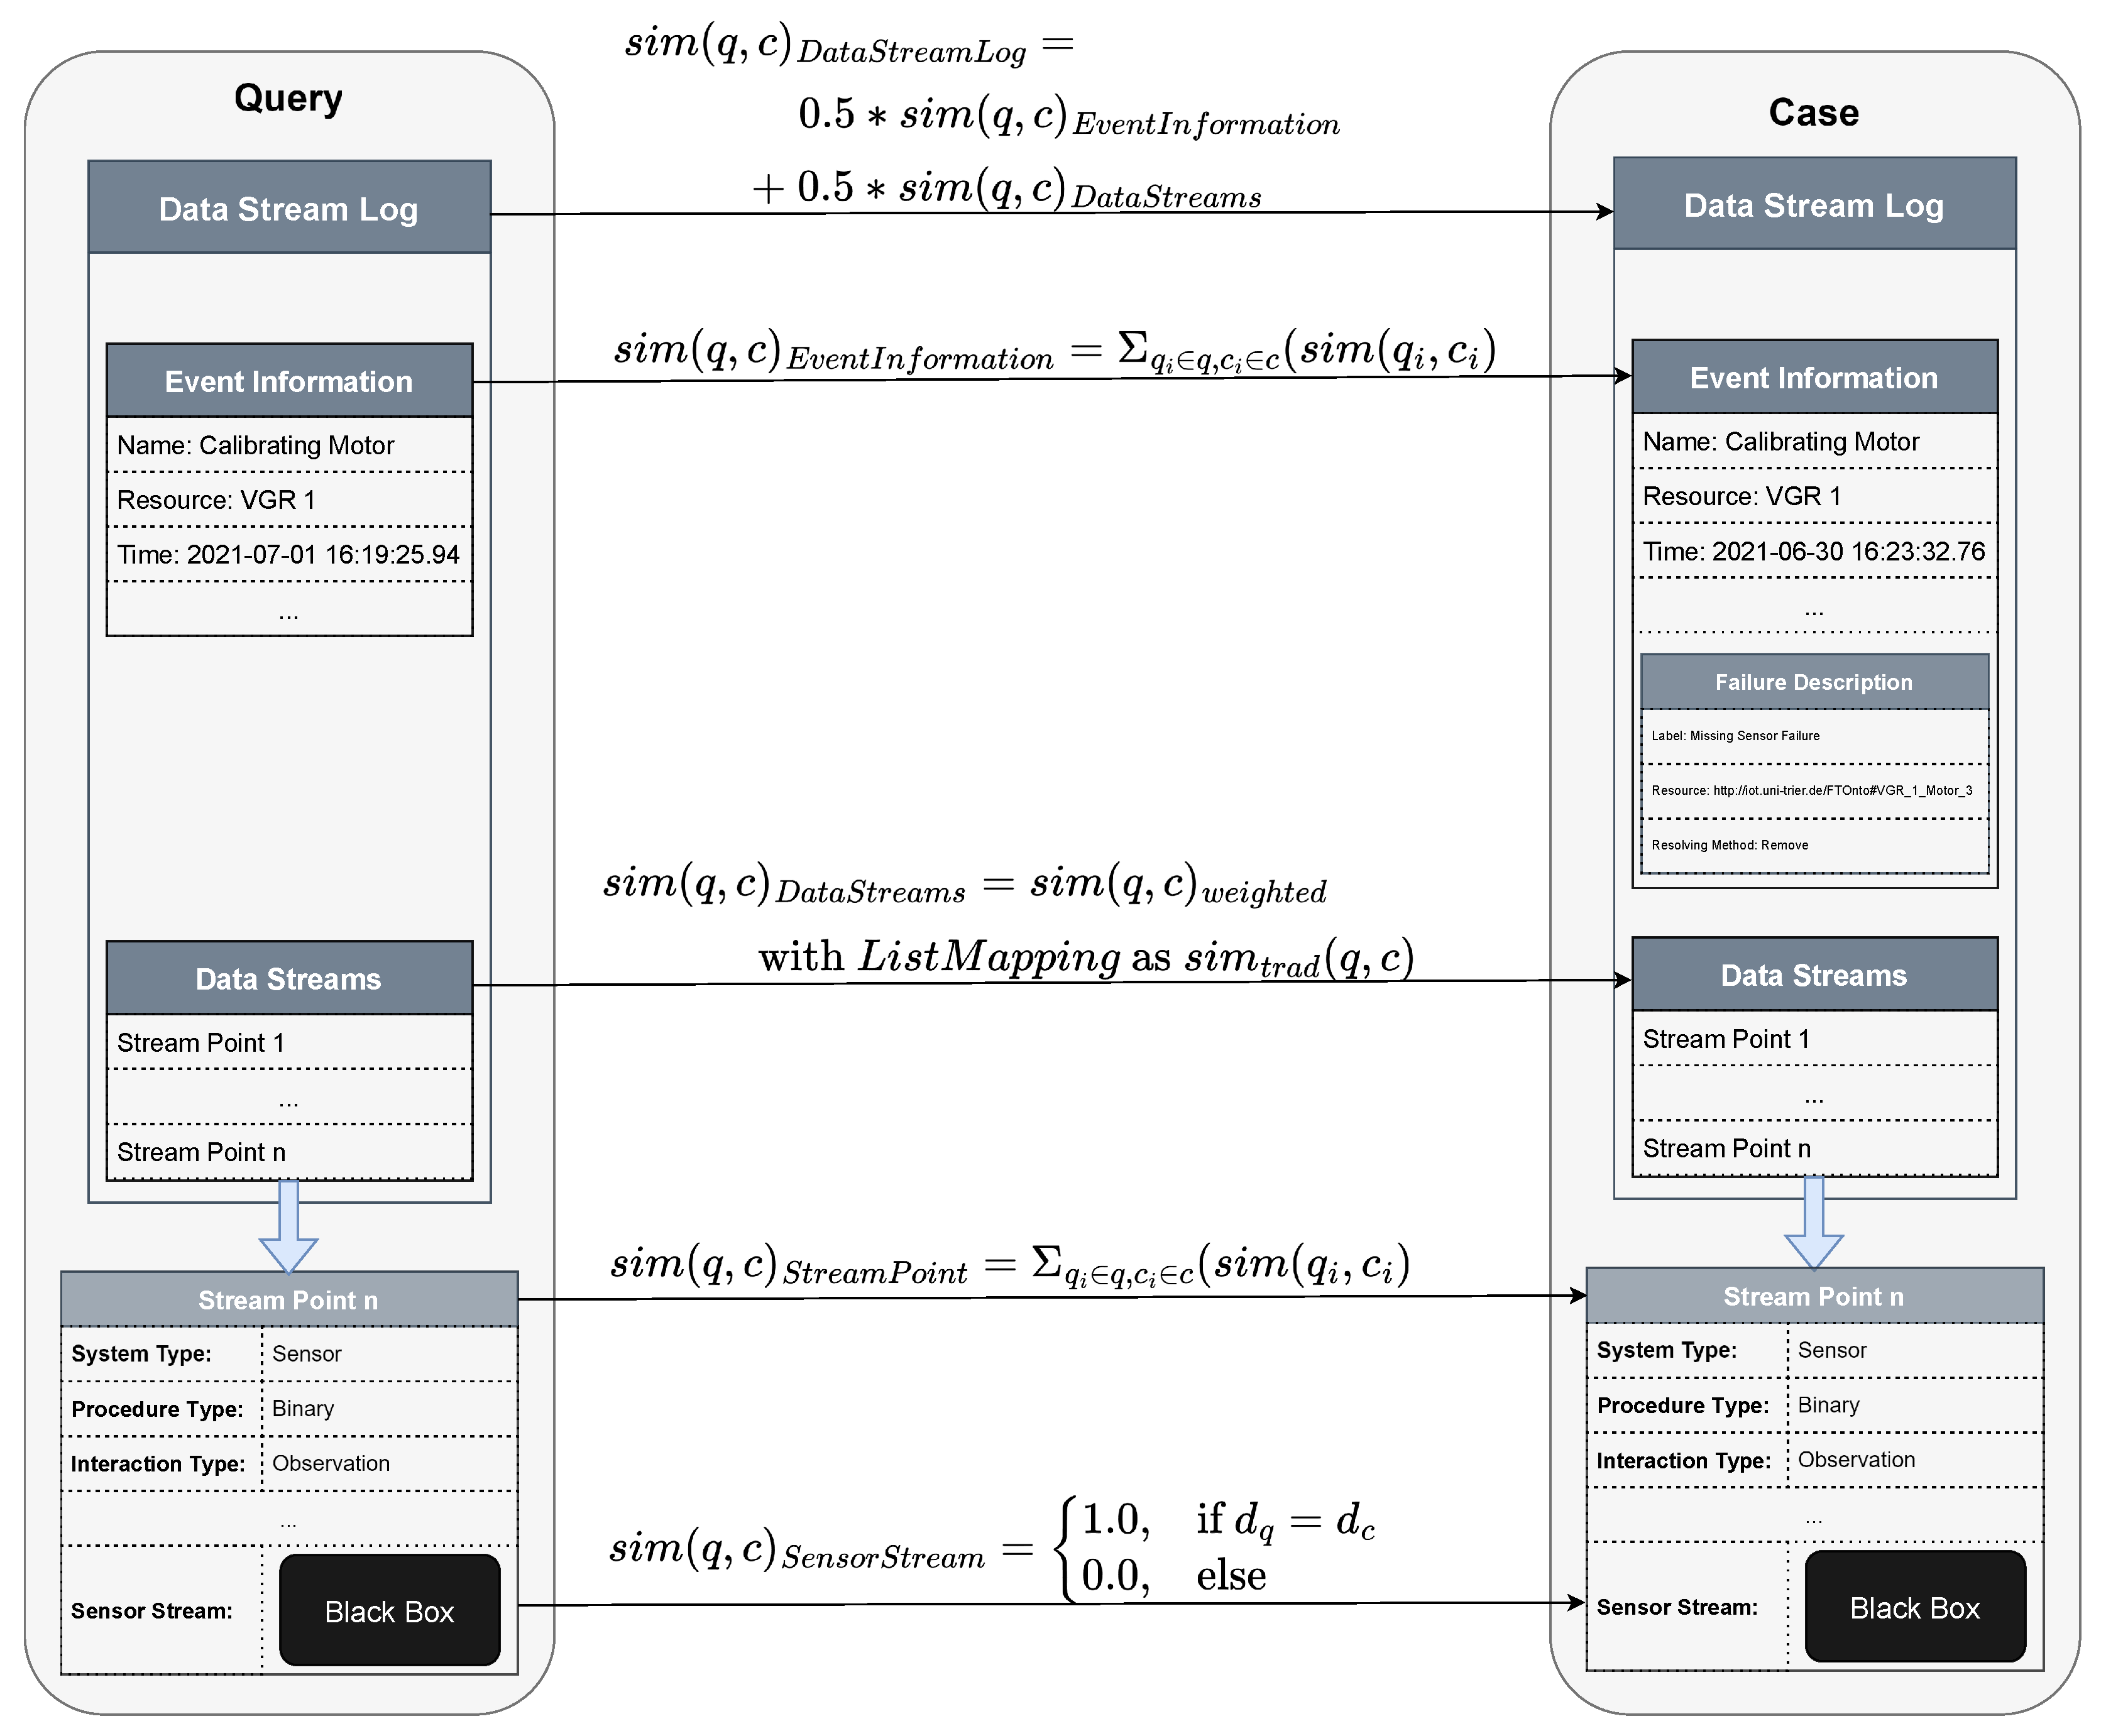
Therefore, a similarity measure was investigated that aims at this type of DQI, illustrated in Figure 8. Considering the time series solely at the local level is insufficient, as the absence of an entire sensor stream (including its time series) can only be effectively identified at the global level. For this reason, a similarity calculation ( s i m ( q , c ) D a t a S t r e a m L o g ) is performed, half of which results from the similarity of the event information at the top level ( s i m ( q , c ) E v e n t I n f o r m a t i o n ) and the other half from the similarity of the list of sensor streams ( s i m ( q , c ) D a t a S t r e a m s ). For the list, this similarity ( s i m ( q , c ) D a t a S t r e a m s ) is estimated based on a list mapping, the aim of which is to find a suitable mapping partner for each list entry. To calculate the similarities between the time series at the lowest level, a simple comparison ( s i m ( q , c ) S e n s o r S t r e a m ) is used to determine whether the same data types are present there, and the similarity of the individual stream points is determined solely based on the attributes. Ensuring the assignment of only appropriate mappings is crucial here. A penalty is used for the list mapping, analogous to the missing sensor values [49] (see Section 4.3.1), so that those mappings are omitted rather than those with low similarity. This significantly reduces the global similarity, so that a high similarity can only be achieved if the number of time series matches the attributes of the entire event conclusively. This means that DQI cases with missing sensors are similar to each other but not to cases that do not contain this error.

4.3.3. Time Shifts

The DQI error of time shifts occurs when the starting point of logging is shifted for one or more time series. It is classified as an incorrect data failure [37] and addresses the correctness of event logs [38]. When recording time series values, the timestamp itself is normally logged, which refers to a specific time point. As described in Section 4.2, it is not the specific time point that is saved but the distance to the start of the event. Consequently, this DQI type can only be detected when temporal shifts affect individual sensors rather than uniformly shifting the entire event log. Such situations commonly arise, for instance, from incorrect calibration of individual sensors, for example, [36]. Figure 9 shows the effect of such a failure in a traditional similarity calculation. Minor temporal shifts generally receive minimal penalties at the local similarity level so that approaches such as DTW usually map these to the identical entries in other time series, and the time shift is hardly reflected in the similarity value.
To address this issue, only the weights at the global level of the individual values within the time series are adjusted. Thus, the traditional DTW measure is recommended to deal with compression and stretching. At the level of the individual attributes, the weights for timestamp and the actual value can be set as desired. A numerical distance measure is recommended for the timestamp, e.g., based on the Euclidean distance. A generic measure, such as an equality check or a measure suitable for the data type, e.g., Levenshtein distance for strings [73] or numerical functions for numerical values, can be used for the value. For a weighting where the value occupies 50 percent or more of the weight, a mapping as in Figure 9 is preferred, as this maximizes the similarity for the individual entries. However, if the weights are shifted in favor of the timestamp, a mapping that is suitable for the respective time points tends to be used. Therefore, the following measure should be used for calculation:
s i m ( q , c ) T i m e P o i n t = x s i m ( q , c ) T i m e s t a m p + y s i m ( q , c ) V a l u e   with   x + y = 1 x > y
The weight for the timestamp should be significantly higher than the one for the value. For example, 0.8 could be set for the timestamp and 0.2 for the value. The desired mapping effect is shown in Figure 10.

4.4. Detection and Case-Based Solving of Data Quality Issues

After defining the three knowledge containers, the final container to populate is the adaptation knowledge [47]. This container serves to generate a solution to the identified problem based on the retrieval results. The approach presented in Section 4.1 involves a two-stage retrieval process: (1) the classification to determine whether a DQI is present, and if so, which type it belongs to, and (2) and then, in the case of a DQI type, adaptation of an appropriate solution to resolve the identified DQI. These steps are outlined in detail in the following subsections.

4.4.1. Classification of Data Quality Issues

The current query must be categorized based on the retrieval results. Due to the potential similarity between event logs containing DQIs and those without, relying solely on the most similar case may result in misclassification. To mitigate this risk, a set of the most similar cases should be used. The number of cases selected depends on the size of the underlying case base and should be proportional to it. As the amount of DQI data is usually small, accordingly, only a few suitable DQI cases can be expected, causing this number to be very small. Classification of the respective DQI type is determined through majority voting within this selected set. Additionally, a threshold may be established to exclude cases that are insufficient similar from this procedure. This similarity threshold is typically domain-specific. For instance, a set size of five retrieval results and a similarity threshold value of 0.9 can be employed. Classification is based on the absolute majority. That is, if more than half of the cases considered indicate the presence of a DQI, the query is classified as containing that DQI type. In this scenario, no further adaptation to the solution is required (null adaptation).

4.4.2. Solution Adaptation

Once a DQI has been classified, the corresponding solution must be adapted accordingly. Depending on the type of DQI identified, this adaptation can often be performed automatically. Therefore, corresponding knowledge must be available in the case, e.g., stating which time series is afflicted. For example, in cases involving missing sensor values, the adaptation can be accomplished by either adopting a corresponding value directly from the most similar case(s) or computing the mean value from several similar case values. Similarly, if an entire sensor reading is missing, the complete time series can be reconstructed using analogous methods. In the case of a time shift, a dedicated adaptation algorithm stored as part of a case can be invoked to adapt the time points. The resulting adapted cases are saved alongside their corresponding DQI classification. However, some adjustments cannot be fully automated and thus require verification and modification by a domain expert. This step cannot be automated. At this point, the adaptation naturally transitions into the revision phase, where the domain expert concurrently verifies the accuracy of both retrieval and adaptation processes.

5. Case Study

The approach presented for addressing DQIs using CBR is subjected to a case study to examine its suitability for this application area. The basic assumption to be investigated is that the use of the CBR methodology makes it possible to identify DQIs. The setup for this case study is presented in Section 5.1. In Section 5.2, the results are presented, and in Section 5.3, the results are discussed. Based on these findings, lessons learned from this case study are presented in Section 5.4 and methodical implications for future research are provided.

5.1. Setup

The approach presented in Section 4 was implemented in the CBR framework ProCAKE [74] (The implementation is available at https://gitlab.rlp.net/procake/publications/procake-data-quality-issues (accessed on 11 September 2025)), which is an open-source Java software prototype available under GPL. This supports the processing of time series data and contains various similarity measures for this purpose [47], including the weighted time series measures [49]. The data used for the study comes from an extended Fischertechnik Smart Factory in the IoT Lab Trier (https://iot.uni-trier.de/ (accessed on 11 September 2025)), where it was physically recorded. The error-free data used is publicly available and is represented in the DataStream format [68] (see Section 4.2). As the data has been verified to be error-free, data with DQIs was generated on this basis. This was carried out by a domain expert from the IoT Lab Trier, who created DQI-injected event logs using algorithms written specifically for this data set and documented the respective failure cases in separate files (Available at https://doi.org/10.5281/zenodo.15487019). Examples of the three different DQI types of missing sensor values, missing sensors, and time shifts, presented in Section 4.3, were generated. Using a converter, the error-free sensor stream data and the DQI-contaminated sensor stream data were transferred to a ProCAKE case base. This converter also reads the files with the failure information and inserts them if available into the case information.
For the case study, a reduced, randomly chosen data set of 500 cases was used, containing 25 cases of each of the three respective DQIs. This distribution has been selected because it corresponds to a realistic distribution in industrial production. In these cases, error data is available much less frequently, as production often runs smoothly and without any errors. The reduced data set should correspond as closely as possible to the real industrial circumstances, in which DQIs are only rarely available in documented form and can therefore be reused. Based on this case base, a 10-fold cross-validation using the CBR approach presented was carried out until the DQI types were identified in the reuse phase. The case study therefore relates to the retrieval and the subsequent classification carried out using majority voting. For majority voting, the five most similar cases are used, provided they have a similarity greater than the threshold value 0.9 . The further steps of the CBR approach are omitted in this case study.

5.2. Results

The evaluation was conducted on a server with 34 processors, each operating at a clock frequency of 2850 MHz and with 400 gigabytes of Random-Access Memory (RAM). Despite the high-performance setup, several adjustments were necessary during the implementation and execution of the evaluation. In particular, a RAM overload was observed during certain similarity calculations for missing sensor values and time shifts, which rapidly filled the available 400 gigabytes of memory. Consequently, the parallelized retrieval process, which runs across 34 cores, was initiated with a time delay for these two DQI types. Specifically, one thread is started on each core, and a delay is introduced before the subsequent thread begins, ensuring that all other threads pause if excessive RAM usage occurs. If a thread runs for longer than 30 min, it is terminated to free up memory for the other threads. Additionally, the retrieval process is capped at 90 min in total. The classification is then performed based on the similarities calculated up until this point, under the aforementioned conditions. If no suitable cases are identified, the query is deemed unclassifiable and recorded separately in the evaluation results.
To evaluate the case study, confusion matrices are created for the CBR runs for each DQI type based on the classifications made. The results for the DQI type of missing sensor values can be found in Table 3. Forty-one queries were aborted due to the excessive runtime. The average calculation time per query for this DQI type was 21 min and 46 s. The setup of this evaluation can already be found in a previous work [49], where queries were already aborted after a runtime of 10 min. However, the results do not differ significantly from the previous evaluation, which, despite the shorter runtime, also identified five correctly detected failures with two false positives.
For the DQI type of missing sensors, the corresponding confusion matrix in Table 4 shows that none of the actual DQI cases were recognized. The retrieval time of 1 h, 41 min, and 6 s was significantly shorter than for the other DQI types. The average calculation time per query for this DQI type was notably more efficient at just 12 s.
For the detection of time shift failures with the corresponding confusion matrix shown in Table 5, no positive cases were correctly identified. With 116 aborted queries and a retrieval time of over 10 days, this DQI type shows similar efficiency problems as the DQI type of missing sensor values. The average calculation time per query was 29 min and 21 s, making it the most computationally intensive DQI type. During processing, the available working memory of almost 400 GB was at times fully utilized.
The 10 most similar cases, including the presence of DQIs, were also retrieved and randomly evaluated. This indicated that the classification did not significantly affect classification performance if a smaller number of cases or only the most similar case was used for classification instead of the 10 most similar cases. If cases with errors were included in the most similar cases, these were often not listed as the most similar case, regardless of the DQI type.
Table 6 summarizes the key metrics—precision, recall, F1-Score, accuracy, specificity, and error rates—computed from the confusion matrices of the three DQI types. It is evident that for the Missing Sensor and Time Shift scenarios, the precision, recall, and F1-Score each equal 0.00 , which corresponds directly to the confusion matrices where no true positives were detected. This clearly indicates that the similarity-based classification for these DQI types was ineffective. The False Negative Rate reaches 100 % , whereas False Positive Rates stay near 0 % . At the same time, specificity values are exceptionally high in these cases, confirming that true negatives are almost always recognized.
For the Missing Sensor Value failure, the results are more nuanced: An accuracy of 1.81 % suggests poor overall classification performance, though a precision of 62.50 % indicates that when the system predicts a positive case, it is correct more than half the time. However, with a recall of only 1.15 % , the system fails to detect the vast majority of actual positive cases. The F1-score of 2.25 % reflects this significant imbalance between precision and recall. Particularly notable is the specificity of 50.00 % and the high false positive rate of 50.00 % , which indicates that the classification system struggles to identify negative cases correctly for this DQI type. Across all three DQI types, the overall accuracy is 64.21 % , primarily due to the high specificity across all types. However, with an average recall of only 0.38 % and an F1-score of 0.75 % , the results indicate that while the system is generally robust in recognizing failure-free sensor data, it performs poorly in detecting various DQI-related failures in sensor data.

5.3. Discussion

The results of the case study highlight three key shortcomings of the proposed case-based approach for DQI detection in time series data. Yet, and to the best of our knowledge, this study is the first to demonstrate a complete CBR pipeline for DQI detection and handling in Industrial-IoT event logs, thereby establishing an empirical baseline for the field. Although the method was designed to support the reuse of prior knowledge, the empirical results contradict this objective. The performance measures demonstrate that the CBR system largely fails to identify faulty cases correctly. In particular, the Missing Sensor and Time Shift DQI types yielded zero values for recall and F1-score, indicating that no actual DQI instances were recognized, while specificity remained high. Only the Missing Sensor Value category performs slightly better, but the overall F1-Score remains under 3 % .
Analyzing the classification behavior of the ten most similar retrieved cases suggests that the current similarity measures are fundamentally unsuitable for capturing the characteristics of DQIs. Even when failure cases appear among the most similar, they almost never rank first. Reducing the number of retrieved cases for majority voting, or even considering only the most similar case, did not lead to noticeable differences. A key reason is data imbalance: only 5 % of the 500 cases are labeled with a DQI, yielding a 19:1 skew toward “healthy” examples. Moreover, the faulty records themselves exhibit highly heterogeneous sensor patterns, so the already low prior probability of retrieving a positive case means that—even with a perfect similarity metric, a fault query is overwhelmingly likely to find its nearest neighbors among "healthy" cases. Although the small number of faulty cases per DQI type (25 each) may contribute to this outcome, it can be excluded as the sole reason for the poor performance. Instead, this points to a more fundamental problem: the individual DQI cases may be too heterogeneous to allow meaningful generalization using current similarity definitions. It should therefore be examined whether the case base contains truly suitable queries and comparable cases for each DQI type or whether the failure types are too diverse in their manifestation. In this context, approaches such as the use of failure signatures as proposed by Seiger et al. [66] (see Section 3.2) may offer a possible solution. However, this approach may not be applicable to DQI types such as Missing Sensor Values, where failure manifestations are defined primarily by the absence of data and, thus, are difficult to characterize.
Beyond conceptual issues, the approach faces severe technical limitations. Despite a reduced case base of only 500 entries, similarity computations for Missing Sensor Value and Time Shift DQIs led to extreme memory consumption, exceeding 400 GB RAM and requiring the implementation of throttling mechanisms in the retrieval process. When scaling the case base to 1000 entries, these issues intensified, rendering the system unusable even in controlled environments—except for the missing sensor DQI type that was not working. This shows the limited scalability of the approach we implemented and rules out edge devices or real-world use, where lean memory and fast runtimes are mandatory. Optimizing query and case content per DQI type—for example, by removing unchanged sensor values that contribute little to distinguishing features (see e.g., Malburg et al. [47])—could reduce the computational burden and make the approach better suited to handle large datasets comprising multiple sensors sampling data at a high frequency. Moreover, the current similarity measures must be fundamentally revised, ideally by incorporating semantic, temporal, or structural information more effectively. The vocabulary and case base developed in this work may serve as a valuable foundation for future research and development, particularly in the testing of alternative similarity strategies or in the integration of hybrid architectures. To facilitate such follow-up studies, we openly publish (1) the error-free (available at https://doi.org/10.6084/m9.figshare.20130794.v6) and DQI-injectedIoT event logs (available at https://doi.org/10.5281/zenodo.15487019), (2) the created case base consisting of 500 cases in ProCAKE (available at https://gitlab.rlp.net/procake/publications/procake-data-quality-issues/-/tree/main/src/main/resources/de/uni_trier/wi2/procake_dqi (accessed on 11 September 2025)), and (3) all extensions made to ProCAKE to enable the TCBR approach presented in Section 4 under the GNU GPL (available at https://gitlab.rlp.net/procake/publications/procake-data-quality-issues/ (accessed on 11 September 2025)). Although the system demonstrates robustness in identifying non-faulty cases, it does not fulfill the core requirement of reliably detecting faulty sensor data under realistic conditions.
A critical examination of the results raises fundamental questions regarding the suitability of the implemented similarity measures for different DQI types. The substantial variance in computation times indicates significant differences in the computational complexity of the similarity calculations. Through only 25 failures per DQI out of 500 cases, it is indicated that there are not enough examples to learn reliable patterns. These findings imply that DQIs in time series data manifest as localized, context-dependent anomalies that fixed similarity metrics fail to capture, suggesting that unsupervised or anomaly-detection methods could perform better. Tailoring similarity metrics to each DQI type could improve detection rates.
These shortcomings align with known data quality management challenges identified in Bertrand et al. [11] (see Section 2.2). In particular, data complexity introduces systemic problems that affect all components of the proposed solution. The approach is clearly not suited to handle the high data volume, as evidenced by extreme memory usage even for relatively small case bases. The diversity of sensor types and data formats also complicates meaningful similarity computation, since fixed similarity metrics fail to generalize across heterogeneous input. Moreover, high-frequency time series data requires rapid and scalable classification, which the current implementation cannot provide. Finally, the level of granularity at which similarity is calculated must be reconsidered, as abstraction may suppress essential features while raw data is too complex for real-time processing.
In summary, the findings necessitate not only a technical optimization, but also a critical reassessment of the fundamental assumption that the selected similarity measures are equally appropriate for all DQI types. The results indicate that the manifestation of various DQI types in the data may be too diverse to be effectively detected using a uniform similarity approach. The extreme variation in computational time requirements despite consistent data representation suggests that the complexity of different failure types imposes varying demands on similarity calculations. Future research should therefore aim not only to optimize existing methodologies but also to explore alternative, failure-specific similarity metrics better aligned with the characteristics of each DQI type.

5.4. Lessons Learned and Methodological Implications

The initial case study provides three central insights that are relevant not only for our own continuation of work, but also for researchers and practitioners who intend to apply CBR to DQIs in Smart Manufacturing environments.
  • LL1—Expert-only Similarity Measures are Fragile. Our retrieval pipeline achieved only 1.2 % recall at 0.6 % false-positives when the similarity assessment is based on the weights obtained in the expert workshops. Manual heuristics did not capture cross-sensor dependencies (e.g., pressure–temperature drift) or temporal motifs (intermittent spikes).
    Implication: Future CBR systems should combine semantic weights from experts with data-driven components (e.g., learned Mahalanobis metrics [75], or Siamese networks [76]) and continuously reconfigure them using closed-loop feedback.
  • LL2—Naïve Retrieval Does Not Scale. Similarity computations for two DQI types exhausted 400 GB of RAM and averaged 29 min per query, forcing 157 of 500 retrievals to abort. This makes real-time or edge deployment impracticable.
    Implication: More efficient similarity-based retrieval techniques (e.g., MAC/FAC retrieval [77], index-based case base structures [78], and GPU-accelerated retrieval [79]) and leaner case representations (temporal abstraction [48,80] and constant-value pruning [47]) are mandatory before the approach can be used in practice.
  • LL3—One-Size-Fits-All Similarity Measure Fails Across DQI Types. For Missing Sensors and Time Shift failures, the system produced 0 % recall—despite identical case representation and training effort. This indicates that each DQI type manifests a distinct failure signature that the current uniform similarity function cannot generalize over.
    Implication: Adopt failure-specific similarity measures or a cascading architecture in which a lightweight detector first routes the query to a tailored preprocessing step in which cases are enriched with structural and temporal context (e.g., sensor topology, or process phase) to boost discriminative power.
Together, these lessons indicate that future iterations should adopt a hybrid similarity-learning strategy, treating the knowledge containers as continuously changing knowledge representations, and institutionalize maintenance procedures (periodic replay and automated unit tests for new similarity rules). We believe that implementing these recommendations will raise the practical ceiling of CBR-based DQI detection and close the observed performance gap.

6. Conclusions and Future Work

This paper introduced a domain-customized framework that populates the four CBR knowledge containers for three representative DQIs in IIoT time-series logs. This method executes the first three phases of the CBR cycle—retrieve, reuse, and revise—for each DQI type to be examined, classifies their occurrence, and adapts the solutions. By releasing both the prototype code and an openly annotated benchmark dataset, we establish the first reproducible baseline for knowledge-intensive DQI management. A case study confirmed that several DQIs can be identified correctly, and, although overall recall is still limited, it delivers the first empirical baseline for CBR-based data quality control in IIoT. This baseline, together with the openly released prototype and dataset, constitutes a valuable contribution for subsequent research and optimization. The case study indicates that, especially for complex DQI types like Time Shift and Missing Sensor, the approach failed to detect any true positives. This is due not only to the limited number of cases but also to unsuitable similarity measures and the heterogeneity of DQI manifestations. Consequently, the current system fails to generalize beyond these few exemplar cases, leaving more nuanced or previously unseen DQI patterns undetected. Moreover, the system proved technically inefficient with excessive memory use, and challenges such as data volume and format variety further aggravated these issues. The reference implementation is conceived as an open blueprint for industrial deployment; the entire code base is released under the GNU license, allowing practitioners to fork, adapt, and embed the CBR components in their own monitoring or analytics stacks.
These results have already been observed for the partial approach to address the missing sensor values [49]. Therefore, future research must continue to investigate how the identification of DQIs can be optimized using CBR. One possibility for this would be to design a hybrid CBR system that integrates Deep Learning (DL) methods as similarity measures, for example. As a possibility, embeddings could be trained to explicitly identify these DQIs (see, e.g., [81,82]). In addition, similarity functions can be derived automatically by performing exploratory data analysis on openly available manufacturing time series datasets (e.g., the industrial screw driving dataset collection [83], or the IMAD-DS [84]), thereby reducing the reliance on handcrafted expert knowledge. The resulting data-driven measures are expected to enhance generalization to previously unseen DQI patterns and to facilitate transfer of the framework to new industrial settings. Furthermore, CBR could also be combined with other approaches, each of which evaluates the presence of a DQI separately and then combines the results. To additionally increase confidence in the results of the CBR approach, an explanatory power component is to be investigated.
As in previous research, runtime issues have been identified as a major problem with the CBR approach. The previously described possibility of embeddings can be used to address these. In addition, alternative retrieval methods such as MAC/FAC [77] can be examined for their suitability. So far, there are few approaches for MAC processing of time series in CBR, but methods such as clustering can be adapted for this purpose [85]. It can also be investigated to what extent abstraction methods of time series representation are suitable [47,48,86]. These must be examined individually for each DQI type, as, e.g., missing sensor values require the representation of all time points, which is not the case for missing sensors or time shifts. This would result in an upstream step, e.g., an MAC phase. Another possibility is distributed CBR approaches [87], for which architectures such as edge–cloud continuums [88,89] can be used. GPU retrieval methods that already exist for other case representations can also be considered [79]. Alternatively, the case base can also be reduced in size to make retrieval more efficient. For example, approaches in the field of Case-Based Maintenance [90], e.g., Remembering to Forget [91], can be investigated. Alternatively, methods that preprocess the data, such as the omission of constant values in time series [47], can also be considered. For the DQI of the missing sensor values, irrelevant data streams can be omitted, as they cannot be recognized anyway. In addition, methods from the DL area [92] can also be examined, which allow the similarity calculation to focus only on the most relevant attributes [4].
In addition to these optimization aspects, for future work, an approach for detecting DQIs can also be examined to see how it can be combined with existing PredM approaches [4]. An analysis of the sensor data also provides information about existing or pending machine faults and failures. It should be noted that such possible errors must be identified and passed on when cleaning up DQIs. In addition, a trade-off can arise if, for example, a sensor has to be replaced to prevent DQIs, but a PredM approach would retain this sensor for a certain period of time. Such a combined approach dealing with the mentioned trade-offs offers some starting points for future research.

Author Contributions

Conceptualization, A.S.; Methodology, A.S., Y.B., J.G. and L.M.; Software, A.S.; Validation, A.S. and J.G., Investigation, A.S., Y.B., J.G. and L.M.; Resources, J.G.; Data Curation, J.G.; Writing—Original Draft Preparation, A.S. and Y.B.; Writing—Review and Editing, J.G. and L.M.; Visualization, A.S.; Supervision, R.B. and E.S.A.; Project Administration, R.B. and E.S.A.; Funding Acquisition, R.B. and E.S.A. All authors have read and agreed to the published version of the manuscript.

Funding

This work is funded by the Federal Ministry for Economic Affairs and Energy under grant No. 01MD22002C EASY [89].

Data Availability Statement

The implementation of this work is available at https://gitlab.rlp.net/procake/publications/procake-data-quality-issues (accessed on 11 September 2025). The failure-free dataset is openly available in the Zenodo open access repository at https://doi.org/10.6084/m9.figshare.20130794.v6. The DQI-injected dataset is also available at https://doi.org/10.5281/zenodo.15487019.

Acknowledgments

This research was supported by the Internet of Processes and Things (IoPT) community: https://zenodo.org/communities/iopt/about (accessed on 11 September 2025).

Conflicts of Interest

The authors declare no conflicts of interest.

Abbreviations

The following abbreviations are used in this manuscript:
AASAsset Administration Shell
AIArtificial Intelligence
ANNArtificial Neural Network
BPMBusiness Process Management
BPMNBusiness Process Model and Notation
CBRCase-Based Reasoning
CDM-CoreCREMA Data Model, Core module
CEPComplex Event Processing
CPPSCyber–Physical Production System
DMDrilling Machine
DLDeep Learning
DQIData-Quality Issue
DQMCData-Quality Management Cycle
DSRDesign Science Research
DTWDynamic Time Warping
DWTDiscrete Wavelet Transform
FDFast Downward
FIFOFirst-In-First-Out
FTFischertechnik
GRGeneral Requirement
HBWHigh-Bay Warehouse
HTNHierarchical Task Network
HWHuman Workstation
I4.0Industry 4.0
IIoTIndustrial Internet of Things
IoTInternet of Things
IOPEsInputs, Outputs, Preconditions, and Effects
LCSLongest Common Subsequence
LLMLarge Language Model
MASONManufacturing’s Semantics Ontology
MJCMinimum Jump Costs
MLMachine Learning
MMMilling Machine
OVOven
OWLWeb Ontology Language
OWL-SOWL for Services
PAAPiecewise Aggregate Approximation
PDDLPlanning Domain Definition Language
PMProcess Mining
POCBRProcess-Oriented Case-Based Reasoning
PredMPredictive Maintenance
RAMRandom-Access Memory
SOSASensor, Observation, Sample, and Actuator
SOAService-Oriented Architecture
SPARQLQuery Language for RDF
SWASmith–Waterman-Algorithm
SWSSemantic Web Service
SSNSemantic Sensor Network
TCBRTemporal Case-Based Reasoning
TFDTemporal Fast Downward
VGRVacuum Gripper Robot
WfMSWorkflow Management System
WSMOWeb Service Modeling Ontology
WTWorkstation Transport
WVSWeighted Vector Similarity

References

  1. Gilchrist, A. Industry 4.0: The Industrial Internet of Things; Apress: New York, NY, USA, 2016. [Google Scholar] [CrossRef]
  2. Tran, K.P. Artificial Intelligence for Smart Manufacturing: Methods and Applications. Sensors 2021, 21, 5584. [Google Scholar] [CrossRef]
  3. Zonta, T.; Da Costa, C.A.; da Rosa Righi, R.; de Lima, M.J.; da Trindade, E.S.; Li, G.P. Predictive maintenance in the Industry 4.0: A systematic literature review. Comput. Ind. Eng. 2020, 150, 106889. [Google Scholar] [CrossRef]
  4. Klein, P. Combining Expert Knowledge and Deep Learning with Case-Based Reasoning for Predictive Maintenance, 1st ed.; Springer Vieweg: Wiesbaden, Germany, 2025. [Google Scholar] [CrossRef]
  5. Karkouch, A.; Mousannif, H.; Al Moatassime, H.; Noel, T. Data Quality in Internet of Things: A state-of-the-art survey. J. Netw. Comput. Appl. 2016, 73, 57–81. [Google Scholar] [CrossRef]
  6. Teh, H.Y.; Kempa-Liehr, A.W.; Wang, K.I.K. Sensor data quality: A systematic review. J. Big Data 2020, 7, 11. [Google Scholar] [CrossRef]
  7. Goknil, A.; Nguyen, P.; Sen, S.; Politaki, D.; Niavis, H.; Pedersen, K.J.; Suyuthi, A.; Anand, A.; Ziegenbein, A. A Systematic Review of Data Quality in CPS and IoT for Industry 4.0. ACM Comput. Surv. 2023, 55, 1–38. [Google Scholar] [CrossRef]
  8. van der Aalst, W.M.P. Process Mining—Data Science in Action, 2nd ed.; Springer: Berlin/Heidelberg, Germany, 2016. [Google Scholar] [CrossRef]
  9. Rangineni, S. An Analysis of Data Quality Requirements for Machine Learning Development Pipelines Frameworks. Int. J. Comput. Trends Technol. 2023, 71, 16–27. [Google Scholar] [CrossRef]
  10. Mangler, J.; Seiger, R.; Benzin, J.; Grüger, J.; Kirikkayis, Y.; Gallik, F.; Malburg, L.; Ehrendorfer, M.; Bertrand, Y.; Franceschetti, M.; et al. From Internet of Things Data to Business Processes: Challenges and a Framework. arXiv 2024, arXiv:2405.08528. [Google Scholar] [CrossRef]
  11. Bertrand, Y.; Schultheis, A.; Malburg, L.; Grüger, J.; Serral Asensio, E.; Bergmann, R. Challenges in Data Quality Management for IoT-Enhanced Event Logs. In International Conference on Research Challenges in Information Science; Springer: Berlin/Heidelberg, Germany, 2025; pp. 20–36. [Google Scholar] [CrossRef]
  12. Liu, F.T.; Ting, K.M.; Zhou, Z.H. Isolation-based anomaly detection. ACM Trans. Knowl. Discov. Data 2012, 6, 1–39. [Google Scholar] [CrossRef]
  13. Breunig, M.M.; Kriegel, H.; Ng, R.T.; Sander, J. LOF: Identifying Density-Based Local Outliers. In Proceedings of the 2000 ACM SIGMOD International Conference on Management of Data, Dallas, TX, USA, 16–18 May 2000; pp. 93–104. [Google Scholar] [CrossRef]
  14. Jäger, G.; Zug, S.; Brade, T.; Dietrich, A.; Steup, C.; Moewes, C.; Cretu, A.M. Assessing neural networks for sensor fault detection. In Proceedings of the 2014 CIVEMSA, Ottawa, ON, Canada, 5–7 May 2014; pp. 70–75. [Google Scholar] [CrossRef]
  15. D’Aniello, G.; Gaeta, M.; Hong, T.P. Effective Quality-Aware Sensor Data Management. IEEE Trans. Emerg. Top. Comput. Intell. 2017, 2, 65–77. [Google Scholar] [CrossRef]
  16. Liu, Y.; Chen, J.; Sun, Z.; Li, Y.; Huang, D. A probabilistic self-validating soft-sensor with application to wastewater treatment. Comput. Chem. Eng. 2014, 71, 263–280. [Google Scholar] [CrossRef]
  17. Hou, Z.; Lian, Z.; Yao, Y.; Yuan, X. Data mining based sensor fault diagnosis and validation for building air conditioning system. Energy Convers. Manag. 2006, 47, 2479–2490. [Google Scholar] [CrossRef]
  18. Grüger, J.; Malburg, L.; Bergmann, R. IoT-enriched event log generation and quality analytics: A case study. it-Inf. Technol. 2023, 65, 128–138. [Google Scholar] [CrossRef]
  19. Mitchell, T.M. Machine Learning; McGraw-Hill: New York, NY, USA, 1997. [Google Scholar]
  20. Power, D.J. Decision Support Systems: Concepts and Resources for Managers; Quorum Books: Westport, CT, USA, 2002. [Google Scholar]
  21. Aamodt, A.; Plaza, E. Case-Based Reasoning: Foundational Issues, Methodological Variations, and System Approaches. AI Commun. 1994, 7, 39–59. [Google Scholar] [CrossRef]
  22. Bergmann, R. Experience Management: Foundations, Development Methodology, and Internet-Based Applications; LNCS; Springer: Berlin/Heidelberg, Germany, 2003; Volume 2432. [Google Scholar] [CrossRef]
  23. Sørmo, F.; Cassens, J.; Aamodt, A. Explanation in Case-Based Reasoning—Perspectives and Goals. Artif. Intell. Rev. 2005, 24, 109–143. [Google Scholar] [CrossRef]
  24. Zanzotto, F.M. Viewpoint: Human-in-the-loop Artificial Intelligence. J. Artif. Intell. Res. 2019, 64, 243–252. [Google Scholar] [CrossRef]
  25. Richter, M.M. Knowledge Containers. In Readings in Case-Based Reasoning; Morgan Kaufmann Publishers: Cambridge, MA, USA, 2003. [Google Scholar]
  26. Dorsemaine, B.; Gaulier, J.P.; Wary, J.P.; Kheir, N.; Urien, P. Internet of Things: A Definition & Taxonomy. In Proceedings of the 2015 9th International Conference on Next Generation Mobile Applications, Services and Technologies, Cambridge, UK, 9–11 September 2015; pp. 72–77. [Google Scholar] [CrossRef]
  27. Radziwon, A.; Bilberg, A.; Bogers, M.; Madsen, E.S. The Smart Factory: Exploring Adaptive and Flexible Manufacturing Solutions. Procedia Eng. 2014, 69, 1184–1190. [Google Scholar] [CrossRef]
  28. Hehenberger, P.; Vogel-Heuser, B.; Bradley, D.; Eynard, B.; Tomiyama, T.; Achiche, S. Design, modelling, simulation and integration of cyber physical systems: Methods and applications. Comput. Ind. 2016, 82, 273–289. [Google Scholar] [CrossRef]
  29. Boyes, H.; Hallaq, B.; Cunningham, J.; Watson, T. The industrial internet of things (IIoT): An analysis framework. Comput. Ind. 2018, 101, 1–12. [Google Scholar] [CrossRef]
  30. Vijayaraghavan, V.; Rian Leevinson, J. Internet of Things Applications and Use Cases in the Era of Industry 4.0. In The Internet of Things in the Industrial Sector: Security and Device Connectivity, Smart Environments, and Industry 4.0; Springer International Publishing: Cham, Switzerland, 2019; pp. 279–298. [Google Scholar] [CrossRef]
  31. Janiesch, C.; Koschmider, A.; Mecella, M.; Weber, B.; Burattin, A.; Ciccio, C.D.; Gal, A.; Kannengiesser, U.; Mannhardt, F.; Mendling, J.; et al. The Internet-of-Things Meets Business Process Management. A Manifesto. IEEE Syst. Man Cybern. Mag. 2020, 6, 34–44. [Google Scholar] [CrossRef]
  32. Schultheis, A.; Jilg, D.; Malburg, L.; Bergweiler, S.; Bergmann, R. Towards Flexible Control of Production Processes: A Requirements Analysis for Adaptive Workflow Management and Evaluation of Suitable Process Modeling Languages. Processes 2024, 12, 2714. [Google Scholar] [CrossRef]
  33. Scheibel, B.; Rinderle-Ma, S. Online Decision Mining and Monitoring in Process-Aware Information Systems. In International Conference on Conceptual Modeling; LNCS; Springer: Berlin/Heidelberg, Germany, 2022; Volume 13607, pp. 271–280. [Google Scholar] [CrossRef]
  34. Rodríguez-Fernández, V.; Trzcionkowska, A.; González-Pardo, A.; Brzychczy, E.; Nalepa, G.J.; Camacho, D. Conformance Checking for Time-Series-Aware Processes. IEEE Trans. Ind. Inform. 2021, 17, 871–881. [Google Scholar] [CrossRef]
  35. Ehrendorfer, M.; Mangler, J.; Rinderle-Ma, S. Assessing the Impact of Context Data on Process Outcomes During Runtime. In International Conference on Service-Oriented Computing 2021; Springer: Berlin/Heidelberg, Germany, 2021; pp. 3–18. [Google Scholar] [CrossRef]
  36. Bertrand, Y.; Belle, R.V.; Weerdt, J.D.; Serral, E. Defining Data Quality Issues in Process Mining with IoT Data. In International Conference on Process Mining 2022; LNBIP; Springer: Berlin/Heidelberg, Germany, 2022; Volume 468, pp. 422–434. [Google Scholar] [CrossRef]
  37. Bose, J.C.J.C.; Mans, R.S.; van der Aalst, W.M.P. Wanna improve process mining results? In Proceedings of the CIDM, Singapore, 16–19 April 2013; pp. 127–134. [Google Scholar] [CrossRef]
  38. Verhulst, R. Evaluating Quality of Event Data within Event Logs: An Extensible Framework. Master’s Thesis, Eindhoven University of Technology, Eindhoven, The Netherlands, 2016. [Google Scholar]
  39. Kuemper, D.; Iggena, T.; Toenjes, R.; Pulvermüller, E. Valid.IoT: A framework for sensor data quality analysis and interpolation. In Proceedings of the 9th ACM Multimedia Systems Conference, Amsterdam, The Netherlands, 12–15 June 2018; pp. 294–303. [Google Scholar] [CrossRef]
  40. Reinkemeyer, L. Process Mining in a Nutshell. In Process Mining in Action: Principles, Use Cases and Outlook; Springer: Berlin/Heidelberg, Germany, 2020; pp. 3–10. [Google Scholar] [CrossRef]
  41. Suriadi, S.; Andrews, R.; ter Hofstede, A.H.M.; Wynn, M.T. Event log imperfection patterns for process mining: Towards a systematic approach to cleaning event logs. Inf. Syst. 2017, 64, 132–150. [Google Scholar] [CrossRef]
  42. Brzychczy, E.; Trzcionkowska, A. Creation of an Event Log From a Low-Level Machinery Monitoring System for Process Mining Purposes. In International Conference on Intelligent Data Engineering and Automated Learning; Springer: Berlin/Heidelberg, Germany, 2018; pp. 54–63. [Google Scholar] [CrossRef]
  43. Watson, I. Case-based reasoning is a methodology not a technology. Knowl. Based Syst. 1999, 12, 303–308. [Google Scholar] [CrossRef]
  44. Kolodner, J.L. Case-Based Reasoning; Morgan Kaufmann: Cambridge, MA, USA, 1993. [Google Scholar] [CrossRef]
  45. Jære, M.D.; Aamodt, A.; Skalle, P. Representing Temporal Knowledge for Case-Based Prediction. In European Conference on Case-Based Reasoning 2002; LNCS; Springer: Berlin/Heidelberg, Germany, 2002; Volume 2416, pp. 174–188. [Google Scholar] [CrossRef]
  46. López, B. Case-Based Reasoning: A Concise Introduction; SLAIML; Springer: Berlin/Heidelberg, Germany, 2013. [Google Scholar] [CrossRef]
  47. Malburg, L.; Schultheis, A.; Bergmann, R. Modeling and Using Complex IoT Time Series Data in Case-Based Reasoning: From Application Scenarios to Implementations. In ICCBR Workshops; Springer: Cham, Switzerland, 2023; Volume 3438, pp. 81–96. [Google Scholar]
  48. Shahar, Y. A Framework for Knowledge-Based Temporal Abstraction. Artif. Intell. 1997, 90, 79–133. [Google Scholar] [CrossRef]
  49. Schultheis, A.; Malburg, L.; Grüger, J.; Weich, J.; Bertrand, Y.; Bergmann, R.; Serral Asensio, E. Identifying Missing Sensor Values in IoT Time Series Data: A Weight-Based Extension of Similarity Measures for Smart Manufacturing. In International Conference on Case-Based Reasoning 2024; LNCS; Springer: Berlin/Heidelberg, Germany, 2024; Volume 14775, pp. 240–257. [Google Scholar] [CrossRef]
  50. Stahl, A. Learning of Knowledge-Intensive Similarity Measures in Case-Based Reasoning. Ph.D. Thesis, University of Kaiserslautern, der Pfalz, Germany, 2004. [Google Scholar]
  51. Nakanishi, T. Semantic Waveform Model for Similarity Measure by Time-series Variation in Meaning. In Proceedings of the 2021 10th International Congress on Advanced Applied Informatics (IIAI-AAI), Online, 11–16 July 2021; pp. 382–387. [Google Scholar] [CrossRef]
  52. Corchado, J.M.; Lees, B. Adaptation of Cases for Case Based Forecasting with Neural Network Support. In Soft Computing in CBR; Springer: Berlin/Heidelberg, Germany, 2001; pp. 293–319. [Google Scholar] [CrossRef]
  53. Smith, T.F.; Waterman, M.S. Identification of Common Molecular Subsequences. J. Mol. Biol. 1981, 147, 195–197. [Google Scholar] [CrossRef]
  54. Sakoe, H.; Chiba, S. Dynamic Programming Algorithm Optimization for Spoken Word Recognition. IEEE Trans. Acoust. Speech, Signal Process. 1978, 26, 43–49. [Google Scholar] [CrossRef]
  55. Zhang, L.; Jeong, D.; Lee, S. Data Quality Management in the Internet of Things. Sensors 2021, 21, 5834. [Google Scholar] [CrossRef]
  56. Wang, R.Y.; Strong, D.M. Beyond Accuracy: What Data Quality Means to Data Consumers. J. Manag. Inf. Syst. 1996, 12, 5–33. [Google Scholar] [CrossRef]
  57. Wang, R.Y. A product perspective on total data quality management. Commun. ACM 1998, 41, 58–65. [Google Scholar] [CrossRef]
  58. English, L.P. Improving Data Warehouse and Business Information Quality: Methods for Reducing Costs and Increasing Profits; John Wiley & Sons, Inc.: Hoboken, NJ, USA, 1999. [Google Scholar]
  59. Geisler, S.; Quix, C.; Weber, S.; Jarke, M. Ontology-Based Data Quality Management for Data Streams. J. Data Inf. Qual. 2016, 7, 1–34. [Google Scholar] [CrossRef]
  60. Perez-Castillo, R.; Carretero, A.G.; Caballero, I.; Rodriguez, M.; Piattini, M.; Mate, A.; Kim, S.; Lee, D. DAQUA-MASS: An ISO 8000-61 Based Data Quality Management Methodology for Sensor Data. Sensors 2018, 18, 3105. [Google Scholar] [CrossRef]
  61. Moen, R.; Norman, C. Evolution of the PDCA Cycle, 2006. In Proceedings of the 7th ANQ Congress, Tokyo, Japan, 17 September 2017. [Google Scholar]
  62. Perez-Castillo, R.; Carretero, A.G.; Rodriguez, M.; Caballero, I.; Piattini, M.; Mate, A.; Kim, S.; Lee, D. Data Quality Best Practices in IoT Environments. In Proceedings of the 2018 11th International Conference on the Quality of Information and Communications Technology (QUATIC), Coimbra, Portugal, 4–7 September 2018; pp. 272–275. [Google Scholar] [CrossRef]
  63. Chakraborty, N.; Sharma, A.; Dutta, J.; Kumar, H.D. Privacy-Preserving Data Quality Assessment for Time-Series IoT Sensors. In Proceedings of the 2024 IEEE International Conference on Internet of Things and Intelligence Systems (IoTaIS), Bali, Indonesia, 28–30 November 2024; pp. 51–57. [Google Scholar] [CrossRef]
  64. Kim, S.; Del Castillo, R.P.; Caballero, I.; Lee, J.; Lee, C.; Lee, D.; Lee, S.; Mate, A. Extending Data Quality Management for Smart Connected Product Operations. IEEE Access 2019, 7, 144663–144678. [Google Scholar] [CrossRef]
  65. Ehrlinger, L.; Wöß, W. Automated Data Quality Monitoring. In Proceedings of the 22nd ICIQ, Little Rock, AR, USA, 6–7 October 2017. [Google Scholar]
  66. Seiger, R.; Schultheis, A.; Bergmann, R. Case-Based Activity Detection from Segmented Internet of Things Data. In International Conference on Case-Based Reasoning; LNCS; Springer: Berlin/Heidelberg, Germany, 2025; Volume 15662, pp. 438–453. [Google Scholar] [CrossRef]
  67. Corrales, D.C.; Ledezma, A.; Corrales, J.C. A case-based reasoning system for recommendation of data cleaning algorithms in classification and regression tasks. Appl. Soft Comput. 2020, 90, 106180. [Google Scholar] [CrossRef]
  68. Mangler, J.; Grüger, J.; Malburg, L.; Ehrendorfer, M.; Bertrand, Y.; Benzin, J.V.; Rinderle-Ma, S.; Serral Asensio, E.; Bergmann, R. DataStream XES Extension: Embedding IoT Sensor Data into Extensible Event Stream Logs. Future Internet 2023, 15, 109. [Google Scholar] [CrossRef]
  69. IEEE Std 1849-2016; IEEE Standard for eXtensible Event Stream (XES) for Achieving Interoperability in Event Logs and Event Streams. IEEE: New York, NY, USA, 2016. [CrossRef]
  70. IEEE Std 1849-2023 (Revision of IEEE Std 1849-2016); IEEE Standard for eXtensible Event Stream (XES) for Achieving Interoperability in Event Logs and Event Streams. IEEE: New York, NY, USA, 2023. [CrossRef]
  71. Stekhoven, D.J.; Bühlmann, P. MissForest—Non-parametric missing value imputation for mixed-type data. Bioinformatics 2012, 28, 112–118. [Google Scholar] [CrossRef]
  72. Wang, J.; Du, W.; Cao, W.; Zhang, K.; Wang, W.; Liang, Y.; Wen, Q. Deep Learning for Multivariate Time Series Imputation: A Survey. arXiv 2024, arXiv:2402.04059. [Google Scholar] [CrossRef]
  73. Levenshtein, V.I. Binary Codes Capable of Correcting Deletions, Insertions and Reversals. In Soviet Physics-Doklady; Soviet Union: Moscow, Russia, 1966; Volume 10, pp. 707–710. [Google Scholar]
  74. Bergmann, R.; Grumbach, L.; Malburg, L.; Zeyen, C. ProCAKE: A Process-Oriented Case-Based Reasoning Framework. In Proceedings of the 27th ICCBR Workshop, Otzenhausen, Germany, 8–12 September 2019; Volume 2567, pp. 156–161. [Google Scholar]
  75. Mahalanobis, P.C. On the Generalized Distance in Statistics. Proc. Natl. Inst. Sci. India 1936, 2, 49–55, reprinted in Sankhyā: Indian J. Stat. 2018, 80-A (Suppl. 1), S1–S7. [Google Scholar]
  76. Chicco, D. Siamese Neural Networks: An Overview. In Artificial Neural Networks, 3rd ed.; Methods in Molecular Biology; Springer: Berlin/Heidelberg, Germany, 2021; Volume 2190, pp. 73–94. [Google Scholar] [CrossRef]
  77. Forbus, K.D.; Gentner, D.; Law, K. MAC/FAC: A Model of Similarity-Based Retrieval. Cogn. Sci. 1995, 19, 141–205. [Google Scholar] [CrossRef]
  78. Craw, S.; Jarmulak, J.; Rowe, R. Maintaining Retrieval Knowledge in a Case-Based Reasoning System. Comput. Intell. 2001, 17, 346–363. [Google Scholar] [CrossRef]
  79. Malburg, L.; Hoffmann, M.; Trumm, S.; Bergmann, R. Improving Similarity-Based Retrieval Efficiency by Using Graphic Processing Units in Case-Based Reasoning. In Proceedings of the International FLAIRS Conference Proceedings, North Miami Beach, FL, USA, 19–21 May 2021. [Google Scholar] [CrossRef]
  80. Allen, J.F. Maintaining Knowledge about Temporal Intervals. Commun. ACM 1983, 26, 832–843. [Google Scholar] [CrossRef]
  81. Weich, J.; Schultheis, A.; Hoffmann, M.; Bergmann, R. Integration of Time Series Embedding for Efficient Retrieval in Case-Based Reasoning. In International Conference on Case-Based Reasoning; LNCS; Springer: Berlin/Heidelberg, Germany, 2025; Volume 15662, pp. 328–344. [Google Scholar] [CrossRef]
  82. Hoffmann, M. Hybrid AI for Process Management: Improving Similarity Assessment in Process-Oriented Case-Based Reasoning via Deep Learning. Ph.D. Thesis, Trier University, Trier, Germany, 2025. [Google Scholar]
  83. West, N.; Deuse, J. Industrial Screw Driving Dataset Collection: Time Series Data for Process Monitoring and Anomaly Detection. 2025. Available online: https://zenodo.org/records/14860571 (accessed on 2 July 2025).
  84. Augusti, F.; Albertini, D.; Esmer, K.; Sannino, R.; Bernardini, A. IMAD-DS: A Dataset for Industrial Multi-Sensor Anomaly Detection Under Domain Shift Conditions. In Proceedings of the Detection and Classification of Acoustic Scenes and Events 2024, Tokyo, Japan, 23–25 October 2024. [Google Scholar] [CrossRef]
  85. Ehrendorfer, M.; Mangler, J.; Rinderle-Ma, S. Clustering Raw Sensor Data in Process Logs to Detect Data Streams. In International Conference on Cooperative Information Systems 2023; LNCS; Springer: Berlin/Heidelberg, Germany, 2023; Volume 14353, pp. 438–447. [Google Scholar] [CrossRef]
  86. Schmidt, R.; Gierl, L. A prognostic model for temporal courses that combines temporal abstraction and case-based reasoning. Int. J. Med. Inform. 2005, 74, 307–315. [Google Scholar] [CrossRef]
  87. Plaza, E.; McGinty, L. Distributed case-based reasoning. Knowl. Eng. Rev. 2005, 20, 261–265. [Google Scholar] [CrossRef]
  88. Shi, W.; Cao, J.; Zhang, Q.; Li, Y.; Xu, L. Edge Computing: Vision and Challenges. IEEE Internet Things J. 2016, 3, 637–646. [Google Scholar] [CrossRef]
  89. Schultheis, A.; Alt, B.; Bast, S.; Guldner, A.; Jilg, D.; Katic, D.; Mundorf, J.; Schlagenhauf, T.; Weber, S.; Bergmann, R.; et al. EASY: Energy-Efficient Analysis and Control Processes in the Dynamic Edge-Cloud Continuum for Industrial Manufacturing. Künstliche Intell. 2024, 39, 161–166. [Google Scholar] [CrossRef]
  90. Chebel-Morello, B.; Haouchine, M.K.; Zerhouni, N. Case-based maintenance: Structuring and incrementing the case base. Knowl. Based Syst. 2015, 88, 165–183. [Google Scholar] [CrossRef]
  91. Smyth, B.; Keane, M.T. Remembering To Forget: A Competence-Preserving Case Deletion Policy for Case-Based Reasoning Systems. In Proceedings of the 14th IJCAI, Montreal, QC, Canada, 20–25 August 1995; Morgan Kaufmann: Cambridge, MA, USA, 1995; pp. 377–383. [Google Scholar]
  92. Buduma, N. Fundamentals of Deep Learning: Designing Next-Generation Machine Intelligence Algorithms, 1st ed.; O’Reilly: Sebastopol, CA, USA, 2017. [Google Scholar]
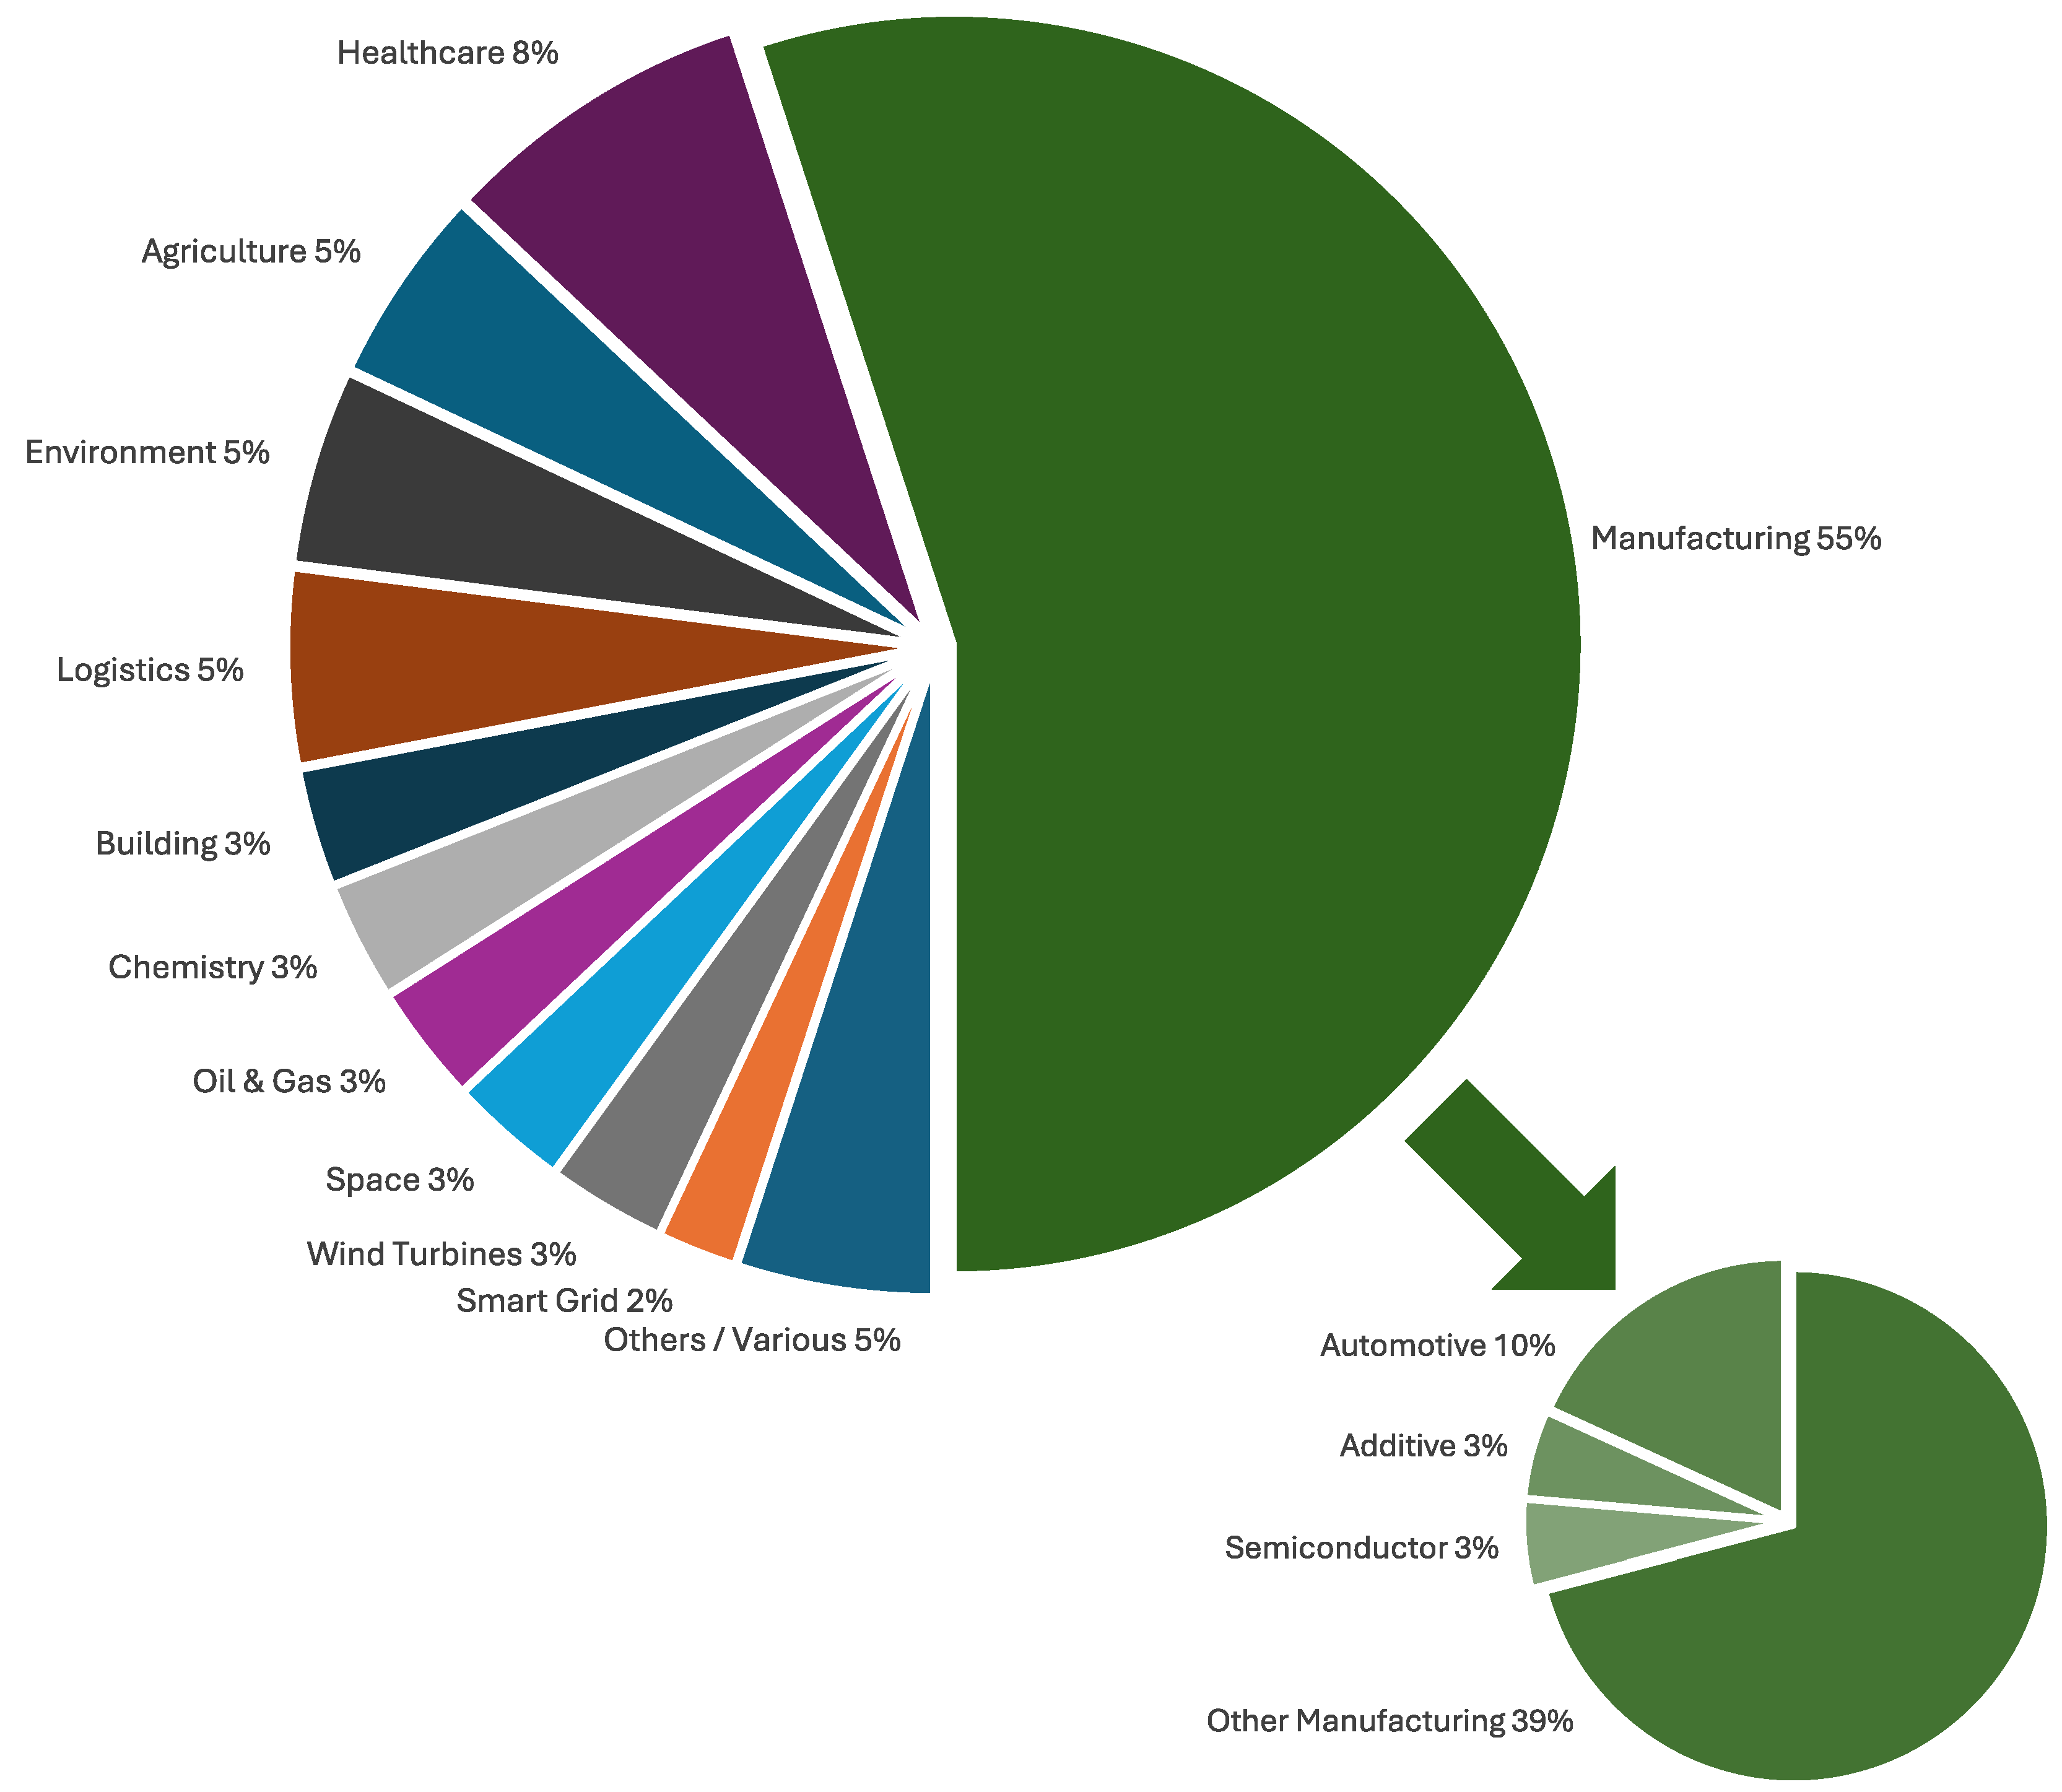
Figure 1. Application domains of data quality in cyber-physical systems and IoT environments (based on Goknil et al. [7]).
Iot 06 00063 g001
Figure 2. Illustration of the CBR cycle with the corresponding knowledge containers (based on Aamodt and Plaza [21]).
Iot 06 00063 g002
Figure 3. The data quality management cycle according to Bertrand et al. [11].
Iot 06 00063 g003
Figure 4. Procedure of using CBR for detection of DQIs, with references to DQMC: (1)–(4).
Iot 06 00063 g004
Figure 5. The Vocabulary for Representing an Event in the Data Stream Format As a Case (Adapted from and Extended Based On Schultheis et al. [49]).
Iot 06 00063 g005
Figure 6. The undesired mapping in the DQI of a missing sensor value (based on Schultheis et al. [49]).
Iot 06 00063 g006
Figure 7. The desired mapping in the DQI of a missing sensor value.
Iot 06 00063 g007
Figure 8. The proposed hierarchical similarity measures for the DQI type of missing sensors.
Iot 06 00063 g008
Figure 9. The undesired mapping in the DQI of a time shift.
Iot 06 00063 g009
Figure 10. The desired mapping in the DQI of a time shift.
Iot 06 00063 g010
Table 1. The Three Categories of Knowledge-Poor Similarity Measures for Time Series, With Example Algorithm for Each Category (according to Malburg et al. [47]).
           Category 1           Category 2           Category 3
Similarity measures that can only be applied to time series of the same length. These compare only the values at the corresponding times.Similarity measures that can be applied to time series of different lengths and consider not only the values, but the time points themselves.Similarity measures, like those in Cat. 2, but that can detect stretching and compression in addition.
List Mapping [47]Smith–Waterman Algorithm (SWA) [53]Dynamic Time Warping (DTW) [54]
Table 2. Overview of the specified DQI types with categorization, issue type, key challenge, and solution approach.
Missing Sensor Values (Section 4.3.1)Missing Sensors (Section 4.3.2)Time Shift (Section 4.3.3)
Categorization (Goknil et al. [7])Missing DataMissing DataNoise
Issue Type (Verhulst [38])CompletenessCompletenessCorrectness
Key ChallengeIndividual values are missing, but values are not always logged continuously, making it difficult to determine whether a failure has occurred.Unclear whether sensor time series are intentionally excluded or unintentionally missing.Time shifts are not reliably detected by common measures like DTW.
Solution ApproachUse of a weighted DTW-based similarity measure that selectively identifies deviations in time series.Comparison on stream level, with strong penalties for missing mappings when metadata matches.Increased weighting of the timestamp to explicitly penalize time-based deviations.
Table 3. Confusion matrix for the identification of missing sensor value failure.
Actual PositiveActual Negative
Predicted Positive53
Predicted Negative4313
Table 4. Confusion matrix for the identification of missing sensor failure.
Actual PositiveActual Negative
Predicted Positive00
Predicted Negative25475
Table 5. Confusion matrix for the identification of time shift failure.
Actual PositiveActual Negative
Predicted Positive01
Predicted Negative15368
Table 6. Performance measures calculated based on the confusion matrices.
Performance
Measure
Missing Sensor ValueMissing SensorTime ShiftAverage Value for
Overall CBR Approach
Accuracy 0.0181 0.9500 0.9583 0.6421
Precision 0.6250 0.0000 0.0000 0.2083
Recall 0.0115 0.0000 0.0000 0.0038
Specificity 0.5000 1.0000 0.9973 0.8324
F1-Score 0.0225 0.0000 0.0000 0.0075
False Positive Rate 0.5000 0.0000 0.0027 0.1676
False Negative Rate 0.9885 1.0000 1.0000 0.9962
Disclaimer/Publisher’s Note: The statements, opinions and data contained in all publications are solely those of the individual author(s) and contributor(s) and not of MDPI and/or the editor(s). MDPI and/or the editor(s) disclaim responsibility for any injury to people or property resulting from any ideas, methods, instructions or products referred to in the content.