4.1. Model Performance Metrics
In order to evaluate the performance of our Convolutional Neural Network models, we employed the following key metrics: Mean Squared Error (MSE), Mean Absolute Error (MAE), and Root Mean Squared Error (RMSE). These metrics deliver insights into the model’s accuracy in predicting PL based on previously unseen data.
MSE (Mean Squared Error) measures the average of the squares of the differences between each predicted value from the CNN models and the actual measured values, or ground truth. This metric gives an idea of how close the predictions are to the actual values, with more emphasis on larger errors. The MSE is calculated as follows:
where
n = represents the total number of measured PL values or data points.
= represents the measured PL value for the i-th data point.
= represents the predicted PL value for the i-th data point.
MAE (Mean Absolute Error) measures the average of the absolute differences between each predicted value and the corresponding measured value. This metric gives a linear score without amplifying the larger errors as much as MSE. The MAE is calculated as follows:
where
n = represents total number of measured PL values or data points.
= represents the measured PL value for the i-th data point.
= represents the predicted PL value for the i-th data point.
RMSE (Root Mean Squared Error) measures the average magnitude of the differences between predicted and measured values. This metric can express error in terms of the original measurement units, as it represents the square root of the MSE. It also reflects the variability of the prediction errors. The RMSE is calculated as follows:
where
n = represents the total number of measured PL values or data points.
= represents the measured PL value for the i-th data point.
= represents the predicted PL value, for the i-th data point.
In the context of regression, a model that offers good predictive capabilities should have MSE, MAE, and RMSE metric values as low as possible, as these metrics reflect better alignment with the ground truth data.
4.2. CNN Models Performance Analysis
To explore the influence of each of the features provided by the dataset on the resulting PL predictions, we experimented with multiple CNN models that use different combinations of features. All CNN models include the distance between the transmitting and receiving antennas as a mandatory input feature. The error metrics derived by the evaluation of each model are presented in
Table 4.
The evaluation of various CNN models highlights the influence of different input features on PL prediction accuracy. The baseline model, CNN d, which relies solely on distance as input, yields an RMSE of 10.86, establishing a reference for comparison. It is expected that this model exhibits poorer performance than the following ones, as its training relies on a reduced feature set with limited correlation to PL. Therefore, its ability to model PL is limited.
Enhancing this model with elevation data (CNN d-e) leads to a substantial improvement, achieving the lowest RMSE of 7.84, indicating that elevation is a highly informative feature to improve model accuracy. In contrast, the addition of clutter height to distance and elevation (CNN d-e-c) results in a modest increase in error (RMSE 9.43), suggesting that while clutter may contribute to specific contexts, it does not improve accuracy beyond the benefit already provided by elevation. The CNN d-c model, using distance and clutter height, performs similarly (RMSE 9.34).
Models incorporating altitude show less favorable results. The CNN d-a model, combining distance and altitude, yields a higher RMSE of 11.40, implying a limited value in altitude alone. The combined use of elevation and altitude in CNN d-e-a leads to the poorest performance (RMSE 16.53), likely due to feature redundancy, as both of those features convey similar information. Elevation denotes the height above ground level, while altitude refers to height above sea level. As the distance from the ground increases, the distance from sea level is expected to increase too. This redundancy can confuse the CNN during training, leading to poorer generalization and higher prediction errors. Moreover, altitude measurements can have higher uncertainty or noise compared to other features, especially in a real-world, suburban setting. Incorporating noisy features can degrade model performance, as the CNN may overfit to irrelevant fluctuations rather than underlying patterns.
However, supplementing this combination with clutter height (CNN d-e-a-c) improves performance (RMSE 9.97), suggesting that clutter height information may help the training process by minimizing the effect of redundancy or noise from altitude and elevation. Similarly, the CNN d-a-c model (RMSE 9.87) shows that even without elevation, a carefully chosen mix of features can yield competitive performance.
In general, the analysis underscores the dominant role of elevation data in improving CNN-based PL prediction, while also revealing complex feature interactions that must be carefully balanced to achieve optimal accuracy.
We conclude that the best CNN model for PL prediction is CNN d-e. This model achieves the lowest MSE, MAE, and RMSE metrics among all the CNN models listed. This implies that even features that are considered fundamental in the field of PL prediction, such as distance and elevation, offer sufficient information for accurate PL predictions across links in rural and suburban terrains. The inclusion of more features degrades the performance of our models, implying that the additional features fail to contribute further relevant information for PL estimation.
Figure 4 provides a bar plot of the RMSE metrics for each CNN model trained. All CNN models exhibit relatively low error rates within the range (7.5 dB, 12.5 dB). It can be observed clearly that CNN d-e outperforms its counterparts in terms of RMSE.
In
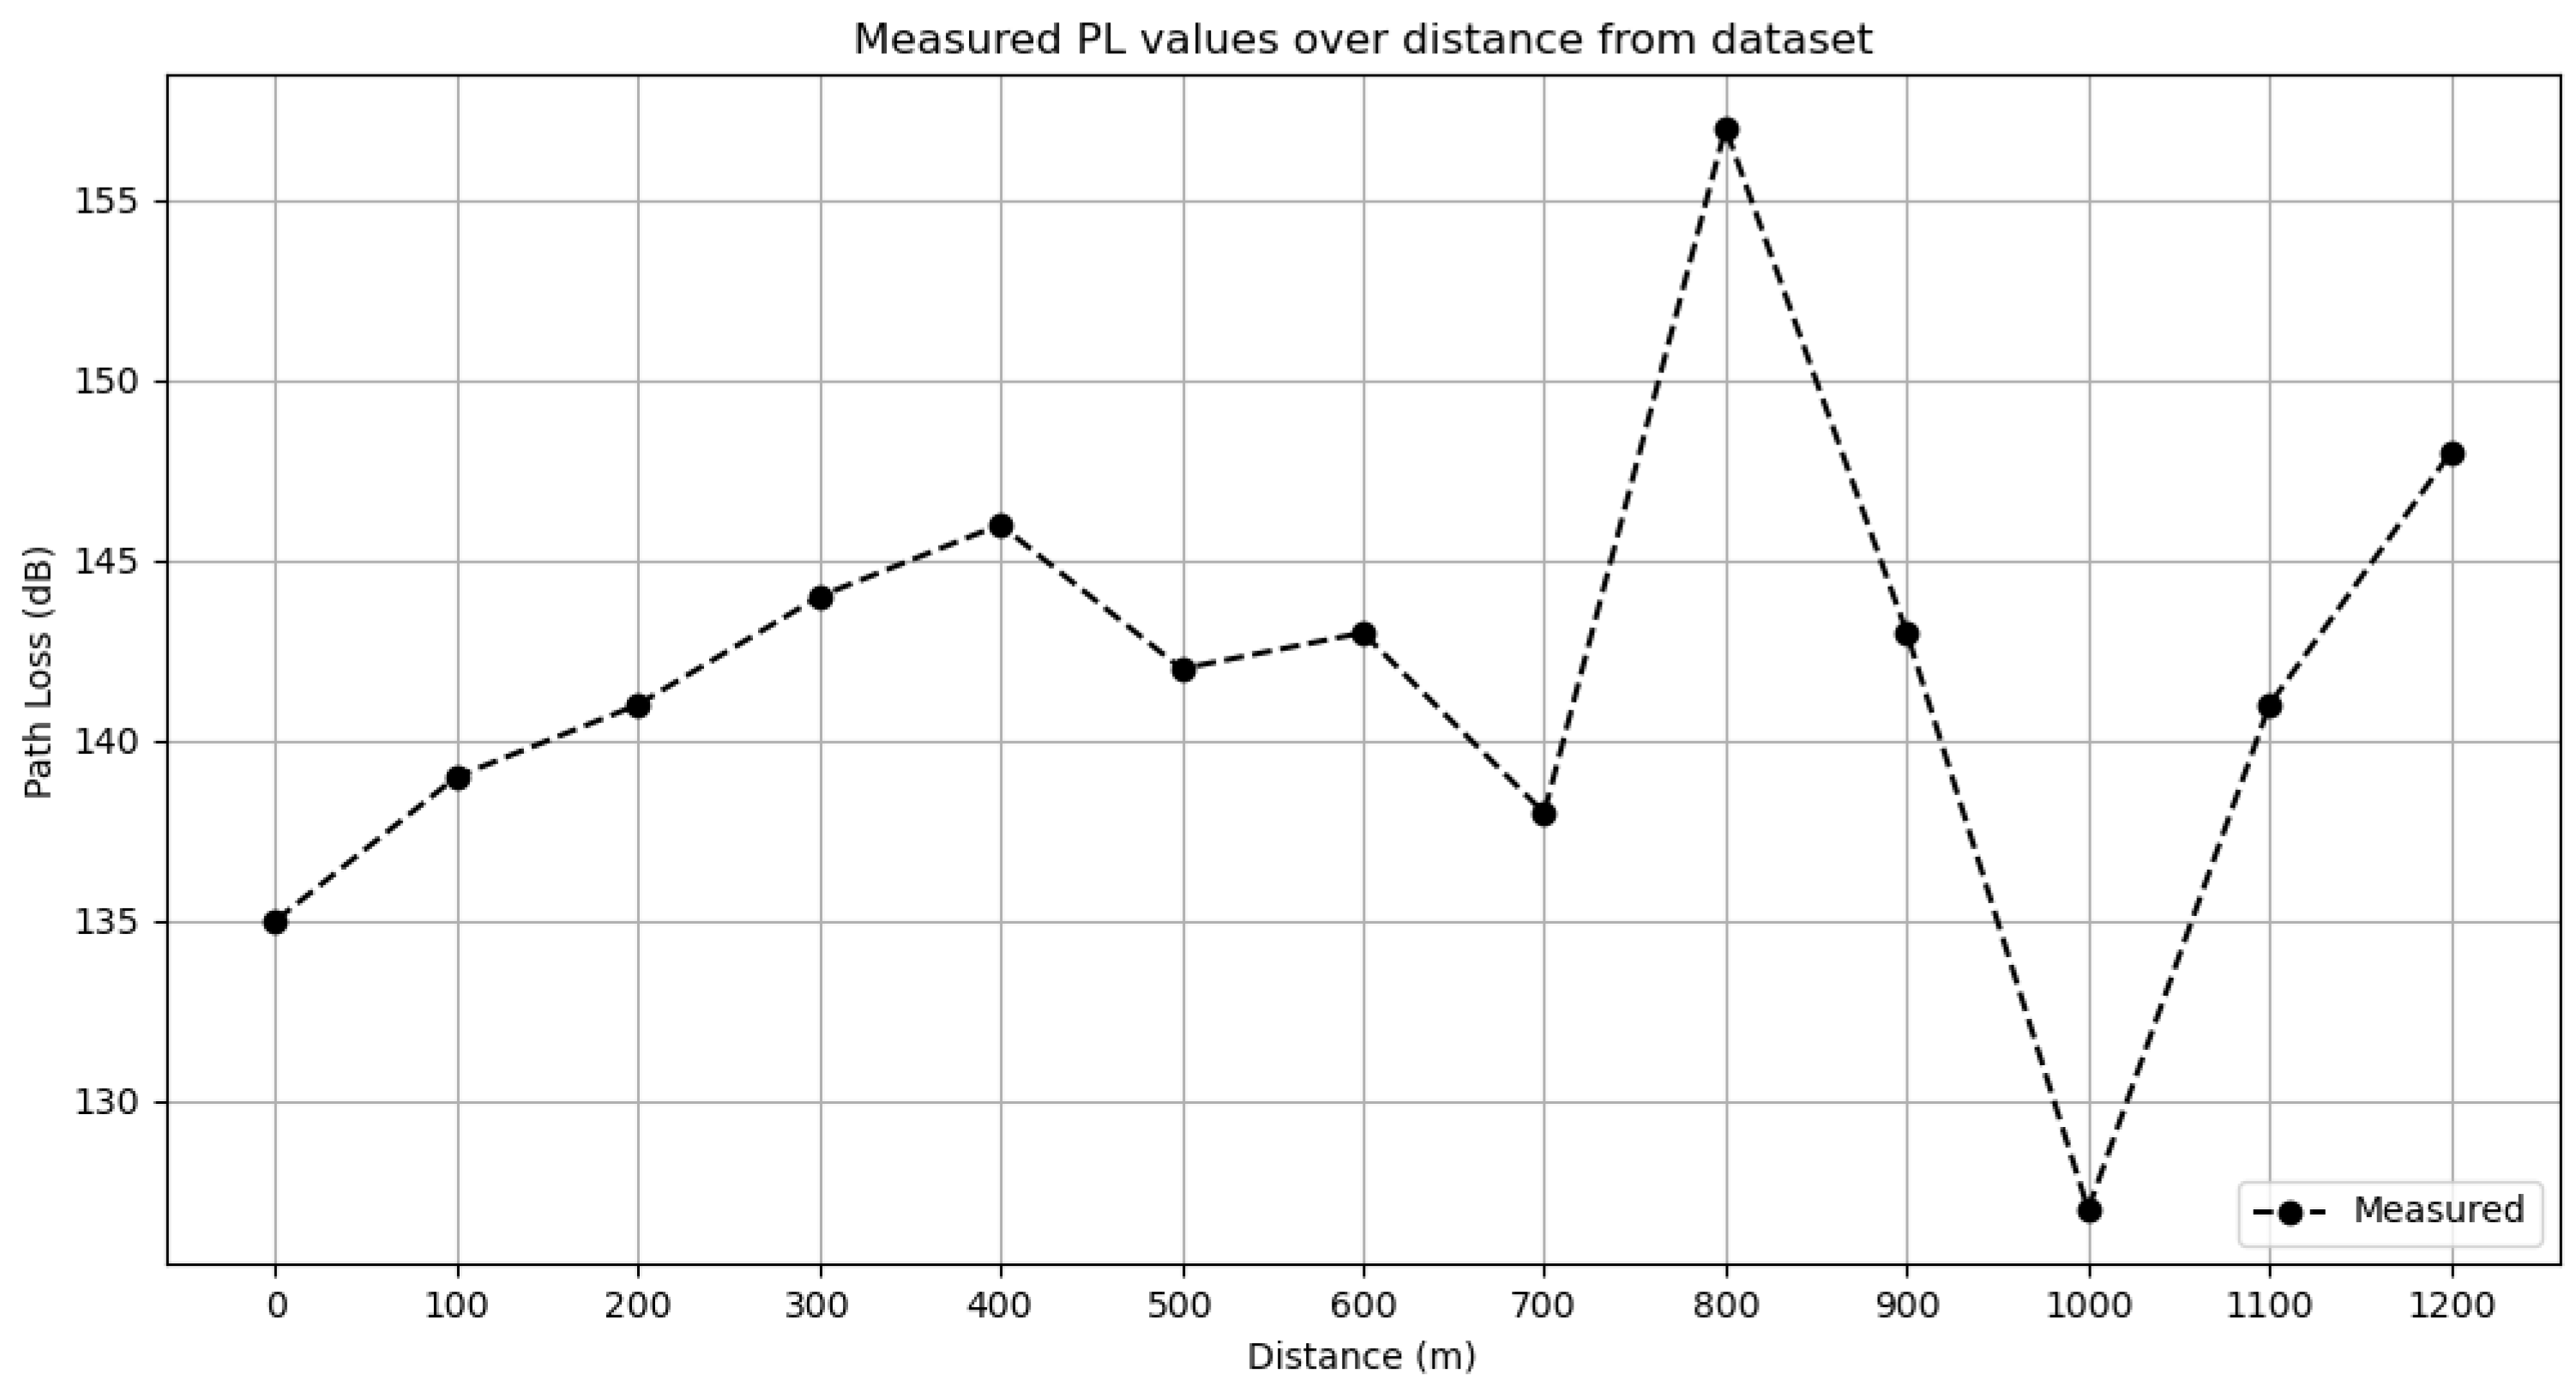
Figure 5, a line plot illustrates the measured PL values from the dataset and the predicted PL values from the various CNN models employed with respect to distance. As anticipated, the CNN d-e model exhibits a better fit to the measured data than the propagation models, aligning with its observed lower error rates. Noticeable discrepancies appear between predicted and measured PL values at 800 m and 1000 m, coinciding with deviations from the general PL trend within the dataset. PL tends to increase with the square of the distance, and the deviations in the measured PL values at 800 m and 1000 m can be attributed to errors in the data collection process and variations in the terrain, such as potential obstacles between the measurement and base station antennas. Moreover, only survey route Z explores distances beyond 883 m, and therefore, the model has limited exposure to the characteristics of PL at these distances and, consequently, its ability to learn is also limited. While CNN models can adapt to some extent to those discrepancies, fitting those observations more accurately would imply overfitting.
4.3. Propagation Models Performance Comparison
In order to further evaluate the performance of our CNN model, we compare the best of our proposed CNN models, notably CNN d-e, with the propagation models discussed above. The findings of this comparative evaluation clearly illustrate that the CNN model achieves the lowest MSE and MAE errors among all well-known models and thus surpasses conventional approaches in accurately predicting PL, thereby validating the application of deep learning methodologies in this domain.
Table 5 demonstrates the error metrics for all propagation models’ predictions with respect to the measured PL values from the dataset.
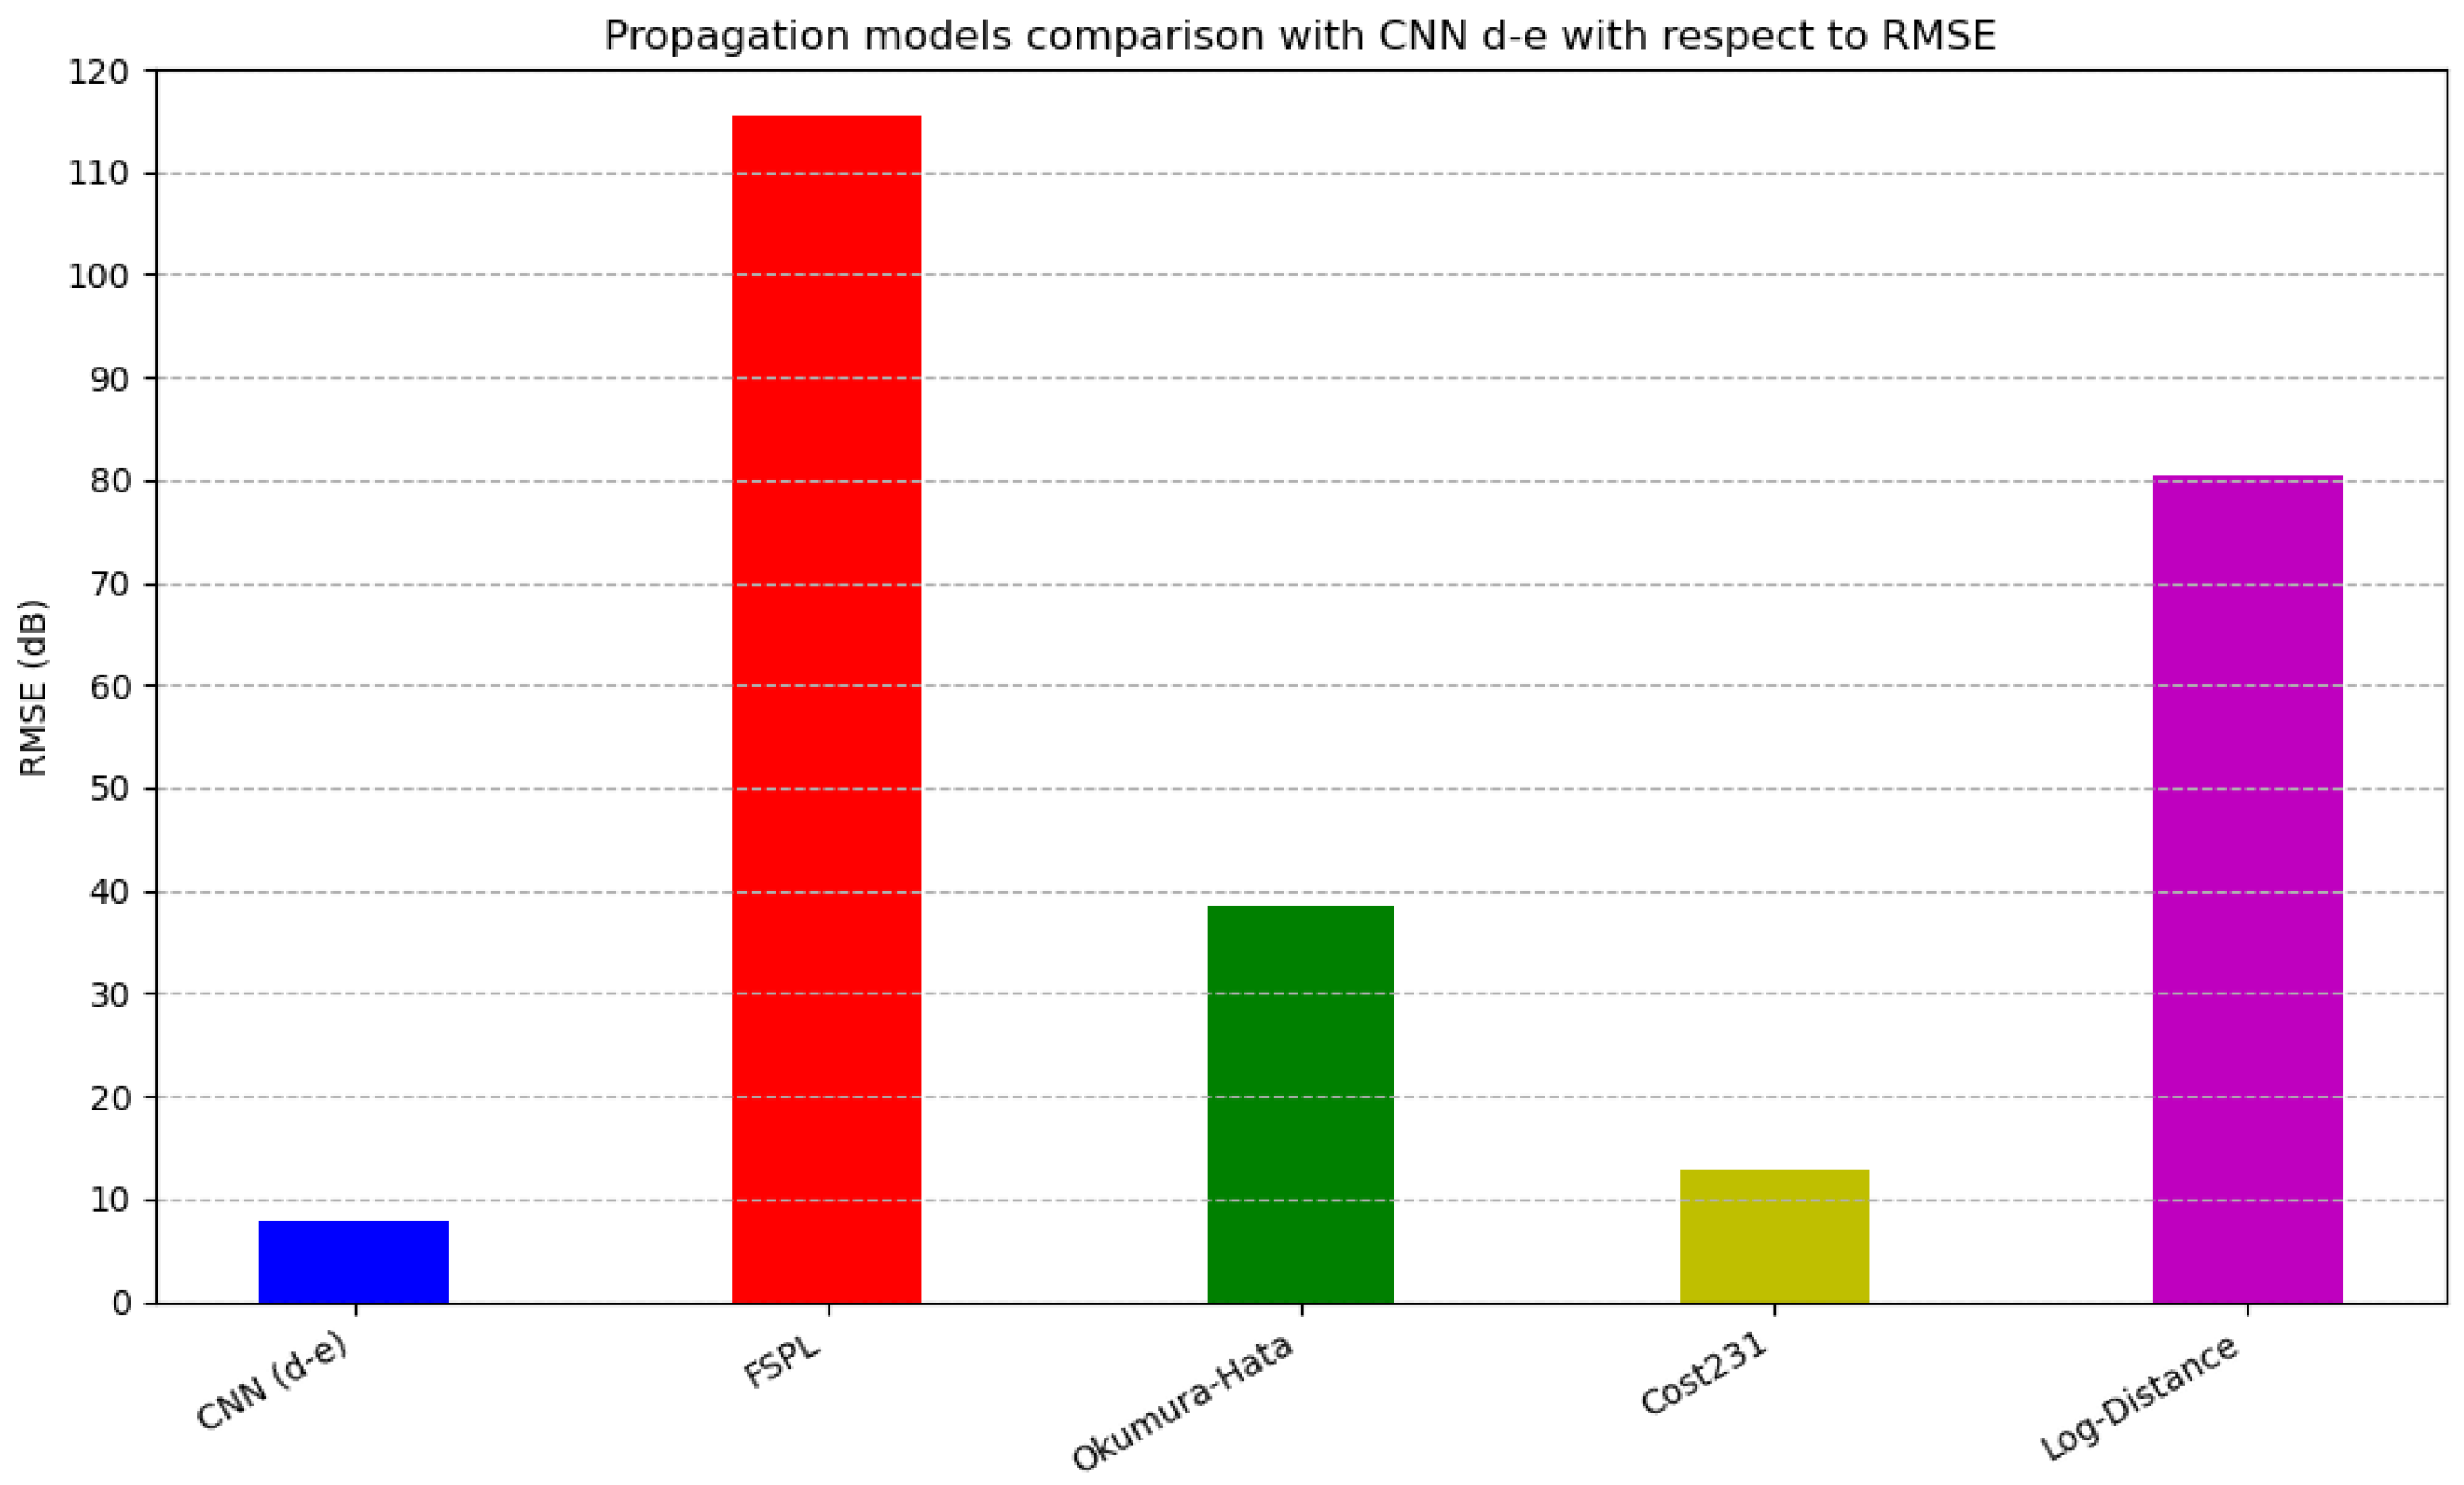
Figure 6 depicts the RMSE metrics of the CNN d-e model and the benchmark propagation models. All propagation models demonstrated higher RMSE values than CNN d-e, as well as other CNN models, rendering CNN d-e the best PL predictor. The higher error rates of commonly used propagation models, compared to the CNN model’s performance, imply that, while real-world applications achieve good enough QoS using those propagation models, the use of CNN in such applications could provide substantial improvements in QoS by allowing greater liberty in cluster head placement.
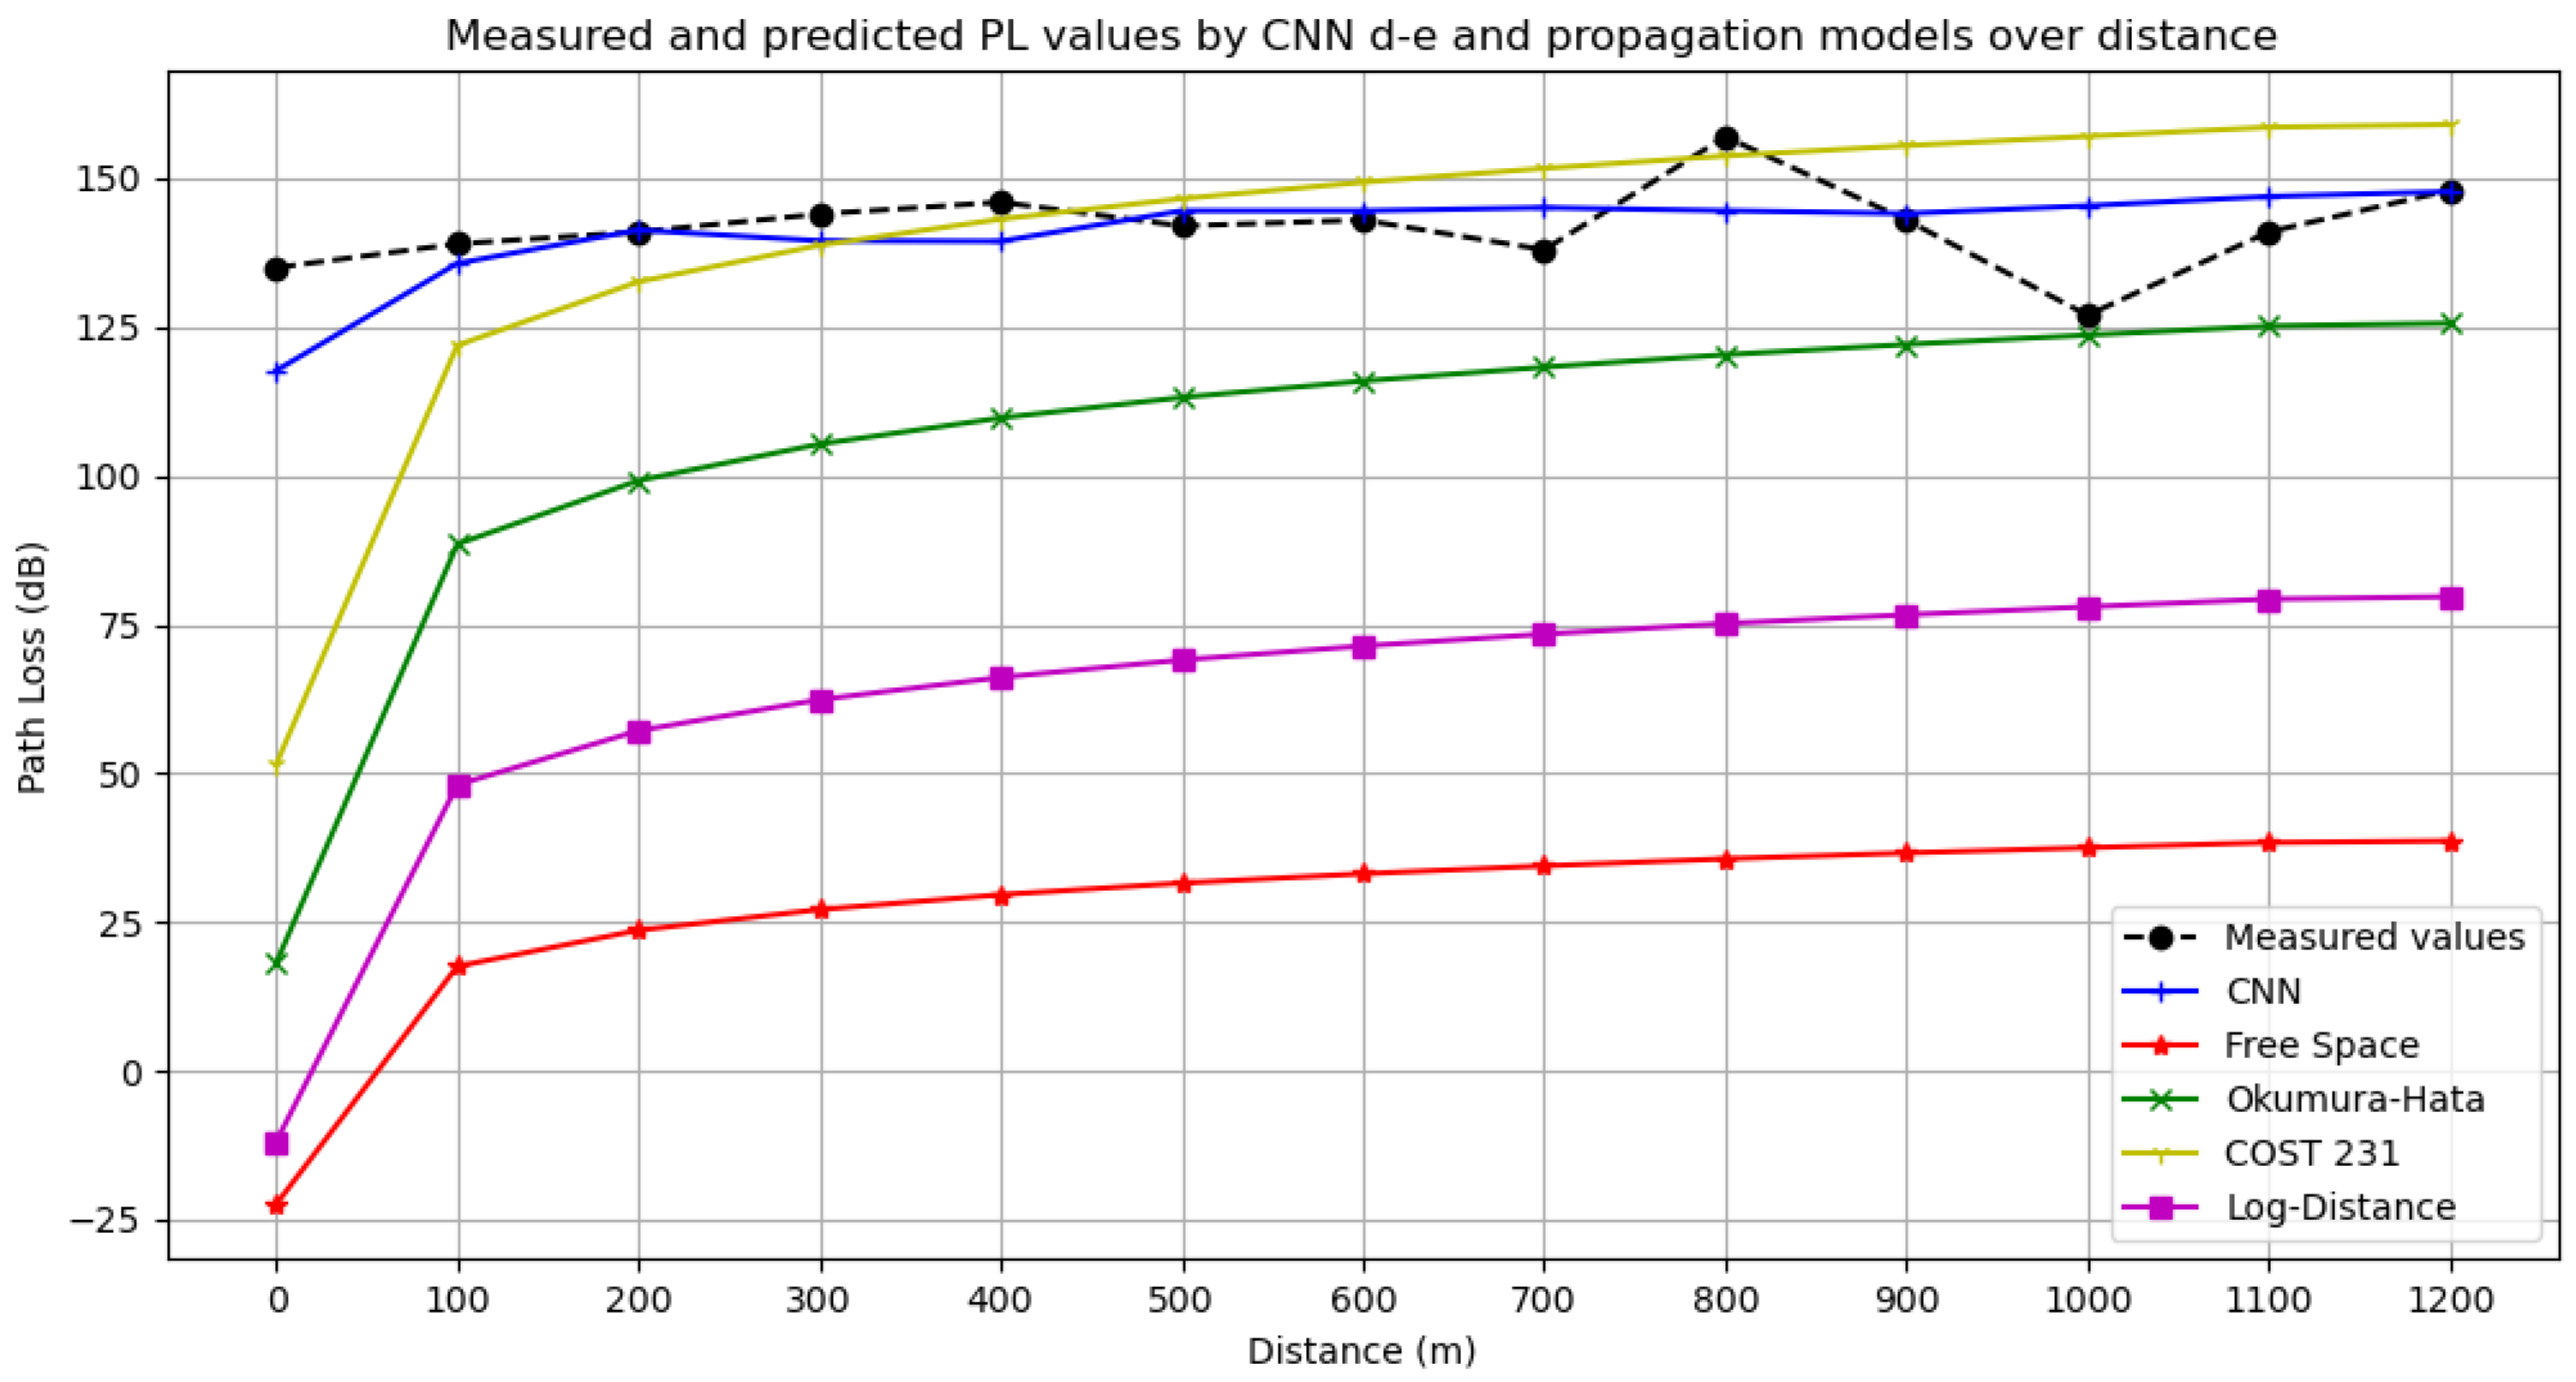
Figure 7 illustrates the measured PL values alongside the predictions from the best performing CNN d-e model and the propagation models discussed over distance. The CNN model exhibits excellent adaptability, with predictions closely aligned with the measured values. The FSPL and Log-Distance models struggled to accurately predict the measured PL values and showed strong deviation from them. This can be attributed to the assumptions of free space and line-of-sight visibility used in those models, which do not hold in the suburban terrain where measurements were made. FSPL serves as a reference for the minimum expected PL values with respect to distance, while the poor performance of Log-Distance implies the existence of obstacles and interference in a suburban terrain. The Okumura–Hata model demonstrated lower accuracy compared to the CNN model, primarily because its design is optimized for frequencies up to 1500 MHz, resulting in underestimated PL values at higher frequencies. Although the COST 231 model exhibited commendable performance, the CNN d-e model proved superior in terms of the error metrics. These results are consistent with the lower MSE, MAE, and RMSE values observed across all benchmark propagation models.
A more detailed presentation of the performance comparison between CNN d-e and the propagation models is presented in
Table 6. The Absolute Percentage Error (APE) of the predicted PL values from either the CNN d-e or the traditional propagation models, relative to the measured values, is presented per 100 m of distance. We use APE to quantify the deviation, in percentage, of each predicted PL value, at 100 m intervals, from the measured PL values. APE is calculated using the following equation:
where
Table 6 thoroughly verifies that CNN d-e has the lowest percentage deviation from the measured PL data per 100 m distance from all conventional propagation models. In some instances, a propagation model might exhibit a lower deviation from the corresponding measured PL values; however, the CNN model consistently maintains low deviation across all distances. The CNN model might be able to achieve even lower deviations and error rates by augmenting the training dataset with more diverse PL measurements, an advantage not offered by conventional PL propagation models.
Table 6.
Performance comparison of CNN d-e and propagation models per 100 m of distance.
Table 6.
Performance comparison of CNN d-e and propagation models per 100 m of distance.
| Distance | CNN d-e | FSPL | Okumura–Hata | COST 231 | Log-Distance |
|---|
| 0 m | 1.97% | 116.62% | 86.61% | 61.85% | 107.97% |
| 100 m | 2.17% | 87.37% | 36.31% | 12.27% | 64.57% |
| 200 m | 0.52% | 83.25% | 29.64% | 5.94% | 58.62% |
| 300 m | 2.39% | 81.18% | 26.85% | 3.64% | 55.86% |
| 400 m | 4.50% | 79.73% | 24.84% | 1.95% | 53.90% |
| 500 m | 3.61% | 77.78% | 20.29% | 3.24% | 50.54% |
| 600 m | 3.37% | 76.84% | 18.92% | 4.44% | 49.24% |
| 700 m | 4.06% | 75.04% | 14.29% | 9.92% | 45.96% |
| 800 m | 6.69% | 77.31% | 23.34% | 2.05% | 51.37% |
| 900 m | 5.65% | 74.40% | 14.62% | 8.74% | 45.57% |
| 1000 m | 20.73% | 70.47% | 2.63% | 23.68% | 37.66% |
| 1100 m | 9.85% | 72.79% | 11.22% | 12.48% | 42.93% |
| 1200 m | 5.26% | 73.90% | 15.10% | 7.48% | 45.37% |
