Article

Power–Packet Conversion Methods and Analysis of Scheduling Schemes for Wireless Power Transfer

1
Electronics, Information and Media Engineering Major, Nippon Institute of Technology, Saitama 345-8501, Japan
2
Faculty of Engineering, Tokyo University of Science, Tokyo 125-8585, Japan
3
Graduate School of Systems Design, Tokyo Metropolitan University, Tokyo 191-0065, Japan
4
Faculty of Science and Engineering, Doshisha University, Kyoto 610-0321, Japan
5
DKK Co., Ltd., Kanagawa 221-0052, Japan
*
Author to whom correspondence should be addressed.
Submission received: 13 March 2025 / Revised: 30 April 2025 / Accepted: 1 May 2025 / Published: 8 May 2025

Abstract

:
Recently, electromagnetic wireless power transfer (WPT) has emerged as a promising technology for supplying power to multiple terminals. Previous studies have devised packet transmission methods, commonly used in telecommunication, for power analysis. This study develops a simulator that calculates the received power by integrating a power–packet conversion method, based on previous research. The simulator incorporates several scheduling functions to facilitate the investigation of the efficiency of the power-feeding methods. This study analyzes the efficacy of a first-come–first-served (FCFS) method, a round-robin (RR) method, and a multilevel feedback queue (MFQ) scheme for wireless power transfer, all of which were devised based on existing scheduling methods used in operating systems. Simulation results show that, although the FCFS method is simple, it may lead to battery depletion due to delayed power supply, particularly in terminals with lower initial battery levels. The RR method improves fairness by allocating the power supply in time slices; however, its performance is sensitive to the slice duration. The MFQ method, which incorporates a promotion mechanism based on battery status and power demand, exhibits higher adaptability, achieving efficient and balanced power distribution even when terminals differ in distance from the transmitter or in power consumption. These evaluations were conducted using a proposed power–packet conversion method that discretizes continuous power into packet units, allowing for the application of communication network-inspired scheduling and control techniques. The capacity to construct such models enables the simulator to analyze the flow and distribution of power, predict potential issues that may arise in real systems in advance, and devise optimal control methodologies. Moreover, the model can be employed to enhance the efficiency of power management systems and construct smart grids, and it is anticipated to be utilized for the integration of power and communication systems.

1. Introduction

Wireless power transfer (WPT) has garnered significant attention in diverse disciplines owing to its potential for application in a wide variety of fields. In the context of everyday electronic devices such as smartphones and wearable devices, WPT enhances convenience by eliminating the need for charging cables and significantly streamlining the charging process for frequently used devices [1,2,3]. In the domain of electric vehicles, the prospect of contactless charging while parked is anticipated to augment user convenience and expedite the development of charging infrastructure [4,5]. In the medical field, WPT presents novel opportunities, particularly for medical devices implanted in the body. For instance, cardiac pacemakers and insulin pumps can benefit from a wireless energy supply, thereby reducing the necessity for surgical battery replacement [6,7,8]. Similarly, in industrial robots and drones, wireless charging can enhance maintenance efficiency and prolong operation time, thereby accelerating the automation processes in factories and warehouses [9,10,11]. In remote and harsh environments, WPT can provide energy to sensors and communication devices in installations that are difficult for humans to access. For instance, observation equipment installed in mountainous regions or offshore platforms can receive consistent and stable energy supply even in the absence of conventional power sources [12,13]. These characteristics can significantly expand the use of Internet of Things (IoT) devices in areas where infrastructure development is difficult. This technology has also been attracting attention in the field of space exploration and is expected to be a new means of improving the efficiency of work and observation in space by wirelessly transmitting energy from the Earth to satellites and space stations. The prospect of wirelessly supplying energy to rovers and bases during lunar and Mars explorations is a future possibility, and technological advancements are being made in these fields toward this [14].
WPT is usually achieved using four primary methods: electromagnetic induction, magnetic resonance, electric-field coupling, and electromagnetic wave (microwave) transmission [15,16]. Electromagnetic induction is commonly known as inductive power transfer (IPT), which transmits energy via magnetic fields generated between coils on the transmitter and receiver sides. IPT is one of the most widely adopted methods, seen in applications such as electric toothbrushes and smartphone charging pads [15]. Electric-field coupling, on the other hand, is referred to as capacitive power transfer (CPT), which transmits energy through electrostatic fields between paired electrodes. CPT offers advantages in terms of its thin and lightweight design, as well as compatibility with high-frequency operation, making it promising for use in wearable and compact electronic devices [16]. Among these, the electromagnetic wave method stands out for its ability to facilitate long-distance transmission and its distinct advantages for specific applications [17]. This method uses high-frequency electromagnetic waves to transmit energy, and its compatibility with relatively simple power-receiving devices suggests a wide range of potential applications. A salient benefit of the electromagnetic wave method is its capacity for transmission over longer distances, when compared with that of alternative methods. Its utilization of multiple frequencies such as 920 MHz, 2.4 GHz, 5.7 GHz, and 24 GHz, depending on the specific application and characteristics of the surrounding environment, is also advantageous [18]. The 5.7 GHz band, in particular, offers relatively substantial bandwidth, facilitating high-speed and reliable communication and power transmission. This property is particularly beneficial for avoiding interference from other frequency bands, such as the 2.4 and 5 GHz bands, which are susceptible to congestion. Furthermore, higher frequencies are associated with shorter wavelengths, which improve the directivity. This, in conjunction with beamforming techniques, enhances the efficiency of energy transmission, thereby optimizing the energy delivery to target devices. Consequently, high frequencies, such as 5.7 GHz, are particularly advantageous in terms of energy efficiency because factories and indoor environments predominantly require transmission over short distances [19]. Figure 1 illustrates the range of applications for each device according to the transmission distance in relation to the equivalent isotropic radiated power and the amount of power received.
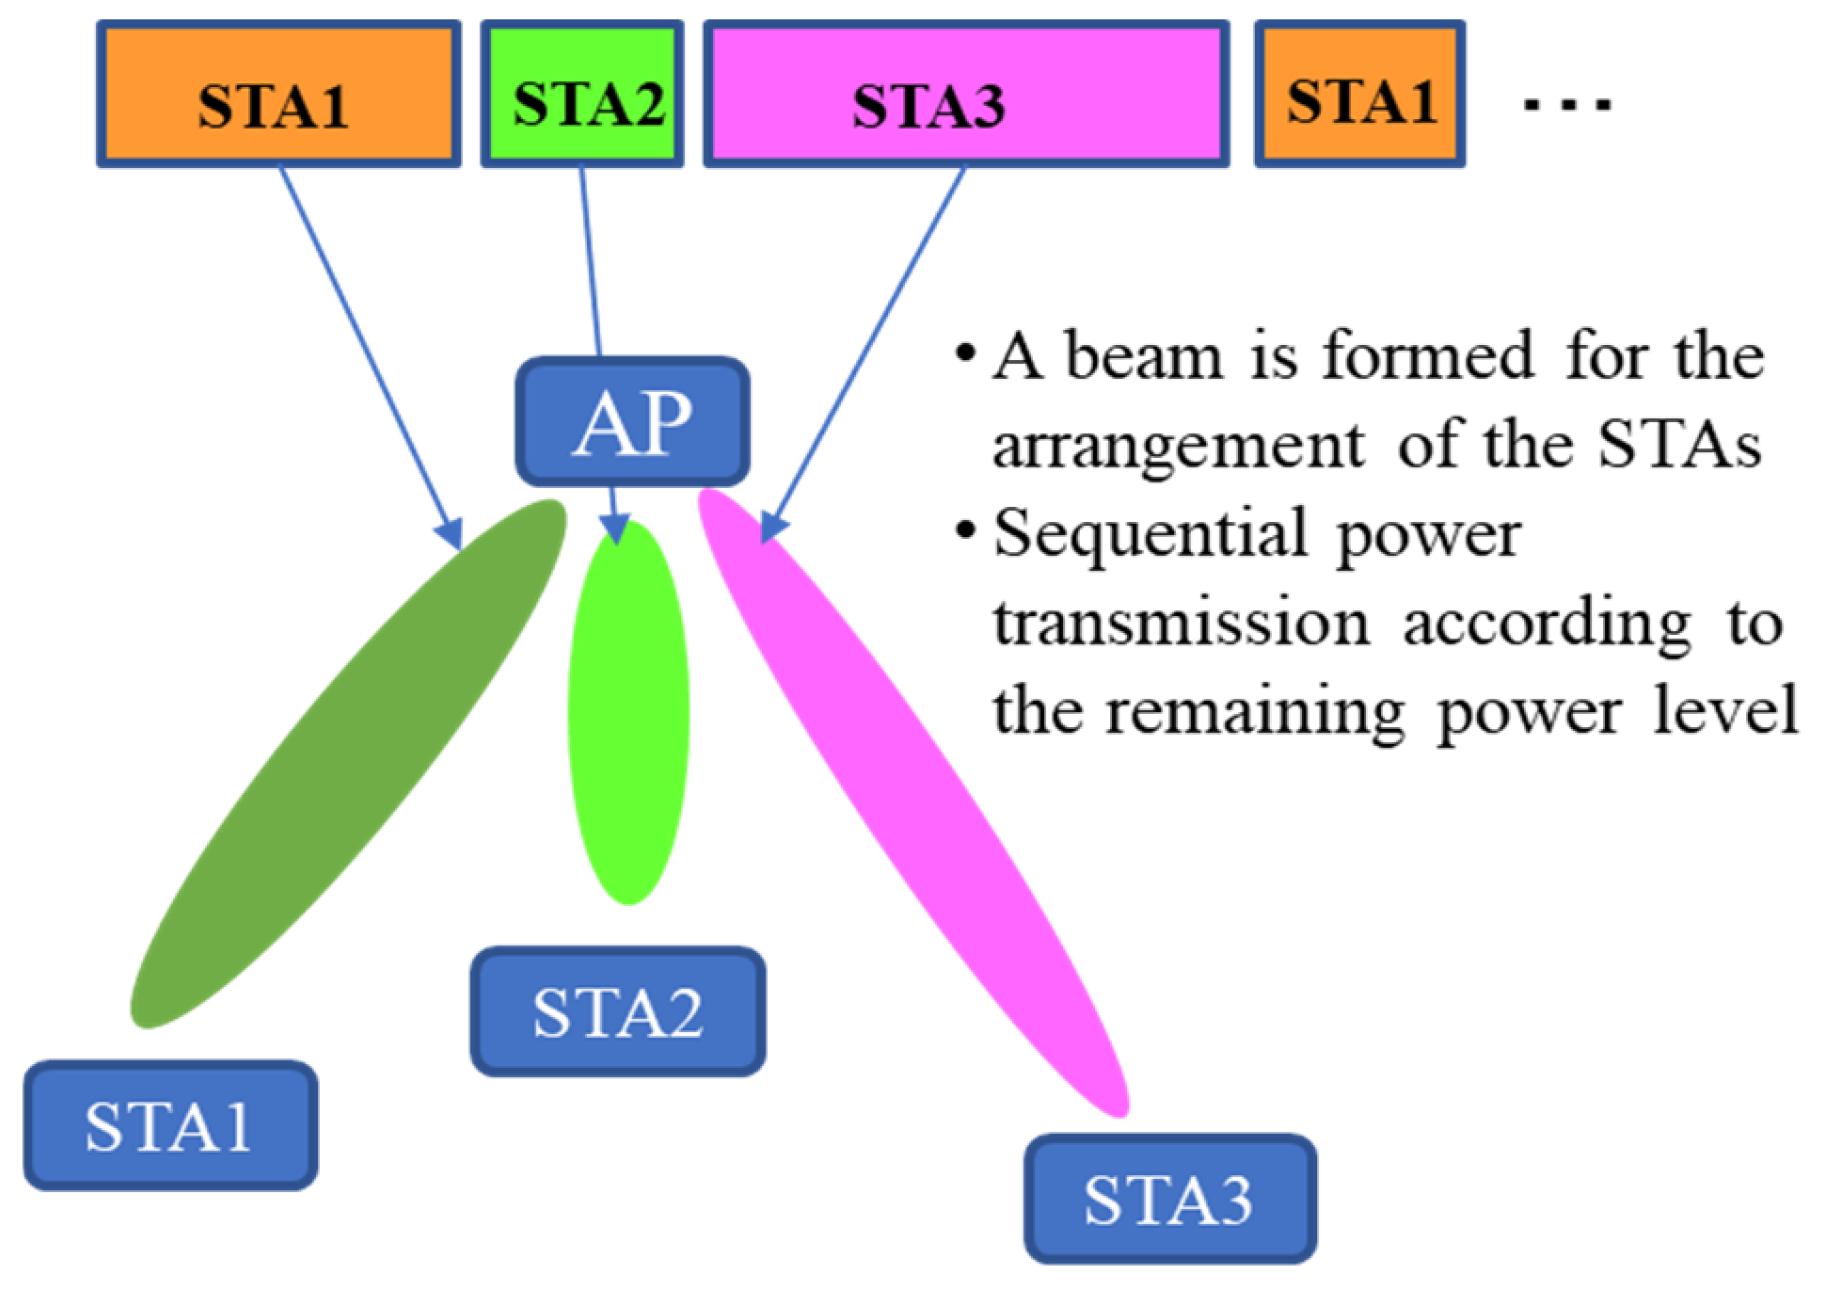
In this work, we propose an access-control methodology for scheduled power delivery to multiple power-receiving terminals (stations (STAs)) in indoor environments. To facilitate the transmission to multiple STAs, power is delivered through beamforming. The concept of power transmission through beamforming [20,21,22,23] has been extensively explored in numerous studies, with a significant focus on the development of antennas for multibeam formation. However, in the context of multibeam WPT with multiple receiving STAs, challenges exist associated with the efficient and safe supply of power to multiple receivers. Specifically, the power required for each receiver must be appropriately distributed, and energy leakage outside the target must be minimized. In addition, a beam arrangement that can accurately supply power to nearby receivers while suppressing the interference among multiple beams is required. However, the complexity of such beam control may increase the overall load on the communication system. Furthermore, indoor and factory environments are prone to energy losses owing to reflection and absorption. To address these challenges, a promising approach involves the implementation of a scheduling technology capable of managing the power supply to multiple receivers by dividing the power supply over time. This proposed approach is defined as power time-division delivery (PTDD) and allocates power to receivers according to a predetermined schedule. When employed in conjunction with beamforming, PTDD can enable more efficient and flexible power delivery. This paper proposes a PTDD-based scheduling method and aims to verify its effectiveness.
Recent studies on scheduling in power transfer have focused on storage-aware methods that take energy capacity into account, as well as enhanced power delivery schemes leveraging beamforming [24,25]. In particular, time-division scheduling methods that dynamically allocate power based on the energy state of the receiver have been studied [26], and these constitute a foundational approach for our proposed PTDD (power time-division delivery) method. Furthermore, a concept similar to ours is seen in power packet-based control methods [27], where each power packet contains metadata such as transmission time, device ID, and requested power amount, enabling fine-grained scheduling and control. However, that existing study assumes a wired power transmission network and poses challenges when applied to infrastructure-based wireless systems. In contrast, our PTDD method is designed for infrastructure-based wireless power transfer systems and features flexible and efficient power allocation under wireless environments. That is, optimal power distribution among multiple devices is a critical issue in such systems, and we address this by introducing power packetization. Our method achieves real-time and dynamic power scheduling by managing the power supplied to each device through queue control, akin to techniques used in communication networks, which is a key advantage of our approach.
The allocation of beams must also be optimized according to the remaining storage capacity and power demand of each receiver. Although scheduling is required to supply power preferentially to receivers with low storage capacities, the allocation of limited resources is also technically complex. Furthermore, if the receivers are located far from the transmitter, the power-transmission efficiency will decrease significantly because of power attenuation, and the beamforming allocation time and frequency must be adjusted to compensate for this attenuation [25,28]. Furthermore, given that power transmission is inherently analog, synchronizing transmission timing and switching power distribution among multiple receivers poses significant challenges. Unlike in telecommunication, interference does not occur between multiple beams. Rather, there is an advantage in that interference allows power to be supplied to nearby receivers that are not targeted [24]. This necessitates advanced control that utilizes the unique advantages of power transmission, such as dynamic beamforming and waveform optimization [29].
Therefore, a novel approach is required to address the limitations of analog transmission and efficiently perform scheduling while leveraging these characteristics. The configuration of multibeam power transmission is illustrated in Figure 2. Assuming that the power transmitter functions as an access point (AP), power is sequentially delivered to multiple STAs by PTDD, contingent on the remaining storage capacity of the STA and other factors. We propose a “power-equivalent packet scheme” that converts power into small packet units and dynamically controls the delivery timing to each receiver. In this scheme, the amount of power is treated pseudoactively as the communication speed and the number of packets sent and received in the communication network. The scheduling methods used in communication networks can be easily applied here. The packet-based scheduling method offers several advantages, including flexible power allocation in real time and the ability to manage the fed power with a simple receiver queue count. In other words, the power-equivalent packet method is suitable for scheduling because it can be combined with beamforming techniques to achieve efficient power delivery to multiple receivers. The solution to the following problems can be achieved using the packet-based scheduling method:
(A)
Power conversion to packets;
(B)
Optimization of power delivery by scheduling.
(A) involves methods for converting power into packets and the relationship between the attenuation and transmission time, depending on the distance from the AP. (B) involves a PTDD method that uses optimal scheduling based on the placement of STAs and power consumption of each STA. This model contains limited discussion regarding the effects of reflections and obstacles. The reason is that the received power is determined by the functionality of the ray-tracing simulator. The effects of reflections and obstacles can be fully accounted for through ray tracing. In this process, reflected waves generally follow longer paths compared to direct waves, resulting in significantly lower received power and thus having minimal impact. Moreover, when direct waves are blocked by obstacles, the received power drops drastically to a negligible value (or even zero).
Section 2 explains the bucket conversion method for power and the model of the behavior during power supply using the proposed method for each scheduling.
Section 3 evaluates the proposed method using computer simulation and shows its effectiveness. Section 4 is the conclusion, and Appendix A provides supplementary information on group power supply.

2. Methods

2.1. Proposed Power–Packet Conversion Method

As demonstrated in Figure 3, the process of transmitting power in the form of packets entails the initial conversion of a unit amount of power into packets. As the power attenuates with distance, the amount of charge per unit time decreases with distance from the transmitting antenna. This indicates that the time required to charge the same amount of power depends on the distance. In essence, the efficiency of received power in wireless power transfer (WPT) corresponds to the transmission speed in wireless communication. Additionally, the transmitted power is stored in a battery, which, in a communication system, can be likened to a queue that buffers packets. The proposed method, which converts power into packets, maps them to packet transmission times, and receive queues according to the transmission distance, is presented in Figure 4.
The transmission power is attenuated with distance; in the case of a communication system, the farther away the system is, the lower the received power becomes. To receive weak signals, the transmission rate must be reduced because the number of levels in the modulation scheme will be lower. The time required for the transmission and reception of a packet depends on the transmission speed. In instances where the received power in the vicinity is high, the transmission speed will be elevated, resulting in reduced transmission/reception time for a packet. Conversely, the transmission/reception time will be prolonged at greater distances. The number of packets that can be transmitted and received within a specified timeframe depends on the transmission distance. A similar principle applies to the conversion of supplied power into packets, where the amount of input to the queue varies. The queue is equivalent to a storage battery; if the power consumption of each STA differs, the packets input to the queue can be output or discarded according to the power consumption, thereby emulating the battery charging status. In other words, the input of packets to the queue can be regarded as a form of charging, and the output of packets from the queue (i.e., the discard rate) can be interpreted as the terminal’s power consumption.
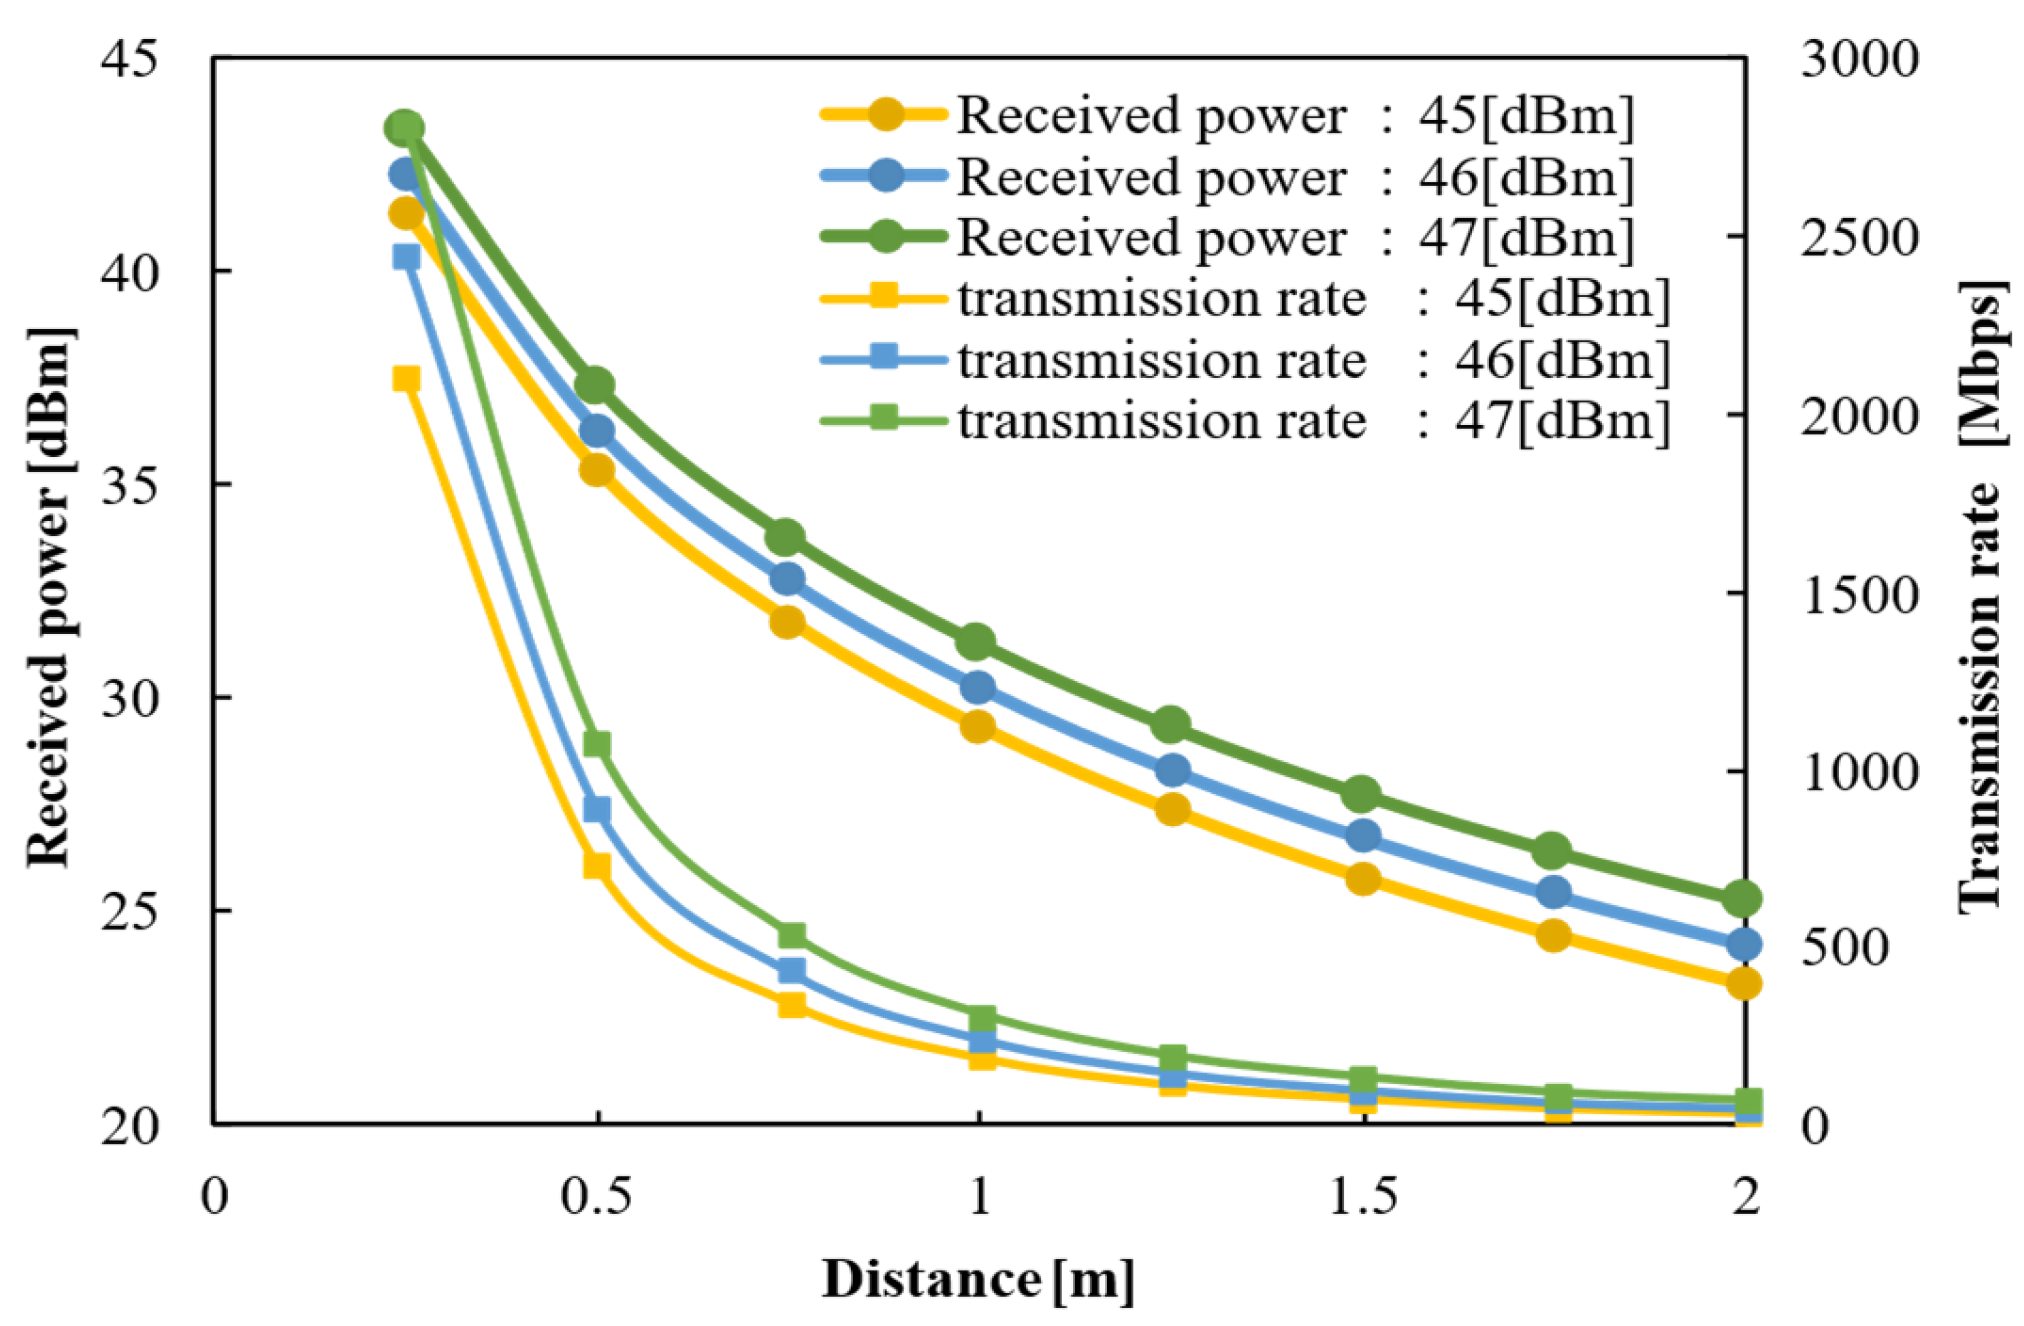
In this power–packet conversion method, the pivotal element is the calibration of the power output in watts, which facilitates the calculation of the detailed storage capacity. In accordance with the established standards for power transmission, the frequency employed falls within the 5.7 GHz band. The received power, contingent on the distance, transmission power, and transmission speed in accordance with the IEEE802.11 standard [30], are presented in Figure 5.
The relationship between the number of received packets per unit time and the transmission rate in communication is given by:
R e c e i v e d   p a c k e t n = T r a n s m i s s i o n   r a t e M b p s P a c k e t   s i z e M b i t
Note that packets are defined in terms of power, with each packet representing 1 mW. For example, inserting one packet into the queue indicates that 1 mW of power has been supplied to the battery. If one packet is defined as 1500 bytes (the maximum size of an Ethernet frame), this corresponds to transmitting 1 mW of power.
Based on the proposed method, the transmission rate is interpreted as the received power:
R e c e i v e d   p a c k e t n = R e c e i v e d   p o w e r m W P a c k e t   s i z e M b i t
The relationship between transmission time and transmission rate in communication is given by:
R e c e i v e d   t i m e s = P a c k e t   s i z e M b i t × R e c e i v e d   p a c k e t n T r a n s m i s s i o n   r a t e M b p s
According to the proposed method, where transmission rate is considered as received power, this becomes:
C h a r g i n g   t i m e s = P a c k e t   s i z e M b i t × R e c e i v e d   p a c k e t n R e c e i v e d   p o w e r m W
The transmit power is determined based on the device currently under prototype development, in accordance with the recommendations outlined in WPT Report ITU-R SM.2505 [18].
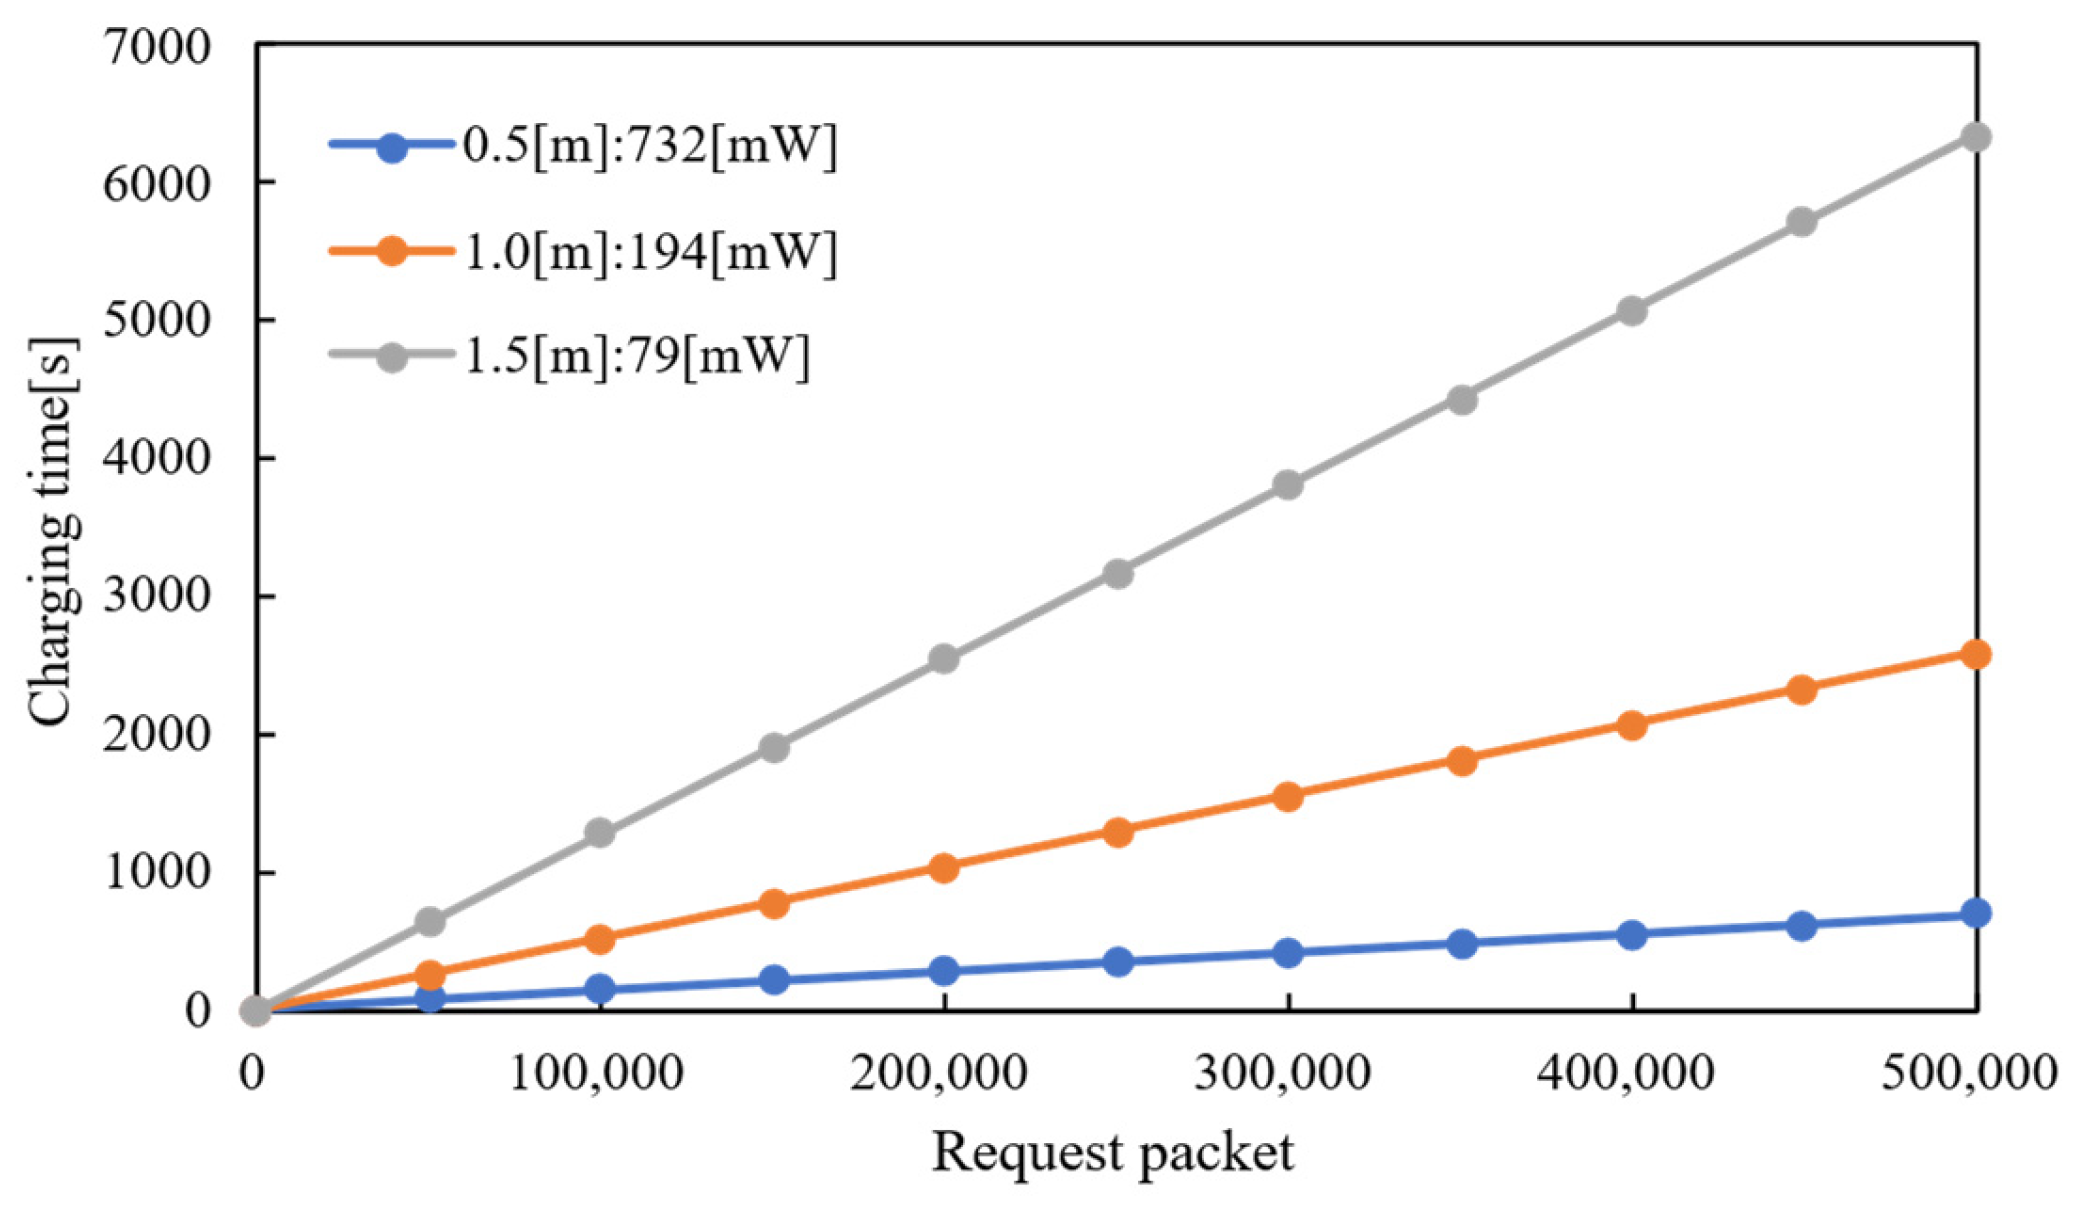
The transmit power of the AP was 32 W (45 dBm), 40 W (46 dBm), and 50 W (47 dBm). When the transmit power was set to 32 W and the received power to 29 dBm (194 mW), the distance between the AP and STA was determined to be 1 m. Assuming a packet size of 1 Mbit and power feed rate of 1 mW per packet, the number of received packets was 194 at 1 m, as calculated by Equation (2). The power supply time was calculated using Equation (4) as 2062 s when the number of requested packets was 400,000. Figure 6 shows the feeding time per distance in relation to the number of requested packets. The reason why this study evaluates the system under static and ideal conditions is that, unlike communication terminals, we assume that the terminals targeted by wireless power transfer are stationary and do not move dynamically. In other words, the transmission beam is directed toward fixed terminals without the need for beam tracking. Moreover, wireless power transfer is subject to significant attenuation, and reflected multipath components experience even greater loss. Therefore, we have confirmed that the influence on the direct wave, including interference and resonance, is minimal. However, in special cases, such as when reflective objects are located very close to the terminal, the amount of received power may be affected.
Scenarios involving mobile terminals and dynamic beam tracking fall outside the scope of this study and will be addressed as future research topics.
The conversion of 1 mW of power into one packet facilitates the calculation of the number of packets sent and the allocated feeding time for the amount of power supplied by the receiving terminal. Packetization enables the management of power flow and distribution in a manner analogous to that of a network, thereby enhancing the efficiency of the entire system. Moreover, existing network protocols and simulation tools can be utilized to facilitate the optimization of the power supply and load balancing. The capacity to construct such models enables the simulator to analyze the flow and distribution of power, predict potential issues that may arise in real systems in advance, and devise optimal control methodologies. Moreover, the model can be employed to enhance the efficiency of power management systems and construct smart grids, and it is anticipated to be utilized for the integration of power and communication systems.

2.2. Proposed Scheduling Scheme

The scheduling scheme proposed in this study involves supplying power from each terminal according to the procedure delineated in Figure 7. The battery status and power consumption of the STAs are utilized to request power from the APs; the STA that attains the power-supply request threshold initiates the sequence. Arriving power-supply requests are retained in a queue, and packets are dispatched in accordance with the power-supply request information from the head of the queue. The objective of this scheduling is twofold: first, to prevent depletion when the amount of power supplied exceeds the total amount of power consumed, and second, to extend the time for which all terminals can operate when the amount of power supplied is insufficient.

2.2.1. Proposed First-Come–First-Served Scheme

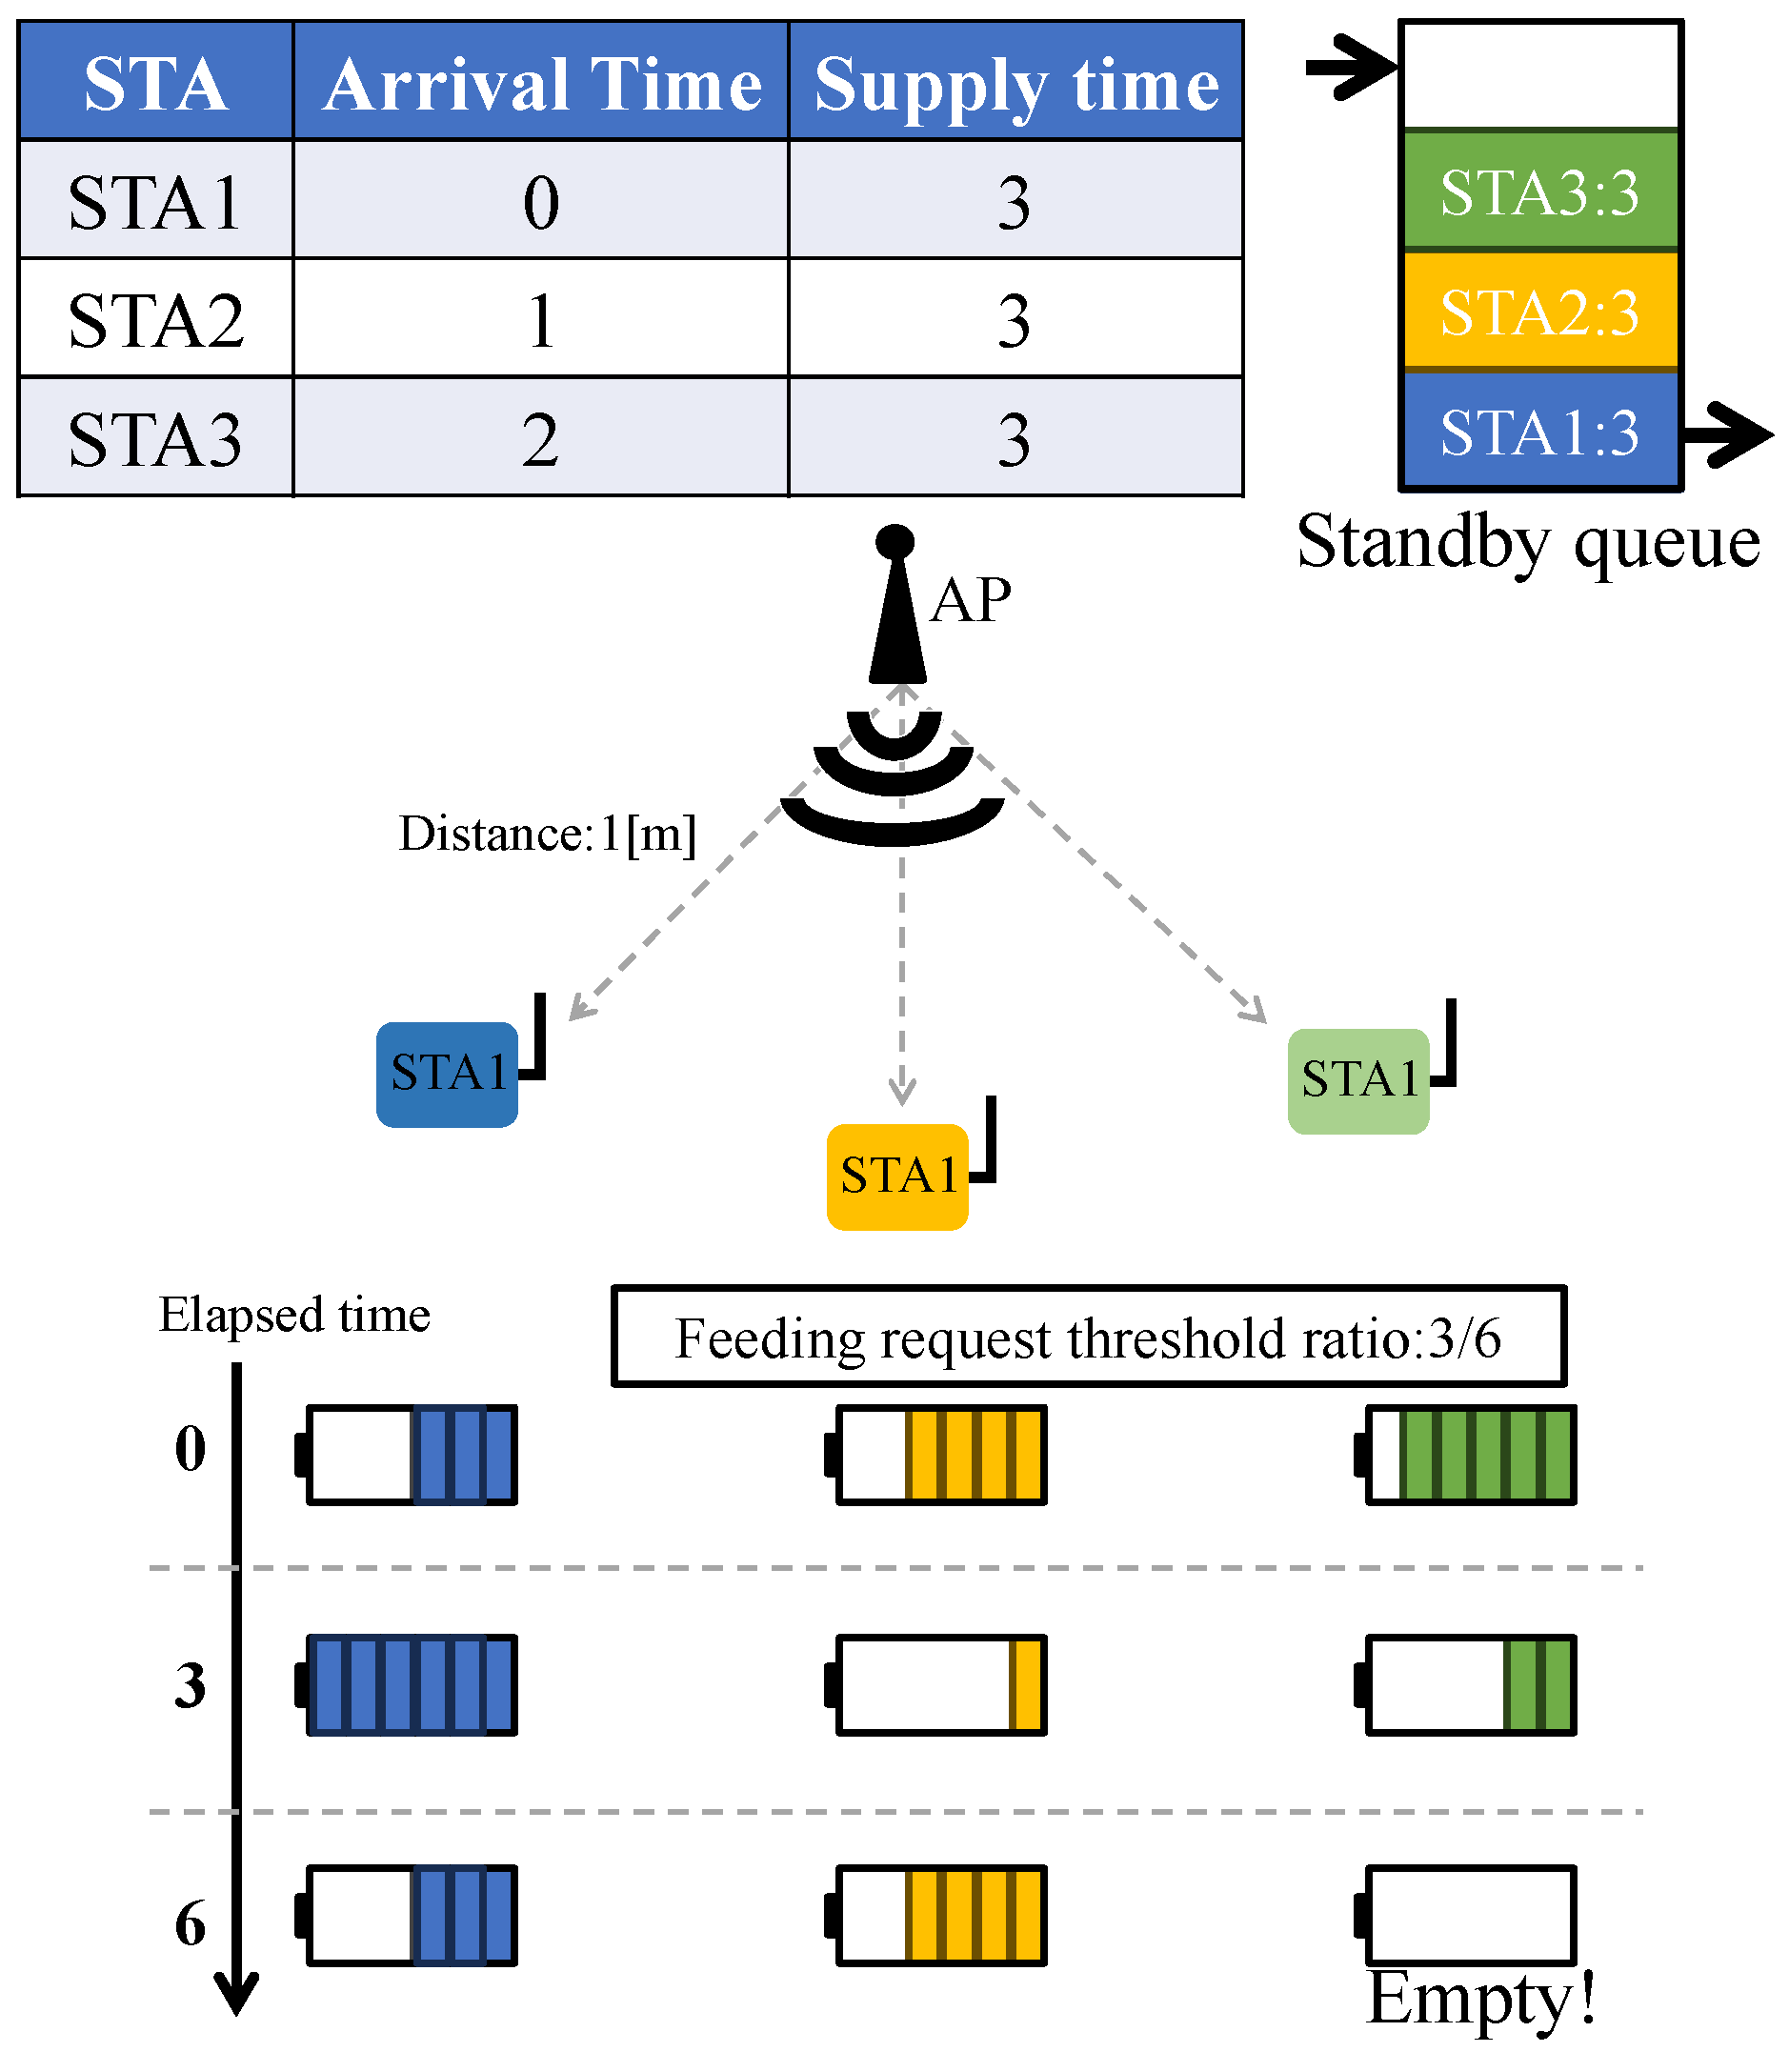
The first-come–first-served (FCFS) scheme is the simplest and most intuitive scheduling method, allocating resources according to the order of arrival of the power-supply requests. Based on the procedures in this scheme, we devise an extended scheduling scheme, as described in the following subsection. As illustrated in Figure 8, the time is allocated under the premise that three STAs are linked to one AP, with the sequence of power allocation being dictated by the order in which the STAs are connected. The supply duration is determined by the number of packets requested by the terminals, as shown in Equation (4). The status of each STA queue is depicted according to the elapsed time. It is assumed that all STAs and APs are at equal distances from one another and that the battery can be fully recharged from an empty state within a span of 6 h. The battery consumption rate is estimated to be one packet per hour (pph), and the power-supply rate is set to 2 pph. The power-supply sequence is initiated from STA1, which first attains a predefined power-supply request threshold of 3/6 owing to the disparity in its initial battery capacity. Concurrently, STA2 and STA3 sequentially submit power requests as STA1 goes through its power-supply cycle. Subsequently, STA2 is energized once STA1 completes its power-supply cycle. The designated power-supply duration for each STA is set to three hours, which covers the time it takes for the power to be replenished from the power-supply request threshold to the maximum power-supply capacity. STA3, the last STA to receive power, depletes its remaining energy in the fifth hour and fails to supply power in the sixth hour. In this example, depletion occurred because the amount of power supplied was less than the total power consumption. However, there are situations in which a terminal runs out of power, even when the amount of power supplied is greater than the total power consumption. When power-supply requests are simultaneously received from multiple terminals, the time required to initiate the power supply (response time) is extended, and the battery may get depleted. Furthermore, it is necessary to allocate a longer time to distant terminals. The presence of a terminal with a long power supply time results in an increased waiting time for the subsequent terminals. To address these issues, we proposed an extended scheduling scheme as a countermeasure.

2.2.2. Proposed Round-Robin Scheme

In this section, we propose a round-robin (RR) scheme as a solution to the FCFS problem, with the objective of providing equal opportunities for power allocation. This method ensures that all power-supply requests are allocated equal power-supply opportunities and processed sequentially. Each request is executed for a predetermined unit of time, referred to as a time slice (TS), which is critical for ensuring that each request has an equal opportunity to be processed and for enhancing the efficiency and responsiveness of the entire system. TS has been found to enhance responsiveness by facilitating frequent switching of power-supply targets. An analysis of the system behavior reveals that if the TS is too short, the overhead of switching the power-supply target will increase, thereby decreasing the efficiency. Conversely, if the TS is too long, responsiveness will be impaired. The TS concept, when employed in network systems, incurs overheads during switches, resulting in response delays and other issues. However, the TS concept in power transmission does not incur such problems because packets are only sent pseudo-simultaneously and the power is simply switched. The minimum possible value of TS varies from system to system, whereas the maximum possible value is less than the maximum feeding time of the FCFS.
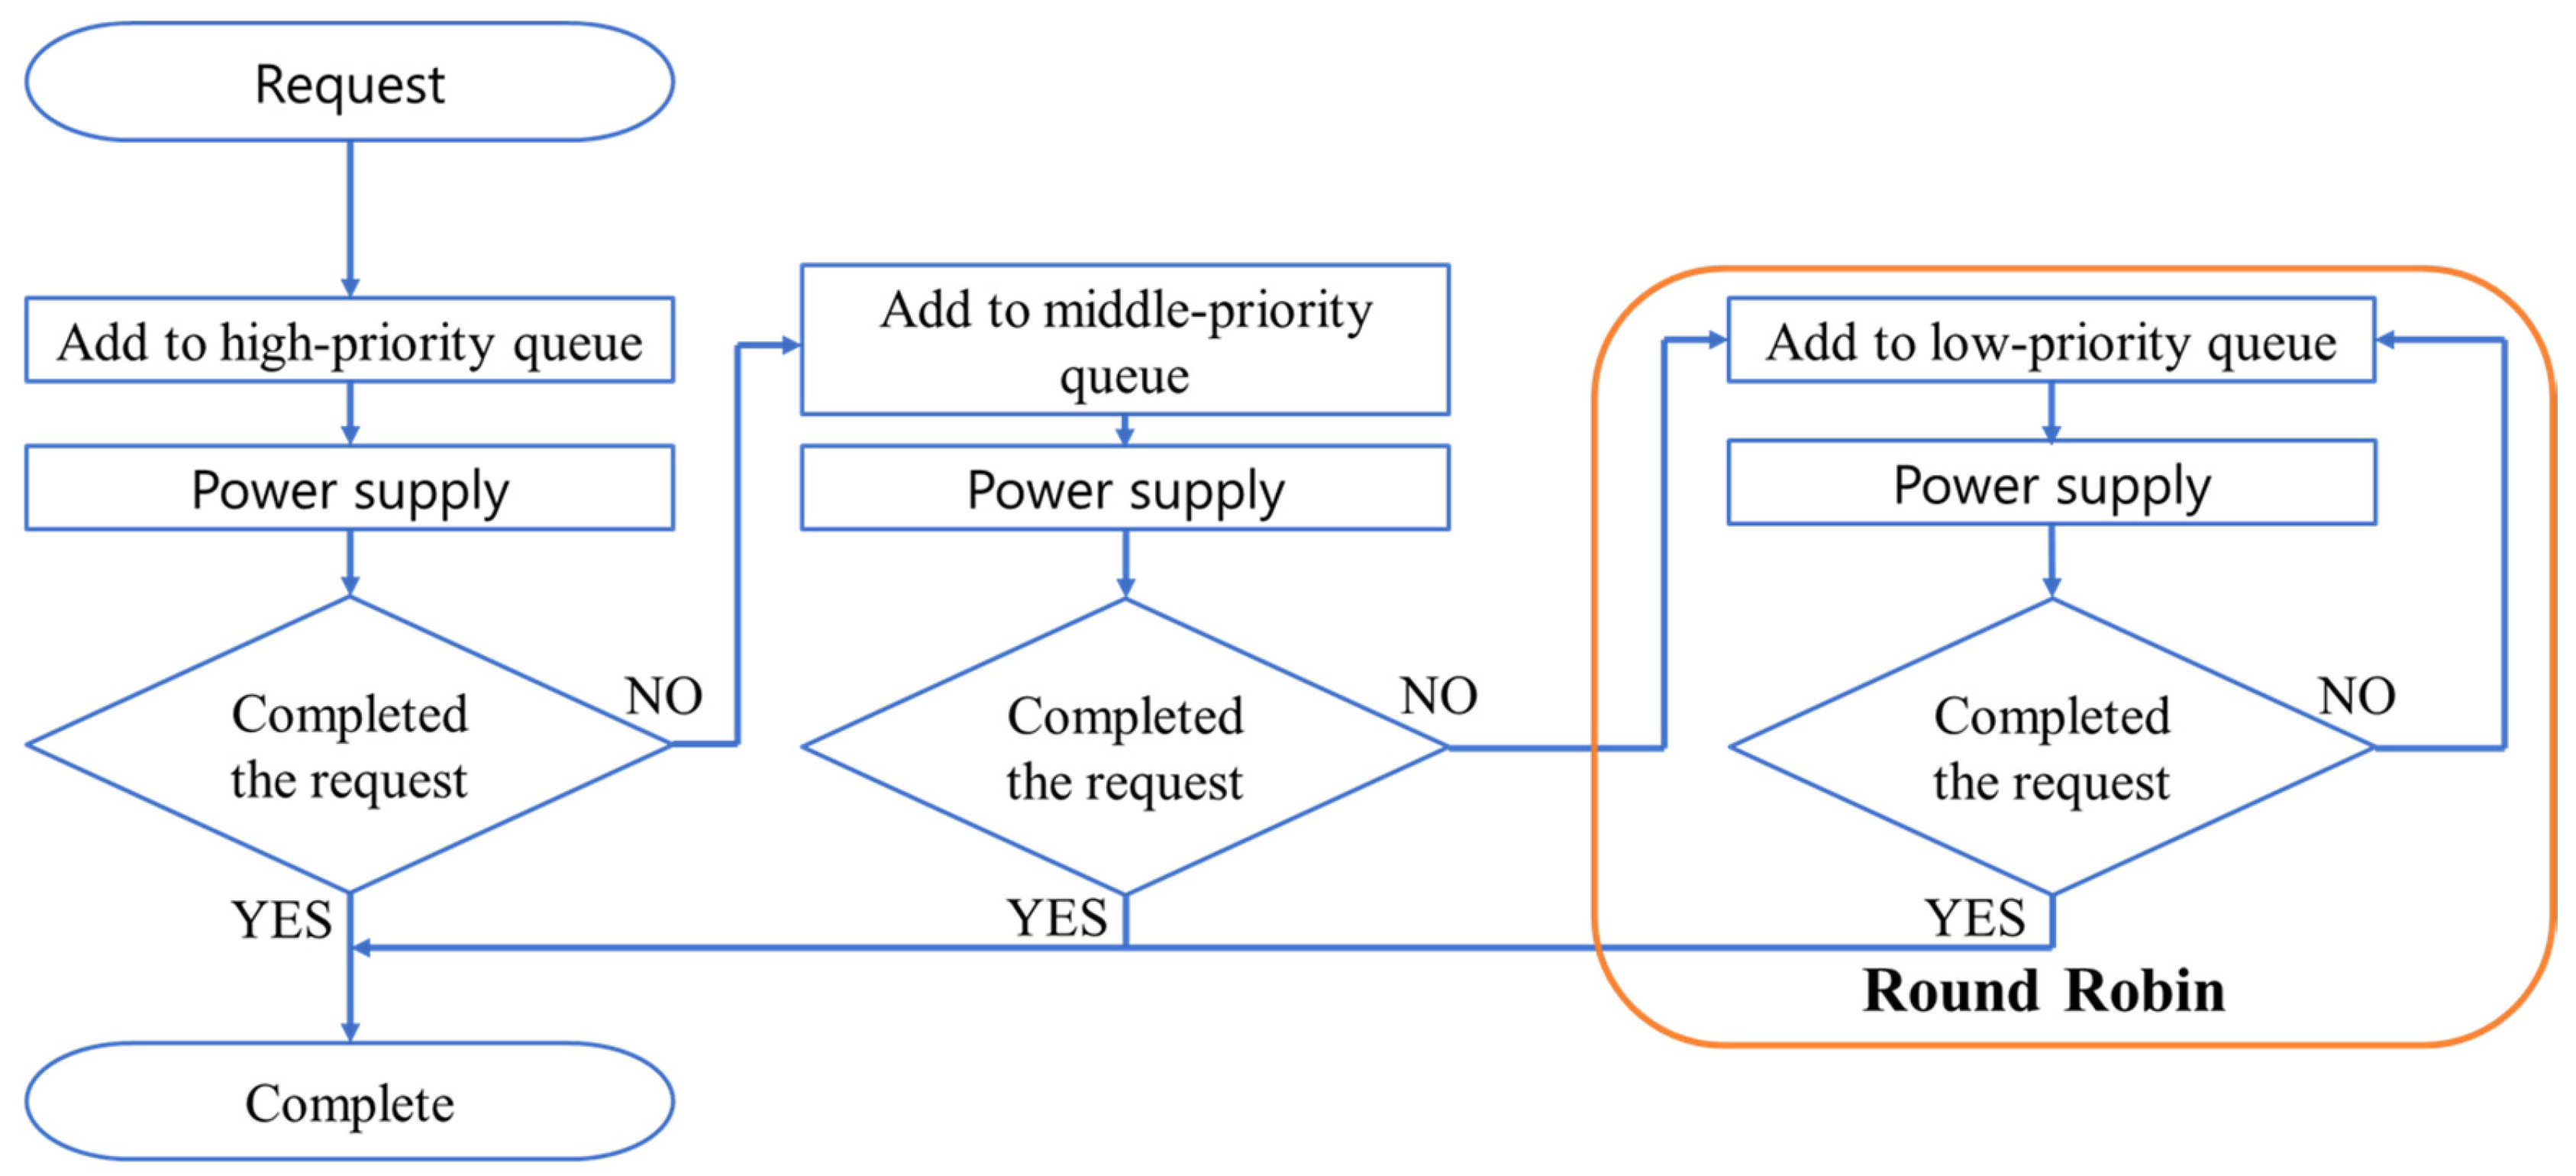
In the proposed method, if power delivery is not completed within a single time slot (TS), the remaining unprocessed portion is moved to the end of the queue and processed again in the next cycle. Figure 9 presents flowcharts of the first-come, first-served (FCFS) scheme and the round-robin (RR) scheme.
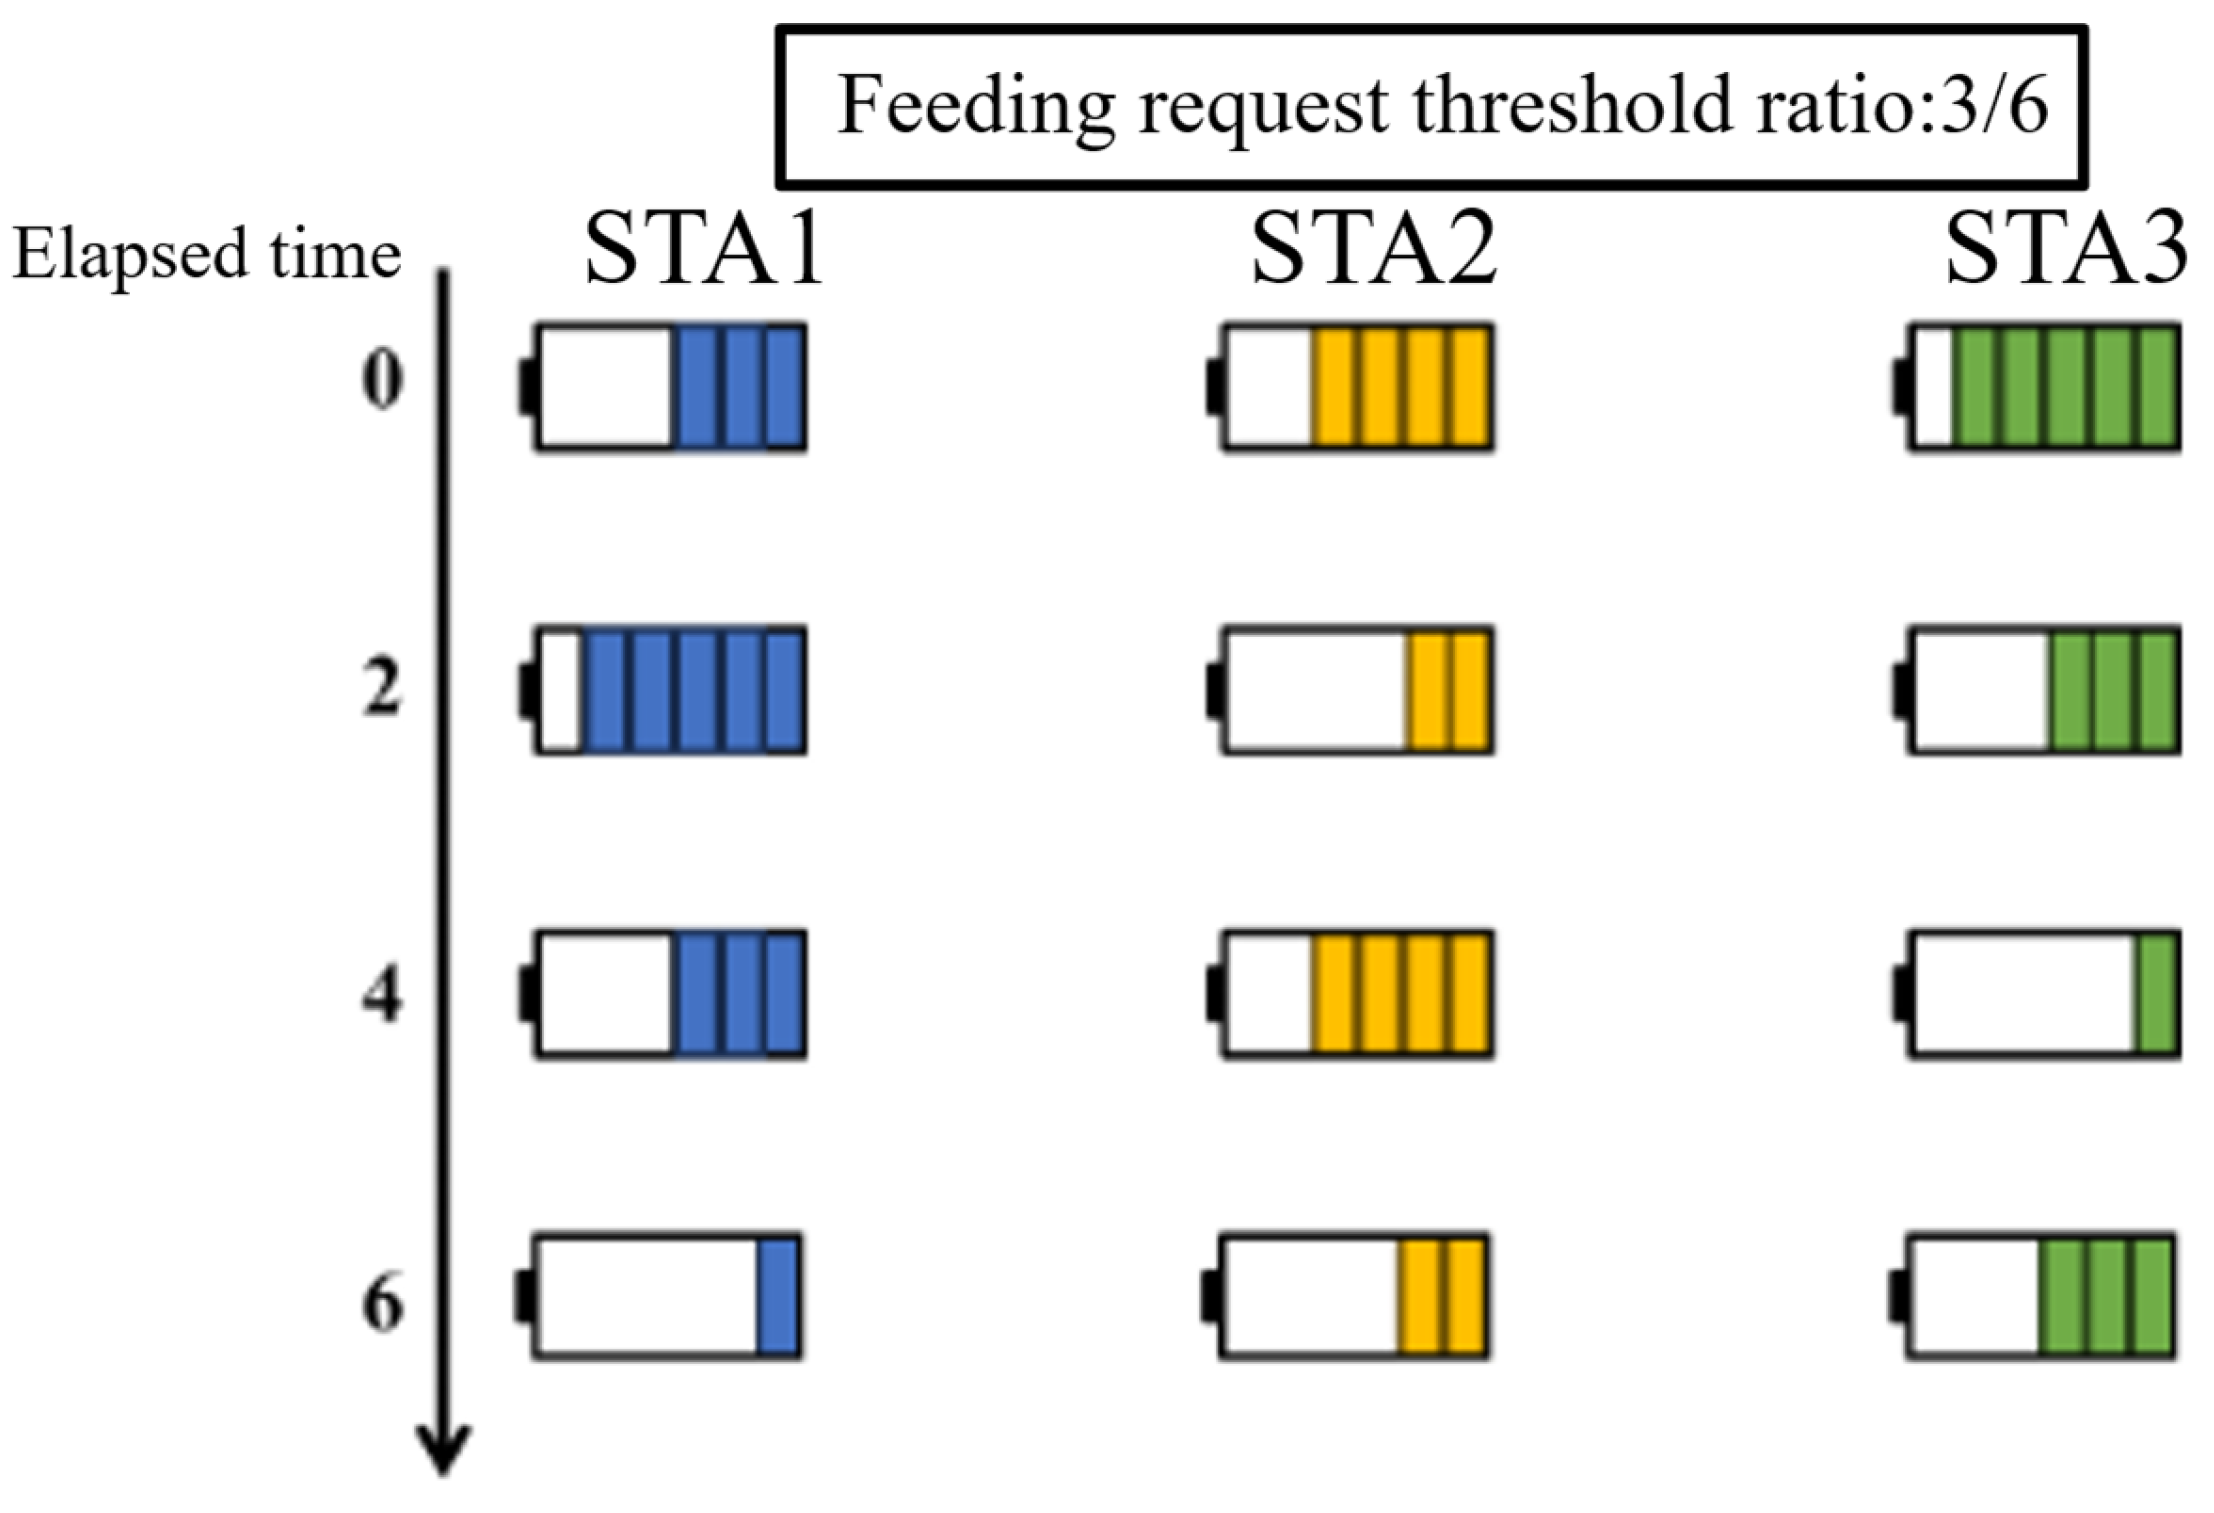
In the FCFS scheme, power packets are simply enqueued in the order of arrival and processed sequentially. In contrast, the RR scheme also processes input and output in sequence, similar to the FCFS approach; however, it differs in that the power-supply operation continues to cycle through the queue until all requests from the terminals are fulfilled. An example of battery level transitions under the RR scheme is illustrated in Figure 10, which is based on this operational procedure. Compared to the FCFS example in Figure 8, when the TS is set to two hours, it can be observed that by the elapsed time of six hours, all terminals have been granted at least one opportunity for power supply. This indicates that the RR scheme reduces the risk of terminal power depletion and enables more balanced and stable power delivery across multiple receivers compared to the FCFS scheme.
Equation (5) calculates the maximum waiting time for each terminal, designated as w n , and determines the average response time (ART).
A R T = w 1 + w 2 + + w n n
Assuming a constant value of t for all terminals, as indicated by Equation (5), the ARTs for FCFS (Equation (6)) and RR (Equation (7)) are as follows. Given that TS is set to a value that is less than the feeding time, the value of TS is directly proportional to the maximum waiting time for RR.
A R T F C F S = 0 + t + 2 t + + n 1 t n = n 1 t 2
A R T R R = 0 + T S + 2 T S + + n 1 T S n = n 1 T S 2
t > T S A R T F C F S > A R T R R
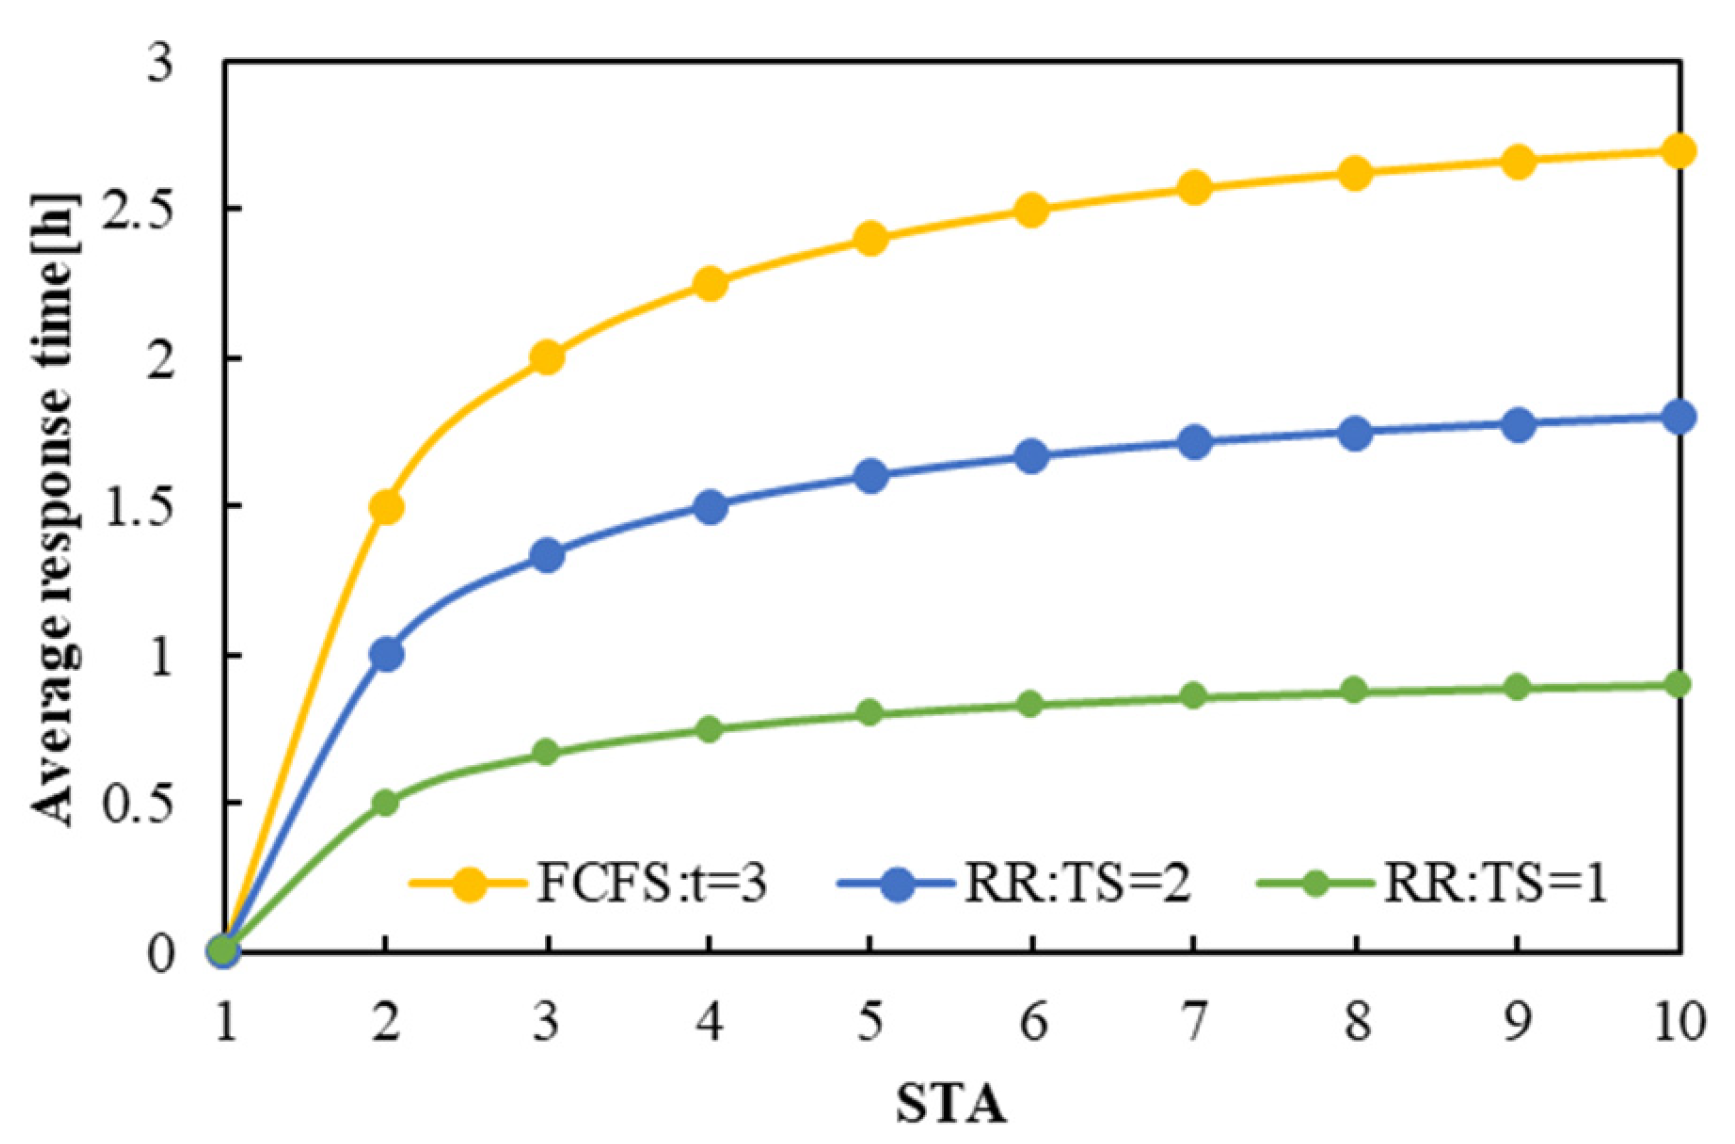
Therefore, the numerator value is smaller, and the RR response time is shorter than that of FCFS. Figure 11 shows the response times of the FCFS method, according to the receiving terminal, and the RR method when TS is set to two hours/one hour when the feeding time is three hours. These results confirm that the response time of the RR method is shorter than that of the FCFS method.

2.2.3. Proposed Multilevel Feedback Queue Scheme

The RR scheme can provide a satisfactory number of transmission times; however, given the fixed value of TS, it is challenging to ensure sufficient transmission when the conditions of the receiving terminals are disparate. To illustrate this challenge, consider scenarios in which the amount and frequency of power transmission must be dynamically adjusted for each receiving terminal when consumption varies among the terminals or when the distance from the transmission station differs. Addressing these challenges necessitates the implementation of a scheduling scheme that is both responsive and equitable, such as the RR scheme, while simultaneously adapting to power-consumption fluctuations.
A multilevel feedback queue (MFQ) scheme, akin to the RR scheme, is employed for process scheduling in operating systems. A salient feature of the MFQ scheme is its utilization of multiple queues, similar to that of the FCFS scheme.
Figure 12 presents a flowchart illustrating the operation of the MFQ scheme. When the power supply is not completed within the TS of the high-priority queue, the STA transitions to a medium-priority queue, where the process is repeated. Finally, the power-supply request notifications that reach the low-priority queue are processed using the RR method, ensuring that power is supplied evenly at the lower levels. This method is particularly effective for multiple receiving terminals with widely varying power supply times. However, if a high-priority queue is occupied by a terminal with high power consumption, the low-priority queue will have to wait for an extended period, or potentially indefinitely, for the power supply (station). To circumvent stubbing, it is imperative to implement a process that augments priority (aging). A critical concern with this approach is the necessity of determining the appropriate TS for each queue when employing the MFQ method. Furthermore, there exists the potential for the implementation of distinct TS values for disparate queues and the segmentation of terminals according to their feeding time. This facilitates dynamic processing. In such an instance, a reduction in the TS of the high-priority queue results in a decrease in the waiting time for terminals with a diminutive battery size and enables accelerated processing.
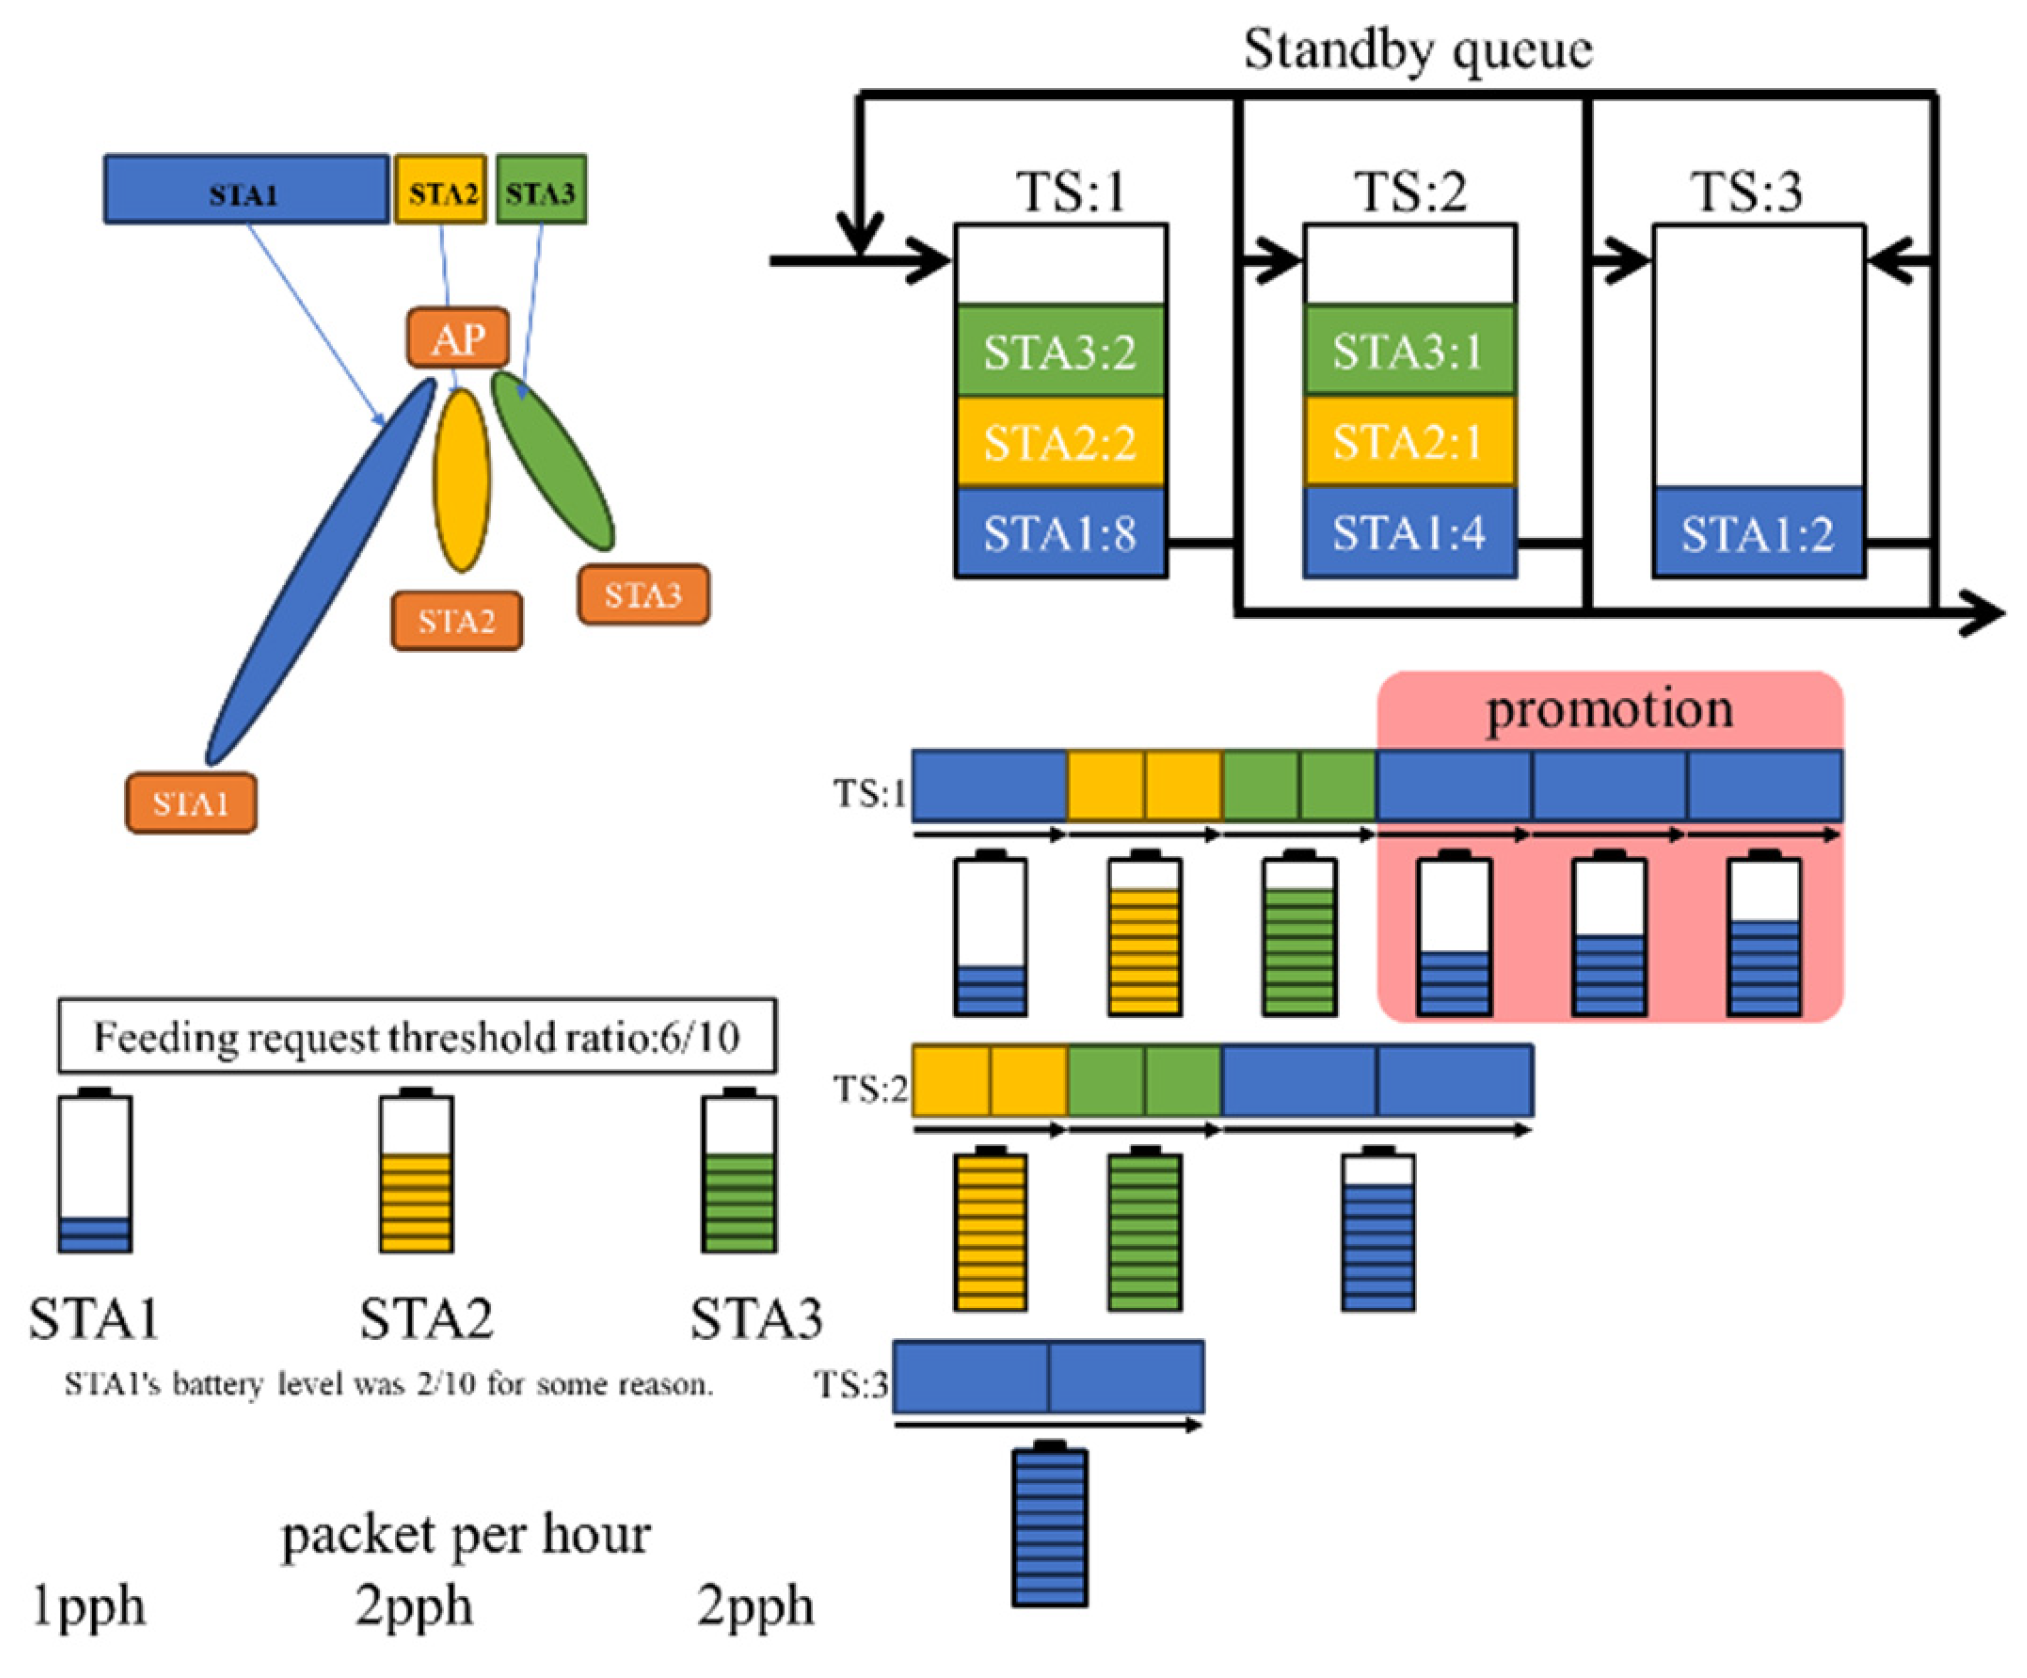
As illustrated in Figure 13, the operation of a transmit queue with an MFQ involves dividing queues according to their priorities, with distinct TS values assigned to each queue. The high-priority queue is assigned a TS of one hour, the medium-priority queue is assigned a TS of two hours, and the low-priority queue is assigned a TS of three hours. For simplicity, battery depletion over time is not considered. In the basic operation example, the threshold for each STA to request power is set to 2/10 of its battery, and eight packets are requested until the maximum power is reached. Consequently, in the example illustrated in the figure, the number of pphs transmitted and received by STA1, the most distant STA, is designated as one, for the sake of simplicity in explanation. STA2, the nearest neighbor, is configured with 8 pph; and STA3, situated at an intermediate distance, is set to 2 pph. Therefore, the total transmission time is eight hours for STA1, one hour for STA2, and four hours for STA3. To explain the operation based on these conditions, the high-priority queue has a transmission TS of one hour; therefore, STA2 finishes the transmission processing for all eight packets. Conversely, STA1 and STA3 transition to the medium-priority queue with requests for seven and six packets, respectively. However, they do not complete the power feeding because of the two-hour TS of the medium-priority queue, leading to their movement to the low-priority queue with requests for five and two packets, respectively. Given that the TS of the low-priority queue is three hours, STA1 re-enters the low-priority queue, with two packets remaining after three packets have been supplied. STA3, the next terminal to be supplied with power, has two packets remaining; thus, its power supply is completed in one hour, and the process moves on to the next terminal. The packets of STA1, which are input again, take two hours to transmit the remaining packets and complete the power-supply process. In summary, when the transmission time is designated as three hours, the completion of the transmission process within two hours results in a reduction in the remaining time.
The proposed method incorporates a mechanism for upgrading from a lower-priority to a higher-priority queue. This mechanism is based on a repowering request sent by a terminal when the remaining battery charge is less than a specified threshold value, when powered on. That is, when a resupply request is received from a terminal that has been moved to a lower queue, it is moved to a high-priority queue. This adjustment is designed to prevent the depletion of resources in the medium- and low-priority queues and to enhance the scheduling efficiency. In addition, distant terminals and those with high power consumption are more likely to initiate a resupply request while awaiting replenishment, increasing their probability of moving to a high-priority queue. If a resupply request occurs during the processing of a high-priority queue, the request does not transition to a lower-priority queue. Consequently, the processing can be performed again in the high-priority queue. Figure 14 shows an example of a promotional operation. Assuming that the number of packets per hour sent/received by the distant STA1 is 1 pph and that of neighboring STA2 and STA3 is 2 pph each, when the remaining power of STA1 drops to 2/10 of the power-supply request threshold set at 6/10 owing to a sudden increase in power consumption, it can be deduced that the system functions as intended. Consequently, the total power supply time is eight hours for STA1 and two hours for STA2 and STA3. Under standard operating conditions, power-supply requests are processed in the order in which they are received. However, in this particular instance, only STA1 is added to the high-priority queue once more because the power-supply request threshold is not exceeded, even after the power supply is depleted. As illustrated in Figure 13, STA1 is promoted three times until its remaining battery capacity reaches 6/10. At this point, STA1 is prioritized for the power supply.
The promotion function enables the allocation of additional time to the terminals with a higher likelihood of power exhaustion.

3. Results

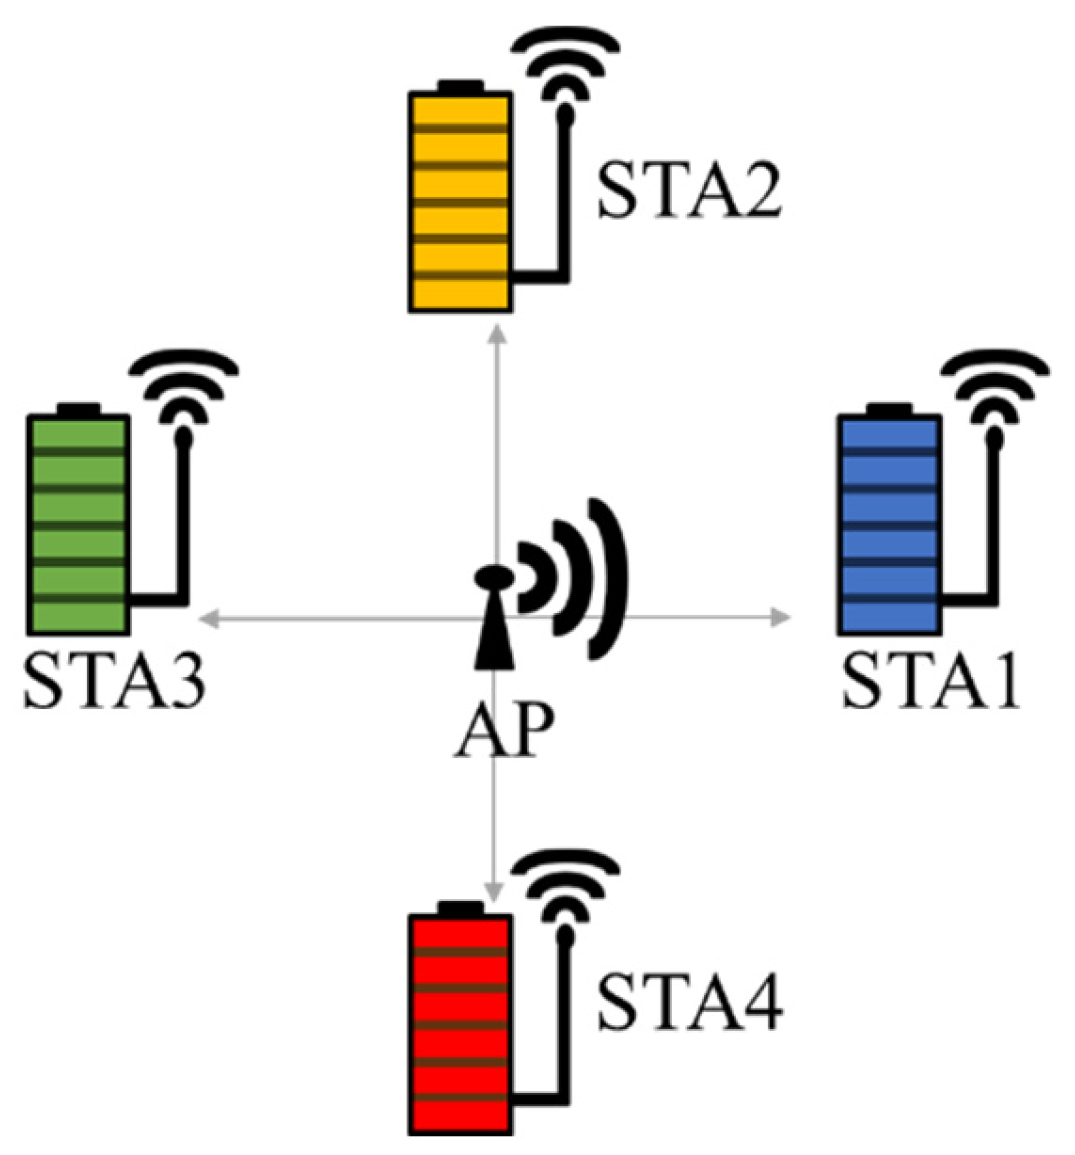
To conduct the evaluation, a model was created using a WPT simulator (see Figure 15). In this model, four power-receiving terminals (STA1–STA4) were placed 1 m from the AP. The distance between the terminals was kept constant, and they were positioned on four sides of the AP to prevent interference from the power transmission beam. These evaluations were conducted through computer simulations. Although the simulator is typically used to evaluate communication network models, we developed an additional program to convert packet-based communication models into power packets, allowing us to evaluate them in terms of power [31].
Table 1 lists the parameters common to all STAs. Interpreting each packet as a unit of mWs, the insertion of one packet into the queue indicates that 1 mW of power has been supplied to the battery. Therefore, 500,000 packets correspond to a received power of 500 W. These parameters were determined based on the capacity of a typical button-cell battery and the power consumption of light-emitting diodes. The battery capacity represented the queue size in the simulation, which could store up to 500,000 packets. The packet discard interval was the inverse of the power consumption. The power consumption P in this model is given by Equation (8).
P = 1 p a c k e t   d r o p   t i m e = 1 21   [ m s ] 47.6   m W
The total power consumption of the model was estimated to be approximately 190 mW, and the received power at a distance of 1 m was 194 mW. Consequently, when the power supply was sufficient, depletion did not occur. The power-supply request threshold was set to 20% as the criterion for determining the power supply. When the remaining battery power fell below this threshold, the system initiated a powering process. The transmission power and antenna gain were set with reference to the values specified in the WPT standards.

3.1. FCFS Scheme Evaluation

As illustrated in Figure 16, battery transition was contingent upon the FCFS scheme. In this model, 194 mW of power was supplied to the STA, which was less than the STA’s total power consumption of 190 mW. Typically, the battery would not have been depleted because the amount of power supplied exceeded the amount consumed. However, as shown in Figure 16a, the STA3 and STA4 terminals were powered on later, resulting in depletion within 3 h after the start of the simulation owing to the extended waiting period. Subsequently, the two terminals maintained stable operation. Figure 16b presents the outcomes when the power-supply request threshold for the STA common parameter was increased to 60% (power was requested when the value fell below 60%). By establishing a higher threshold, all terminals functioned without depletion. It can be concluded that establishing a higher power-supply request threshold reduces the time required to supply power to each STA and mitigates the occurrence of depletion. These outcomes underscore the necessity of calibrating the threshold according to the specific characteristics of the application. In summary, the FCFS scheme may encounter challenges in effectively managing STAs with disparate power consumption and varying distances from one another.

3.2. RR Scheme Evaluation

The RR scheme operates in a manner contingent upon the TS value; that is, the behavior of the RR method varies depending on the TS value. To elucidate this variation, the behaviors were compared for TS values of 25, 15, and 5 min. Figure 17 shows the RR battery level. When the TS was set to 25 min, STA3 and STA4 were depleted because they could not be switched in time; when the TS was set to 15 min, only STA4 was depleted; and when the TS was set to 5 min, the battery was not depleted. These findings indicate that as the TS decreases, the battery level increases.

3.3. MFQ Scheme Evaluation

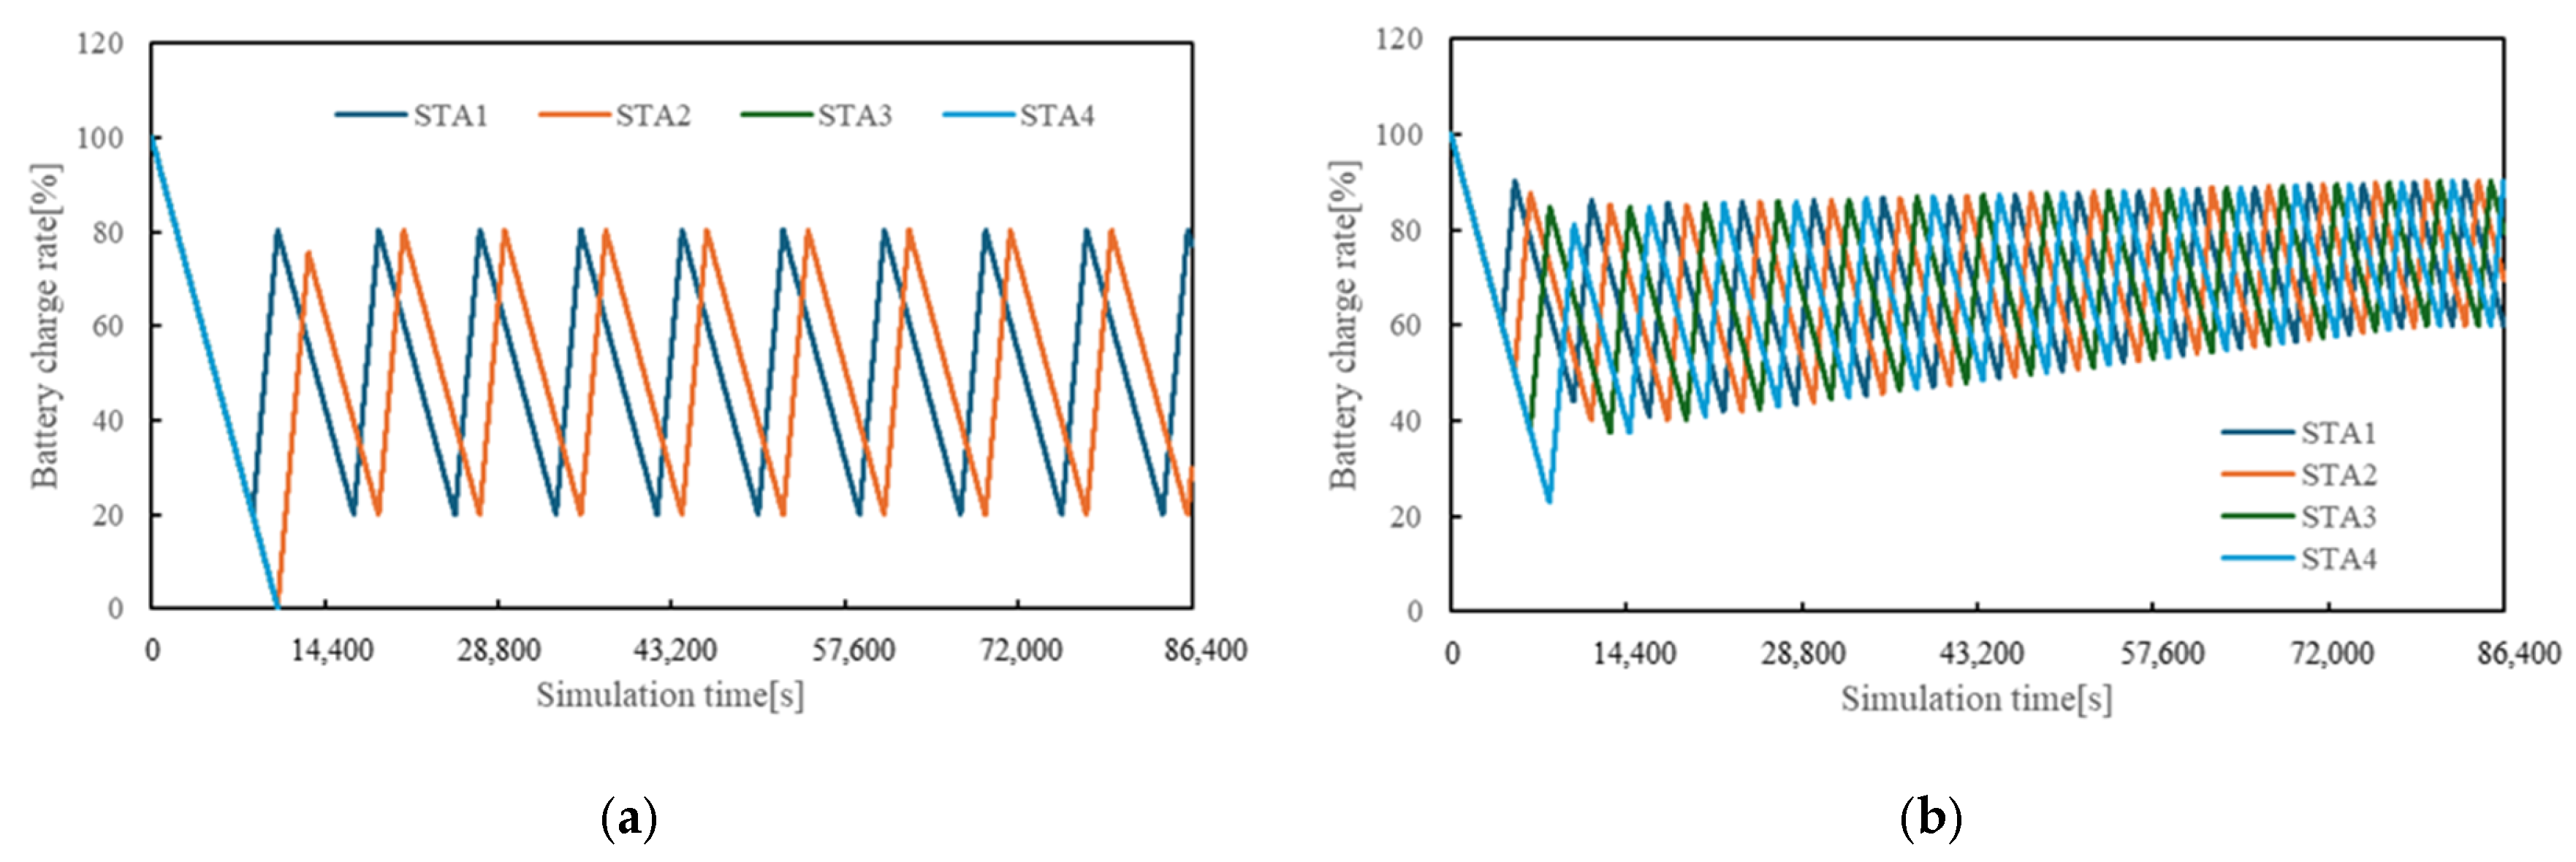
The effectiveness of the MFQ scheme was verified because it has the functionality of promotion processing in addition to RR, and the queues for MFQ-scheme evaluation were simulated with TSs of 5/15/25 min, in sequence, according to priority (see Figure 18). The figure shows the difference in the battery transition with and without the promotion process when using the MFQ scheme. Figure 18a illustrates the scenario devoid of a promotion process, where STA4 experiences depletion owing to the prolonged power supply to a terminal that transitioned to a lower queue. Conversely, Figure 18b depicts a scenario involving the execution of the promotion process, resulting in the maintenance of the residual power level at a comparable magnitude across all terminals, without any depletion.

3.4. STA Placement Distance Evaluation

It was confirmed that the MFQ scheme could maintain a more stable power supply than the RR scheme by performing a power-up process. However, in a real environment, the power supply conditions may change, such as a temporary and sudden decrease in the power supplied or an increase in the power consumption. Therefore, configurations with different STA arrangements were constructed and evaluated. As discussed previously, the time required to complete packet reception increased with increasing distance between the receiving terminals, leading to a reduction in the power consumption.
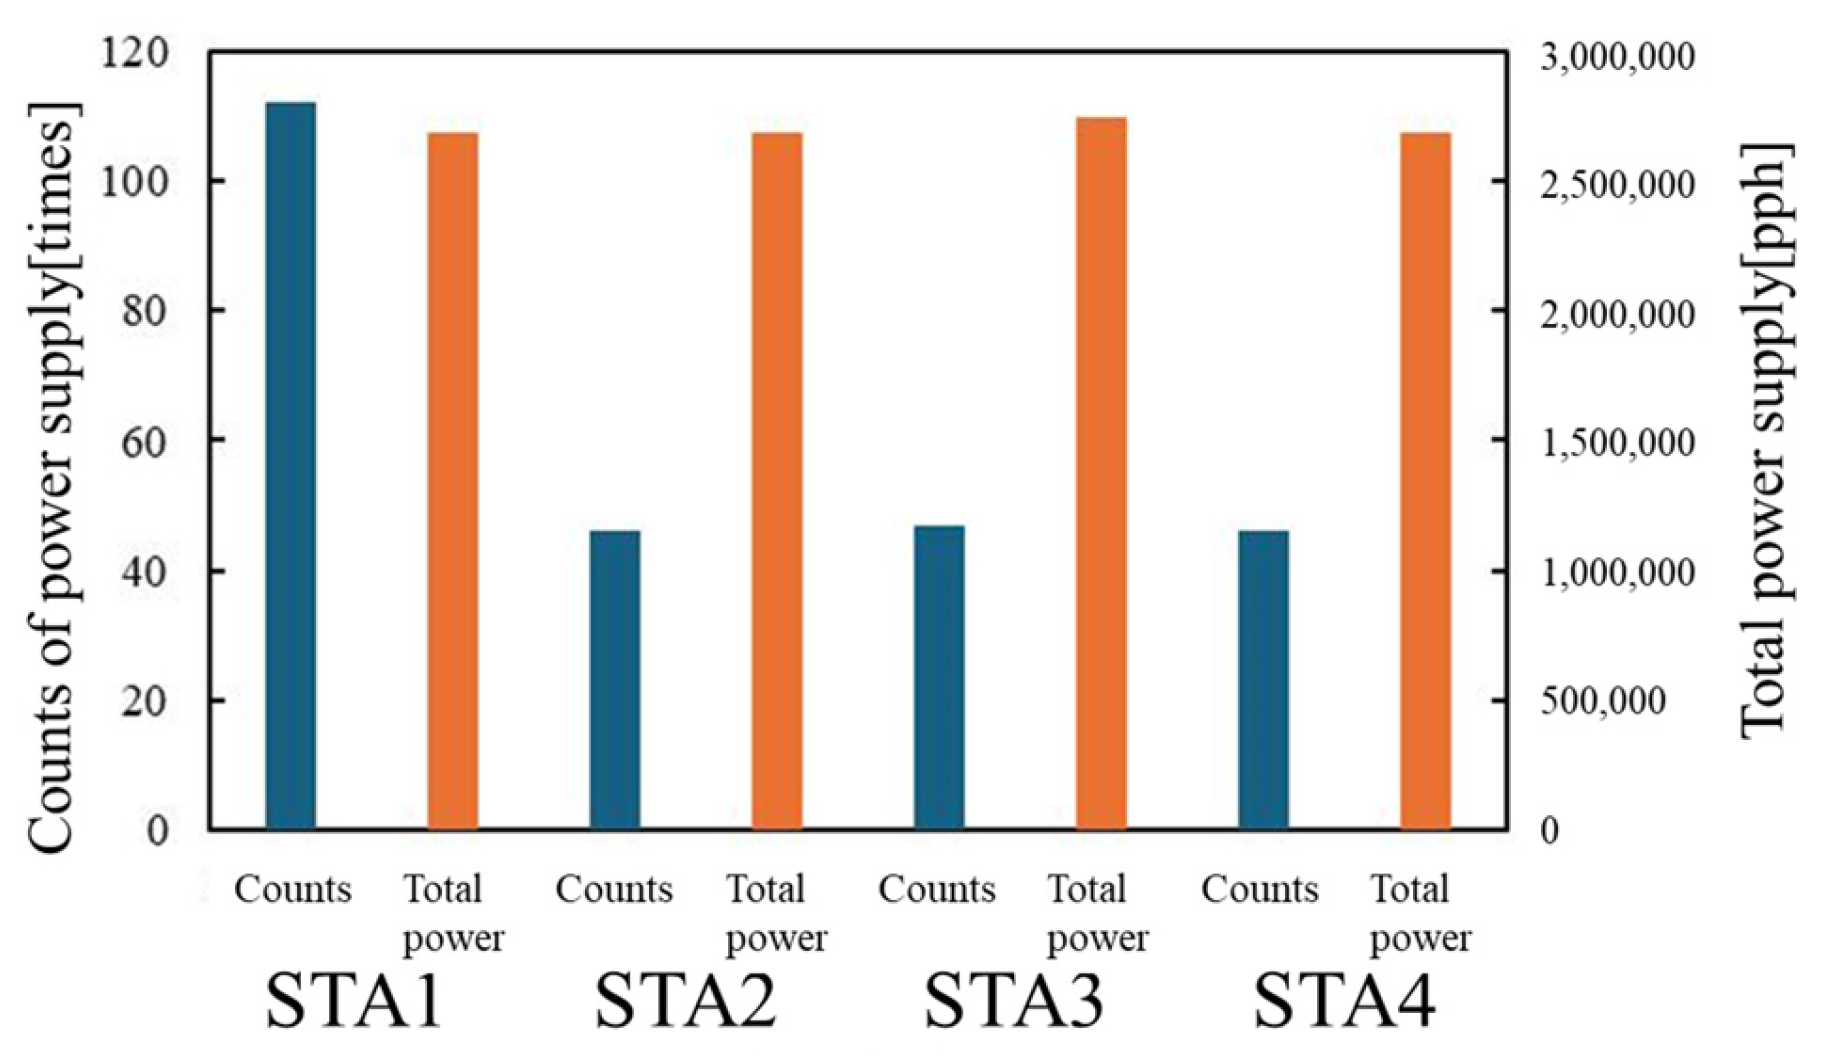
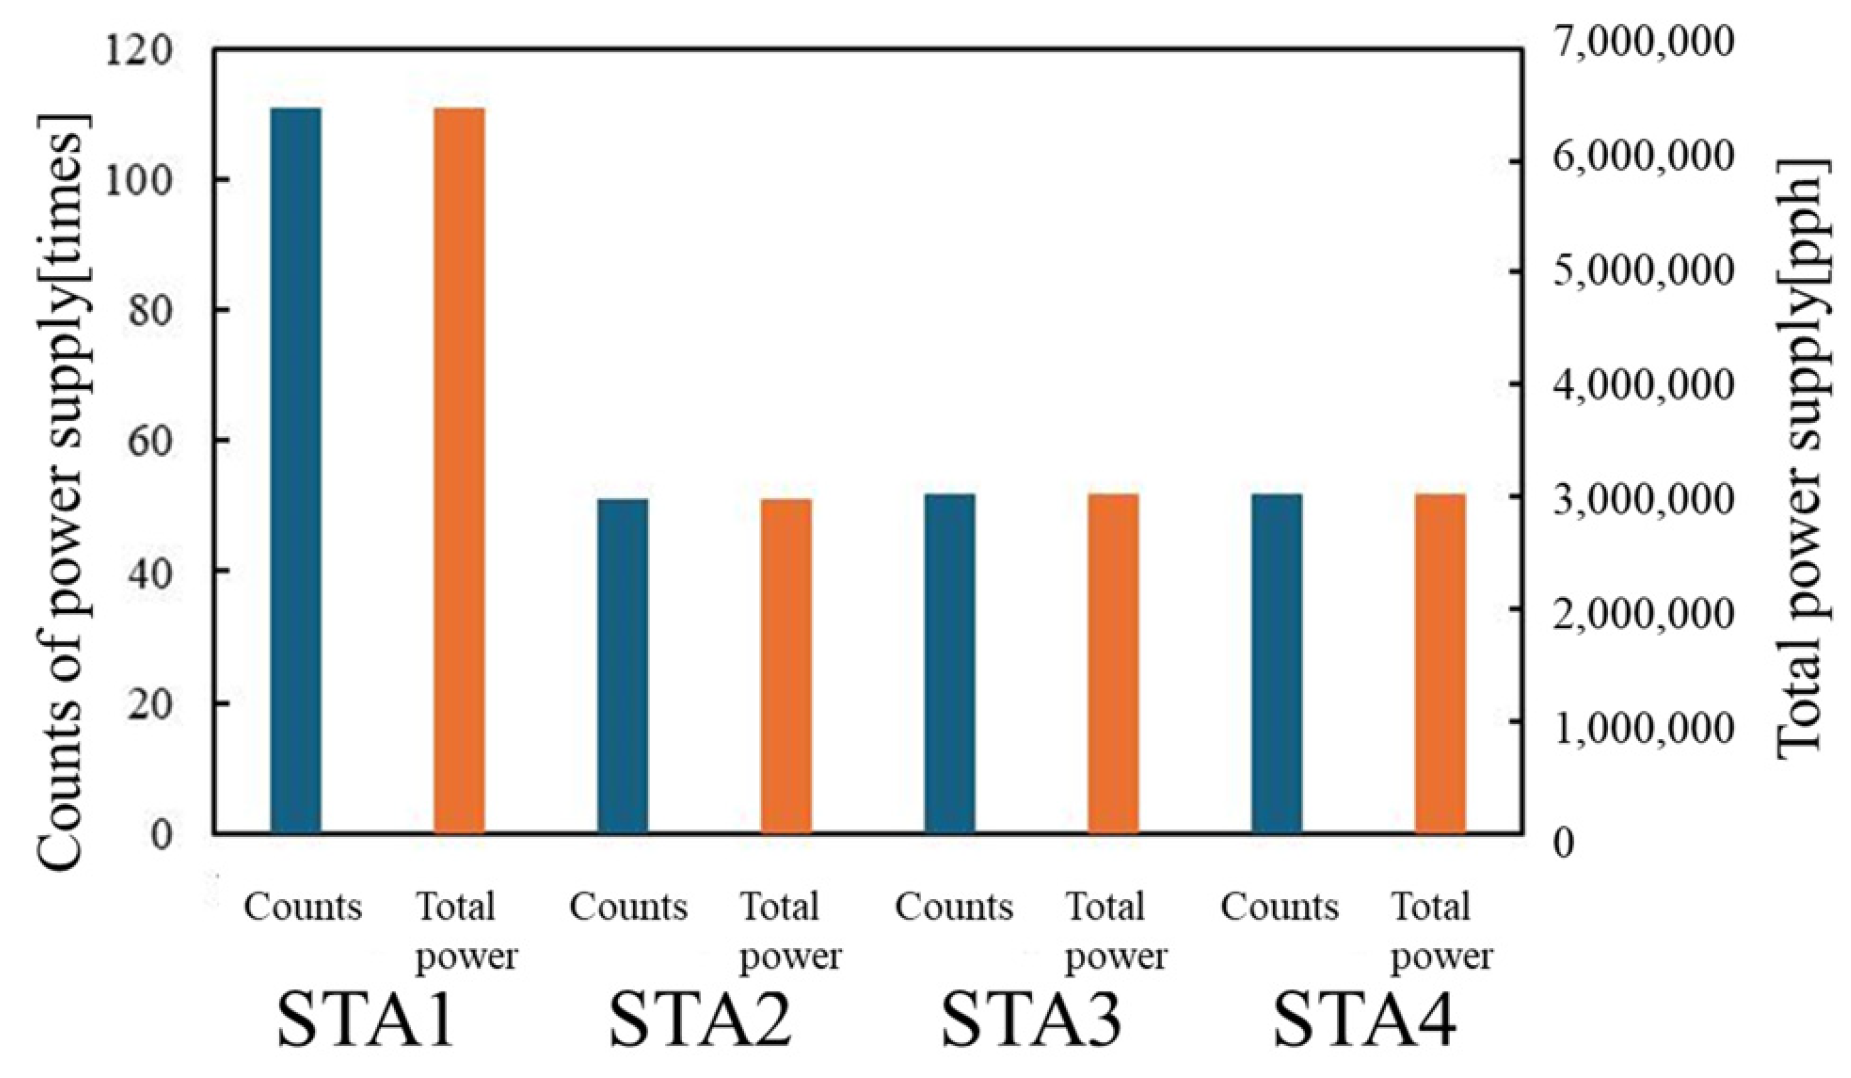
The conditions under which the placement distances differ are delineated as follows: As illustrated in Figure 19, STA1 is the sole terminal configured with an AP distance of 1.5 m. Table 2 presents a comparison of the common parameters used in this evaluation. The packet discard interval is augmented to 32 ms to address the decline in power reception resulting from the change in distance. Figure 20 shows the simulation outcomes of the RR and MFQ schemes, for comparison. Figure 20a illustrates a scenario in which the RR scheme is employed. While the RR scheme ensures balanced power distribution, distant terminals exhibit higher power consumption during standby, compared to their reception in a single feed, leading to a transient decline in the battery power. Consequently, STA1’s battery capacity is depleted when the RR scheme is implemented. In RR, an issue was identified wherein a remote terminal required a significant duration to surpass the designated power-supply request threshold. As illustrated in Figure 20b, the TS of each queue in the MFQ was set to 5 min. It was verified that STA1 possessed the capability to preserve its storage capacity without reaching depletion, which was facilitated by its numerous opportunities to receive power subsequent to other terminals’ relocation to a lower queue through a promotion process involving resupply requests. Figure 21 shows the total number of times each terminal receives power and the total amount of power supplied. It is evident that STA1, situated at a considerable distance from the other terminals, received 110 power-supply opportunities, which was more than double the number received by the other terminals (approximately 50 opportunities). Consequently, STA1 obtained the same total power supplied as the other terminals owing to the greater number of times it received power. In this evaluation, the TS was set to 5 min for both the RR and MFQ schemes. The MFQ scheme maintained the remaining battery capacity and avoided depletion by prioritizing the number of power-transmission opportunities through the promotion process. The MFQ method is considered to have been able to maintain the remaining battery capacity and avoid depletion.

3.5. Different Power Consumption Evaluation

In the subsequent analysis, a comparative evaluation of the RR and MFQ schemes was conducted in relation to their disparate power consumption profiles. The STAs under scrutiny were arranged in an equidistant configuration at a distance of 1 m, as illustrated in Figure 15. Table 3 presents a comprehensive list of the common parameters and their respective modifications implemented in this evaluation. To emulate the power consumption, STA1 was configured to 13 ms, whereas the remaining STAs were set to 27 ms, thereby doubling the power consumption of STA1.
The evaluation results of the RR and MFQ schemes, both of which set the TS to 5 min, are shown in Figure 22. Figure 22a presents the evaluation using the RR scheme. Although the RR scheme provided fair power-supply opportunities, the power consumption during standby exceeded the amount of power supplied at one time to the terminal with the highest power consumption, resulting in a rapid decrease in the remaining battery capacity and depletion of the storage capacity. By contrast, the MFQ scheme (see Figure 22b) demonstrated a more effective approach. Here, STA1 utilized a promotion process involving resupply requests to obtain additional power-supply opportunities, effectively maintaining the battery capacity without depletion. The evaluation of the number of times MFQ receives power and the total amount of power received is shown in Figure 23. Notably, STA1, which had the highest power consumption, received 110 opportunities, more than twice the number received by the other terminals (approximately 50 opportunities). In this model, the received power at each terminal was equal. However, STA1’s greater number of power-supply opportunities resulted in it receiving more than twice the total power supplied to the other terminals. The shortest TS for both schemes was 5 min. However, the MFQ scheme’s ability to maintain a higher battery level and avoid depletion was evident through its division of priority levels.

3.6. Analysis and Discussion of Each Scheme

The simulation results indicate that the FCFS scheme is the most susceptible to cause battery depletion, which may be attributed to its prolonged response time. In the FCFS scheme, requests are processed in the order in which they are received, thereby increasing the response time, and consequently accelerating battery depletion. Conversely, the RR scheme functions with a higher value of remaining battery power when the TS is set to a shorter duration. Reducing the TS duration reduces the response time for each receiving terminal and facilitates more efficient power supply. The results of the MFQ scheme exhibit substantial variation depending on the TS promotion. The MFQ scheme operates with a battery life equivalent to that of an RR scheme with a short TS. Specifically, the MFQ method reduces the response time and enables an efficient supply of power by upgrading from a low-priority queue to a high-priority queue. In scenarios where the terminal distances vary, the MFQ scheme and its upgrading process prioritize distant terminals, ensuring that they receive power ahead of the nearby terminals. In addition, the MFQ scheme and its upgrading process can be utilized to allocate priority to terminals with higher power consumptions when their power consumption differs from that of distant terminals. This approach ensures that terminals with high power demands receive power preferentially, thereby enhancing the overall efficiency. In summary, the RR and MFQ schemes have been shown to facilitate more efficient battery utilization than the FCFS approach. Notably, the capacity of the MFQ scheme to adapt to varying distances and power consumptions, through its promotion process, makes it a particularly effective solution.

4. Conclusions

In this study, we proposed a novel power–packet conversion method that is compatible with the existing network and computer-processing scheduling methods. We evaluated three scheduling schemes: FCFS, RR, and MFQ, and confirmed that the latter was the most suitable for efficient power supply while preventing battery depletion. This scheme is expected to be used not only to remotely transfer power to IoT terminals and other devices but also in applications where only wireless transmission (without physical wiring) is feasible.
The scope of this study is constrained to the fundamental operations and performance comparisons of the respective schedulers. Subsequent research will encompass the examination and evaluation of operational methodologies for more pragmatic applications, along with the derivation of optimal parameter settings. Furthermore, we intend to implement the devised power–packet conversion method and scheduler within an authentic power-transmission system and substantiate their efficacy through demonstrative experiments.
In this study, we assume that, unlike communication terminals, the terminals in the wireless power transfer model are stationary and do not move dynamically. Therefore, terminal mobility is not evaluated. If mobility is to be considered, beam-tracking functionality at the transmitter side would be required. The effects of surrounding reflections are also not considered. This is because wireless power transfer experiences significant attenuation, and multipath components due to reflections are further attenuated, resulting in minimal impact on the direct wave, including interference and resonance. However, in practical applications, evaluations under such special conditions may be necessary, and we consider this an important topic for future research.
The behavior of the battery in this simulator can be configured to simulate nonlinear characteristics. However, in this study, the charging and discharging of the battery are assumed to be linear in order to simplify the comparison of scheduling methods. In addition, this simulator does not incorporate delay. The primary reason is that the delay in this context is extremely short compared to the power transmission and reception time. Additionally, the loss caused by such delay is negligible, even when compared to the minor losses due to reflected waves in real environments. As for positional shifts, they will be addressed in future work by developing a simulator that considers device mobility, along with implementing related features. Moreover, the reason that transmission delay is not incorporated in the current simulator is that, unlike communication networks, the delay in power transmission is extremely short compared to the time it takes to receive the power and can be considered negligible. In addition, the energy loss due to delay is smaller than the loss due to the weakness of reflected waves in the real environment. The effect of misalignment will be verified through comparative experiments using actual power transmission hardware that is currently under development.
As a future direction, we plan to incorporate nonlinear battery discharge characteristics into the simulation. For example, packet drop behavior can be modeled based on battery-specific discharge profiles, which would enhance the realism and accuracy of the evaluation. In addition, we are currently developing hardware for the proposed system, and comparative validation between the simulator and the actual hardware implementation is planned as part of our ongoing studies.

Author Contributions

Conceptualization: T.H. and K.M.; Data curation: Y.T., K.M. and S.O.; Methodology: T.H., K.M., T.H., T.M. and T.K.; Investigation: Y.T.; Visualization: Y.T., T.H. and S.O.; Writing—original draft: Y.T., T.H. and T.K.; Funding acquisition: T.H., T.M. and N.S.; Supervision: T.M. and N.S. All authors have read and agreed to the published version of the manuscript.

Funding

This work was supported in part by Tokyo Metropolitan University Local 5G Research Project and JSPS KAKENHI under Grant JP24K02933, and in part by the Project titled “Research and Development on Interference Suppression Technology and Advanced Technology for Wireless power transfer via Radio Frequency Beam” funded by the Ministry of Internal Affairs and Communications as part of the Research Program “Research and Development for Expansion of Radio Wave Resources” under Grant JPJ000254.

Data Availability Statement

Data will be made available upon request.

Conflicts of Interest

Author Noboru Sekino was employed by the company DKK Co., Ltd. The remaining authors declare that the research was conducted in the absence of any commercial or financial relationships that could be construed as a potential conflict of interest.

Abbreviations

The following abbreviations are used in this manuscript:
WPTWireless power transfer
IoTInternet of Things
EIRPEquivalent isotropic radiated power
STAStation
ESLElectronic shelf label
PDTDPower delivery technology with time division
PTDDPower time-division delivery
APAccess point
FCFSFirst-come–first served
pphPackets per hour
RRRound robin
TSTime slice
ARTAverage response time
MFQMultilevel feedback queue

Appendix A

Appendix A.1. Scheduling for Grouped Power Supply

In contrast to wireless communication, WPT can be performed even when a radio wave intended for another terminal is received. Interference waves that typically reduce throughput are advantageous for WPT. A scenario in which such favorable interference occurs involves multiple terminals positioned in a linear array or in close proximity to one another. To investigate this phenomenon, we propose a simplified power-supply method in which a group of terminals exhibiting favorable interference is regarded as a single entity. Two distinct beam patterns are examined during the grouping analysis. The beam alterations resulting from the grouping are presented in Figure A1. In Scenario (a), the beams are directed towards STA1 and STA2, which are aligned in a linear configuration. In Scenario (b), STA1 and STA2 are grouped into a single beam. When all terminals are configured with identical parameters, except for the set distance, power is allocated to STA1. STA3 must wait until the process is complete. As a result of this grouping, once the power supply to STA1 is terminated, the power-supply request of STA2 is deleted concurrently, and the power supply to STA3 is initiated. Owing to this grouping, STA2 is unable to receive the requested amount of power. Conversely, STA3, which has not received any power, is prioritized.
Figure A1. Example of beam change by grouping. (a) Before grouping. (b) After grouping.
Iot 06 00028 g0a1
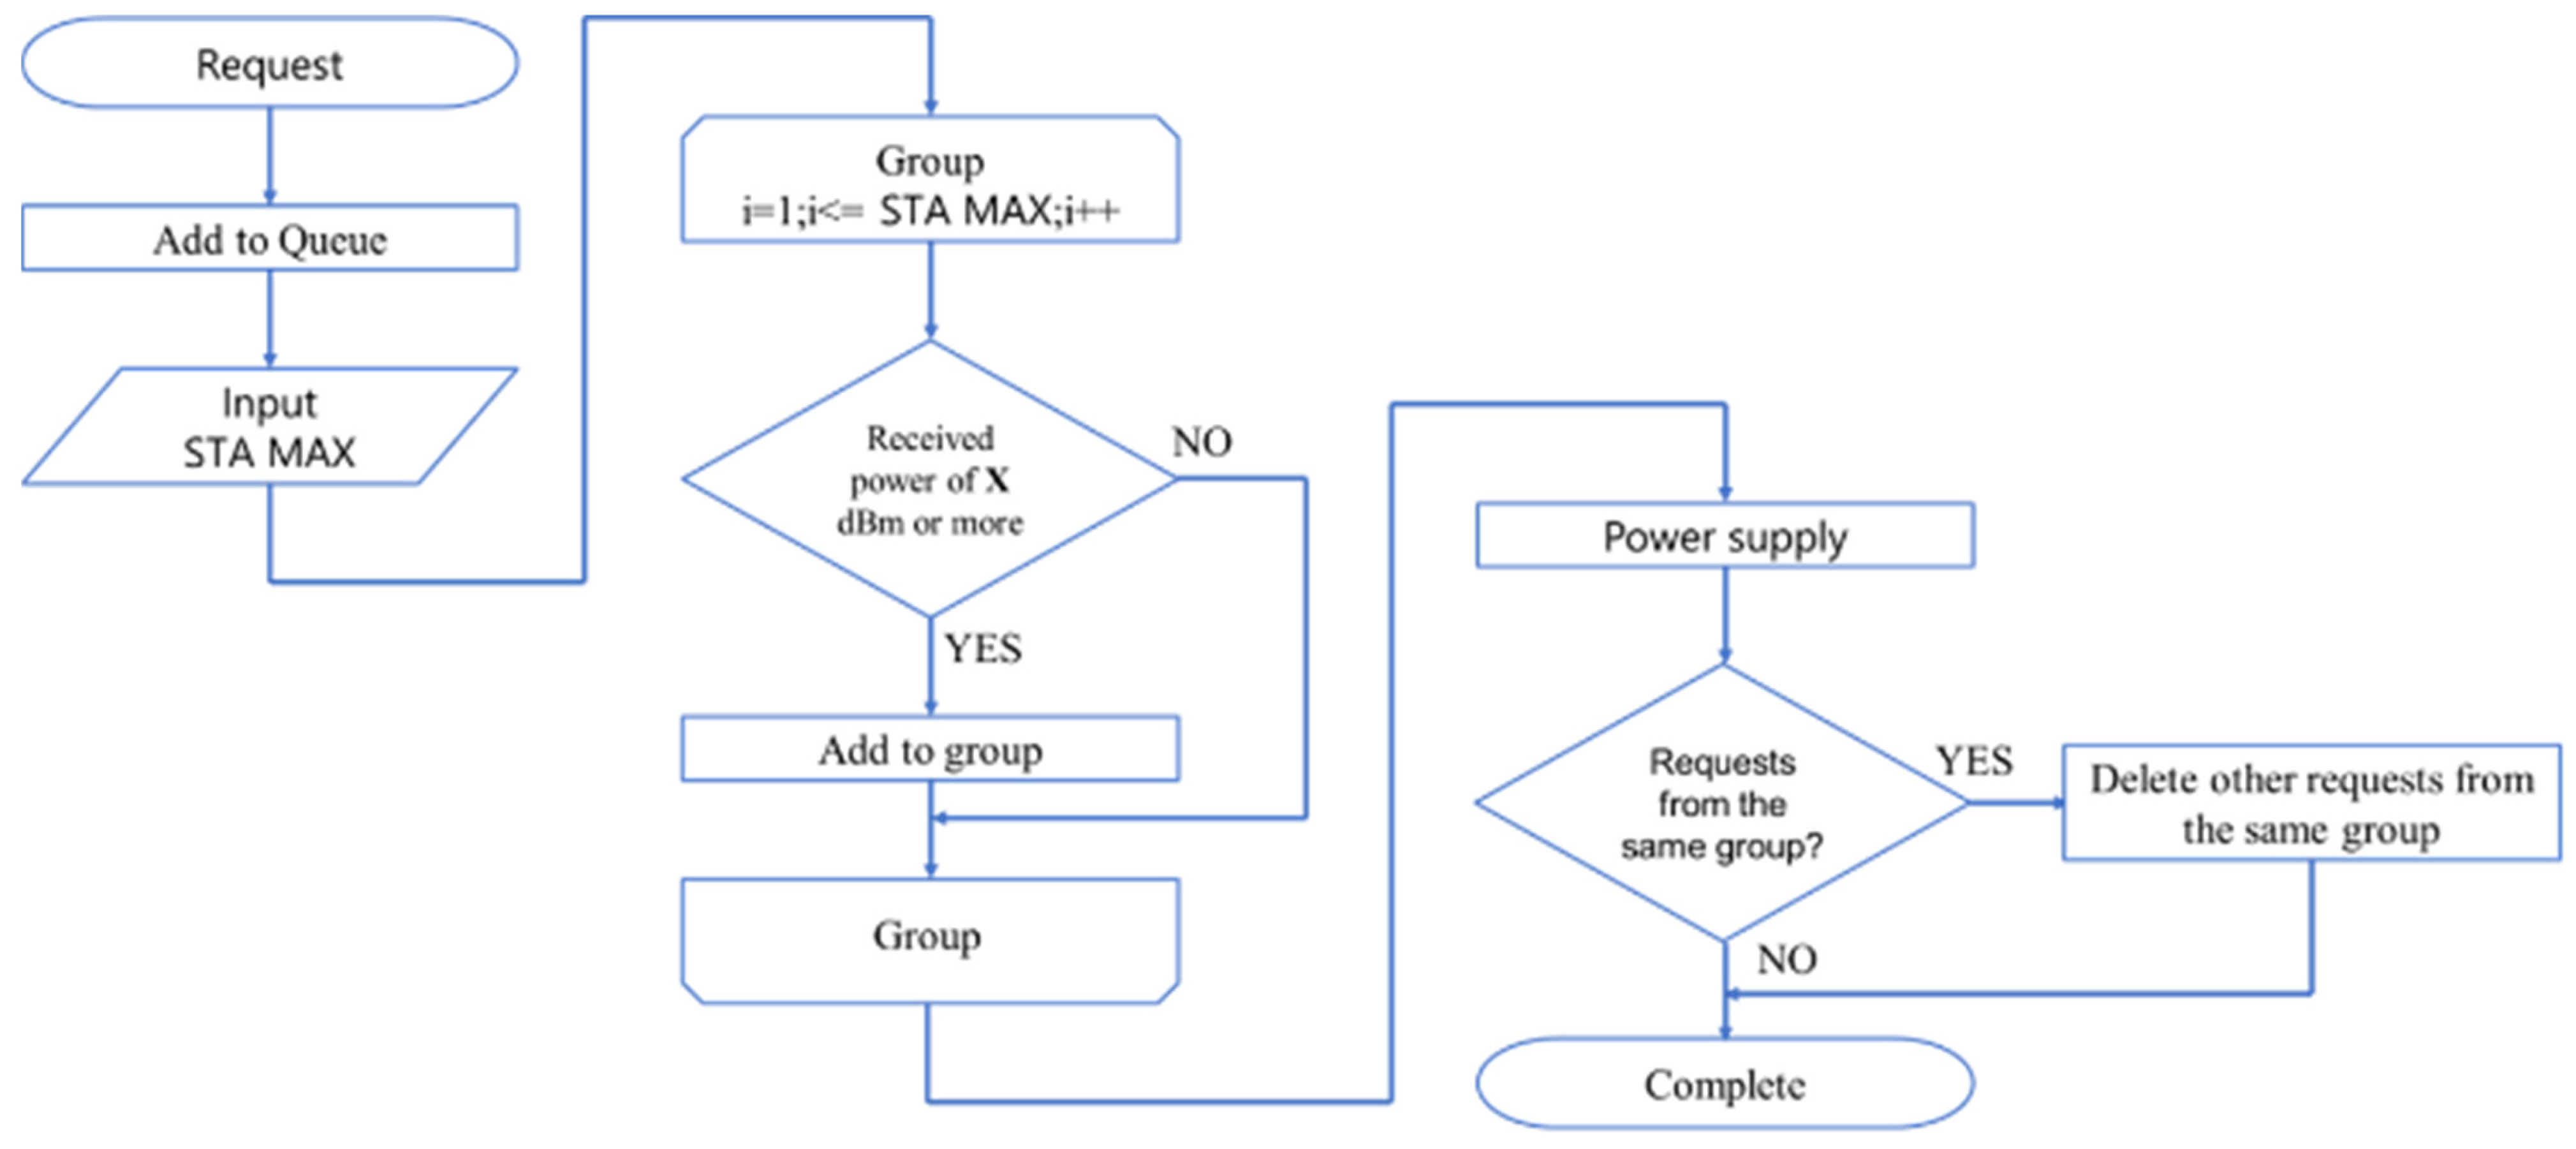
As illustrated in Figure A2, the simulator’s internal grouping process is depicted in a simplified flowchart. The simulator categorizes the received power levels that exceed X dBm as a group.
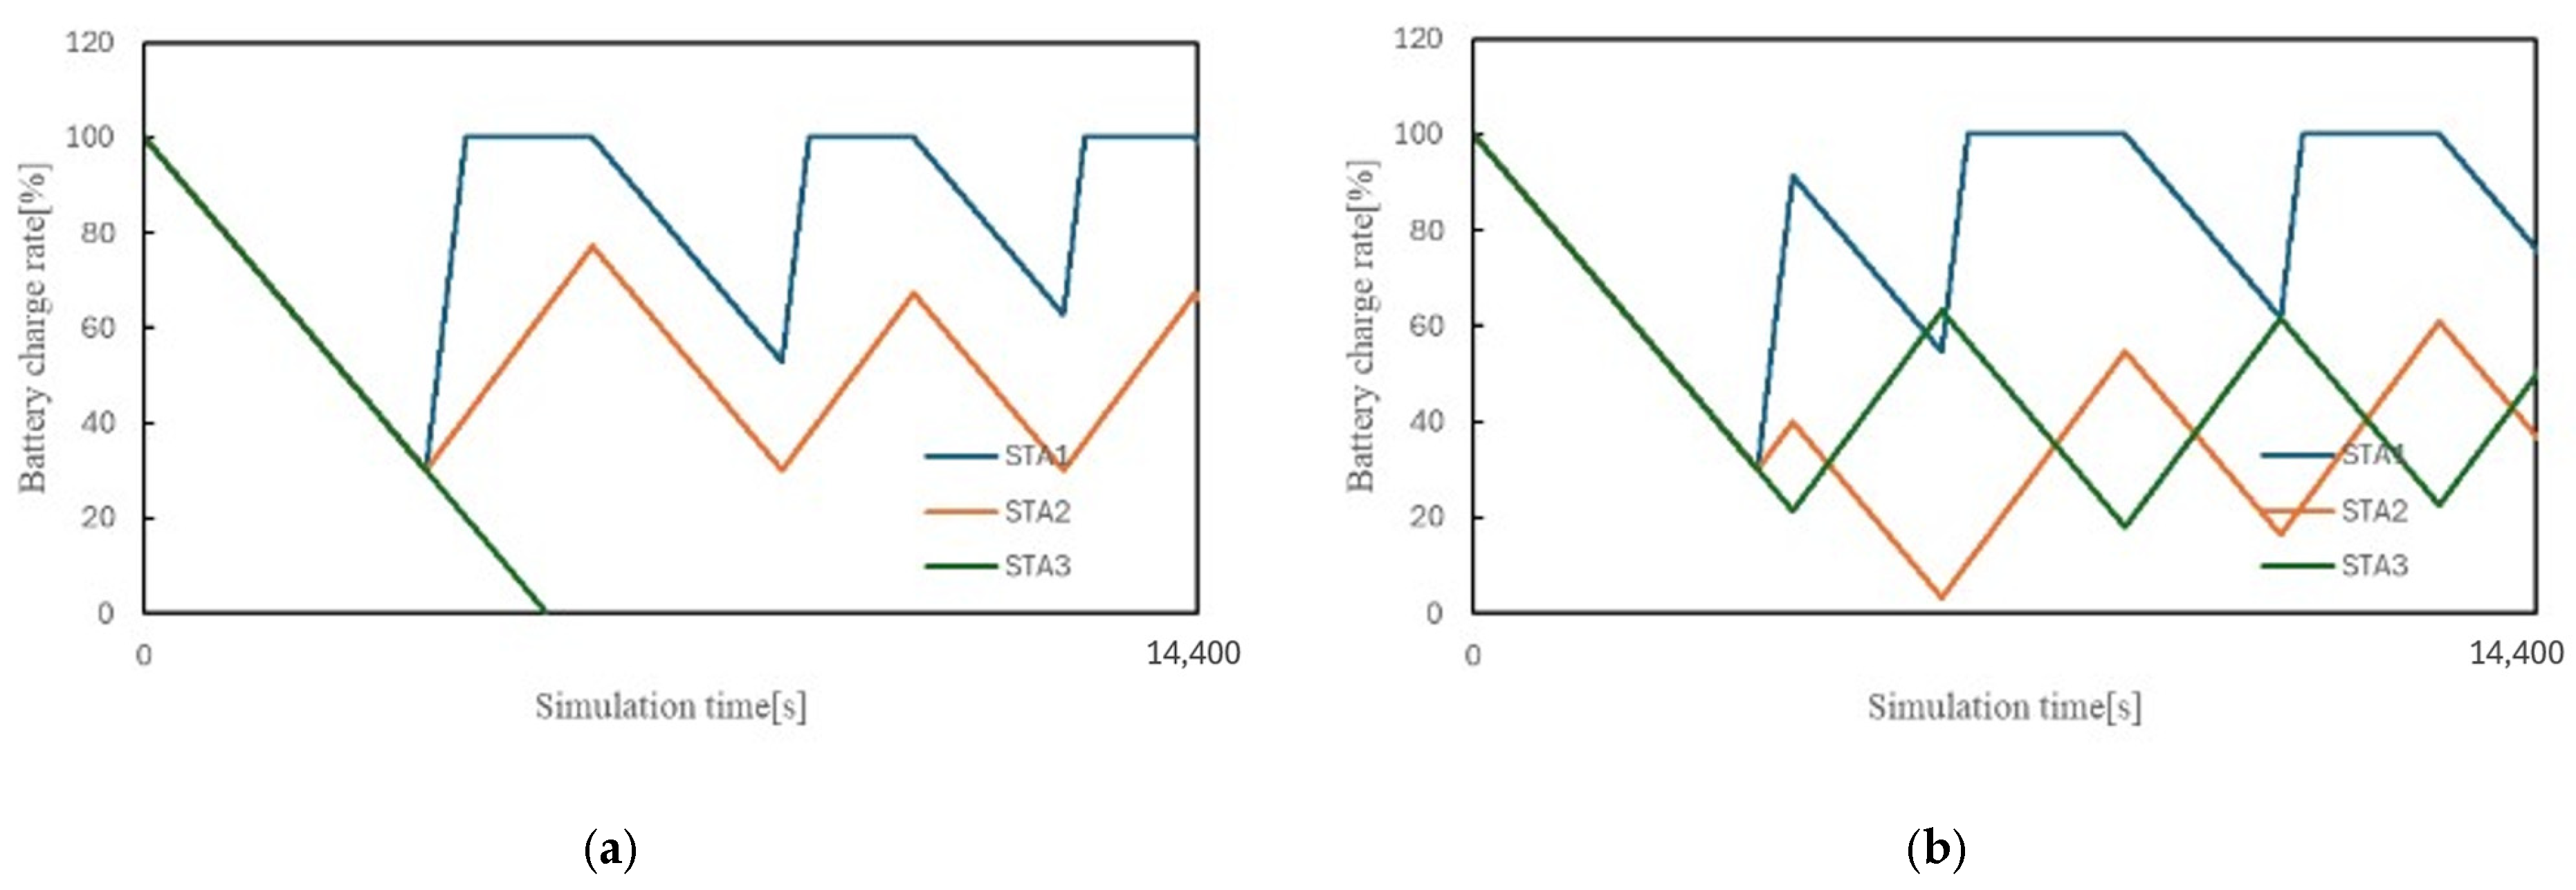
The STA parameters are listed in Table A1, and the alterations in the residual battery power before and after the grouping process are exhibited in Figure A3. STA3 demonstrates the capacity to procure power supply at an earlier juncture owing to the grouping methodology. Consequently, its depletion process of depletion is circumvented by implementing the grouping approach.
Figure A2. Flowchart for grouped power supply.
Iot 06 00028 g0a2
Figure A3. Battery transition by grouping. (a) Before grouping. (b) After grouping.
Iot 06 00028 g0a3
Table A1. STA parameters for grouping.
NameSet Value
Distance (STA1) [m]0.5
Distance (STA2-3) [m]1
Feeding request threshold ratio [%]30
Packet drop time [ms]11

References

  1. Lu, X.; Wang, P.; Niyato, D.; Kim, D.I.; Han, Z. Wireless charging technologies: Fundamentals, standards, and network applications. IEEE Commun. Surv. Tutor. 2016, 18, 1413–1452. [Google Scholar] [CrossRef]
  2. Yelizarov, A.A.; Nazarov, I.V.; Skuridin, A.A.; Yakimenko, S.I.; Ikonnikova, D.M. Features of Wireless Charging of Mobile and Wearable Devices for the IoT and Cyber Physical Systems. In Proceedings of the 2020 International Conference on Engineering Management and Communication Technology (EMCTECH), Vienna, Austria, 20–22 October 2020; pp. 1–4. [Google Scholar] [CrossRef]
  3. Lu, X.; Niyato, D.; Wang, P.; Kim, D.I.; Han, Z. Wireless charger networking for mobile devices: Fundamentals, standards, and applications. IEEE Wirel. Commun. 2015, 22, 126–135. [Google Scholar] [CrossRef]
  4. Rabih, M.; Takruri, M.; Al-Hattab, M.; Alnuaimi, A.A.; Bin Thaleth, M.R. Wireless Charging for Electric Vehicles: A Survey and Comprehensive Guide. World Electr. Veh. J. 2024, 15, 118. [Google Scholar] [CrossRef]
  5. Ahmad, A.; Alam, M.S.; Chabaan, R. A comprehensive review of wireless charging technologies for electric vehicles. IEEE Trans. Transp. Electrif. 2018, 4, 38–63. [Google Scholar] [CrossRef]
  6. Essa, A.; Almajali, E.; Mahmoud, S.; Amaya, R.E.; Alja’Afreh, S.S.; Ikram, M. Wireless power transfer for implantable medical devices: Impact of implantable antennas on energy harvesting. IEEE Open J. Antennas Propag. 2024, 5, 739–758. [Google Scholar] [CrossRef]
  7. Khan, S.R.; Pavuluri, S.K.; Cummins, G.; Desmulliez, M.P.Y. Wireless power transfer techniques for implantable medical devices: A review. Sensors 2020, 20, 3487. [Google Scholar] [CrossRef] [PubMed]
  8. Costanzo, A.; Apollonio, F.; Baccarelli, P.; Barbiroli, M.; Benassi, F.; Bozzi, M. Wireless Power Transfer for Wearable and Implantable Devices: A Review Focusing on the WPT4WID Research Project of National Relevance. In Proceedings of the 2021 XXXIVth General Assembly and Scientific Symposium of the International Union of Radio Science (URSI GASS), Rome, Italy, 28 August–4 September 2021; pp. 1–4. [Google Scholar] [CrossRef]
  9. Singh, V.; Bhandari, R.; Singh, Y.; Sehrawat, S.; Pandey, K. Wireless Power Transfer for Automated Industrial Applications: A Prototype. In Proceedings of the 2020 8th International Conference on Reliability, Infocom Technologies and Optimization (Trends and Future Directions) (ICRITO), Noida, India, 4–5 June 2020; pp. 63–67. [Google Scholar] [CrossRef]
  10. Krupiarz, P.; Zygarlicki, J. Wireless Power Transfer System Design for Industrial Mobile Robots—Initial Study. In Proceedings of the 2023 23rd International Scientific Conference on Electric Power Engineering (EPE), Brno, Czech Republic, 24–26 May 2023; pp. 1–6. [Google Scholar] [CrossRef]
  11. Tampubolon, M.; Pamungkas, L.; Chiu, H.-J.; Liu, Y.-C.; Hsieh, Y.-C. Dynamic wireless power transfer for logistic robots. Energies 2018, 11, 527. [Google Scholar] [CrossRef]
  12. Boitier, V.; Estibals, B.; Seguier, L. Powering a low power wireless sensor in a harsh industrial environment: Energy recovery with a thermoelectric generator and storage on supercapacitors. Energy Power Eng. 2023, 15, 11. [Google Scholar] [CrossRef]
  13. Huda, S.M.A.; Arafat, M.Y.; Moh, S. Wireless power transfer in wirelessly powered sensor networks: A review of recent progress. Sensors 2022, 22, 2952. [Google Scholar] [CrossRef] [PubMed]
  14. Ayling, A.; Fikes, A.; Mizrahi, O.S.; Wu, A.; Riazati, R.; Brunet, J.; Abiri, B.; Bohn, F.; Gal-Katziri, M.; Hashemi, M.R.; et al. Wireless power transfer in space using flexible, lightweight, coherent arrays. arXiv 2024, arXiv:2401.15267. [Google Scholar] [CrossRef]
  15. Kurs, A.; Karalis, A.; Moffatt, R.; Joannopoulos, J.D.; Fisher, P.; Soljačić, M. Wireless power transfer via strongly coupled magnetic resonances. Science 2007, 317, 83–86. [Google Scholar] [CrossRef] [PubMed]
  16. Shinohara, N. Wireless Power Transfer Via Radiowaves; Wiley-IEEE Press: Hoboken, NJ, USA, 2014. [Google Scholar]
  17. Brown, W.C. The history of power transmission by radio waves. IEEE Trans. Microw. Theory Tech. 1984, 32, 1230–1242. [Google Scholar] [CrossRef]
  18. Report ITU-R SM.2505. Available online: https://airfuel.org/wp-content/uploads/2023/06/R-REP-SM.2505-2022-PDF-E.pdf (accessed on 30 April 2025).
  19. Komatsuzaki, M.; Shinohara, N. Wireless power transmission via microwave for future drone charging station. IEICE Trans. Commun. 2021, E104.B, 1423–1431. [Google Scholar]
  20. Abeywickrama, S.; Samarasinghe, T.; Ho, C.K. Wireless Energy Beamforming Using Signal Strength Feedback. In Proceedings of the 2016 IEEE Global Communications Conference (GLOBECOM), Washington, DC, USA, 4–8 December 2016; pp. 1–6. [Google Scholar] [CrossRef]
  21. Smith, D.R.; Gowda, V.R.; Yurduseven, O.; Larouche, S.; Lipworth, G.; Urzhumov, Y.; Reynolds, M.S. An analysis of beamed wireless power transfer in the Fresnel zone using a dynamic, metasurface aperture. J. Appl. Phys. 2017, 121, 014901. [Google Scholar] [CrossRef]
  22. Khattak, A.B.; López, O.L.; Azarbahram, A.; Kumar, D.; Latva-Aho, M. End-to-end waveform and beamforming optimization for RF wireless power transfer. arXiv 2024, arXiv:2405.05659. [Google Scholar]
  23. Yang, G.; Vedady Moghadam, M.R.; Zhang, R. Magnetic Beamforming for Wireless Power Transfer. In Proceedings of the 2016 IEEE International Conference on Acoustics, Speech and Signal Processing (ICASSP), Shanghai, China, 20–25 March 2016; pp. 1–5. [Google Scholar] [CrossRef]
  24. Huţu, F.; Lechappé, V.; Villemaud, G.; Di Loreto, M. Distributed beamforming for wireless power transfer. In Proceedings of the 2020 XXXIIIrd General Assembly and Scientific Symposium of the International Union of Radio Science (URSI GASS), Rome, Italy, 29 August–5 September 2020; pp. 1–4. [Google Scholar] [CrossRef]
  25. Shen, S.; Kim, J.; Clerckx, B. Closed-loop wireless power transfer with adaptive waveform and beamforming: Design, prototype, and experiment. IEEE J. Microw. 2023, 3, 29–42. [Google Scholar] [CrossRef]
  26. Xiong, M.; Liu, M.; Zhang, Q.; Liu, Q.; Wu, J.; Xia, P. TDMA in adaptive resonant beam charging for IoT devices. IEEE Internet Things J. 2019, 6, 867–877. [Google Scholar] [CrossRef]
  27. Mochiyama, S.; Hiwatashi, K.; Hikihara, T. Upstream allocation of bidirectional load demand by power packetization. arXiv 2024, arXiv:2409.02352. [Google Scholar] [CrossRef]
  28. Ding, Z.; Yuan, X.; Zhang, R. Beamforming Design for Integrated Sensing and Wireless Power Transfer. arXiv 2022, arXiv:2210.15216. [Google Scholar]
  29. Zhou, X.; Zhang, C.; Guo, D. Low-Complexity Beamforming Design for Null Space-based Simultaneous Wireless Information and Power Transfer. arXiv 2025, arXiv:2503.08202. [Google Scholar]
  30. IEEE Std 802.11-2020 (Revision of IEEE Std 802.11-2016); IEEE Standard for Information Technology—Telecommunications and Information Exchange between Systems—Local and Metropolitan Area Networks—Specific Requirements—Part 11: Wireless LAN Medium Access Control (MAC) and Physical Layer (PHY) Specifications. IEEE: Piscataway, NJ, USA, 2021; pp. 1–4379. [CrossRef]
  31. Riverbed Modeler. Available online: https://support.riverbed.com/content/support/software/steelcentral-npm/modeler-index.html (accessed on 30 April 2025).
Figure 1. Transmission distance and amount of power received for different devices. (EIRP: equivalent isotropic radiated power).
Iot 06 00028 g001
Figure 2. Beamforming, feeding, and scheduling.
Iot 06 00028 g002
Figure 3. Conversion of power to packets.
Iot 06 00028 g003
Figure 4. Power–packet conversion method overview.
Iot 06 00028 g004
Figure 5. Variation in received power and transmission speed with transmission distance and transmission power.
Iot 06 00028 g005
Figure 6. Feed time per distance relative to number of packets requested.
Iot 06 00028 g006
Figure 7. Common power-supply sequence.
Iot 06 00028 g007
Figure 8. Example of time allocation in the FCFS scheme.
Iot 06 00028 g008
Figure 9. Flowchart of each scheduling scheme.
Iot 06 00028 g009
Figure 10. Battery transition in RR (e.g., TS: 2).
Iot 06 00028 g010
Figure 11. Average response time for each scheme.
Iot 06 00028 g011
Figure 12. Flowchart of power-supply request notification in MFQ scheme.
Iot 06 00028 g012
Figure 13. Example of basic operation of MFQ.
Iot 06 00028 g013
Figure 14. Example of MFQ promotion operation.
Iot 06 00028 g014
Figure 15. STA placement in the evaluation model.
Iot 06 00028 g015
Figure 16. Battery transition in FCFS scheme. (a) Feeding request threshold ratio 20 [%]. (b) Feeding request threshold ratio 60 [%].
Iot 06 00028 g016
Figure 17. Battery transition in RR scheme. (a) TS: 25 [min]. (b) TS: 15 [min]. (c) TS: 5 [min].
Iot 06 00028 g017
Figure 18. Battery transition in MFQ scheme. (a) Without promotion. (b) With promotion.
Iot 06 00028 g018
Figure 19. Configuration with STA1 at different distances.
Iot 06 00028 g019
Figure 20. Battery transition at different distances. (a) RR TS: 5 [min]. (b) MFQ TS: 5 [min].
Iot 06 00028 g020
Figure 21. Evaluation of the number of packets received and the total amount of power received at different distances.
Iot 06 00028 g021
Figure 22. MFQ battery transition according to power consumption. (a) RR TS: 5. (b) MFQ TS: 5.
Iot 06 00028 g022
Figure 23. Evaluation of the number of packets received and the total amount of power received with different power consumptions.
Iot 06 00028 g023
Table 1. STA common parameter list.
NameSet Value
Distance (STA1–4) [m]1
Battery size [packets]500,000
Packet drop time [ms]21
Feeding request threshold ratio [%]20
Transmission power [W]32
Transmission antenna gain [dBi]32.2
Table 2. STA parameters by distance.
NameSet Value
Distance (STA1) [m]1.5
Distance (STA2–4) [m]1
Packet drop time [ms]28
Table 3. STA parameters by power consumption.
NameSet Value
Packet drop time (STA1) [ms]13
Packet drop time (STA2–4) [ms]27
Disclaimer/Publisher’s Note: The statements, opinions and data contained in all publications are solely those of the individual author(s) and contributor(s) and not of MDPI and/or the editor(s). MDPI and/or the editor(s) disclaim responsibility for any injury to people or property resulting from any ideas, methods, instructions or products referred to in the content.