

Development of a Low-Cost Internet of Things Platform for Three-Phase Energy Monitoring in a University Campus


Abstract
1. Introduction
- Sensors and data acquisition: We designed and implemented low-cost three-phase electrical energy meters adapted to the three-phase nature of the electrical network in our university campus; then, we strategically installed them across the INPT university campus buildings in order to track and gather electrical consumption data of different usage profiles, establishing the core of our IoT platform. This distribution of sensors will provide us with detailed energy profile usage data allowing us to understand and analyze their consumption patterns.
- Protocols and communication: We integrated proper communication protocols and technologies in order to implement a transmission network infrastructure to ensure the data transfer from the sensors to the data center’s server. We implemented two communication technologies, Wi-Fi and LoRa, leading to the development of two main types of electrical meters in the previous sensors stage: Wi-Fi and LoRa-based ones.
- Cloud, data storage and visualization: We propose a complete IoT architecture making us able to store the measured data in our cloud data center’s server database; also, we integrate user-friendly dashboard platforms to monitor electrical parameters through customized dashboards. Eventually, the database will be used for the detailed characterization and development of forecast models.
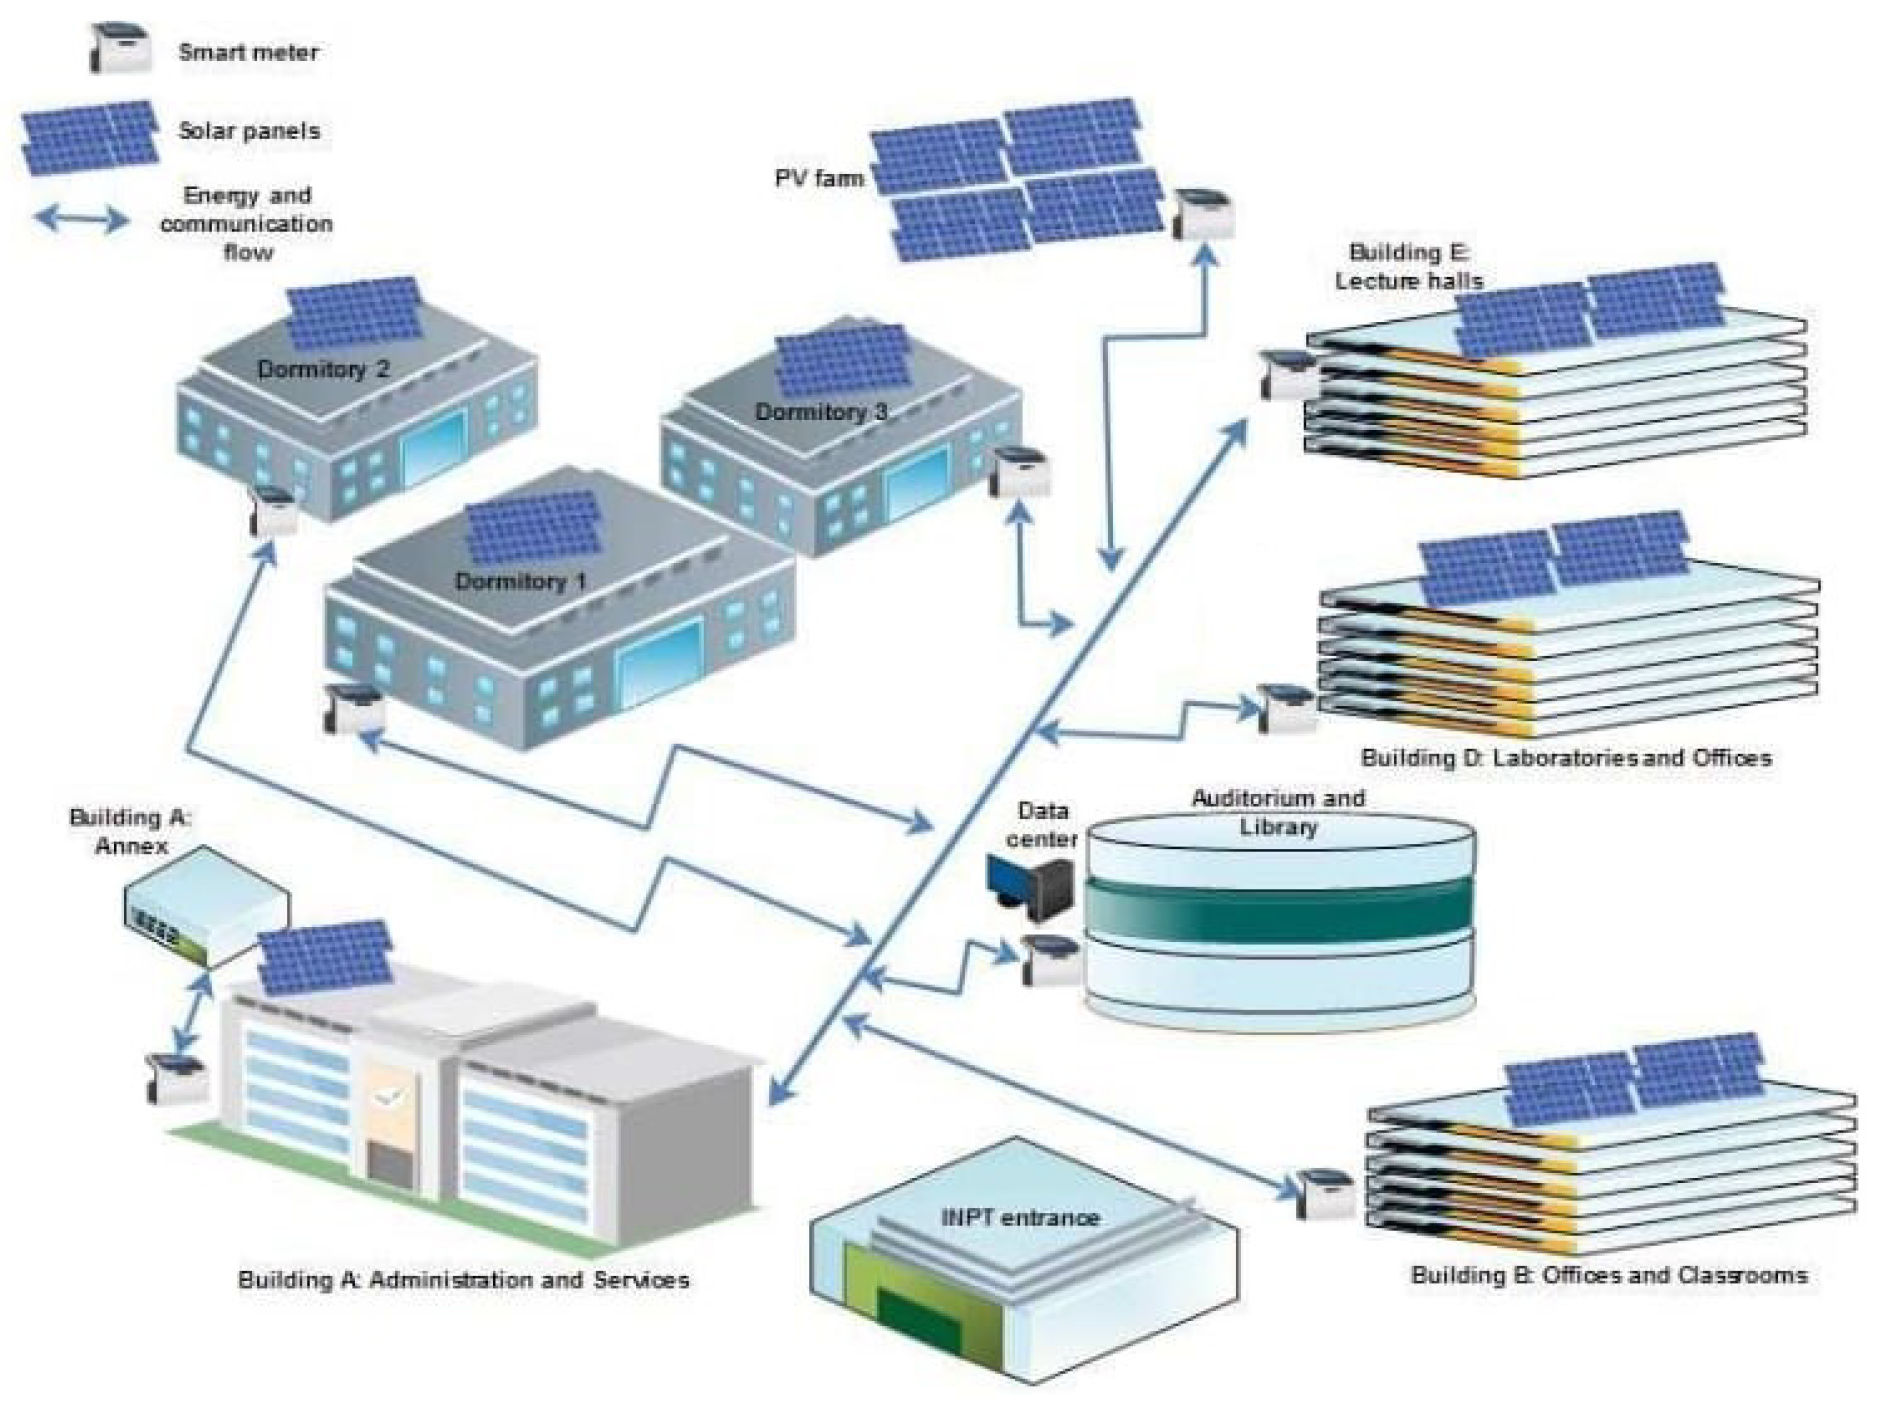
2. University Campus’s Microgrid Architecture
- Data storage within a database.
- Visualization of pertinent information regarding component measurements and statuses via graphical representations.
- Management of feedback from peripheral-triggered alarms (such as threshold crossings or failure detection).
- Limited mobility.
- Difficulties in remotely accessing the status of industrial installations.
- Wired-only exchanges between the SCADA software and industrial devices (such as measuring units and PLCs).
- Local SCADA supervision and information access (including data, status, and alerts).
- Local data storage (resulting in a risk of data loss), the need for multiple locally based SCADA software systems at remote sites rather than a single.
- Centralized system that can manage all aspects.
- Permanent restrictions on the maintenance team’s ability to intervene remotely.
- High installation costs.
- Obsolescence of diverse and non-interoperable industrial information systems.
- Lack of predictive analysis capabilities.
- Introducing IoT technology and wireless communication in the microgrid architecture within the university campus.
- Consolidating the largest number of communication modes/protocols (Ethernet, LoRa, Wi-Fi, MQTT, etc.) on the same platform in order to guarantee compatibility between the different equipment (measurement units, PLCs, servers, etc.) in the network.
- Connecting the SCADA system of an industrial nature to the Internet to enable it to benefit from its services; in this case, cloud computing, artificial intelligence, terminal mobility, and the concept of remote installation control.
- Supervising the various university campus microgrid metrics online, analyzing the results, and receiving online alerts and notifications.
- Collecting data from the measurement centers and extraction of load and electricity consumption curves in order to describe the energy behavior of different university campus buildings.
- Developing energy consumption prediction algorithms specific to the existing installations.
- Producing profiling analyses using machine learning techniques.
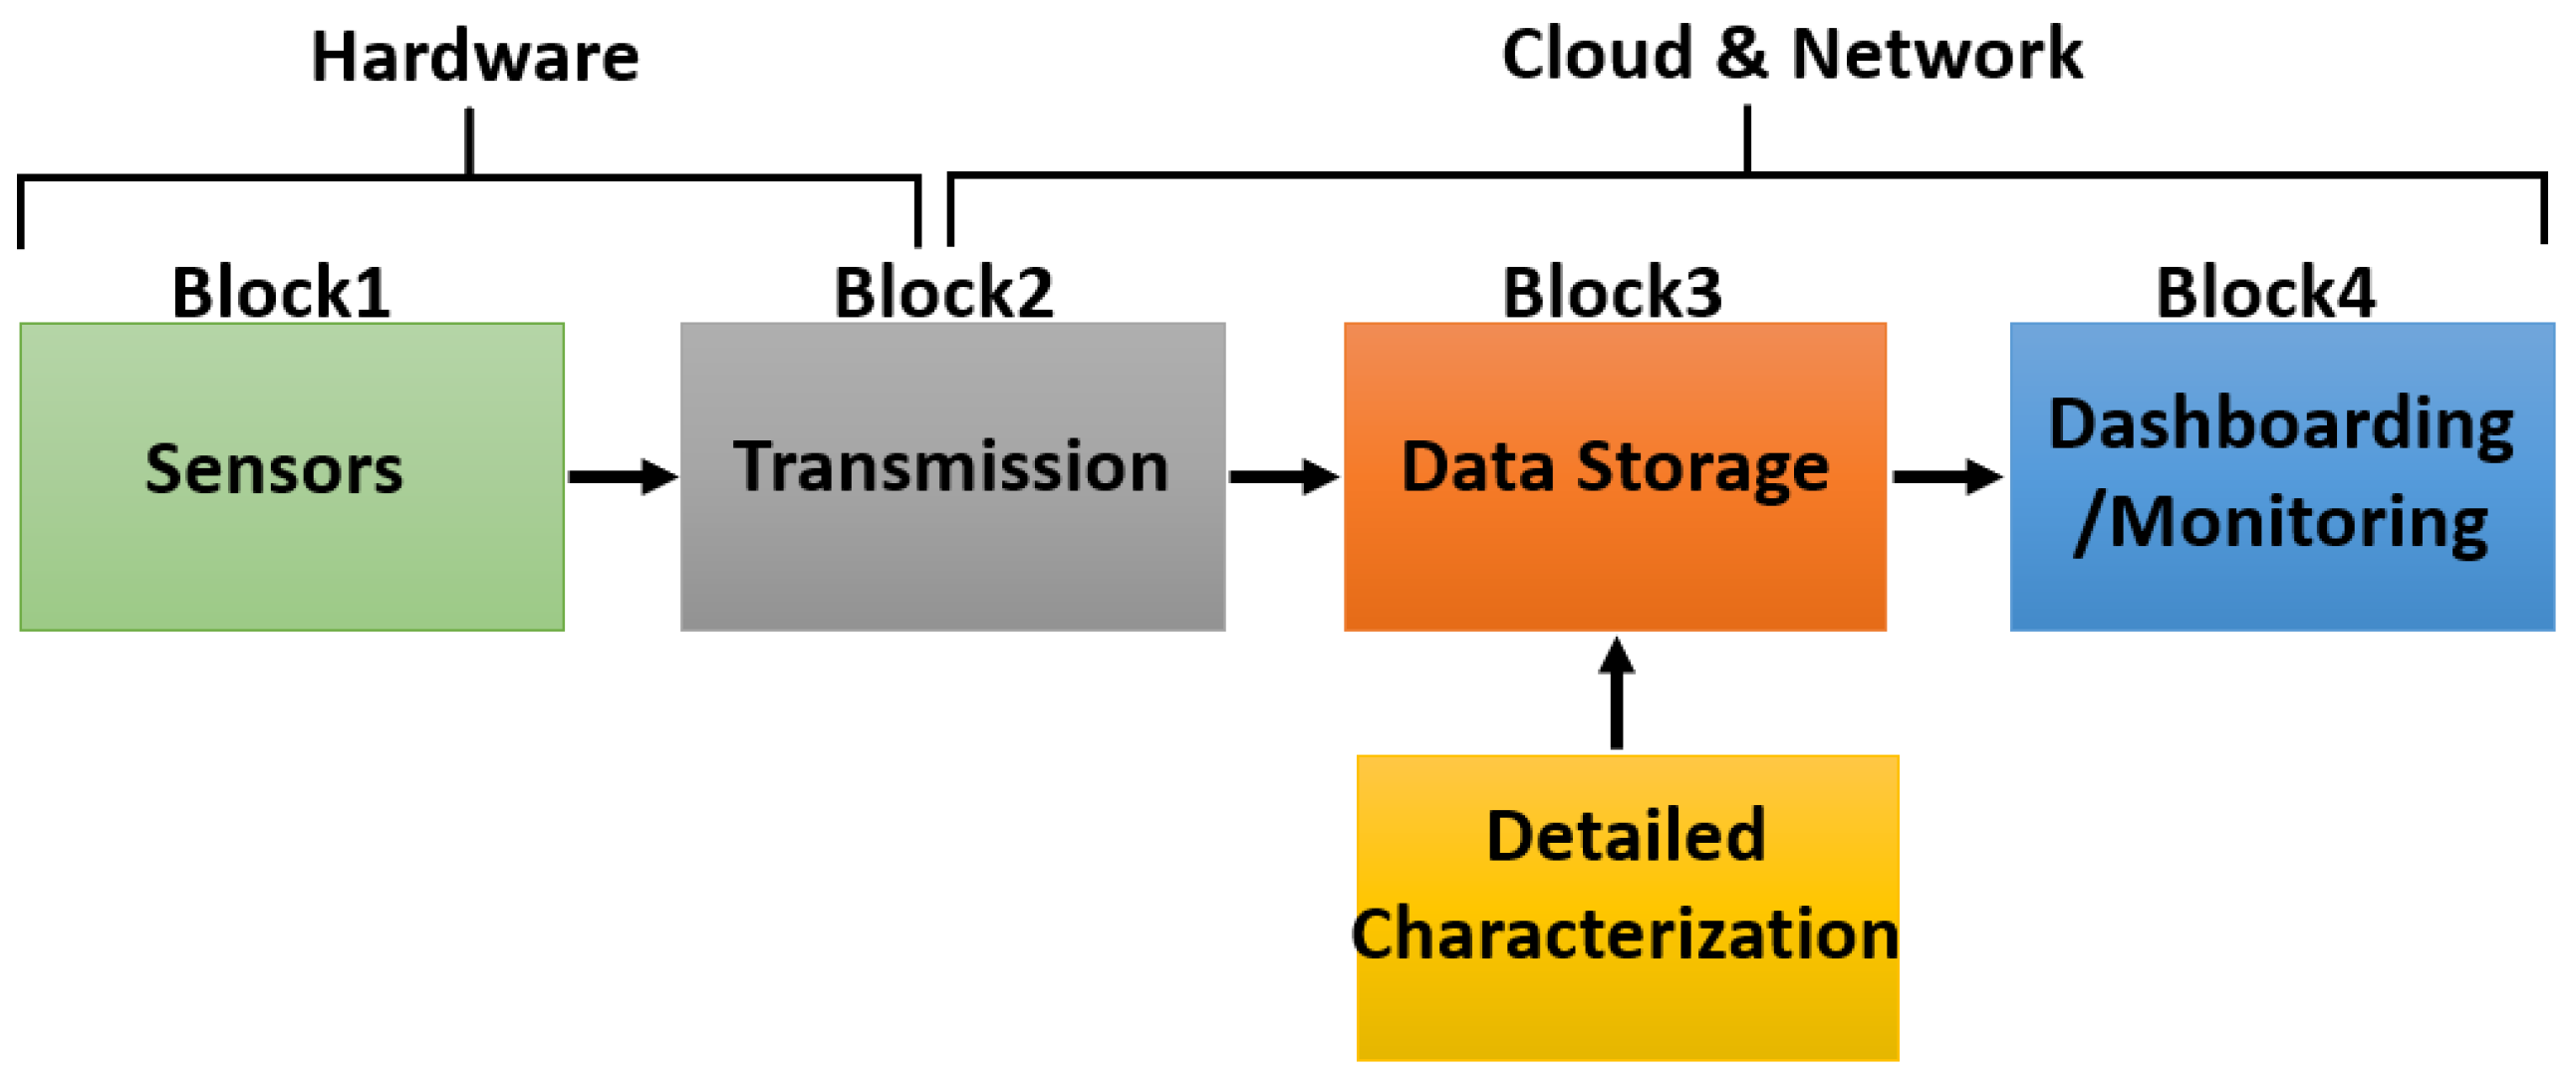
3. Proposed IoT Platform
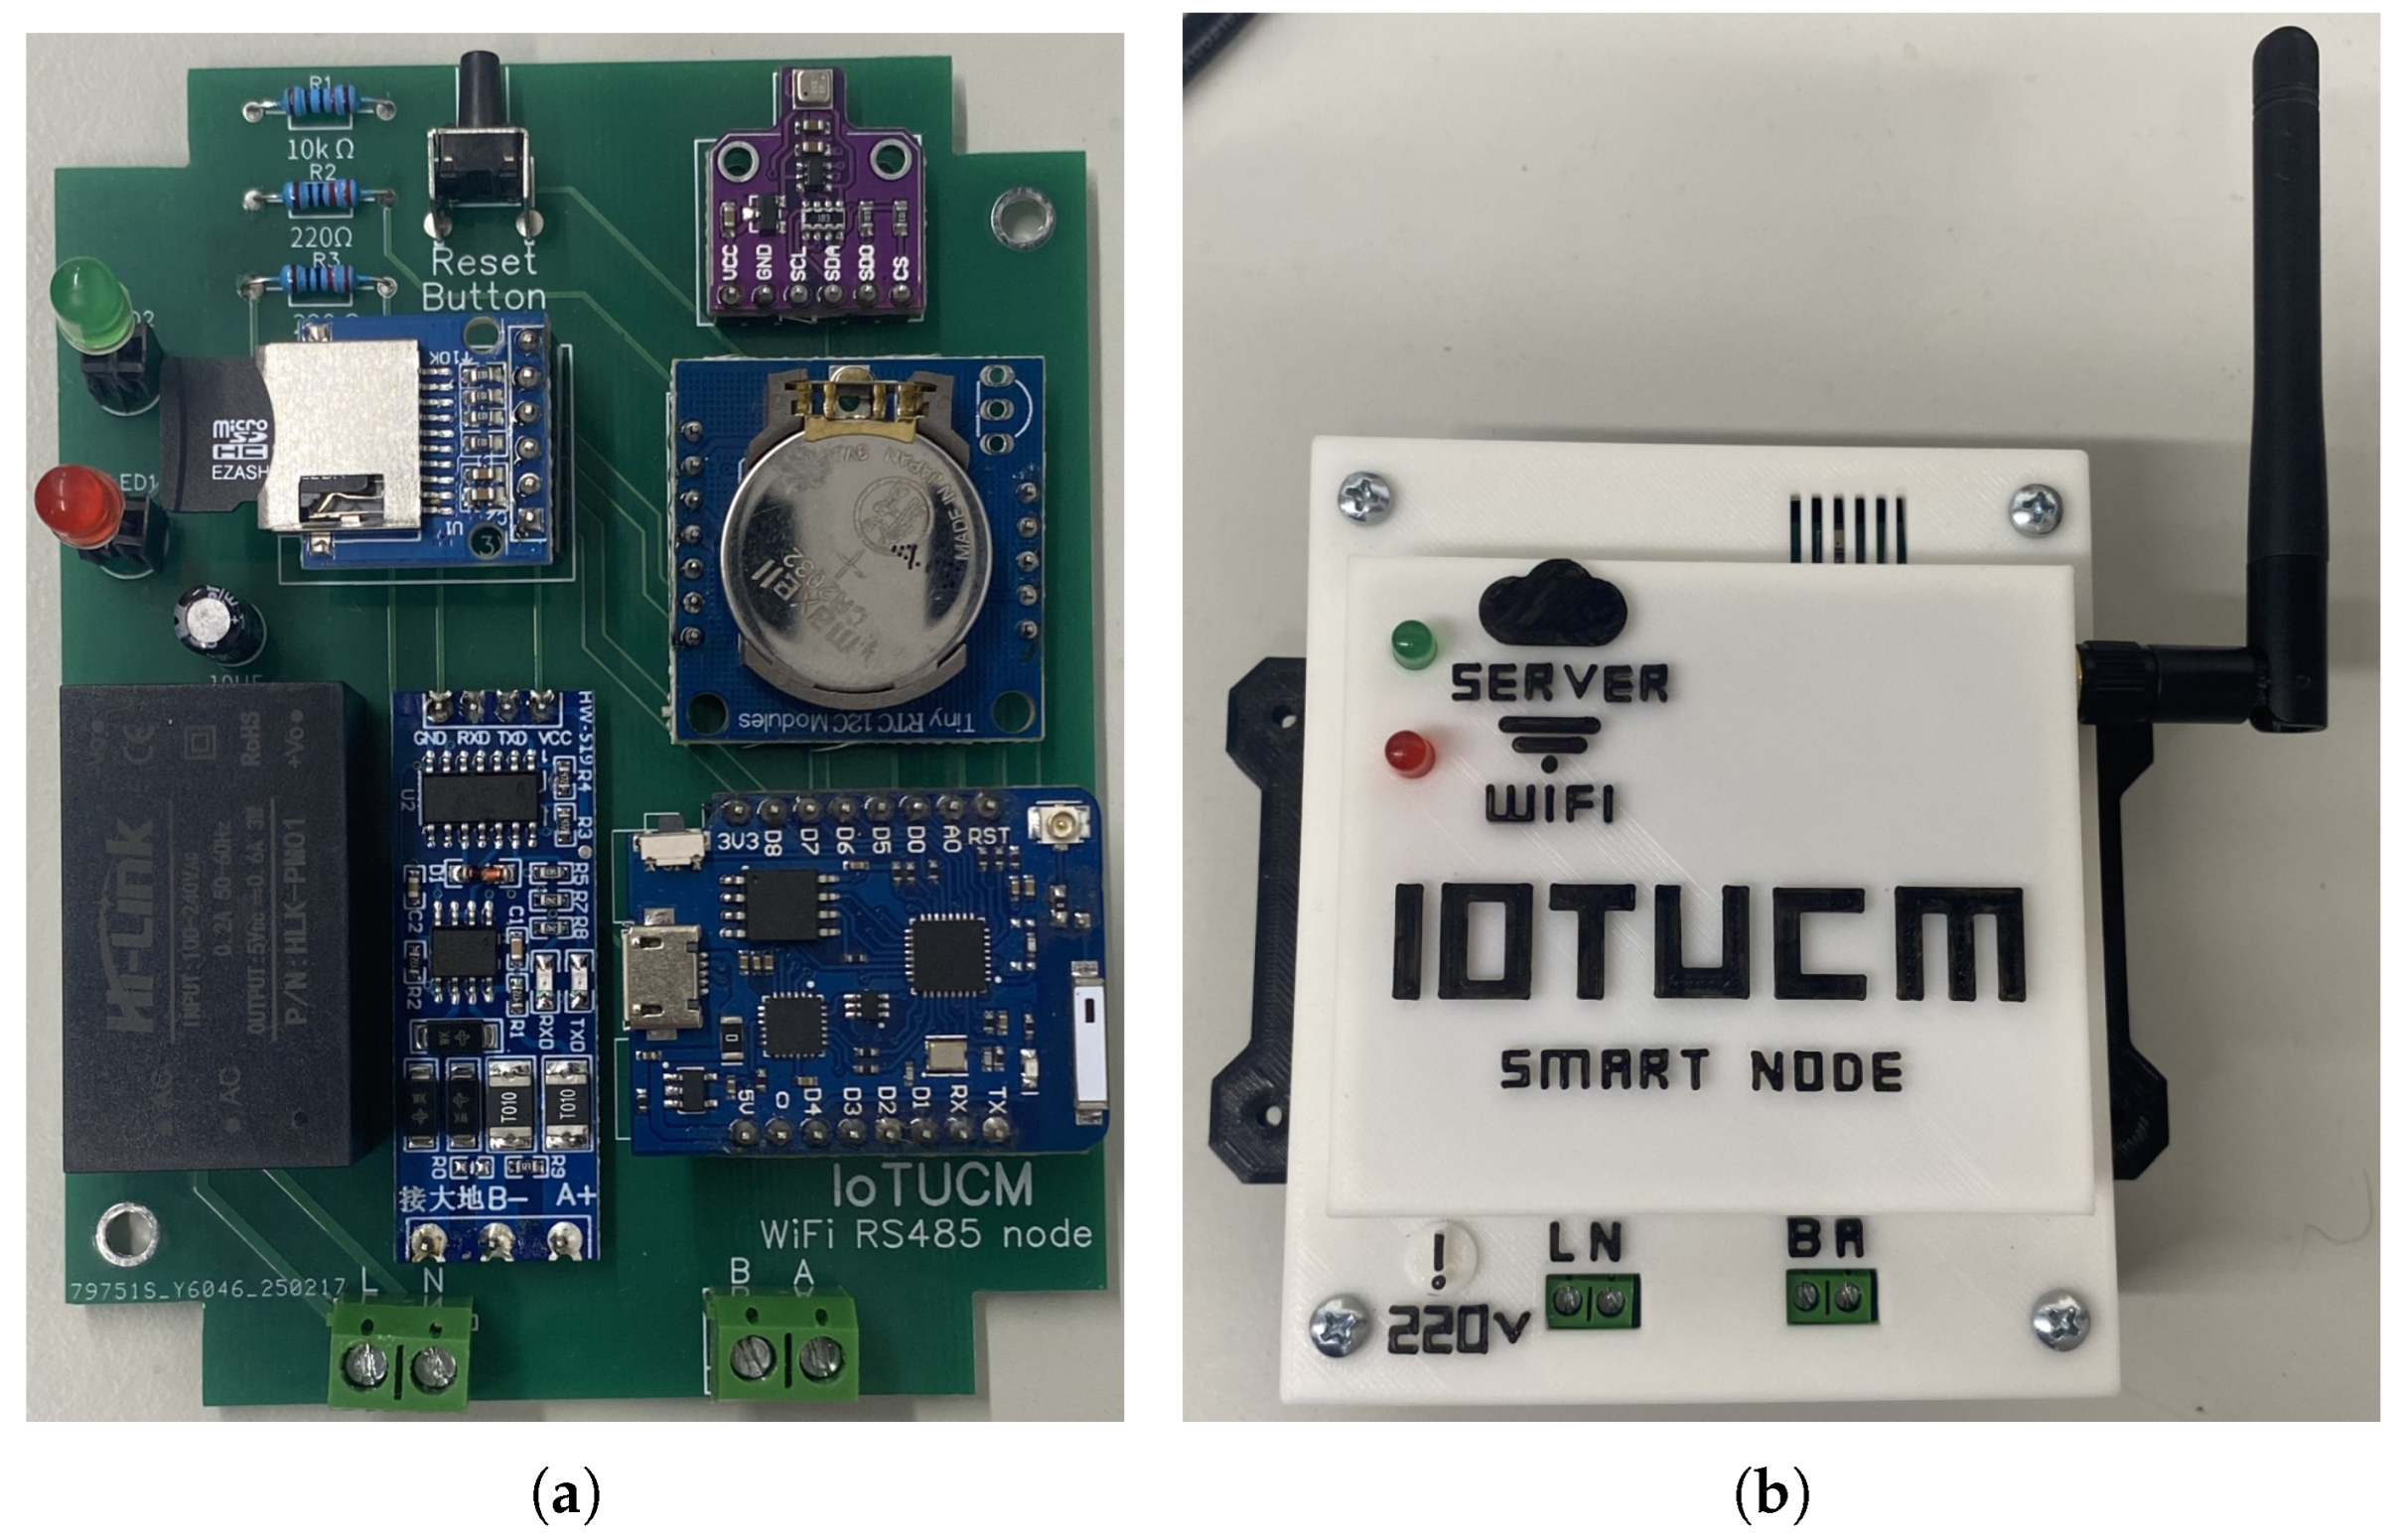
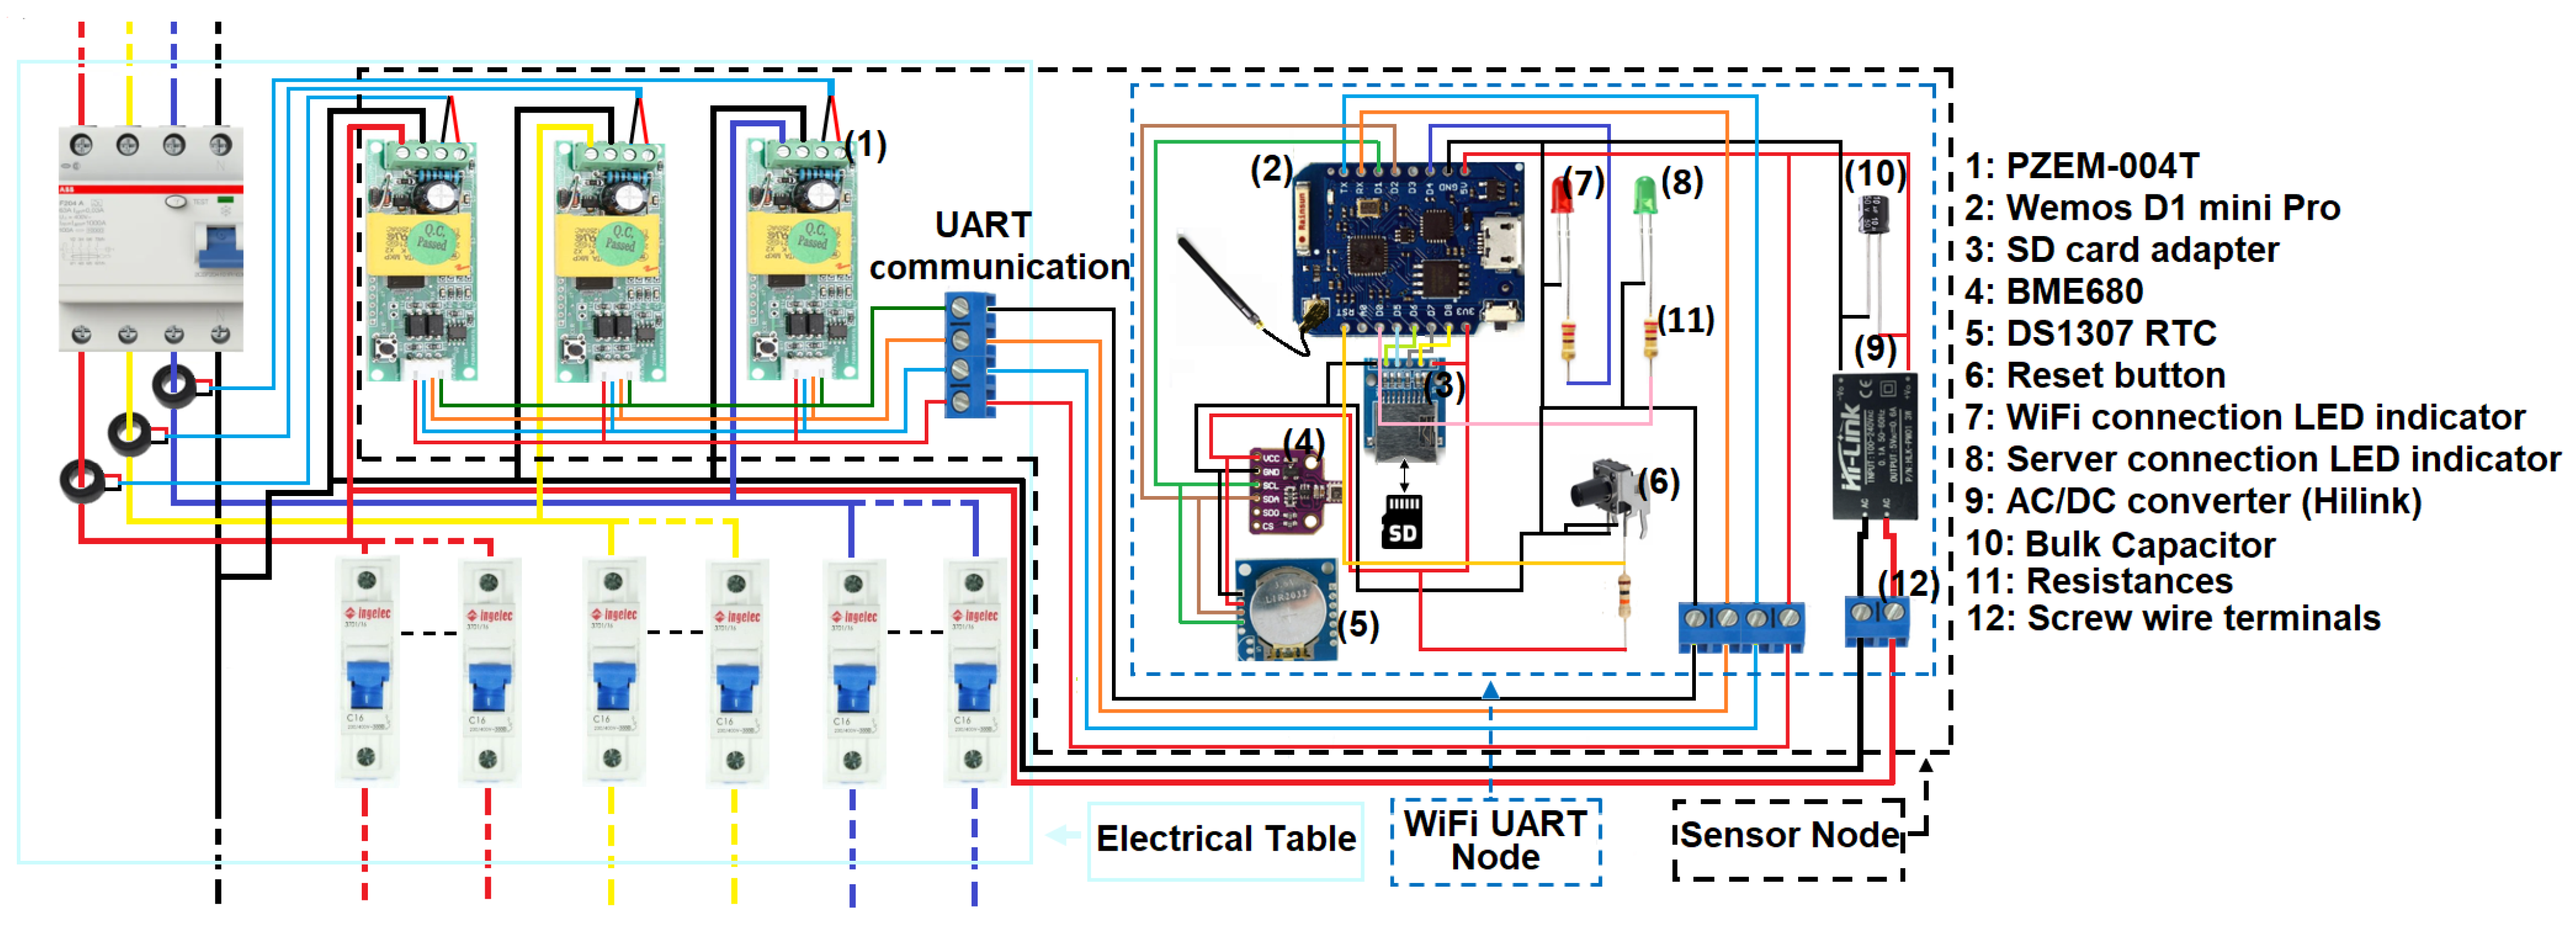
3.1. Hardware
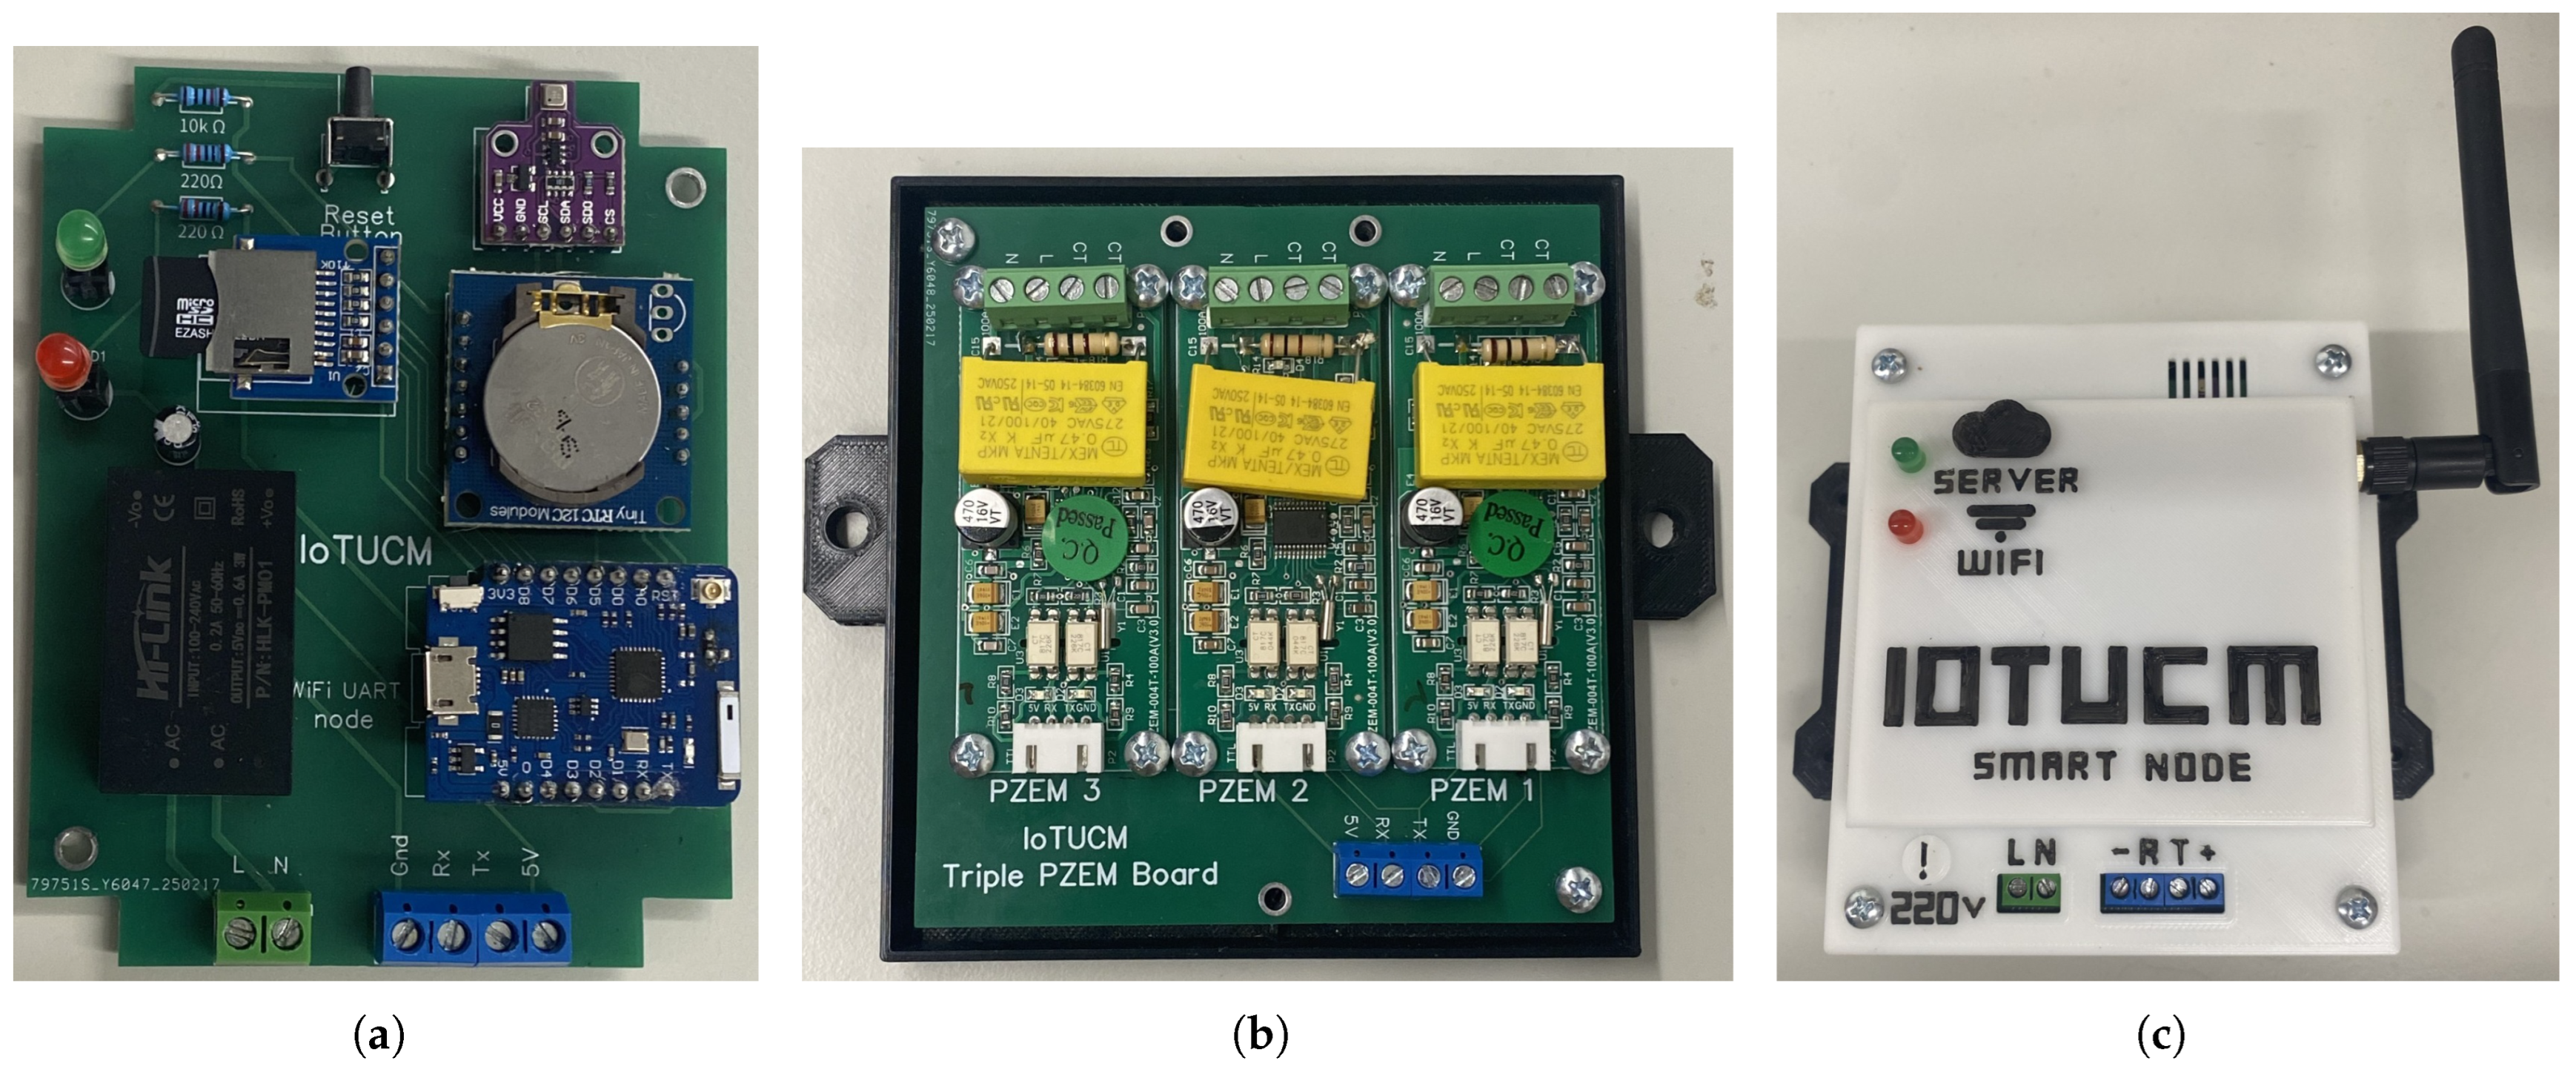
3.1.1. Wi-Fi Nodes
ADL Wi-Fi Sensor Node
Triple PZEM Sensor Node
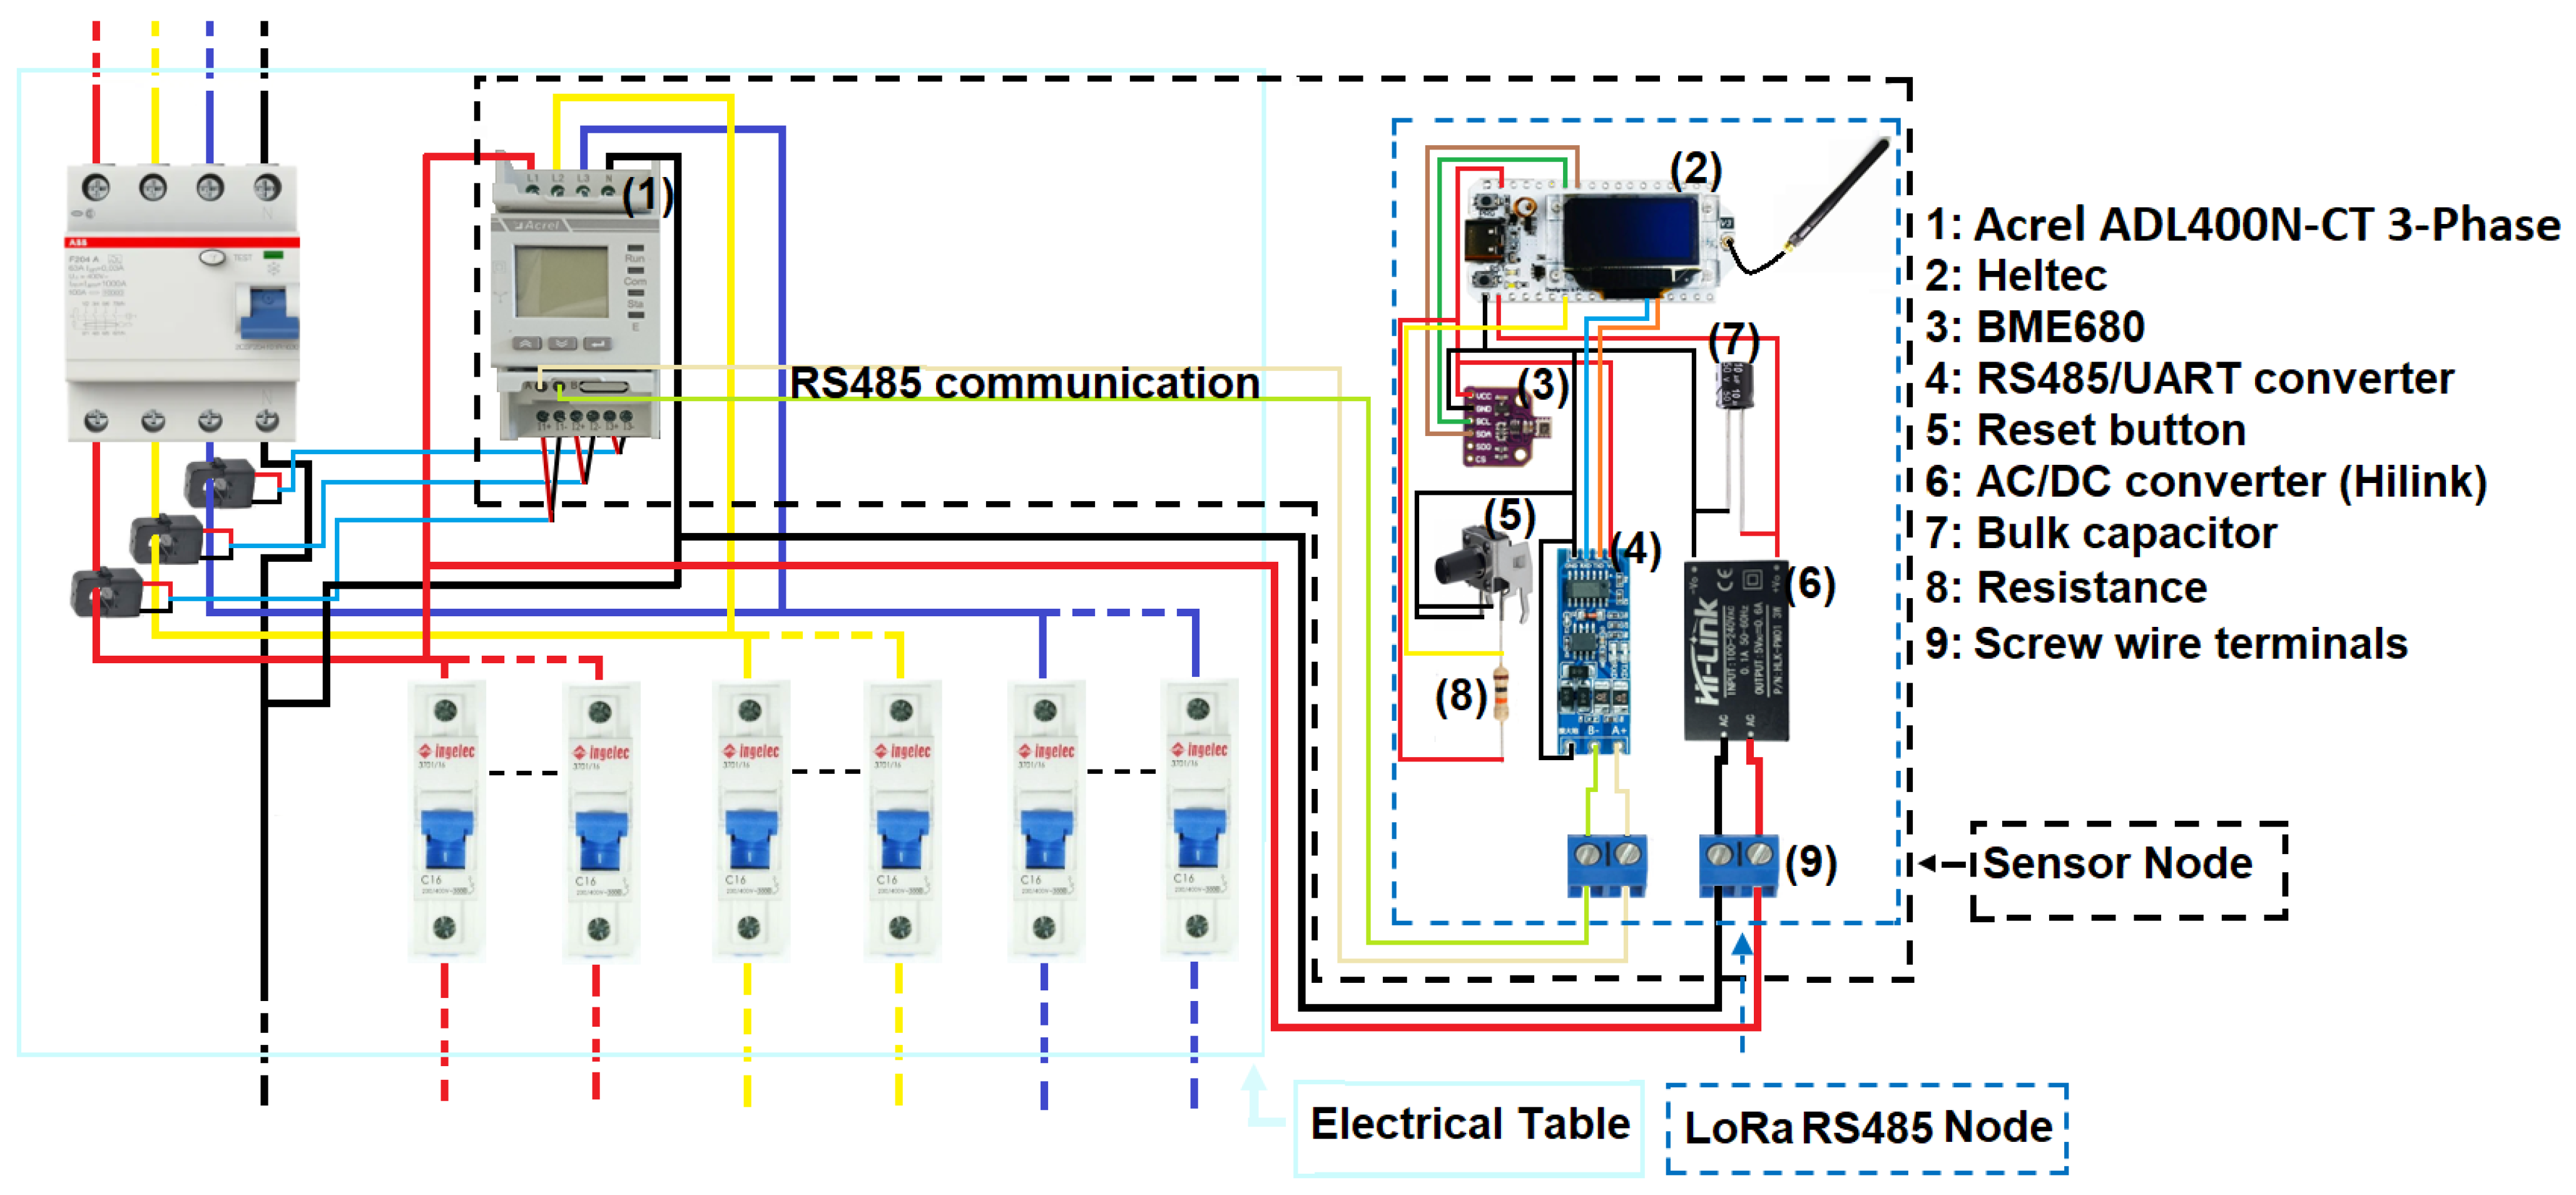
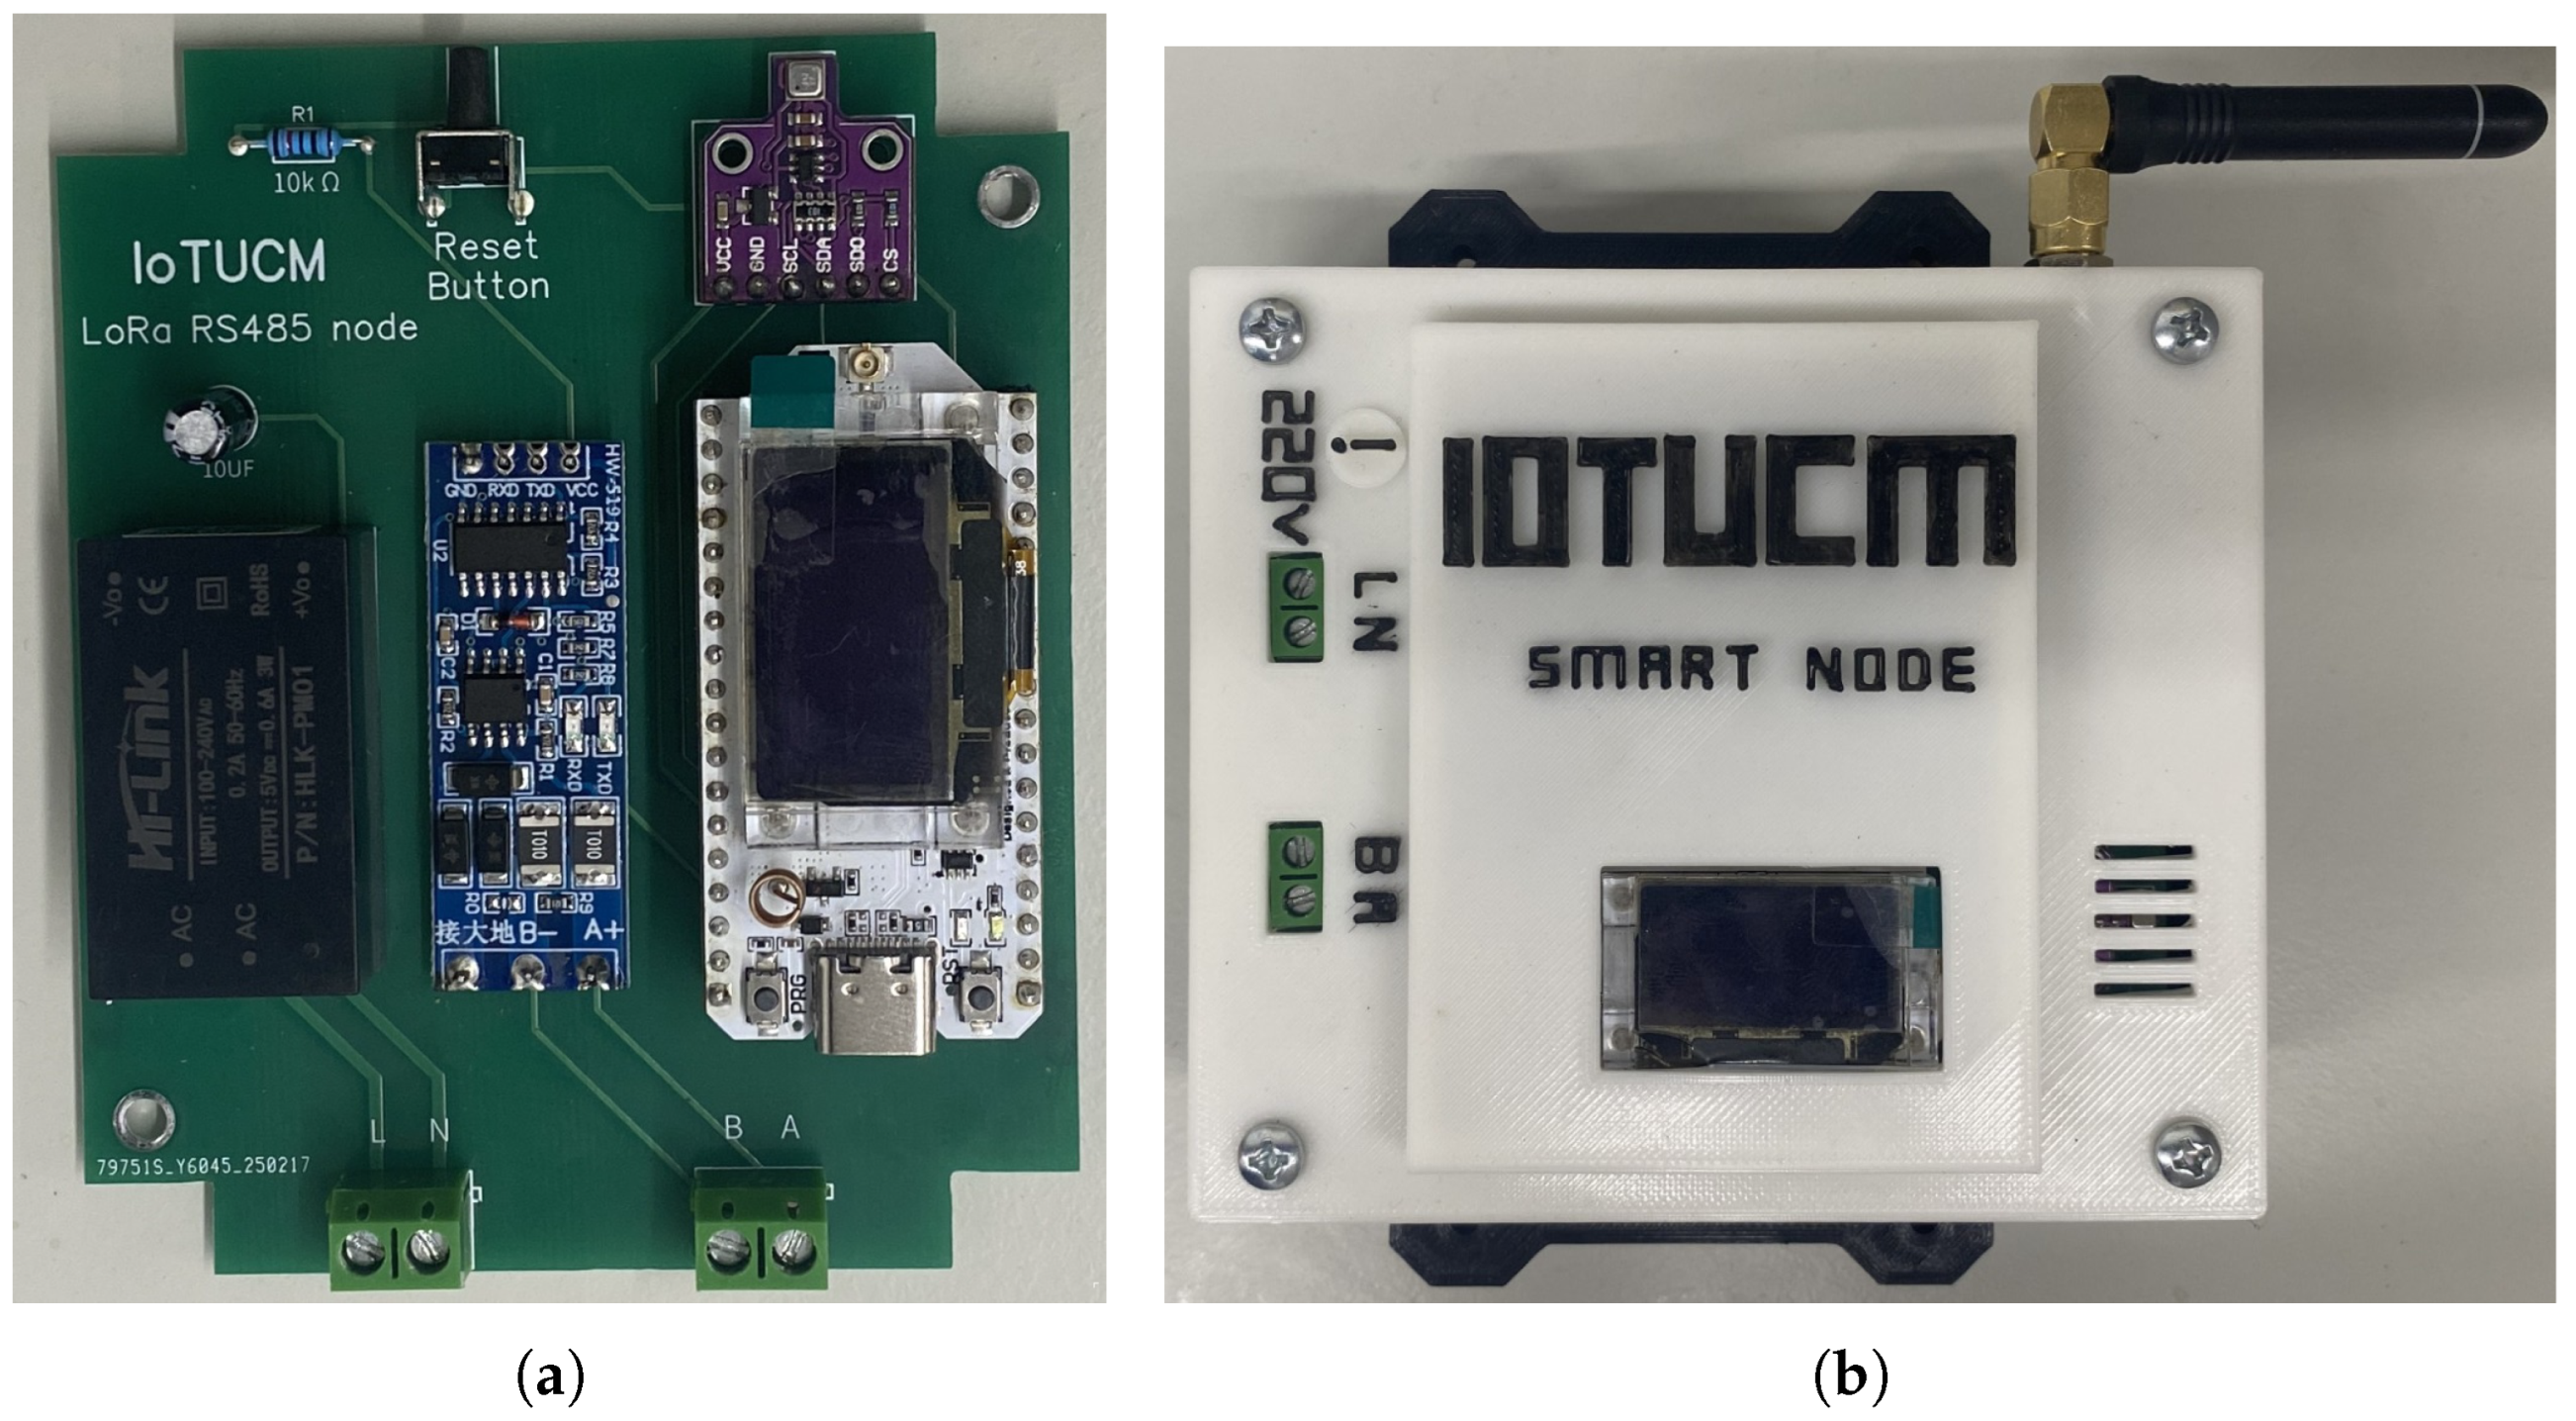
3.1.2. ADL LoRa Sensor Node
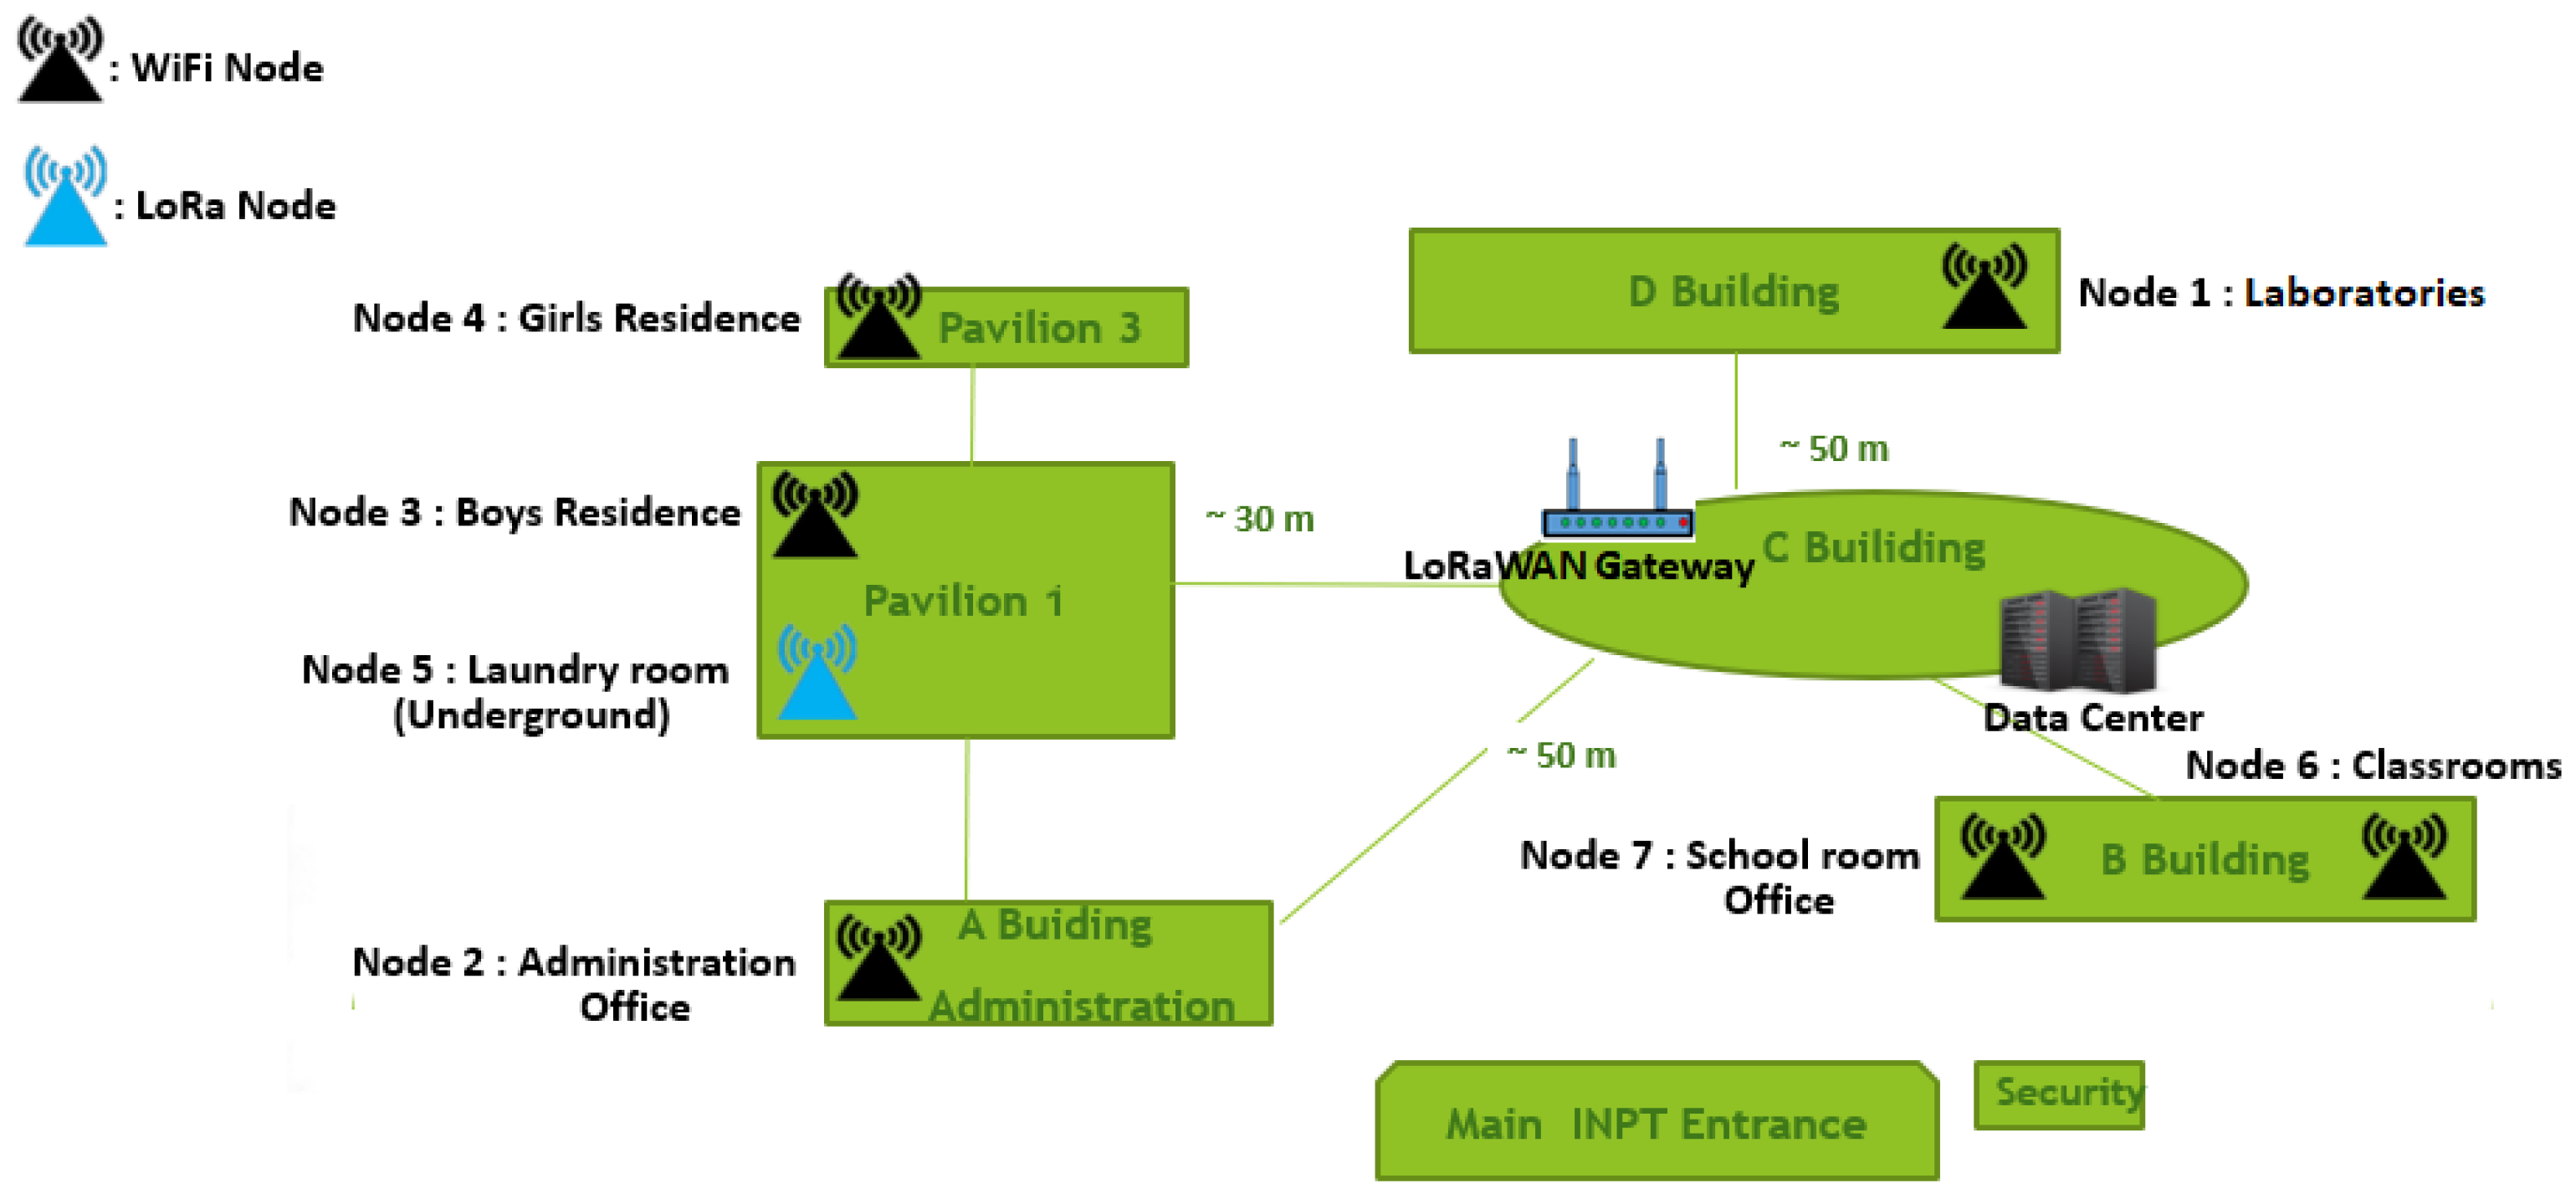
3.1.3. Sensor Nodes Placement
3.2. Cloud and Network
3.2.1. Transmission
3.2.2. Data Storage
3.2.3. Monitoring
3.2.4. Cloud and Network Set Up
4. Use Case: Energy Profiling
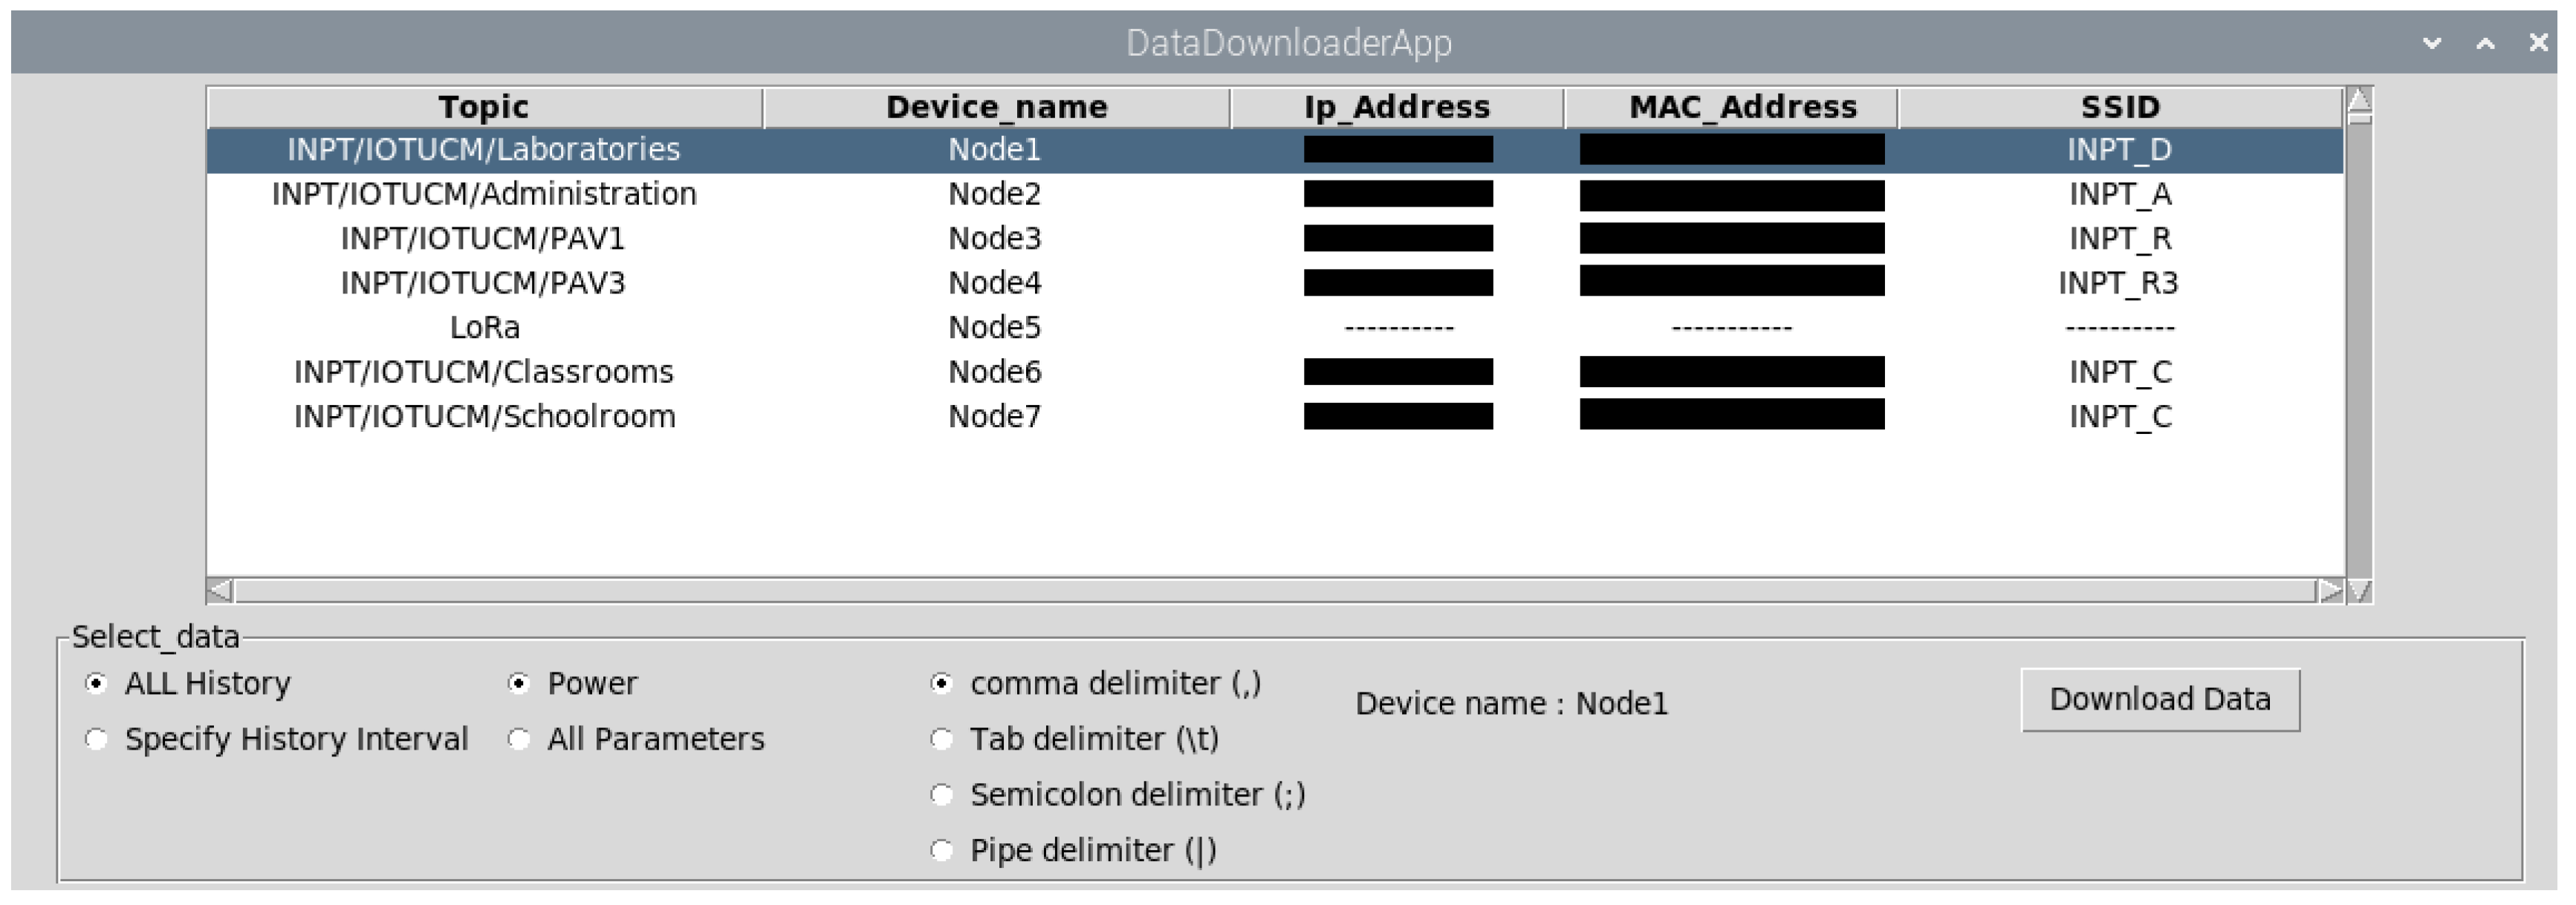
- Data acquisition: This involves collecting data from the data storage center by logging into the data downloader application.
- Data classification: This analysis involved isolating data based on keeping the electrical power parameter. This approach mirrors one of the functionalities of our existing data downloader application, which provides the option to download power parameter data, alongside the option to download the dataset with all the available parameters, as we can see in Figure 10. By the way, the application can be easily designed to be modifiable to support the exclusive selection of any parameter as can be dictated by the analytics team.
- Data analysis and validation: This involves analyzing the data by considering the following key points:
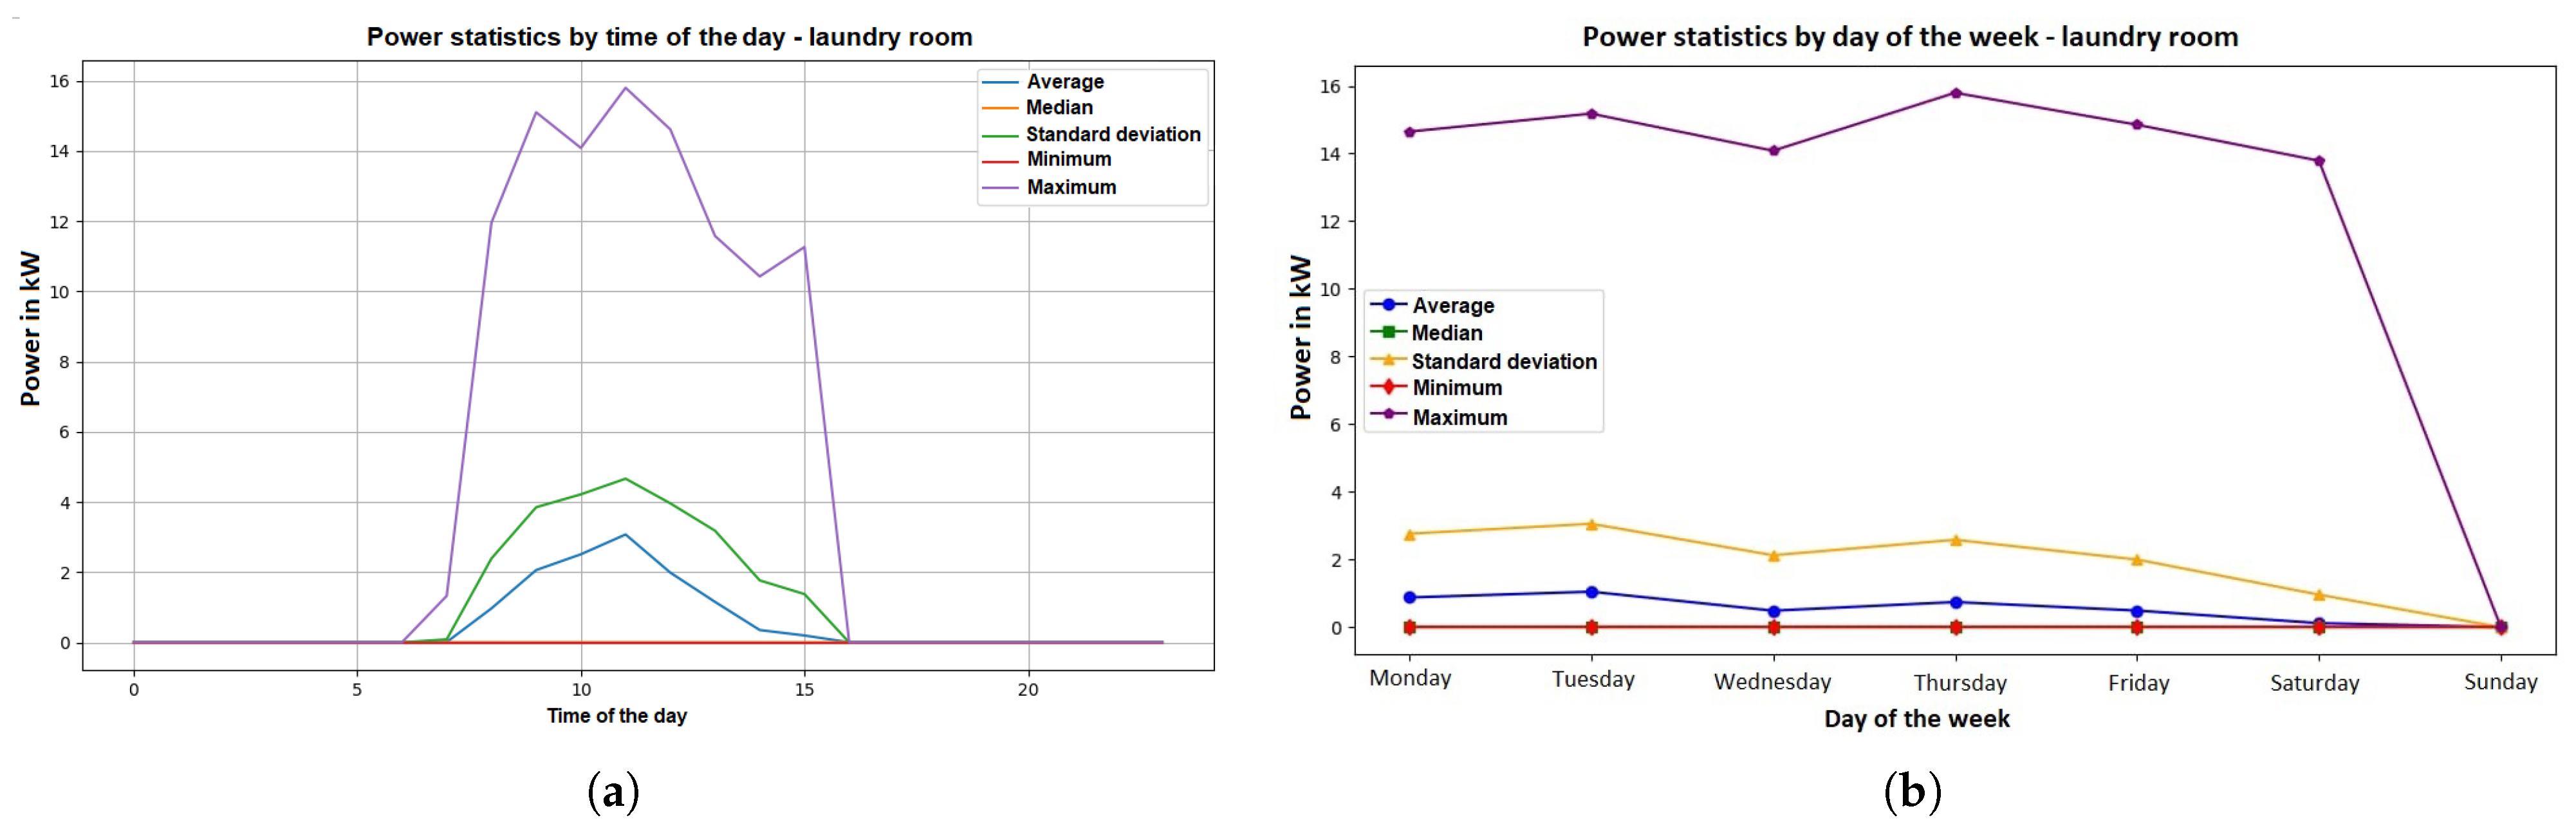
- Analyzing the average electrical distributions.
- Performing statistical analysis.
- Detecting electrical correlations.
- Grouping data with similar patterns.
- Establishing inputs for the prediction models.
- Analyzing user habits to justify the distribution of consumption.
4.1. Data Characterization
4.2. Position Settings
4.3. Energy Profile
5. Conclusions and Future Work
Author Contributions
Funding
Data Availability Statement
Conflicts of Interest
Abbreviations
| IoT | Internet of Things |
| LoRa | Long range |
| LoRaWAN | Long range wireless area network |
| CT | Current transformer |
| RS485 | Recommended standard 485 |
| UART | Universal asynchronous receiver/transmitter |
| I2C | Inter-integrated circuit |
| LED | Light emitting diode |
| SD | Secure digital |
| SPI | Serial peripheral interface |
| RTC | Real-time clock |
| 3D | Three-dimensional |
| PCB | Printed circuit board |
| AC | Alternating current |
| DC | Direct current |
| MQTT | Message queuing telemetry transport |
| CoAP | Constrained application protocol |
| HTTP | Hypertext transfer protocol |
| kW | Kilowatt |
| IoTUCM | IoT-based university campus microgrid in an African context |
References
- Nižetić, S.; Šolić, P.; Gonzalez-De, D.L.D.I.; Patrono, L. Internet of Things (IoT): Opportunities, issues and challenges towards a smart and sustainable future. J. Clean. Prod. 2020, 274, 122877. [Google Scholar] [CrossRef] [PubMed]
- Mazhar, T.; Irfan, H.M.; Haq, I.; Ullah, I.; Ashraf, M.; Shloul, T.A.; Ghadi, Y.Y.; Imran; Elkamchouchi, D.H. Analysis of challenges and solutions of IoT in smart grids using AI and machine learning techniques: A review. Electronics 2023, 12, 242. [Google Scholar] [CrossRef]
- De Santis, A.; Ferrara, A.L.; Flores, M.; Masucci, B. Continuous Entity Authentication in the Internet of Things Scenario. Appl. Sci. 2023, 13, 5945. [Google Scholar] [CrossRef]
- Ashton, K. That ‘internet of things’ thing. RFID J. 2009, 22, 97–114. [Google Scholar]
- Aman, A.H.M.; Yadegaridehkordi, E.; Attarbashi, Z.S.; Hassan, R.; Park, Y.J. A survey on trend and classification of internet of things reviews. IEEE Access 2020, 8, 111763–111782. [Google Scholar] [CrossRef]
- Moreira, F.T.; Vairinhos, M.; Ramos, F. Teachers’ perceptions about IoT technologies in school activities. Educ. Media Int. 2024, 61, 184–197. [Google Scholar] [CrossRef]
- Abir, S.A.A.; Anwar, A.; Choi, J.; Kayes, A.S.M. Iot-enabled smart energy grid: Applications and challenges. IEEE Access 2021, 9, 50961–50981. [Google Scholar] [CrossRef]
- Pau, M.; Patti, E.; Barbierato, L.; Estebsari, A.; Pons, E.; Ponci, F.; Monti, A. A cloud-based smart metering infrastructure for distribution grid services and automation. Sustain. Energy Grids Netw. 2018, 15, 14–25. [Google Scholar] [CrossRef]
- Hossein Motlagh, N.; Mohammad-Rezaei, M.; Hunt, J.; Zakeri, B. Internet of Things (IoT) and the energy sector. Energies 2020, 13, 494. [Google Scholar] [CrossRef]
- Sadeeq, M.A.; Zeebaree, S. Energy management for internet of things via distributed systems. Energies 2021, 2, 80–92. [Google Scholar] [CrossRef]
- Chooruang, K.; Meekul, K. Design of an IoT energy monitoring system. In Proceedings of the International Conference on ICT and Knowledge Engineering (ICT&KE), Bangkok, Thailand, 21–23 November 2018; pp. 1–4. [Google Scholar]
- Sonasang, S. Applications of energy monitoring using the IoT. Creat. Sci. 2022, 14, 245041. [Google Scholar]
- Guevara, N.E.; Bolaños, Y.H.; Diago, J.P.; Segura, J.M. Development of a low-cost IoT system based on LoRaWAN for monitoring variables related to electrical energy consumption in low voltage networks. HardwareX 2022, 12, e00330. [Google Scholar] [CrossRef] [PubMed]
- Ramelan, A.; Adriyanto, F.; Hermanu, B.A.C.; Ibrahim, M.H.; Saputro, J.S.; Setiawan, O. IoT based building energy monitoring and controlling system using LoRa modulation and MQTT protocol. IOP Conf. Ser. Mater. Sci. Eng. 2021, 1096, 012069. [Google Scholar] [CrossRef]
- Rodriguez, J.C.; Grijalva, F.; García, M.; Chérrez Barragán, D.E.; Acuña Acurio, B.A.; Carvajal, H. Wireless communication technologies for smart grid distribution networks. Eng. Proc. 2023, 47, 7. [Google Scholar] [CrossRef]
- Aloul, F.; Al-Ali, A.R.; Al-Dalky, R.; Al-Mardini, M.; El-Hajj, W. Smart grid security: Threats, vulnerabilities and solutions. Int. J. Smart Grid Clean Energy 2012, 1, 1–6. [Google Scholar] [CrossRef]
- Abdo-Allah, A.; Iqbal, M.T.; Pope, K. Energy consumption analysis of a large building at memorial university. J. Energy 2019, 2019, 5243737. [Google Scholar] [CrossRef]
- Shafique, K.; Khawaja, B.A.; Sabir, F.; Qazi, S.; Mustaqim, M. Internet of things (IoT) for next-generation smart systems: A review of current challenges, future trends and prospects for emerging 5G-IoT scenarios. IEEE Access 2020, 8, 23022–23040. [Google Scholar] [CrossRef]
- Dar-Mousa, R.N.; Makhamreh, Z. Analysis of the pattern of energy consumptions and its impact on urban environmental sustainability in Jordan: Amman City as a case study. Energy Sustain. Soc. 2019, 9, 15. [Google Scholar] [CrossRef]
- Rhesri, A.; Bennani, R.; Ben Maissa, Y.; Hajjaji, I.; Tamtaoui, A.; Dahmouni, H. Development of a low-cost Internet of Things architecture for energy and environment monitoring in a University Campus. In Proceedings of the International Conference on Future Internet of Things and Cloud (FiCloud), Marrakesh, Morocco, 14–16 August 2023; pp. 181–185. [Google Scholar]
- Rhesri, A.; Bennani, R.; Hajjaji, I.; Ben Maissa, Y.; Tamtaoui, A.; Dahmouni, H. Hardwarely Handling Transmission Data Loss in a Low-Cost WiFi IoT Architecture for Energy and Environment Monitoring in a University Campus. In Proceedings of the International Conference on Innovative Research in Applied Science, Engineering and Technology (IRASET), Fez, Morocco, 16–17 May 2024; pp. 1–5. [Google Scholar]
- Hajjaji, I.; El Alami, H.; El-Fenni, M.R.; Dahmouni, H. Evaluation of artificial intelligence algorithms for predicting power consumption in university campus microgrid. In Proceedings of the International Wireless Communications and Mobile Computing (IWCMC), Harbin, China, 28 June–2 July 2021; pp. 2121–2126. [Google Scholar]
- Easyeda PCB Design Software. Available online: https://easyeda.com (accessed on 24 February 2025).
- Eclipse Mosquitto MQTT Broker. Available online: https://mosquitto.org (accessed on 24 February 2025).
- ChirpStack, Open-Source LoRaWAN Network Server. Available online: https://www.chirpstack.io (accessed on 2 March 2025).
- DB-Engines: Knowledge Base of Relational and NoSQL Database Management Systems. Available online: https://db-engines.com (accessed on 24 February 2025).
- InfluxDB Times Series Data Platform. Available online: https://docs.influxdata.com (accessed on 24 February 2025).
- Grafana Open Observably Platform. Available online: https://grafana.com (accessed on 24 February 2025).
- MySQL Relational Database Management System. Available online: https://dev.mysql.com (accessed on 24 February 2025).
- Docker: Accelerated, Containerized Application Development. Available online: https://docs.docker.com (accessed on 24 February 2025).
- Aabadi, F.; Ben Maissa, Y.; Dahmouni, H.; Tamtaoui, A.; El Aroussi, M. Forecasting electrical power consumption based on a hybrid PSO-XGBoost Model. In Proceedings of the International Conference on Advances in Data-Driven Analytics And Intelligent Systems (ADACIS), Marrakesh, Morocco, 23–25 November 2023; pp. 1–6. [Google Scholar]
- Aabadi, F.; Ben Maissa, Y.; Dahmouni, H.; Tamtaoui, A.; El Aroussi, M. Machine Learning algotithms for Electric Load Forecasting in a Moroccan Academic Campus. In Proceedings of the International Conference on Advanced Technologies for Humanity (ICATH), Rabat, Morocco, 24 December 2023–25 July 2024. [Google Scholar]


| Component | Standard Price ($) |
|---|---|
| Wemos D1 mini pro with Wi-Fi antenna | 3 |
| Acrel ADL400N-CT 3-phase | 55 |
| BME680 | 5 |
| DS1307 RTC module with battery | 1 |
| micro SD card adapter with SD card | 5 |
| AC/DC converter (HiLink) | 2 |
| LEDs | 2 * (0.02) |
| Resistances | 3 * (0.07) |
| Capacitor | 0.3 |
| Push Button | 0.1 |
| Screw wire terminals | 2 * (0.14) |
| PCB | 0.72 |
| 3D shell | N/A |
| Total | 72.65 |
| Component | Standard Price ($) |
|---|---|
| Wemos D1 mini pro with Wi-Fi antenna | 3 |
| PZEM-004T (V3.0) | 3 * (10) |
| BME680 | 5 |
| DS1307 RTC module with battery | 1 |
| micro SD card adapter with SD card | 5 |
| AC/DC converter (HiLink) | 2 |
| LEDs | 2 * (0.02) |
| Resistances | 3 * (0.07) |
| Capacitor | 0.3 |
| Push Button | 0.1 |
| Screw wire terminals | 5 * (0.14) |
| PCB1 (node board) | 0.72 |
| PCB2 (Triple PZEM board) | 1.46 |
| 3D shell | N/A |
| Total | 49.53 |
| Component | Standard Price ($) |
|---|---|
| Heltec V3 | 19 |
| Acrel ADL400N-CT 3-phase | 55 |
| BME680 | 5 |
| AC/DC converter (HiLink) | 2 |
| Resistance | 0.07 |
| Capacitor | 0.3 |
| Push Button | 0.1 |
| Screw wire terminals | 2 * (0.14) |
| PCB | 0.36 |
| 3D shell | N/A |
| Total | 82.11 |
| Rank (February 2025) | Database Management System |
|---|---|
| 1 | InfluxDB |
| 2 | Kdb |
| 3 | Prometheus |
| 4 | Graphite |
| 5 | TimescaleDB |
| Average power | 0.51 |
| Median power | 0.005 |
| Standard deviation of power | 2.15 |
| Minimum power | 0.004 |
| Maximum power | 15.79 |
Disclaimer/Publisher’s Note: The statements, opinions and data contained in all publications are solely those of the individual author(s) and contributor(s) and not of MDPI and/or the editor(s). MDPI and/or the editor(s) disclaim responsibility for any injury to people or property resulting from any ideas, methods, instructions or products referred to in the content. |
© 2025 by the authors. Licensee MDPI, Basel, Switzerland. This article is an open access article distributed under the terms and conditions of the Creative Commons Attribution (CC BY) license (https://creativecommons.org/licenses/by/4.0/).
Share and Cite
Rhesri, A.; Aabadi, F.; Bennani, R.; Ben Maissa, Y.; Tamtaoui, A.; Dahmouni, H. Development of a Low-Cost Internet of Things Platform for Three-Phase Energy Monitoring in a University Campus. IoT 2025, 6, 27. https://doi.org/10.3390/iot6020027
Rhesri A, Aabadi F, Bennani R, Ben Maissa Y, Tamtaoui A, Dahmouni H. Development of a Low-Cost Internet of Things Platform for Three-Phase Energy Monitoring in a University Campus. IoT. 2025; 6(2):27. https://doi.org/10.3390/iot6020027
Chicago/Turabian StyleRhesri, Abdessamad, Fatima Aabadi, Rachid Bennani, Yann Ben Maissa, Ahmed Tamtaoui, and Hamza Dahmouni. 2025. "Development of a Low-Cost Internet of Things Platform for Three-Phase Energy Monitoring in a University Campus" IoT 6, no. 2: 27. https://doi.org/10.3390/iot6020027
APA StyleRhesri, A., Aabadi, F., Bennani, R., Ben Maissa, Y., Tamtaoui, A., & Dahmouni, H. (2025). Development of a Low-Cost Internet of Things Platform for Three-Phase Energy Monitoring in a University Campus. IoT, 6(2), 27. https://doi.org/10.3390/iot6020027