All the stages followed for the development of Shower–IoT system, with its main device, its communication with the infrastructure services and the Android application being presented in the following subsections.
3.1. Shower–IoT Device
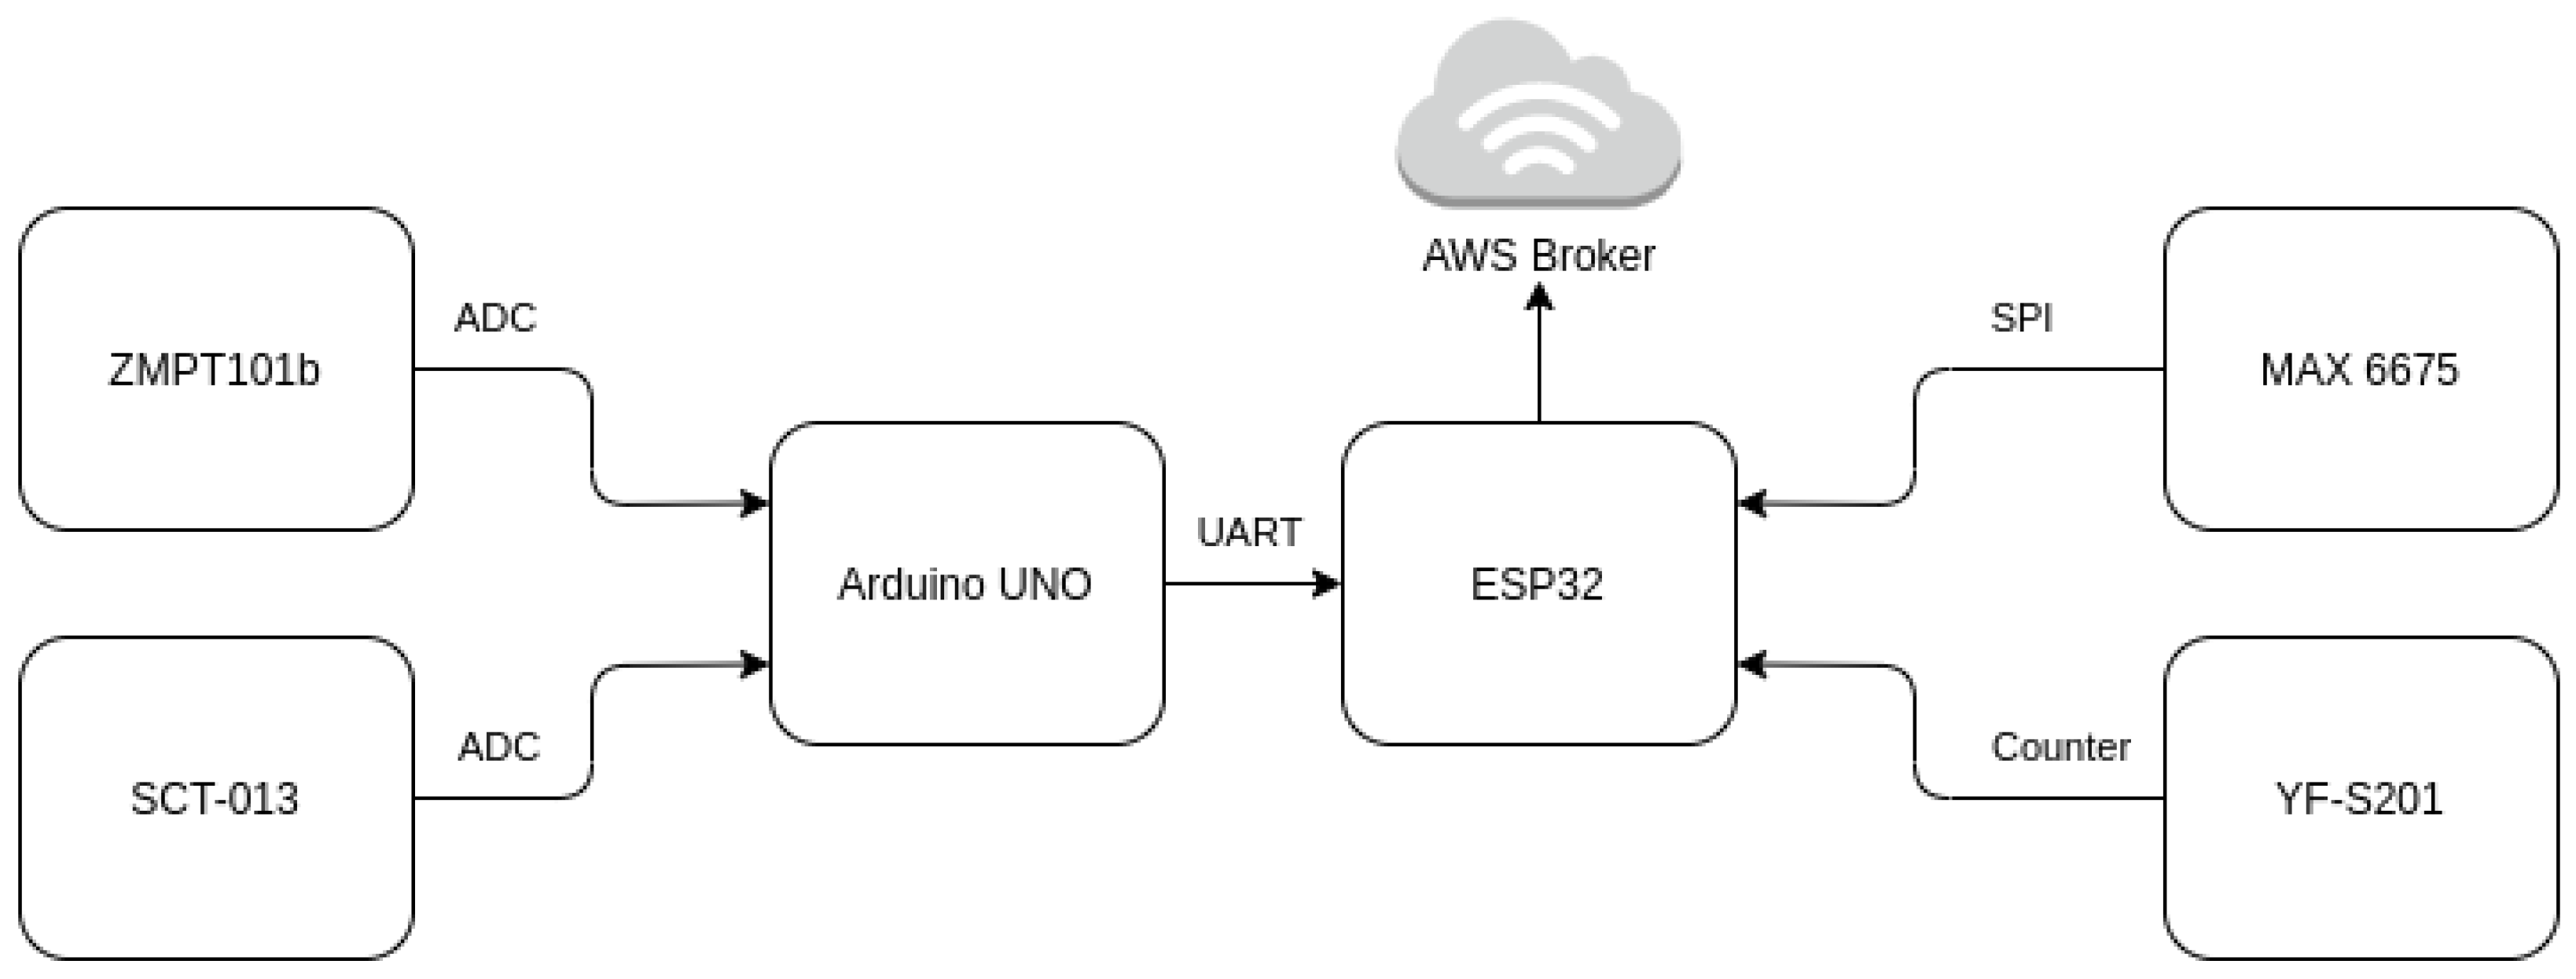
The Shower–IoT device contains an ESP32 Dev V1 board and an Arduino UNO. The ESP32 was chosen because it features several useful interfaces for an IoT device, such as Wi-Fi, Bluetooth, Analog-to-Digital Converter (ADC), Digital-to-Analog Converter (DAC), Serial Peripheral Interface (SPI) and digital pins. This work used Wi-Fi, Bluetooth, and SPI peripherals, but it was not possible to use the ESP’s ADC due to limitations on the reference voltage measurements. Thus, to avoid the need for calibration of the module to adjust the input signal for every device, an Arduino Uno was used for the analog measurements of voltage and current of the Shower-IoT device.
The ESP32’s ADC contains an intrinsic characteristic to the manufacture of an integrated circuit, due to the ADC reference voltage having values between 1000 mV to 1200 mV, and this project has a value of 1100 mV. Thus, to use the ADC present in ESP32, it was necessary to calibrate the module and adapt the input signal to the operating range. However, even after performing the calibration, the results obtained with the ESP32 were not satisfactory. Thus, to avoid the limitations of the ADC present in ESP32, we used an Arduino Uno for the analog measurements of voltage and current sensors.
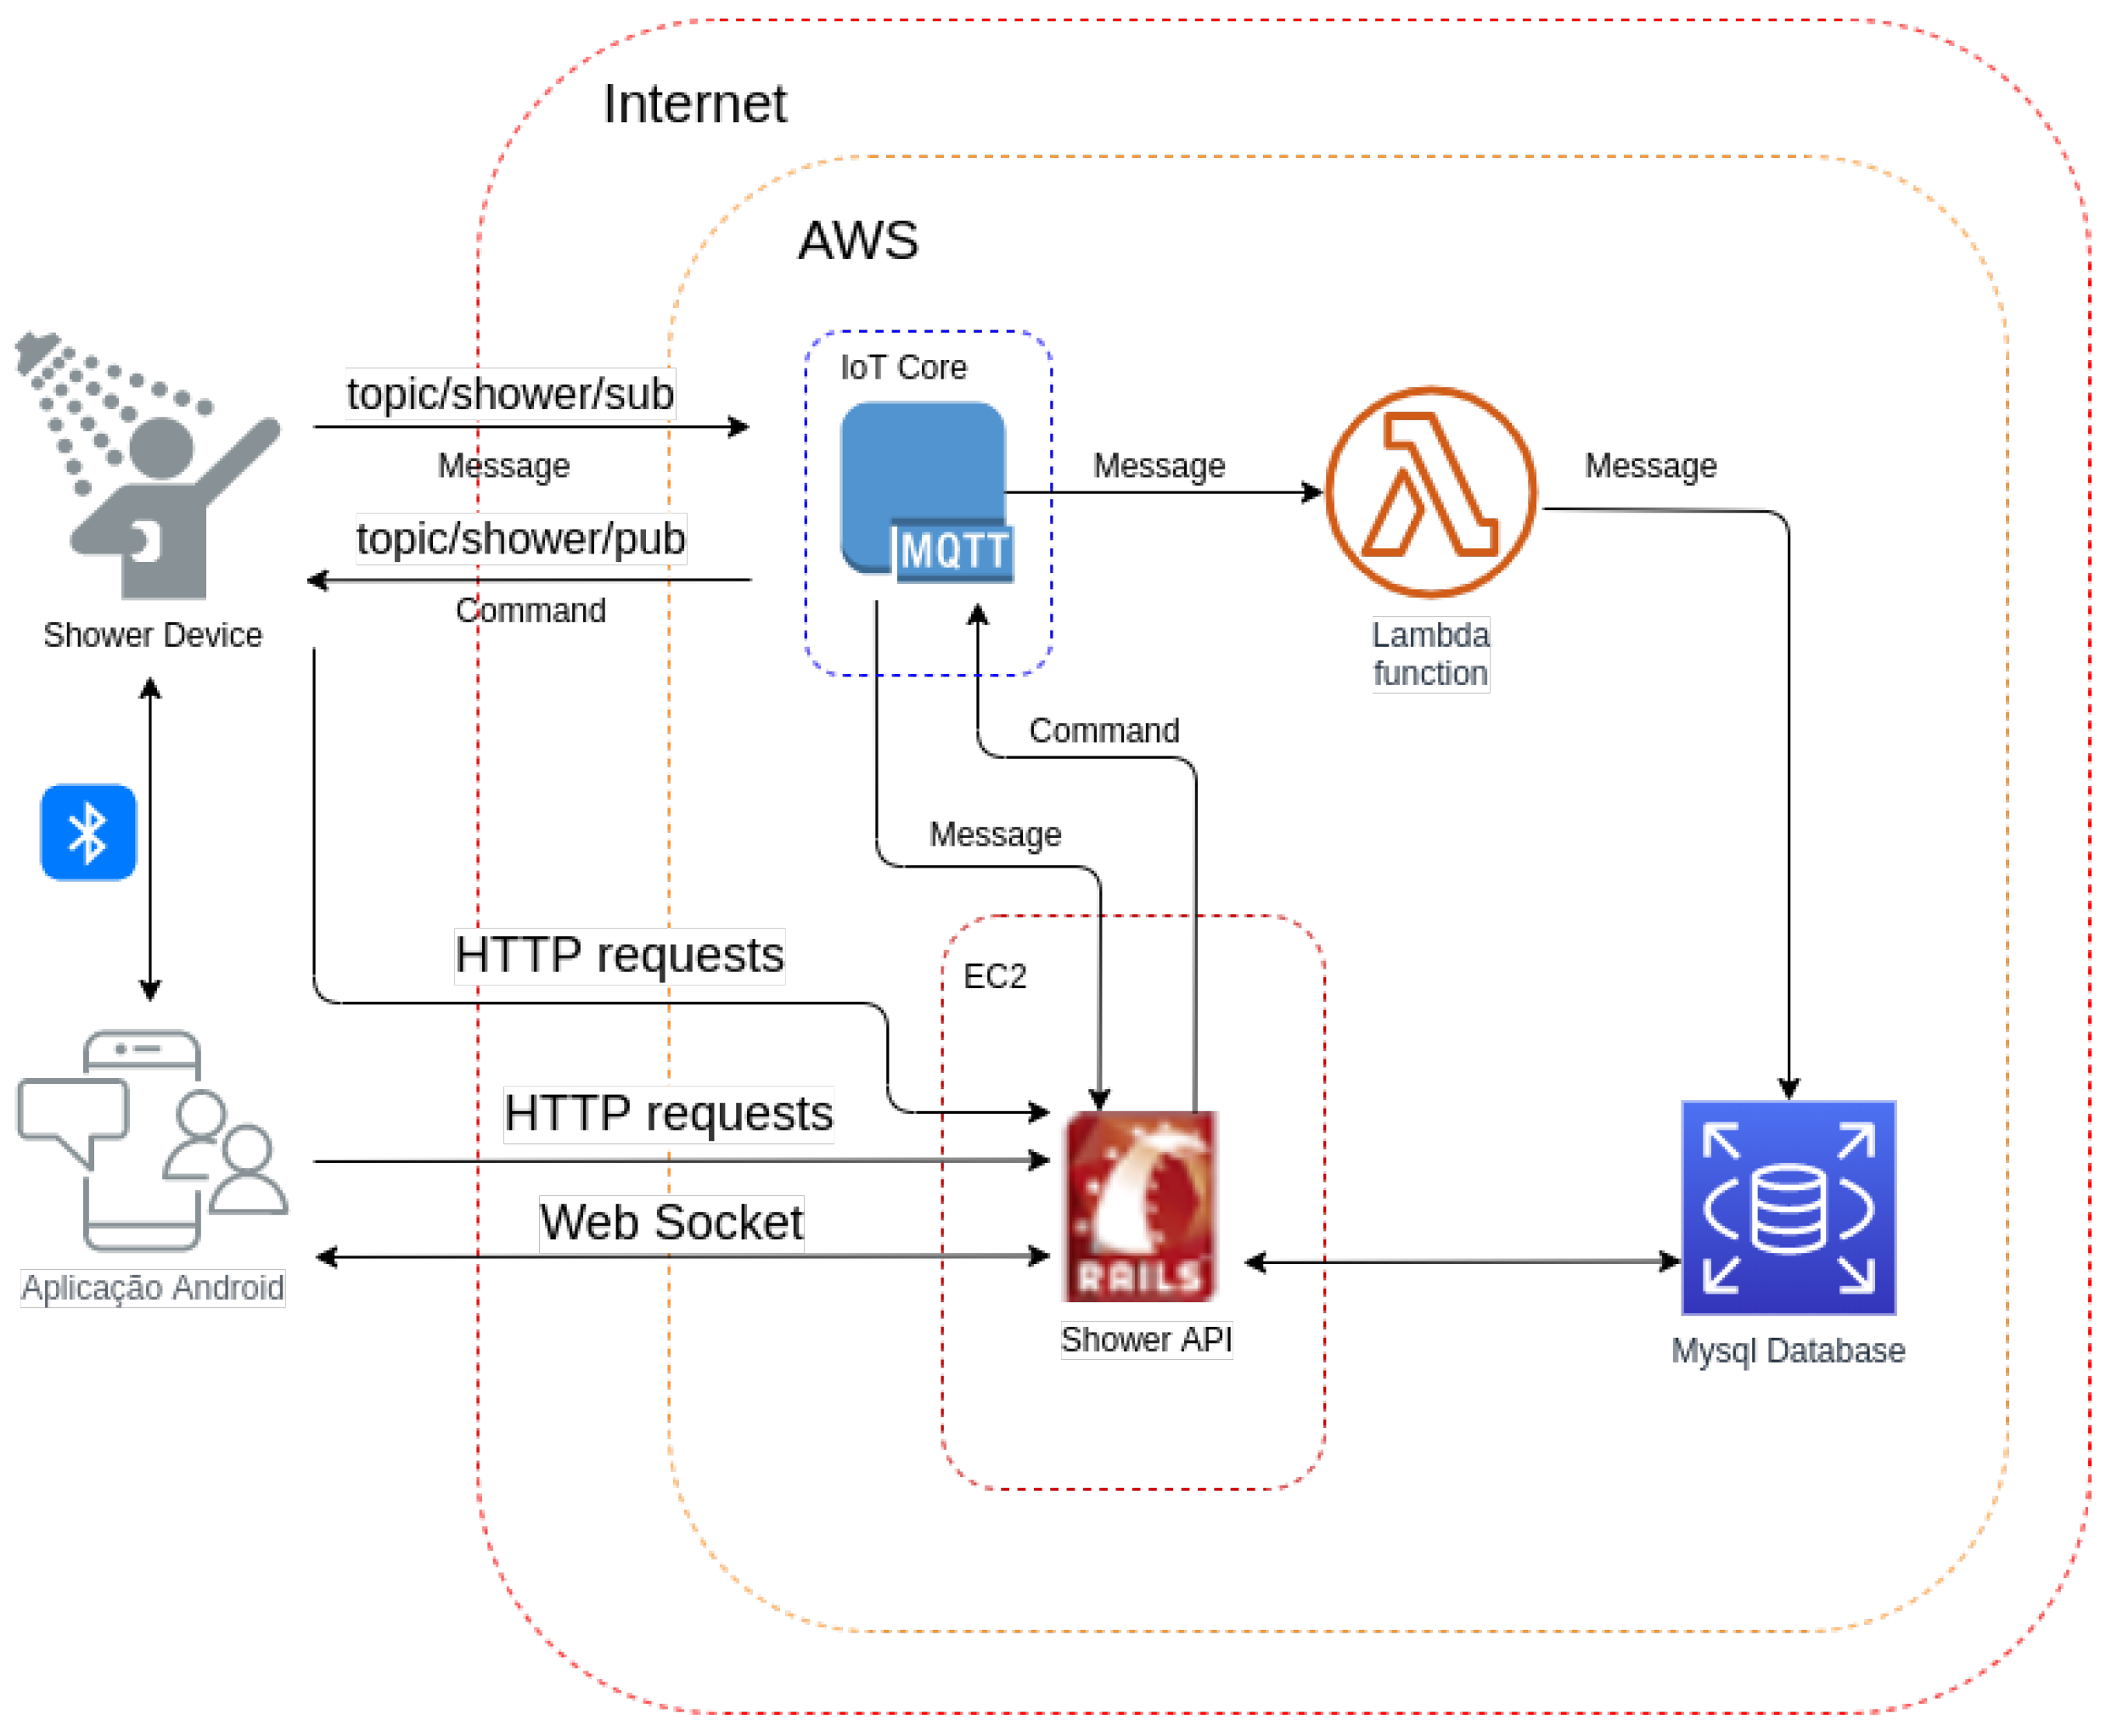
ESP32 is the component responsible for grouping all monitored variables and sending them to the AWS MQTT broker, which stores these values and makes them available to the Android application. This work used a real-time operating system, FreeRTOS [
11], to manage all activities executed in ESP32, and it developed four tasks: MAX6675 reading, YF-s201 sensor reading, Universal Receiver/Transmitter (UART) reading, and sending the MQTT message.
Figure 2 shows that the ESP32 is the central component of the device and is responsible for acquiring the temperature data from the MAX6675 sensor through the SPI protocol, counting the pulses generated in the water flow sensor (YF-s201), and receiving the voltage and current values through UART from the Arduino UNO. Finally, after acquiring all monitored variables, ESP32 sends a message to the MQTT broker on AWS.
To obtain the values of the mains voltage and the electric current, we implemented an Arduino UNO program to store the values read from channels ADC0 and ADC1 (
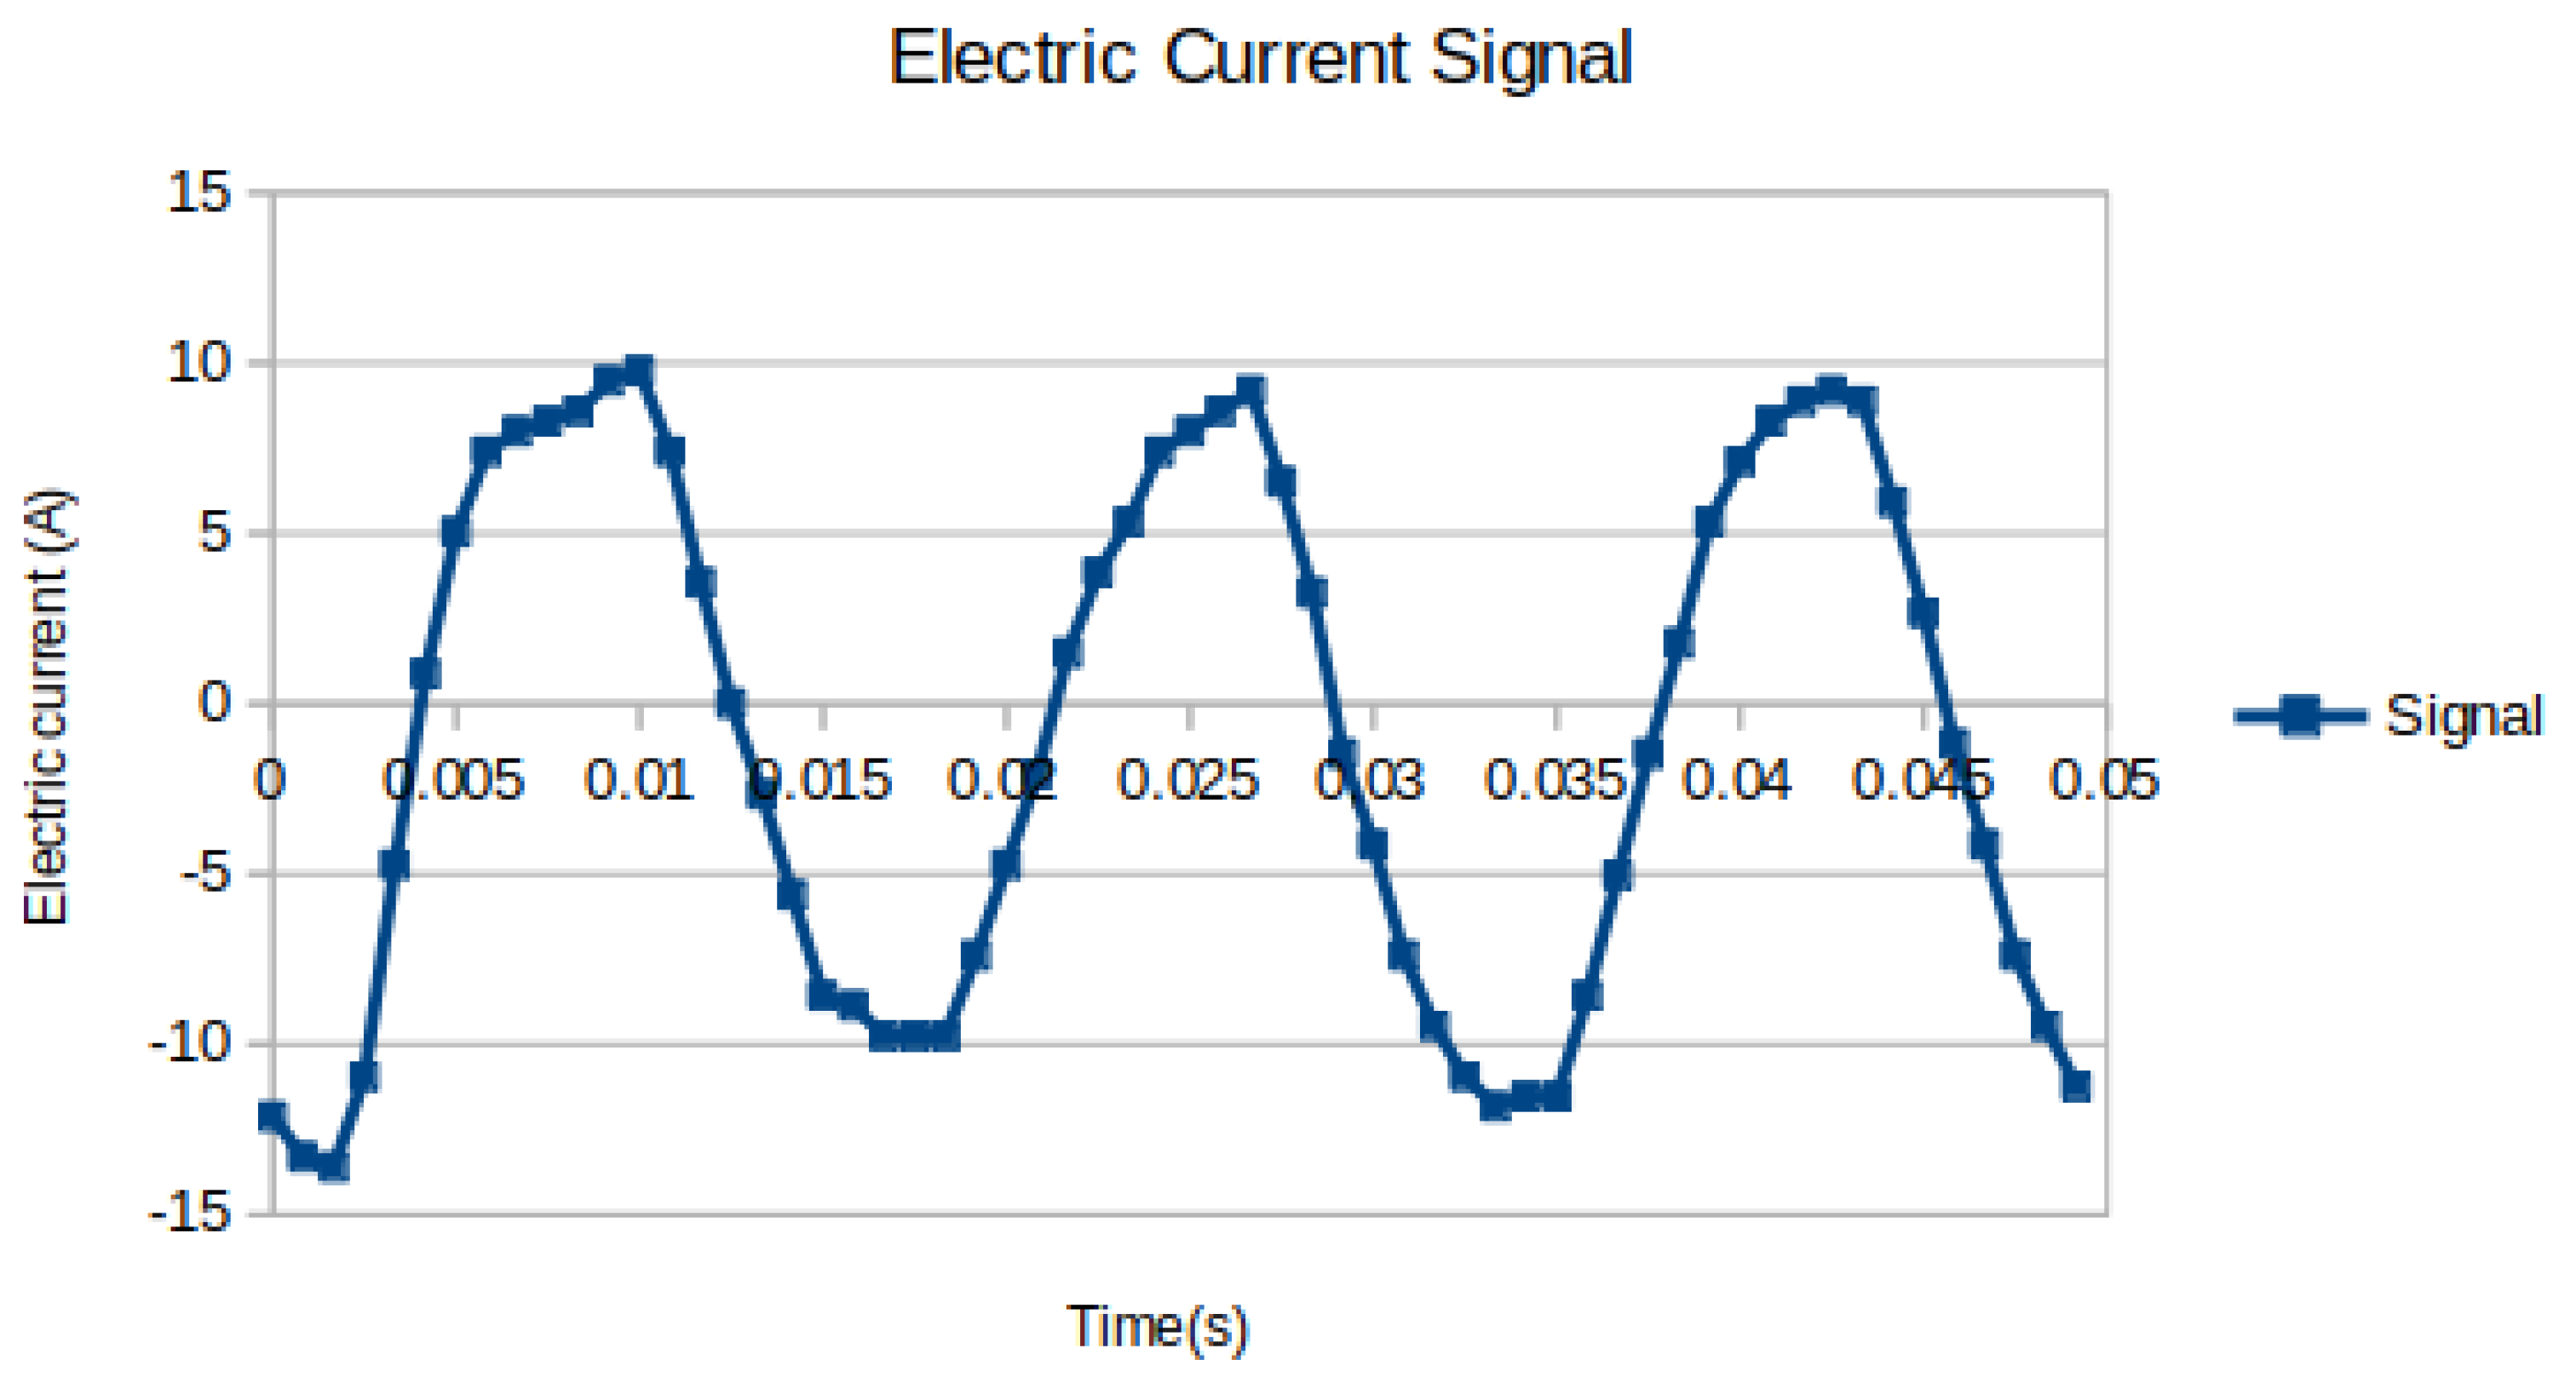
Figure 2) into buffers. When the number of samples reaches the buffer size, the program calculates the root mean square (RMS) values of the samples and performs the conversion to the respective units (volts or amperes). After calculating the RMS values, the program calculates an average to generate a message every second.
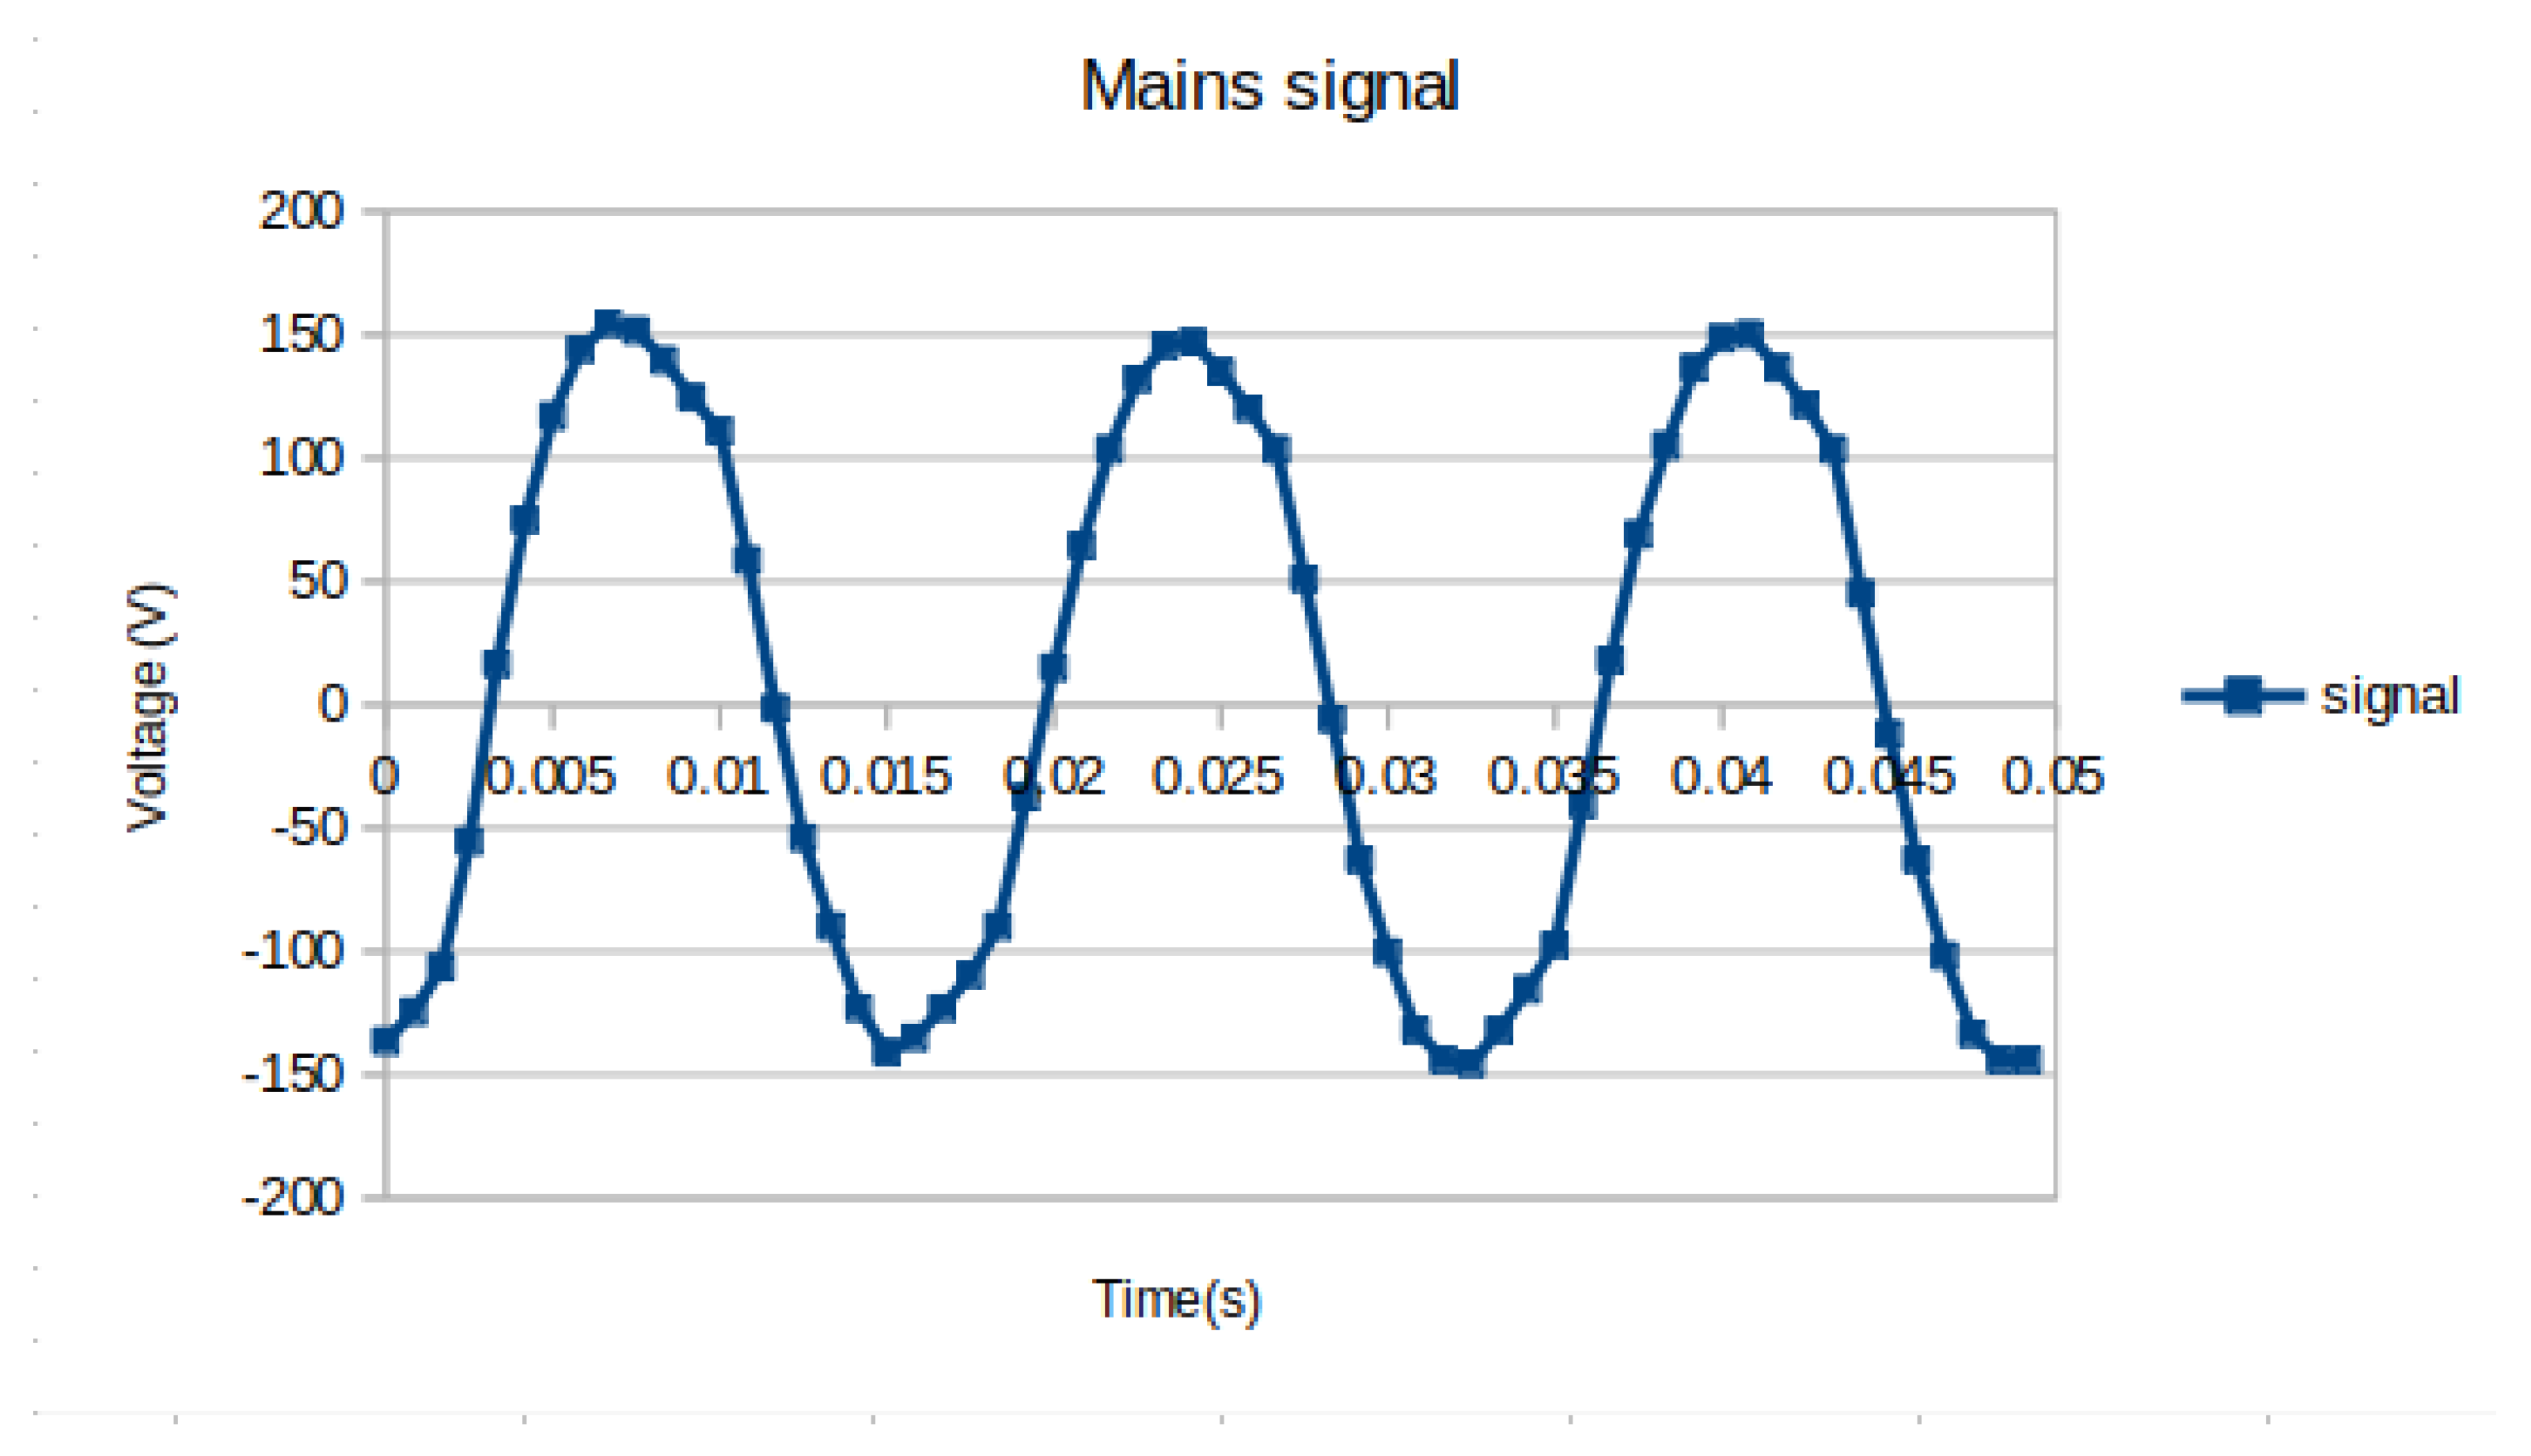
To sample the signals in Arduino, firstly, it is necessary to define the respective sampling frequency, obtained by multiplying the number of samples per sinusoidal cycle by the frequency of the electrical network. Our work defined the number of 20 samples per cycle of the electrical network. As the frequency of the electrical network in Brazil is equal to 60 Hz, the sampling frequency must be equal to 1200 Hz. In this way, it was possible to better visualize the waveform generated in the voltage and current sensors.
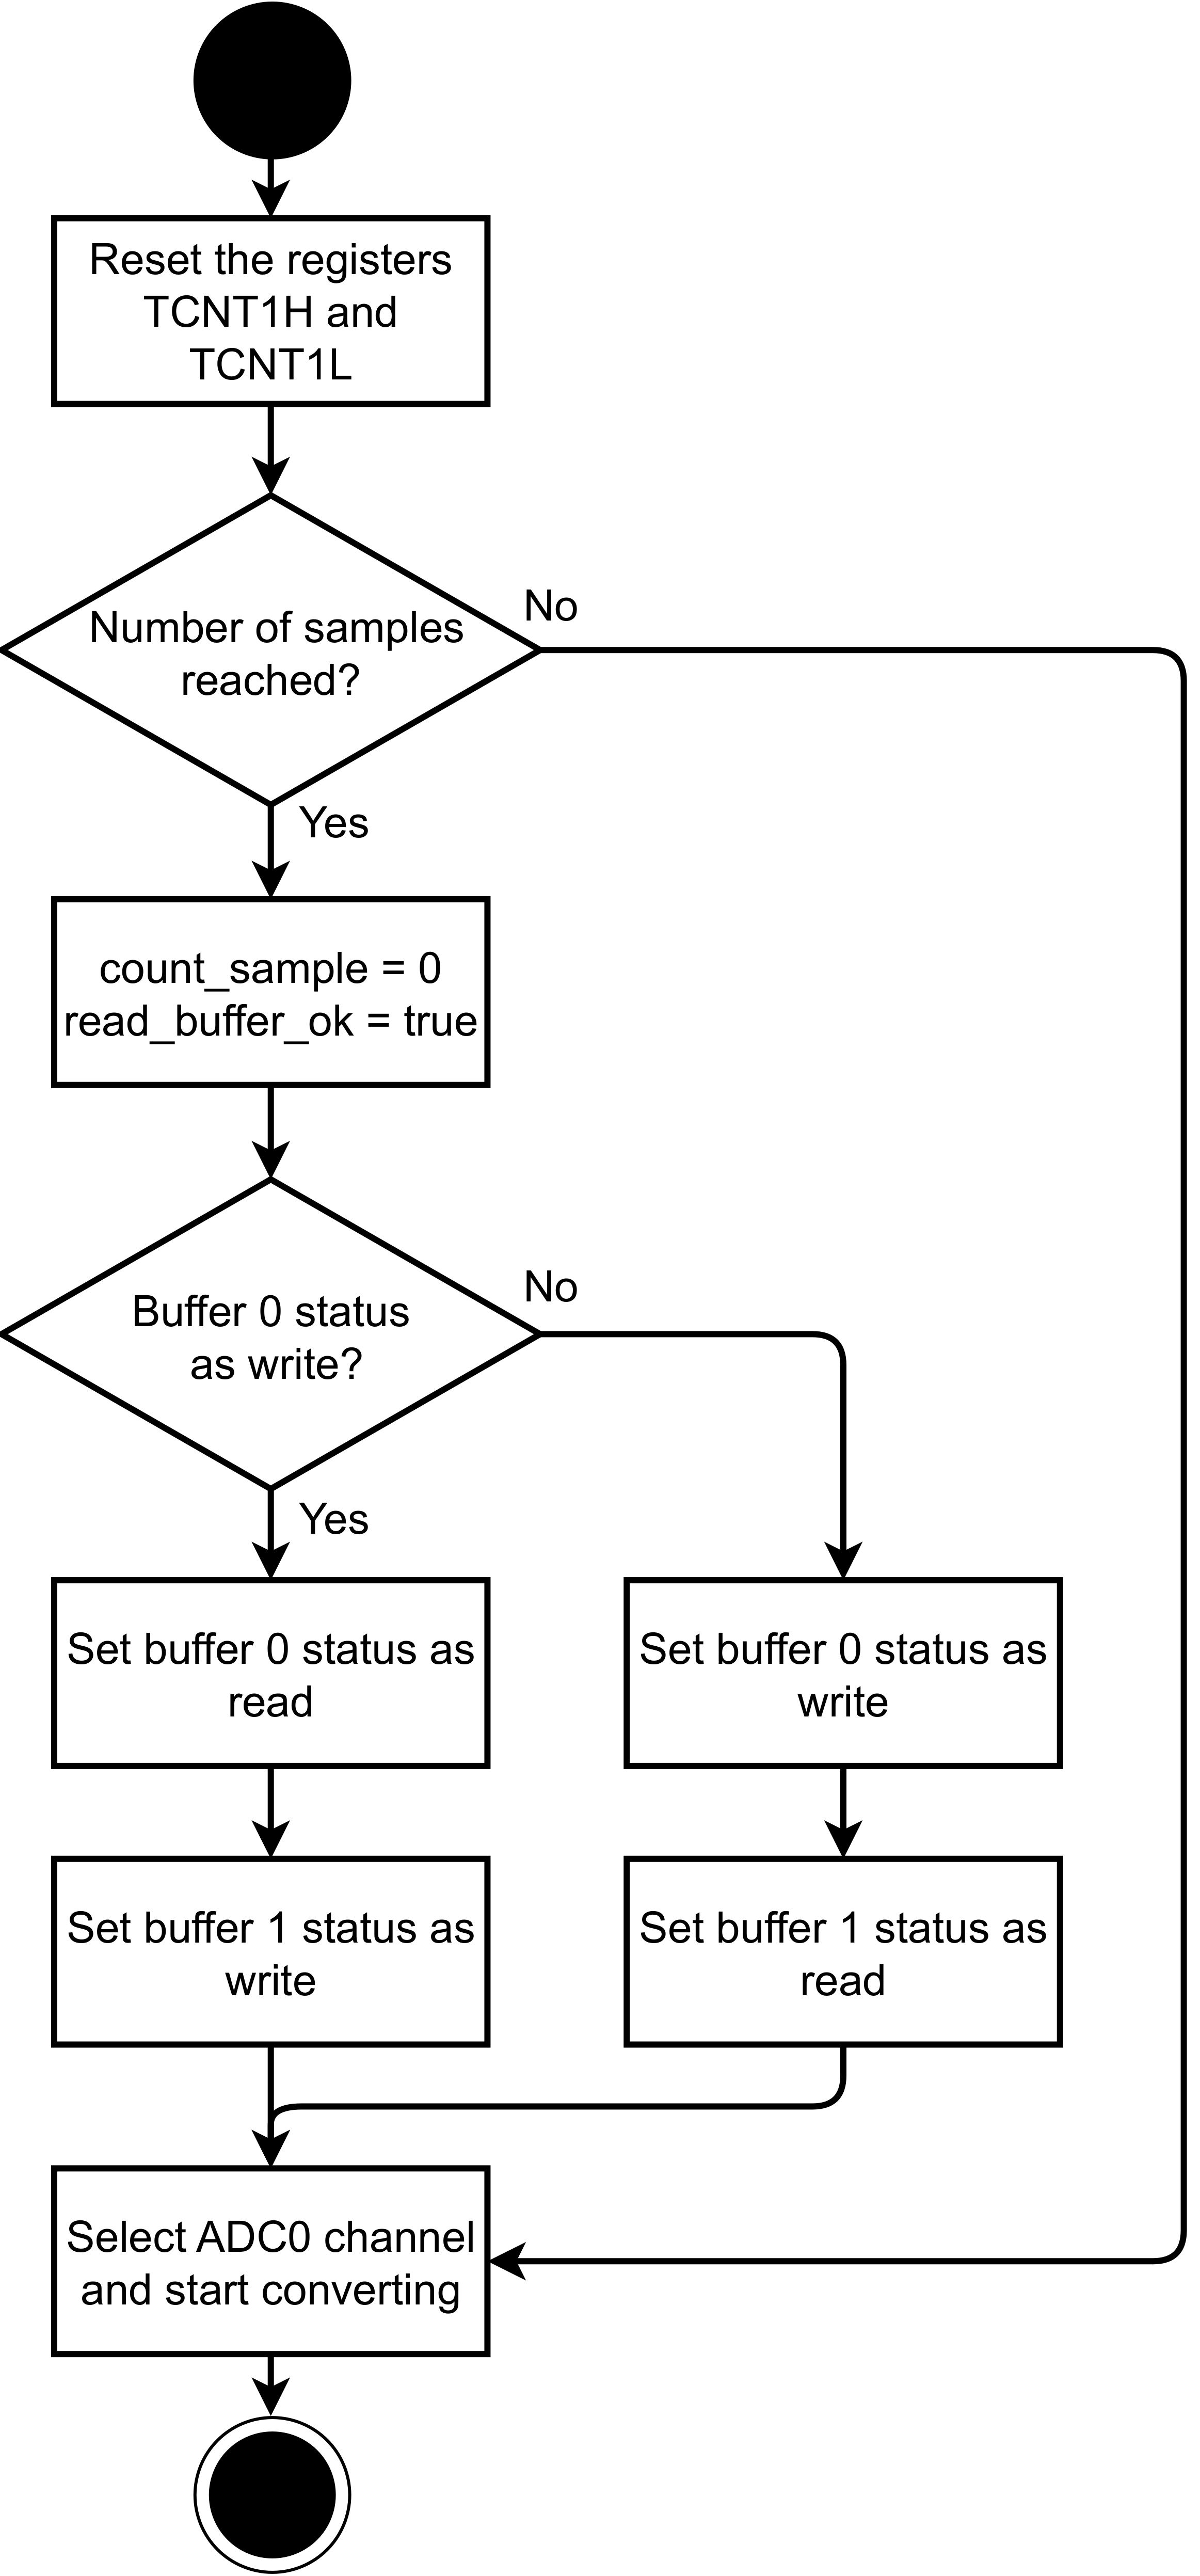
After defining the value of the sampling frequency, we used the Arduino UNO Timer1 to generate the interruptions responsible for starting the ADC conversion process and for controlling the definition of the read and write buffers.
Figure 3 shows the flowchart of Arduino’s Timer1 interrupt.
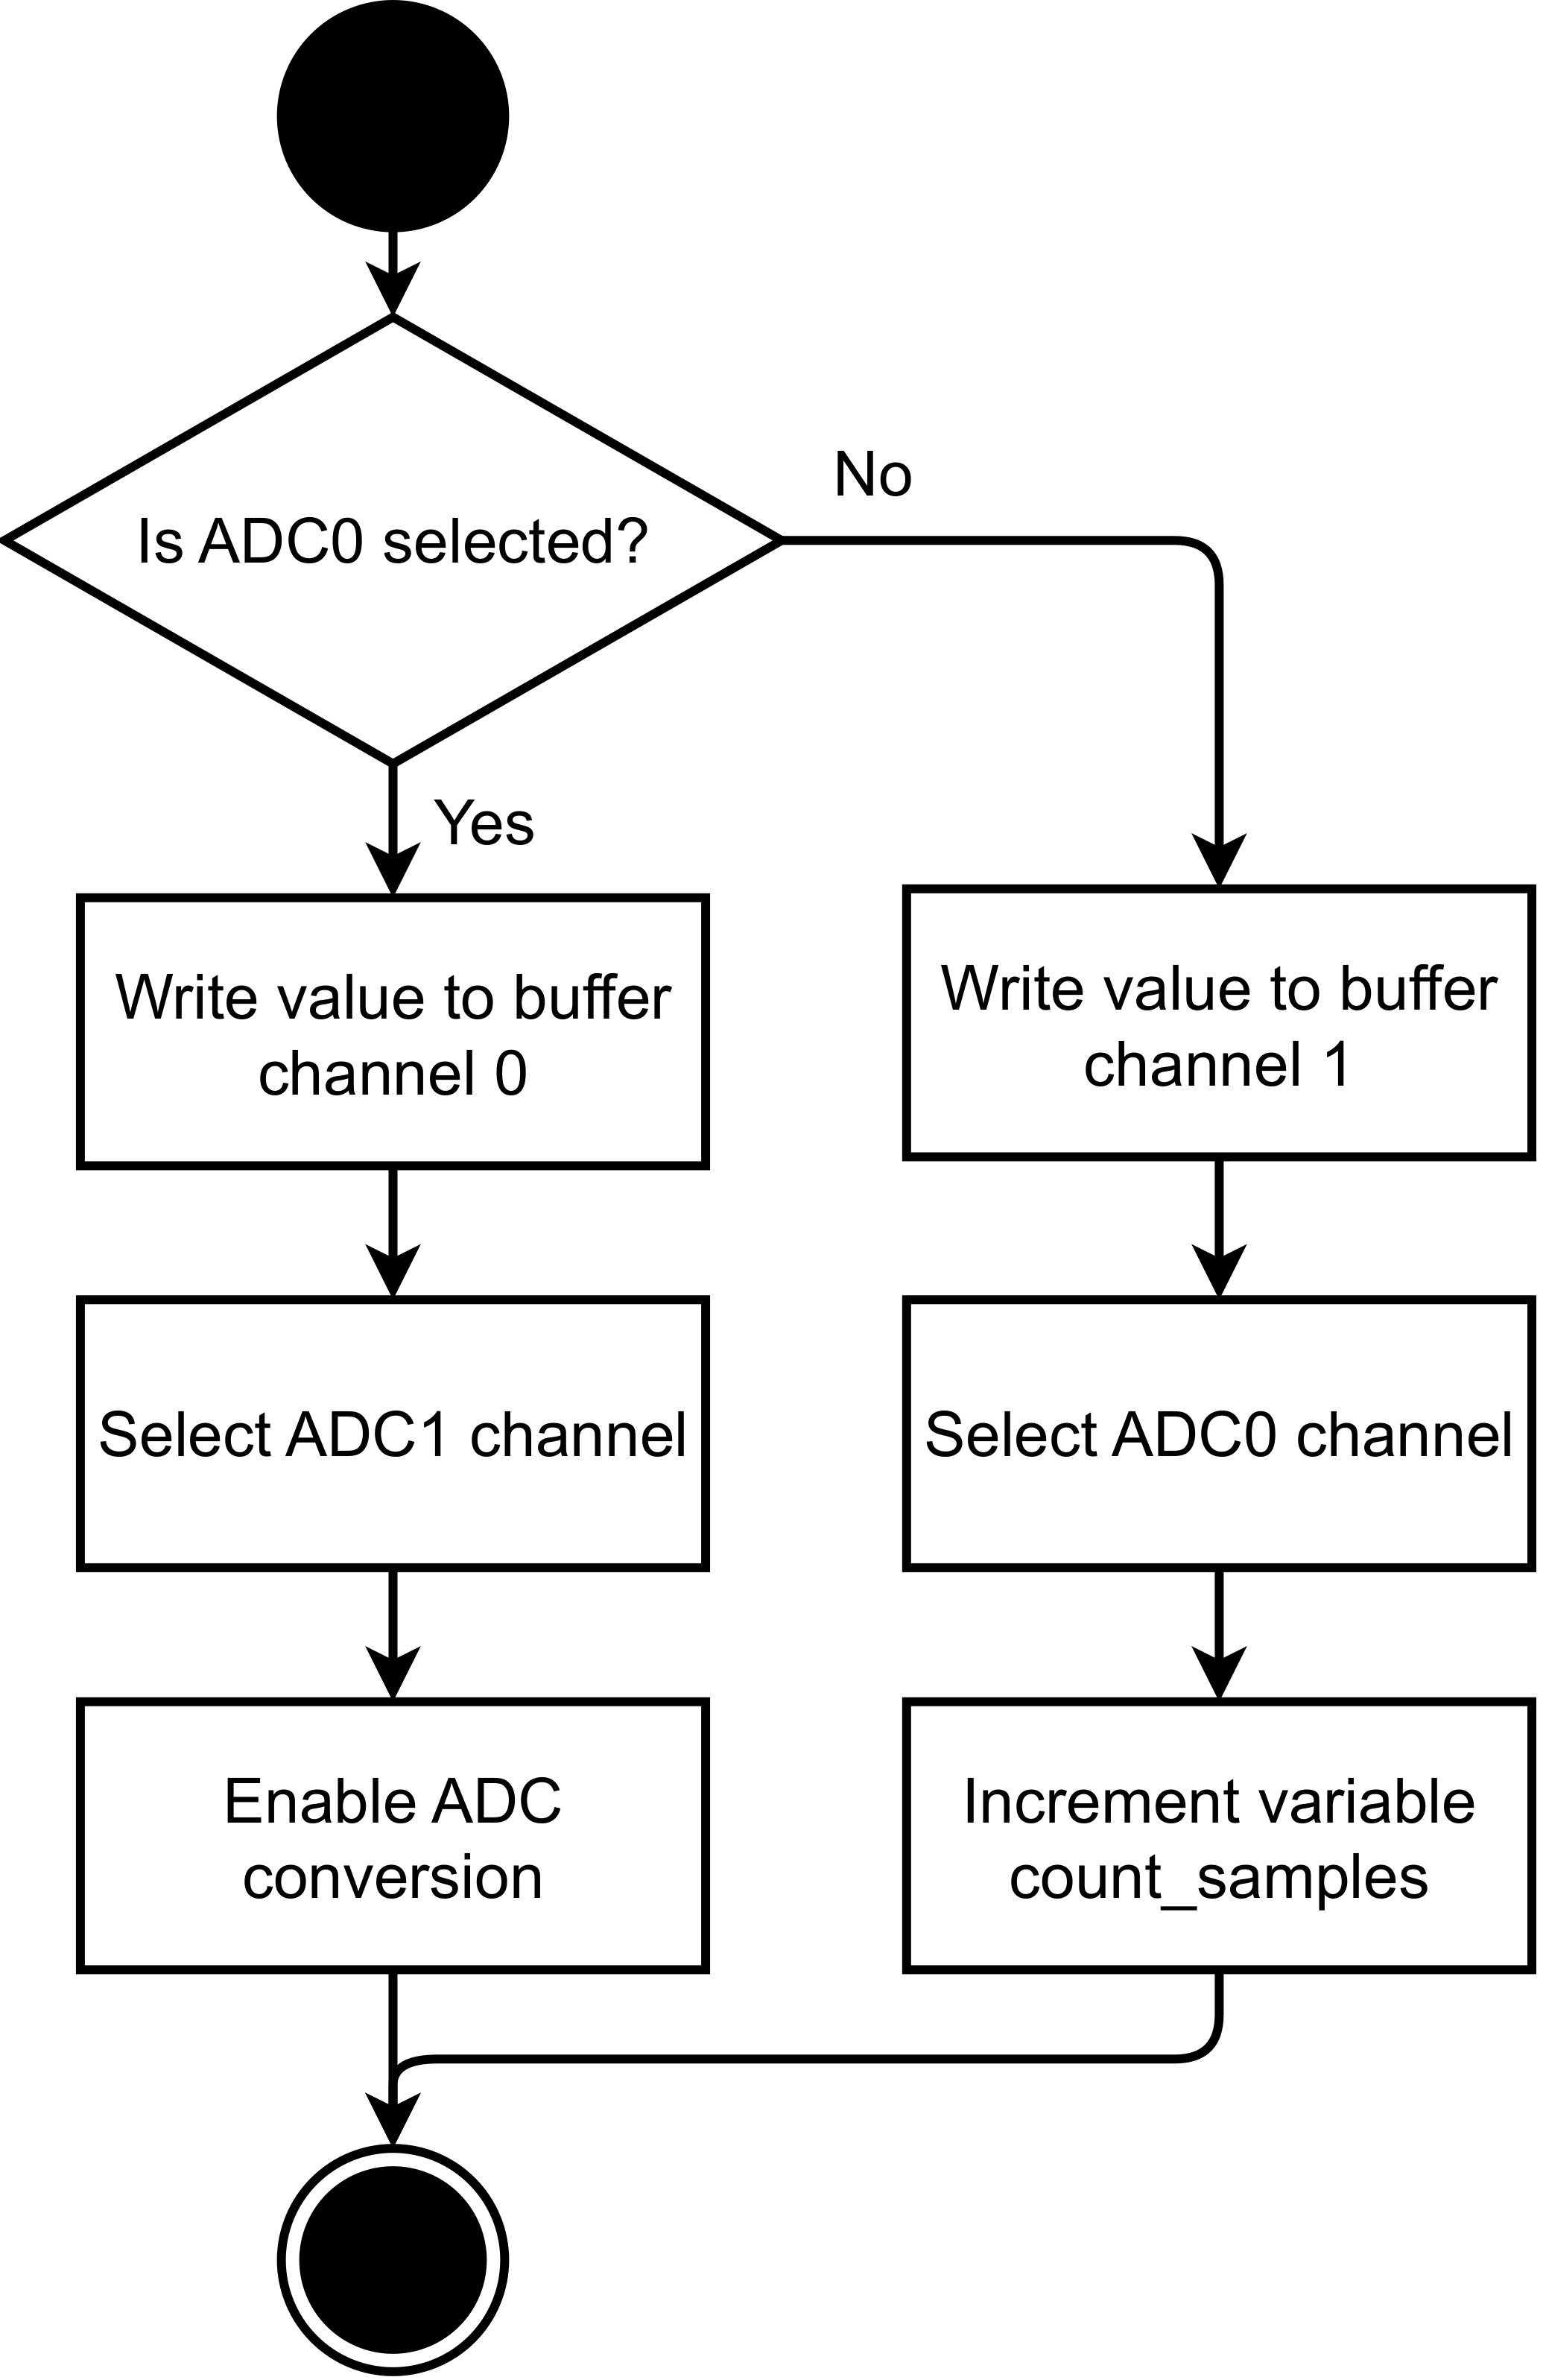
To read the value of the ADC conversion, we used the completion interruption present in this converter. This function executes whenever a conversion ends, and it is responsible for storing the conversion value in the writing buffer and performing the change from the ADC0 channel to the ADC1.
Figure 4 shows the flowchart of the converter interruption process.
Therefore, the process of acquiring the values present in the voltage and current sensors follows these steps:
Timer1 Interruption: Select the ADC0 channel and starts the ADC conversion process.
First, ADC interruption: Stores the conversion value in the write buffer of ADC0, selects ADC1, and starts the ADC conversion process.
Second, ADC Interruption: Stores the conversion value in the ADC1 write buffer, selects ADC0, and increments the sample counter.
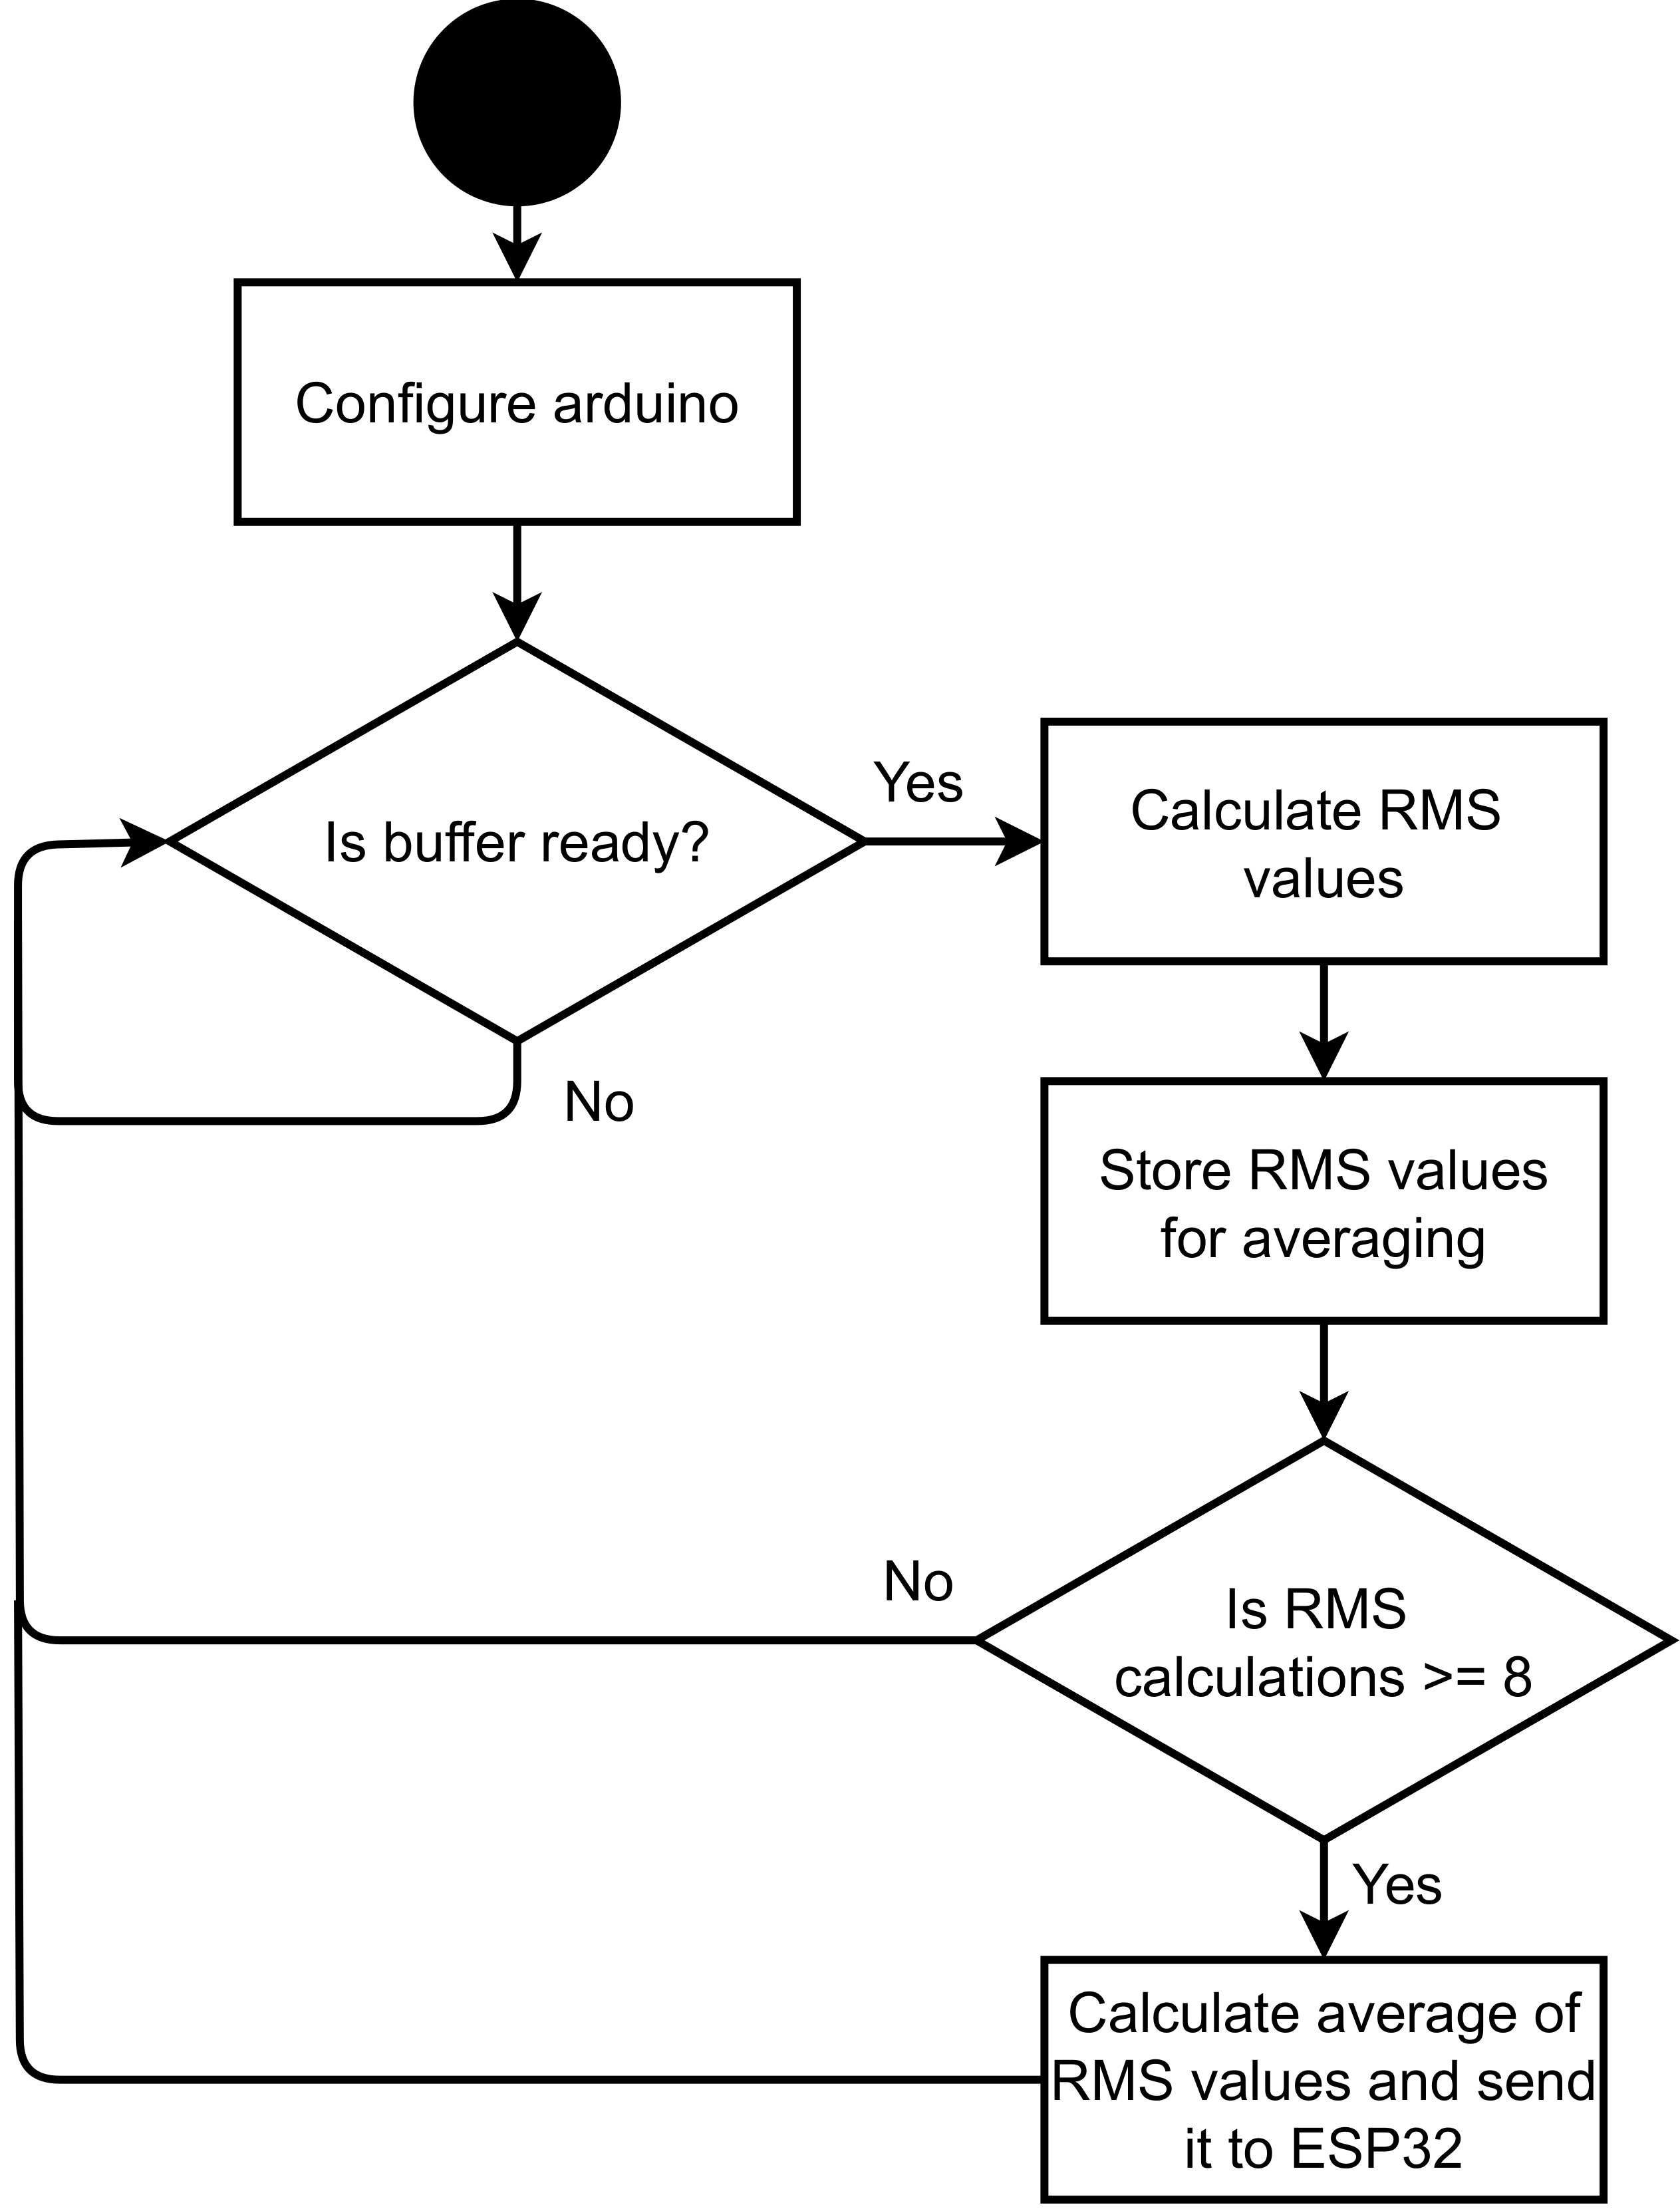
It takes 1200 samples per channel to store one second of data at a sampling frequency of 1200 Hz, which results in 2400 memory positions. However, the ATmega328P, Arduino Uno’s microcontroller, has 2 Kbytes of SRAM memory, making it impossible to program a single buffer for each channel. To overcome this limitation, we programmed four buffers with 150 positions each: two were used for channel 0 and two for channel 1. When a buffer is complete with samples, our program calculates the RMS and stores this value. After 8 iterations, the 1200 samples are complete, and it is possible to average the obtained RMS values, where the average is sent to the ESP32 through the serial port. The entire process of calculating RMS values and averages is performed in the main loop so as not to spoil the acquisition process and the intervals, as they run like interruptions.
The entire process of calculating RMS values and averages is performed in the main loop so as not to spoil the acquisition process and the intervals, as they run like interruptions.
Figure 5 shows the main loop flowchart.
The program also uses the technique of multi-buffers or Ping Pong Buffers to ensure that the samples were in the correct ranges and that the calculations did not interfere with this process. In this technique, there are two buffers per information flow: a read and a write buffer. Next, one code (consumer) can read the values from the read buffer, while another code (producer) writes the new values to the write buffer. The read and write operations used pointers; thus, it was possible to change the write-to-read and read-to-write buffers [
12].
ESP32 is the component responsible for grouping all monitored variables and sending them to the AWS MQTT broker, which stores these values and makes them available to the Android application. This work used a real-time operating system, FreeRTOS [
11], to manage all activities executed in ESP32, and it developed four tasks: MAX6675 reading, YF-s201 sensor reading, UART reading, and sending the MQTT message.
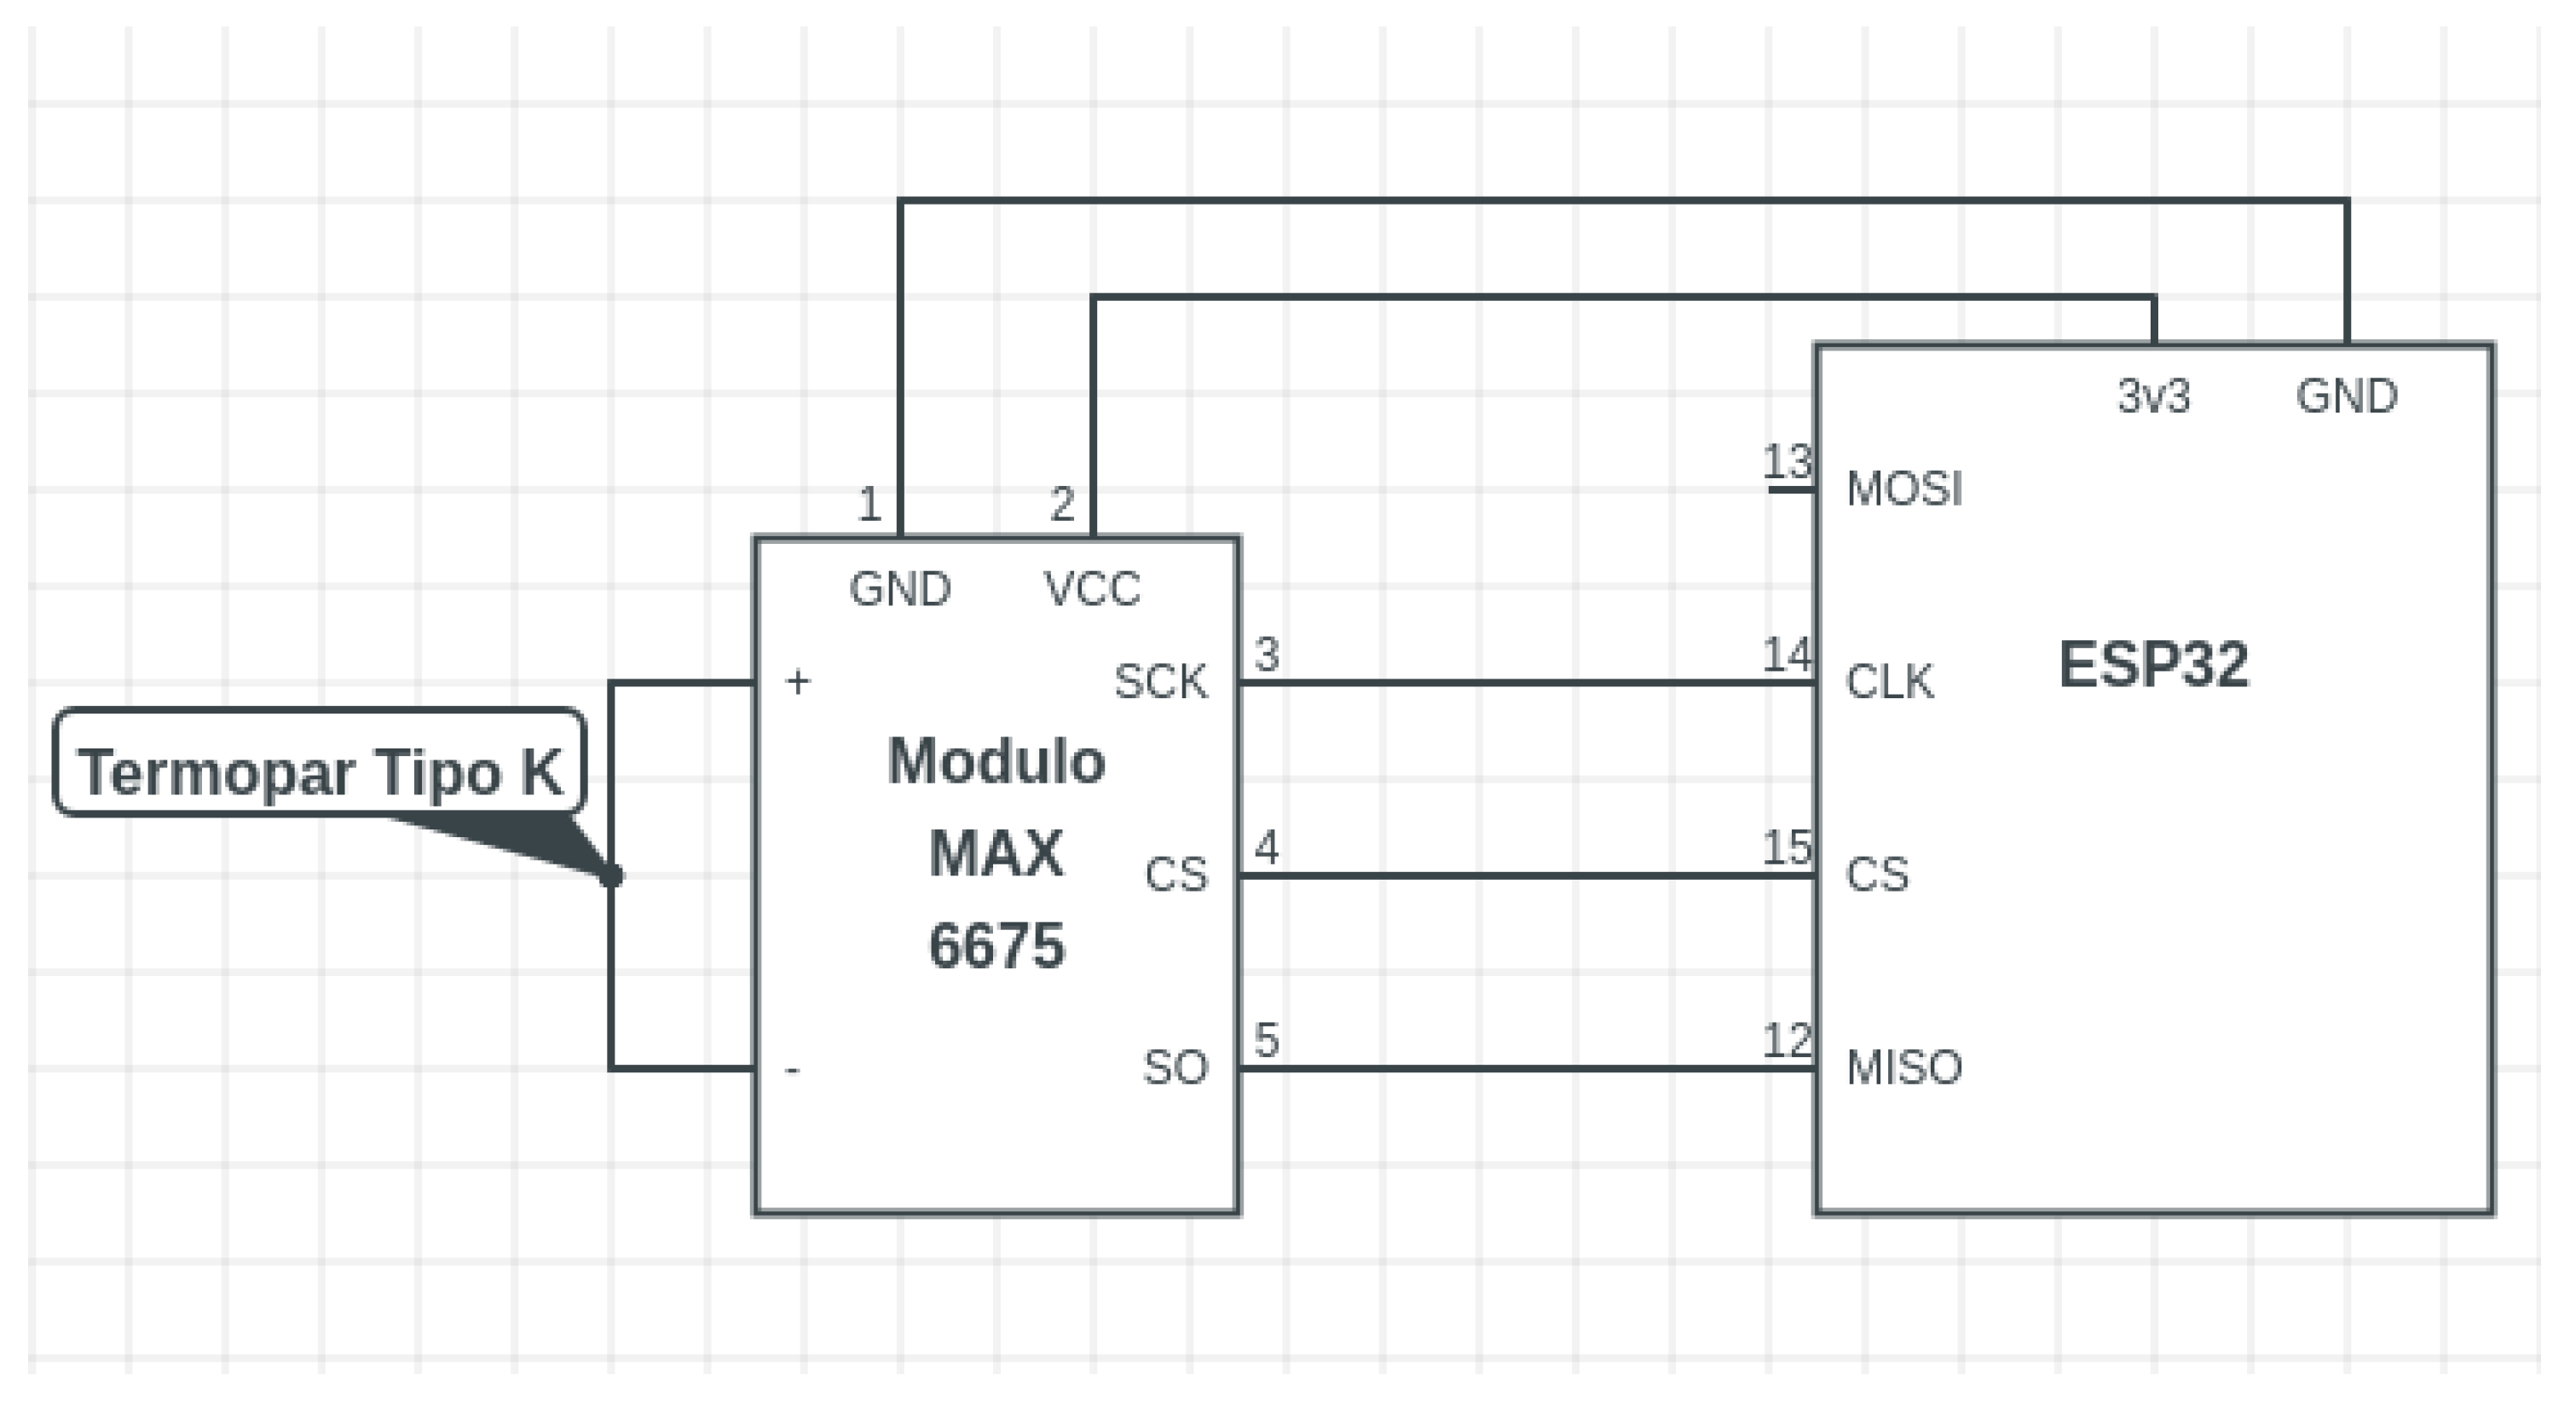
We developed a communication task with the MAX6675 module to obtain the shower temperature values through the ESP32 HSPI module, which implements the SPI protocol with pins 12, 13, 14, and 15, respectively, the MISO, MOSI, CLK, and CS signals.
Figure 6 shows the connection of the MAX 6675 module with the ESP32.
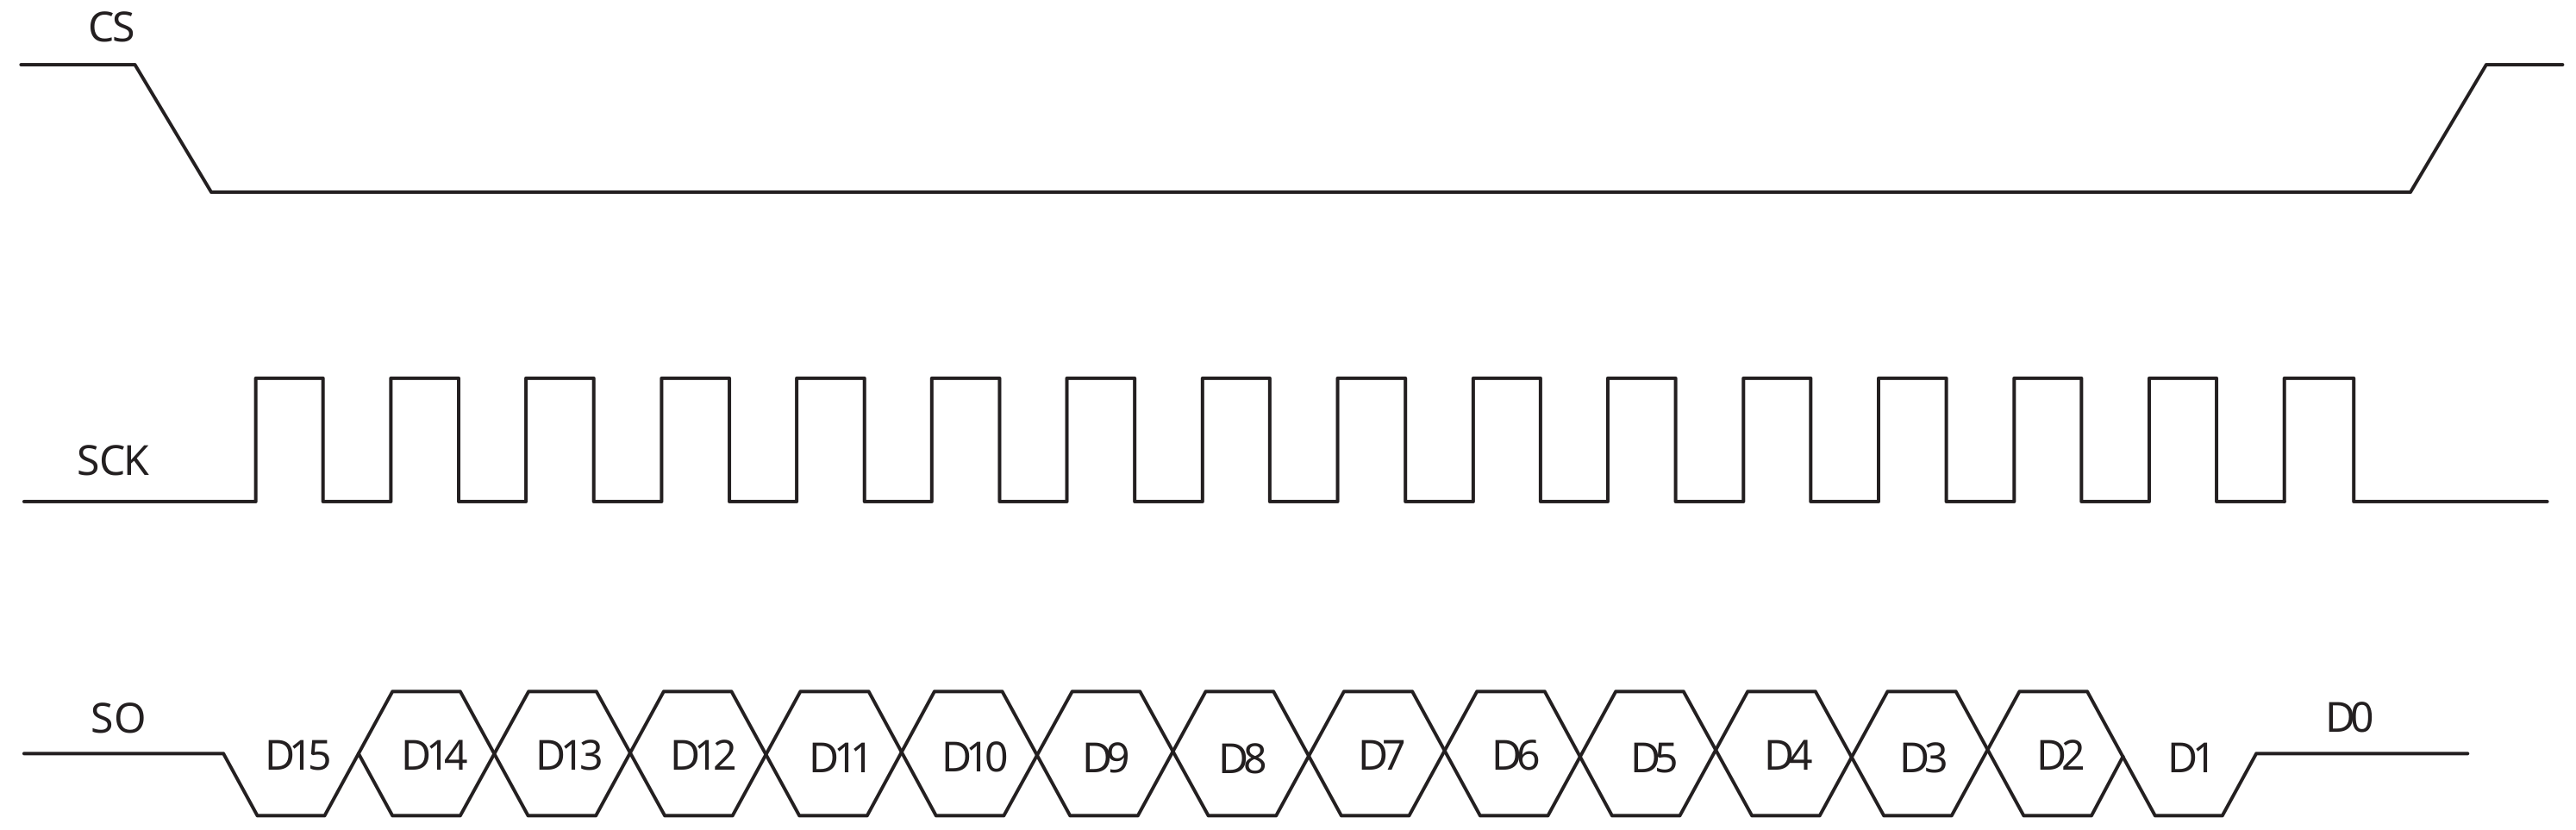
Figure 7 shows that the first bits to be transmitted are the most significant bits (MSBs). However, in the ESP32 registers, these bits are stored as being the least significant bits (LSBs). Therefore, it is necessary to exchange the first byte with the second before interpreting the temperature values.
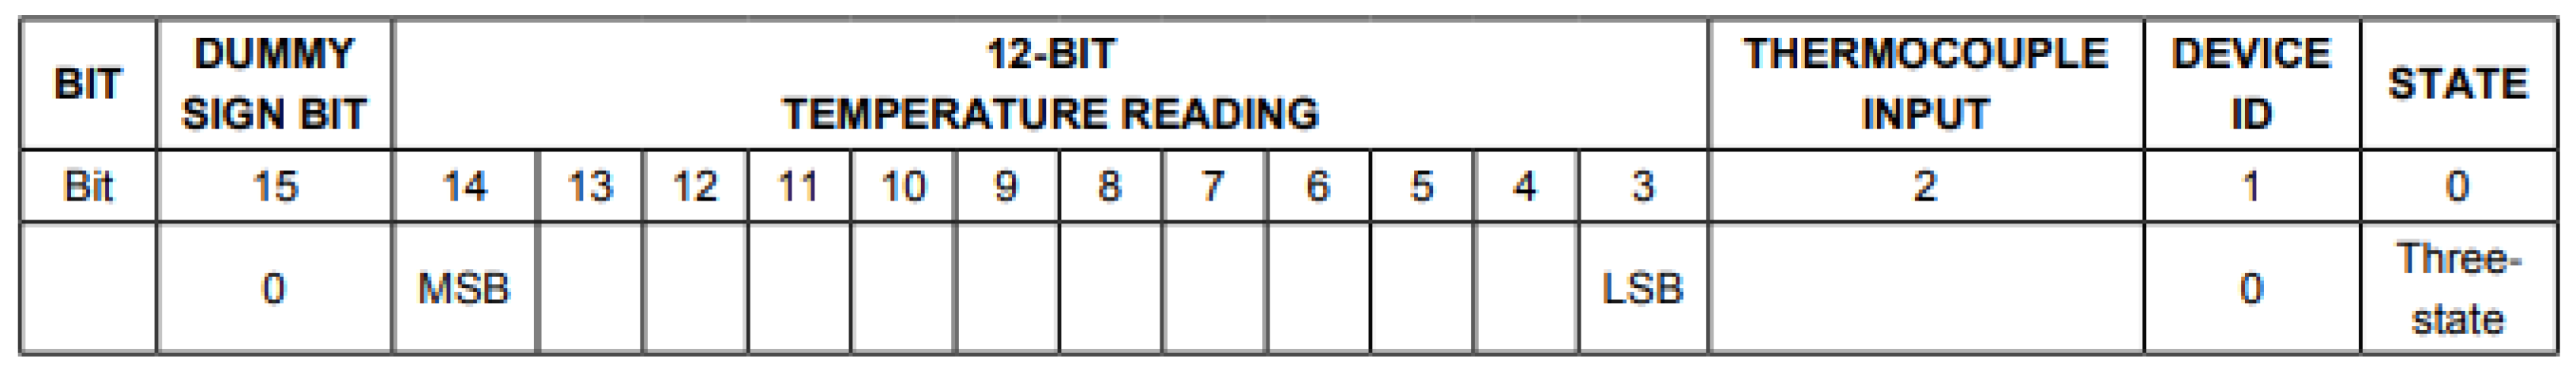
After correcting the byte positions, it was possible to obtain the sensor information and the read value, as shown in
Figure 8. Bit 2 indicates whether the sensor is coupled, where a value of 0 indicates that the sensor is missing and a value of 1 indicates that the sensor is present.
The MAX6675 stores the temperature value in bits 3 to 14, and we calculate the final value by multiplying the read value with the value of the module resolution (0.25 °C).
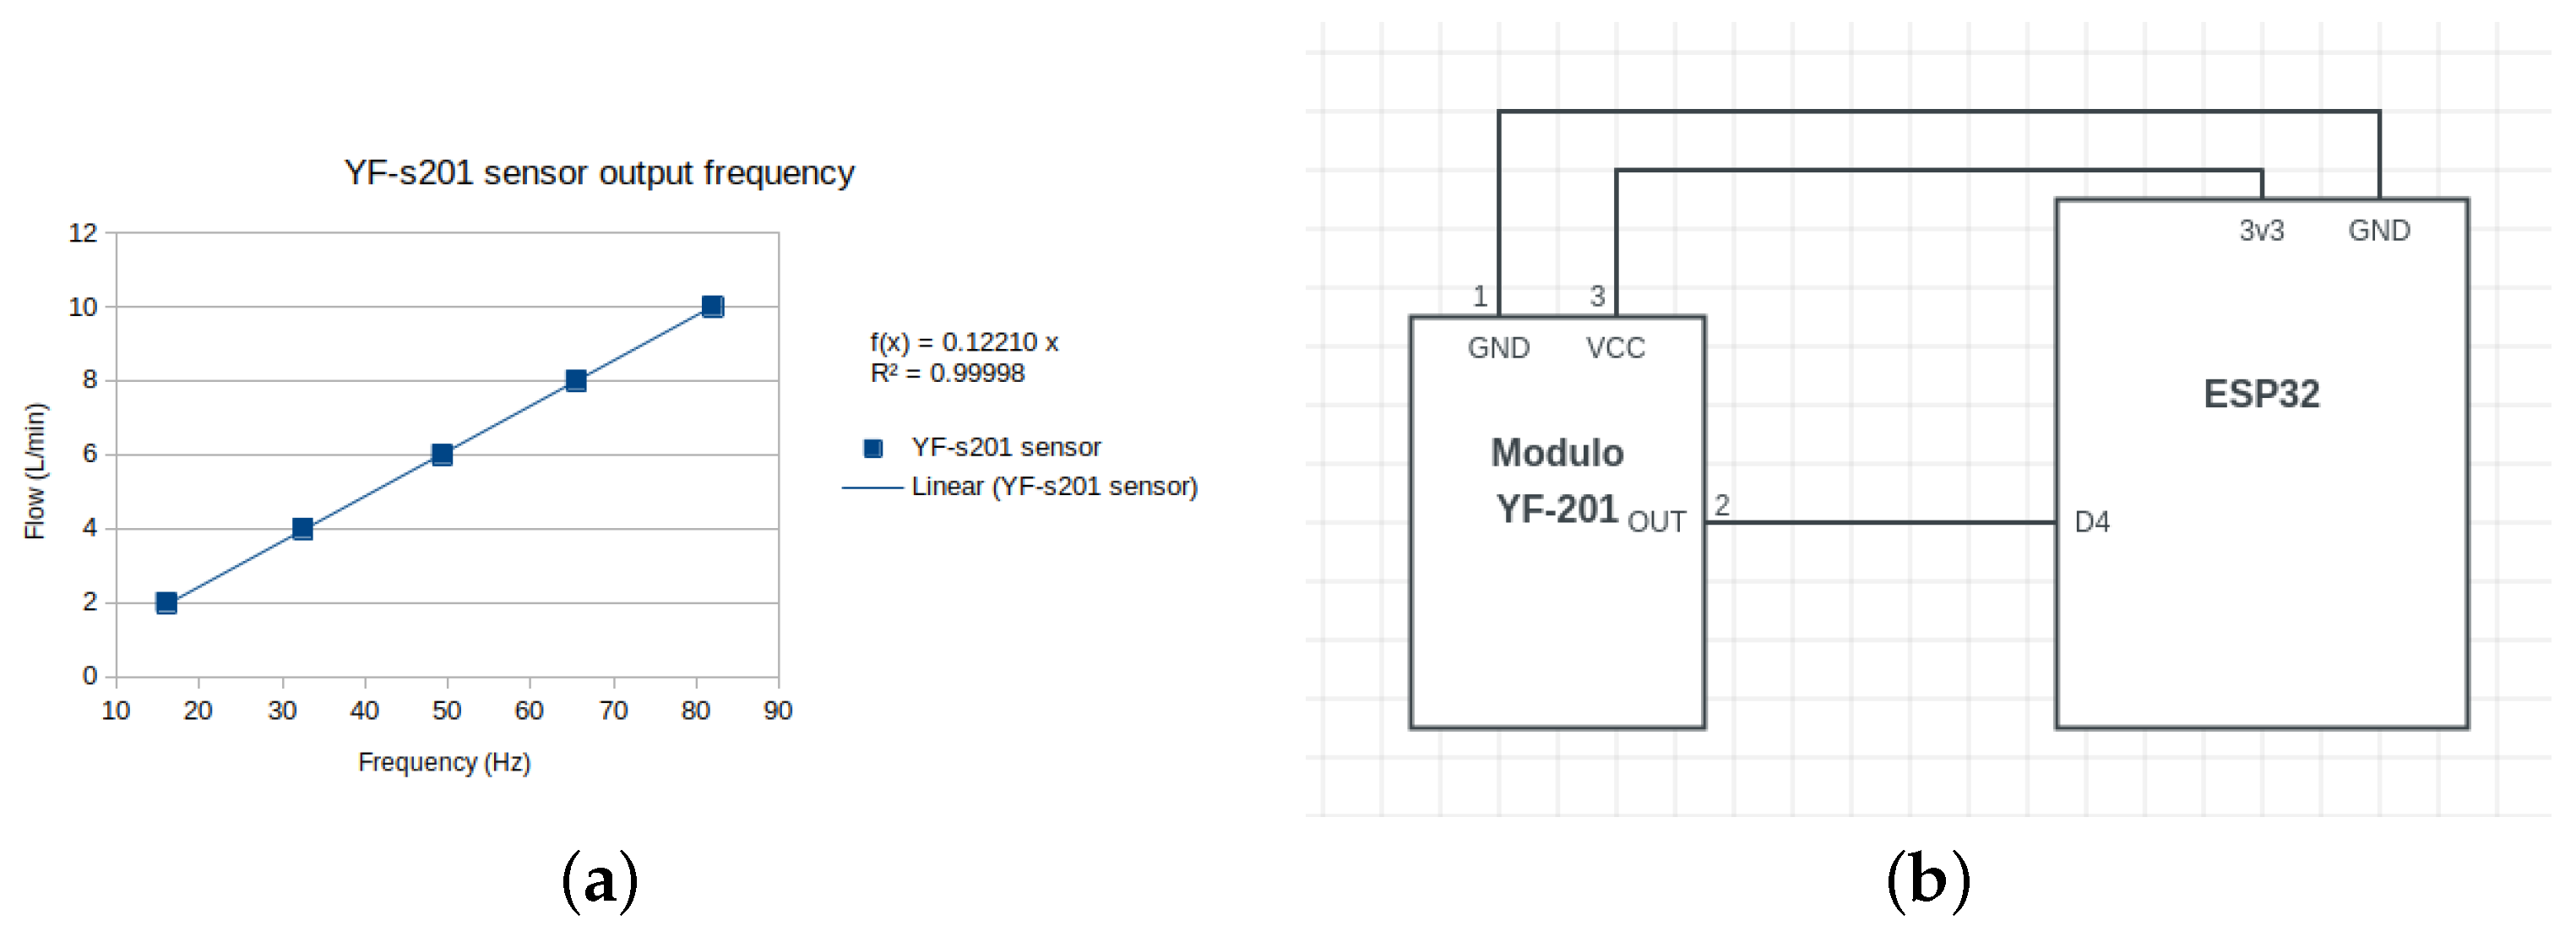
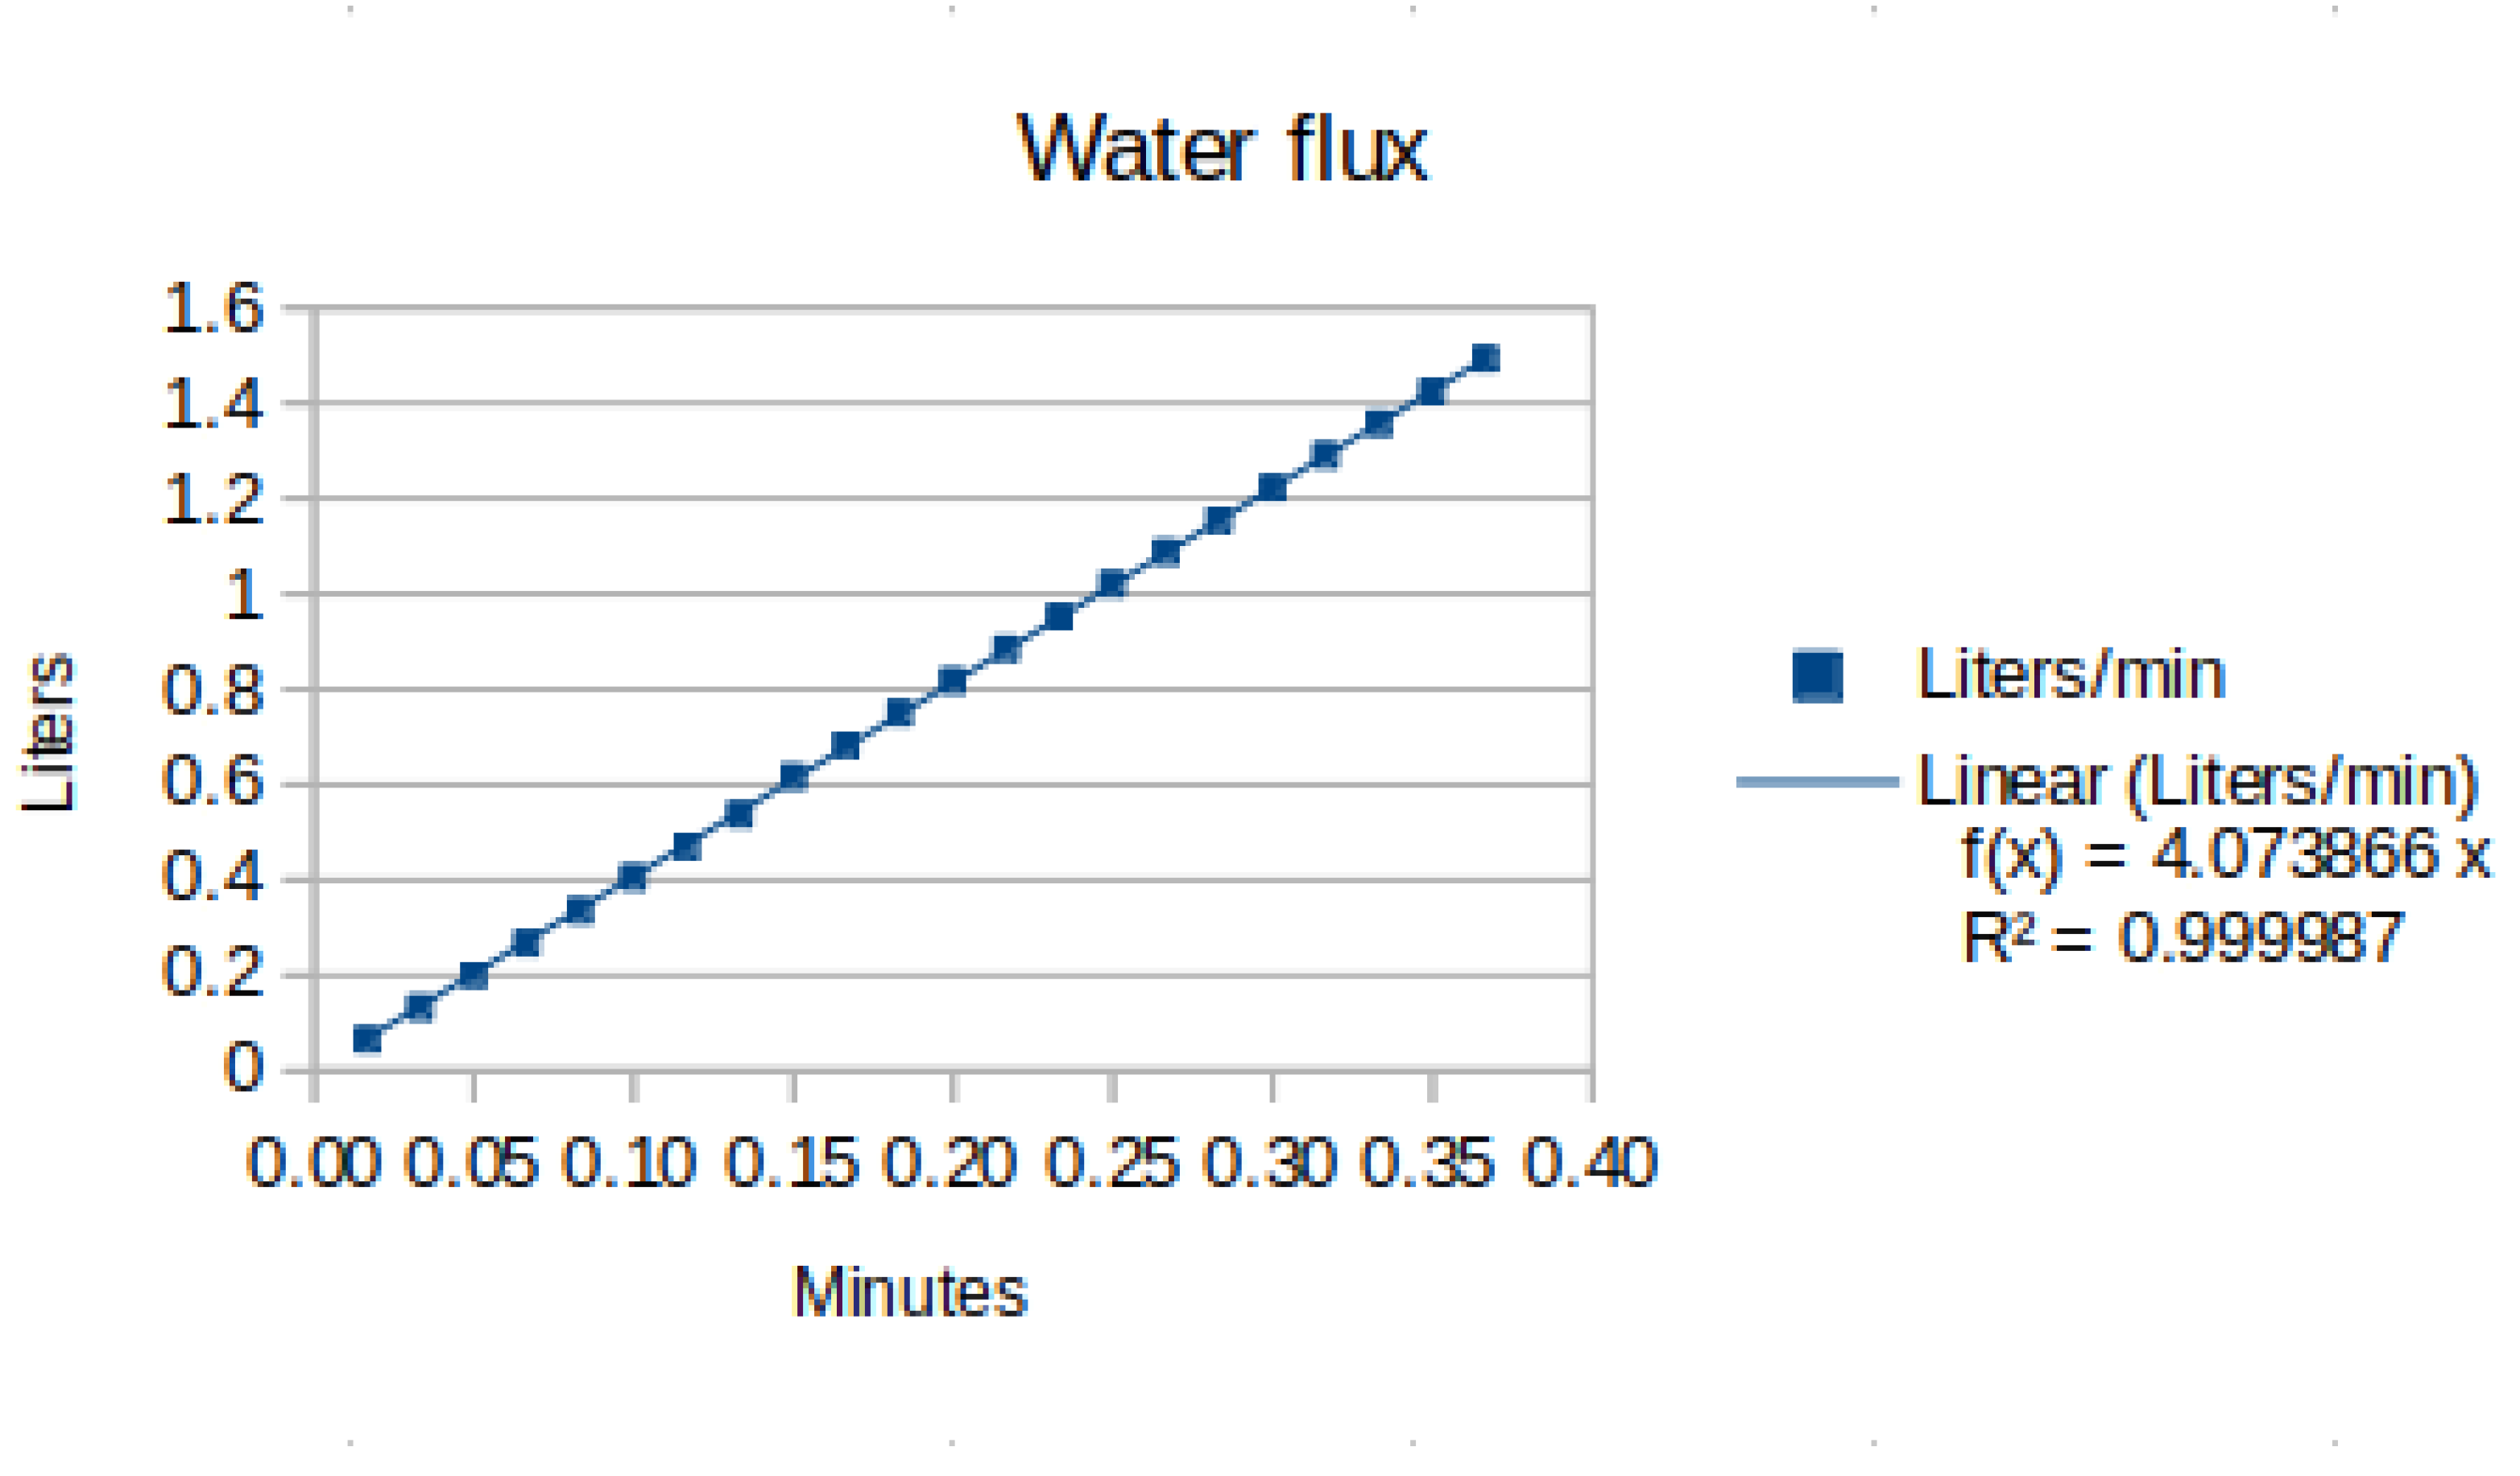
The YF-s201 sensor performs the water flow measurement, which emits pulses as the water passes through it; a counter present in the ESP32 reads these pulses, analyzes them every second, and then starts from zero.
Figure 9a shows the graph elaborated through the datasheet data of the YF-s201 component [
13]. The points on this graph form a regression liner used to obtain the water flow.
Figure 9b shows the electrical connections necessary for the water flow meter to function and the connection from the signal output pin of the YF-s201 to the pin D4 of the ESP32, which is the pin of counter entry.
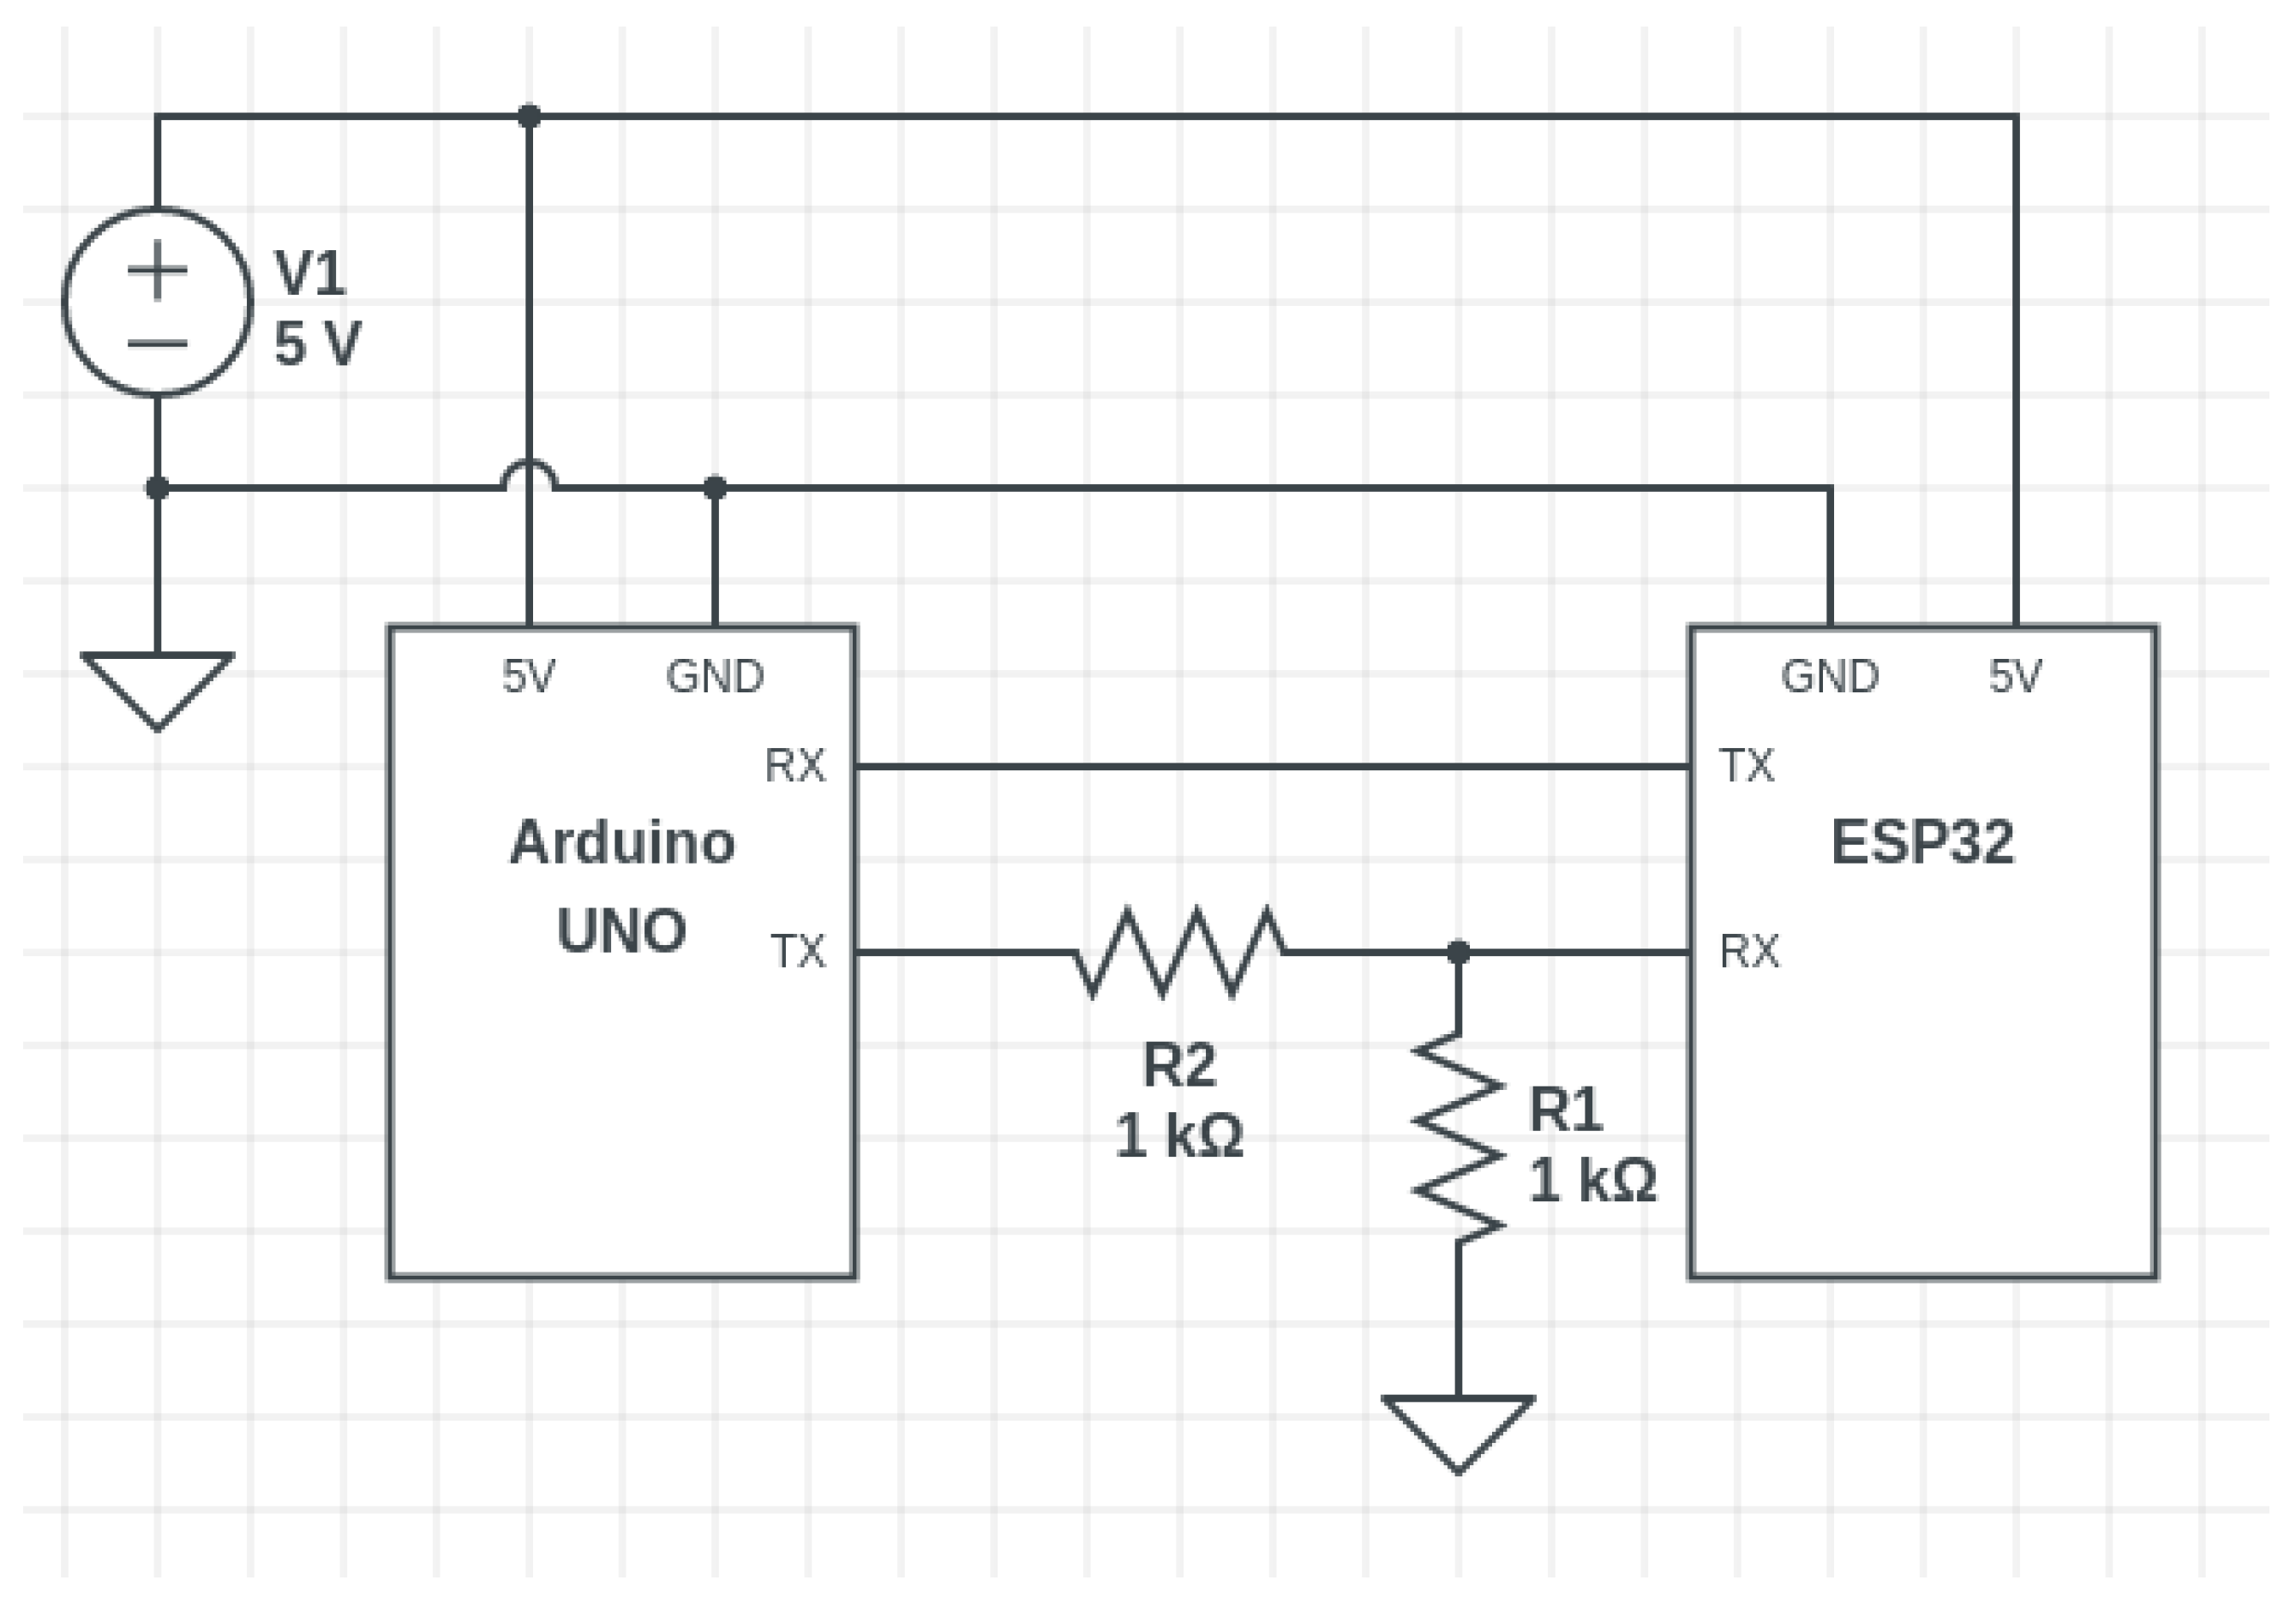
The UART protocol is used by the communication between the Arduino UNO and the ESP32, with a transmission rate of 115 Kbps. This communication uses two lines: TX (transmission) and RX (receive). However, due to the difference between the operating voltage level of Arduino (5 V) and ESP32 (3.3 V), we added a voltage divider in the transmission line from Arduino UNO to ESP32, as shown in
Figure 10. This voltage divider is straightforward to construct as it uses two identical resistors, each with a value of 1 K
. It reduces the 5 V signal to 2.5 V, which falls within the ESP32’s operating voltage range of 2.2 to 3.6 V.
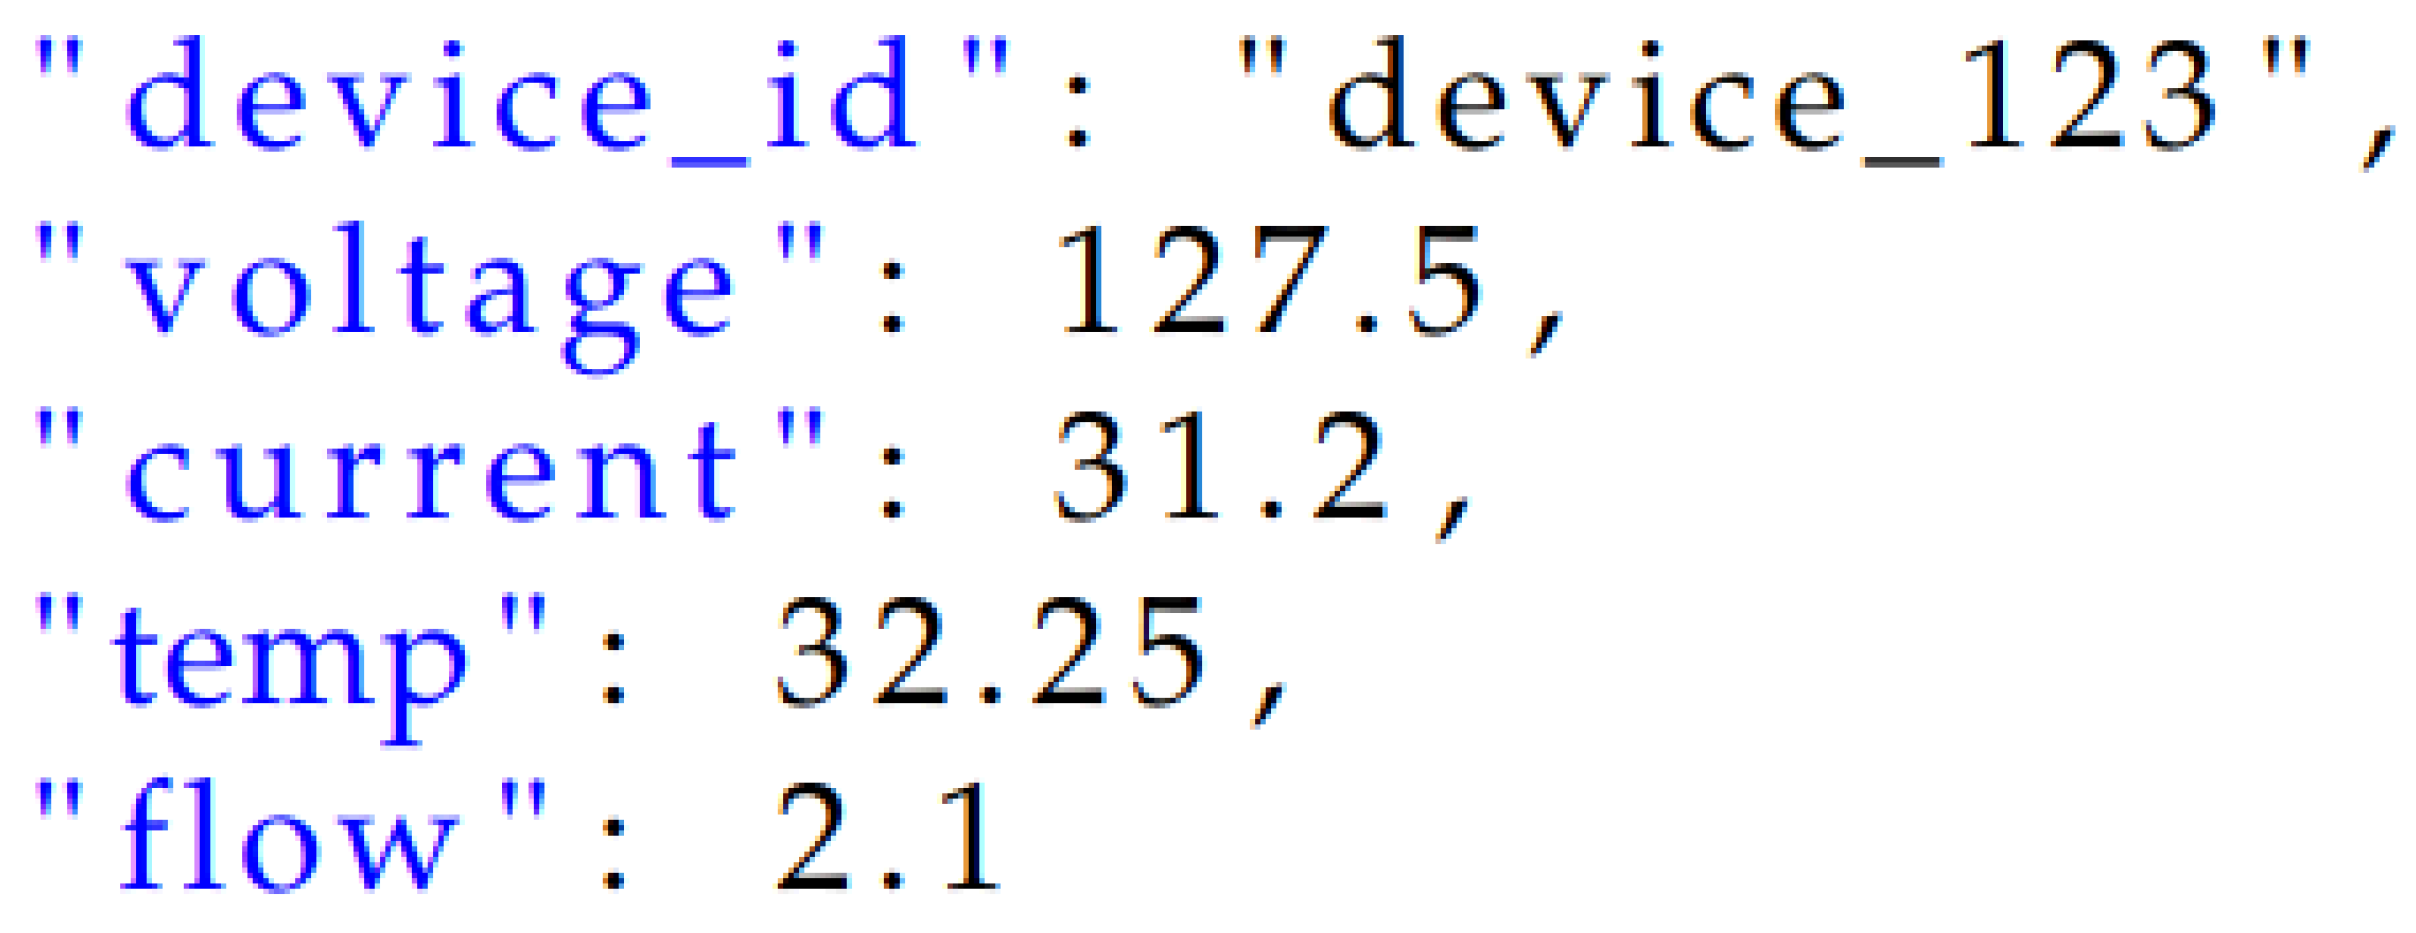
The message sending is responsible for establishing it with the monitored attributes and transmitting it to the broker in AWS. For that, we used aws-iot-device-sdk-embedded-C SDK, which has functions for IoT device communication with aws-IoT. To implement authentication on the broker, we used security certificates provided when registering the device with AWS.
After configuring and linking with the user account, the device starts sending messages to the broker, using the topic in the format
shower-iot/:account–id/:device underline id/pub.
Figure 11 shows the example JSON code used for sending messages to MQTT.
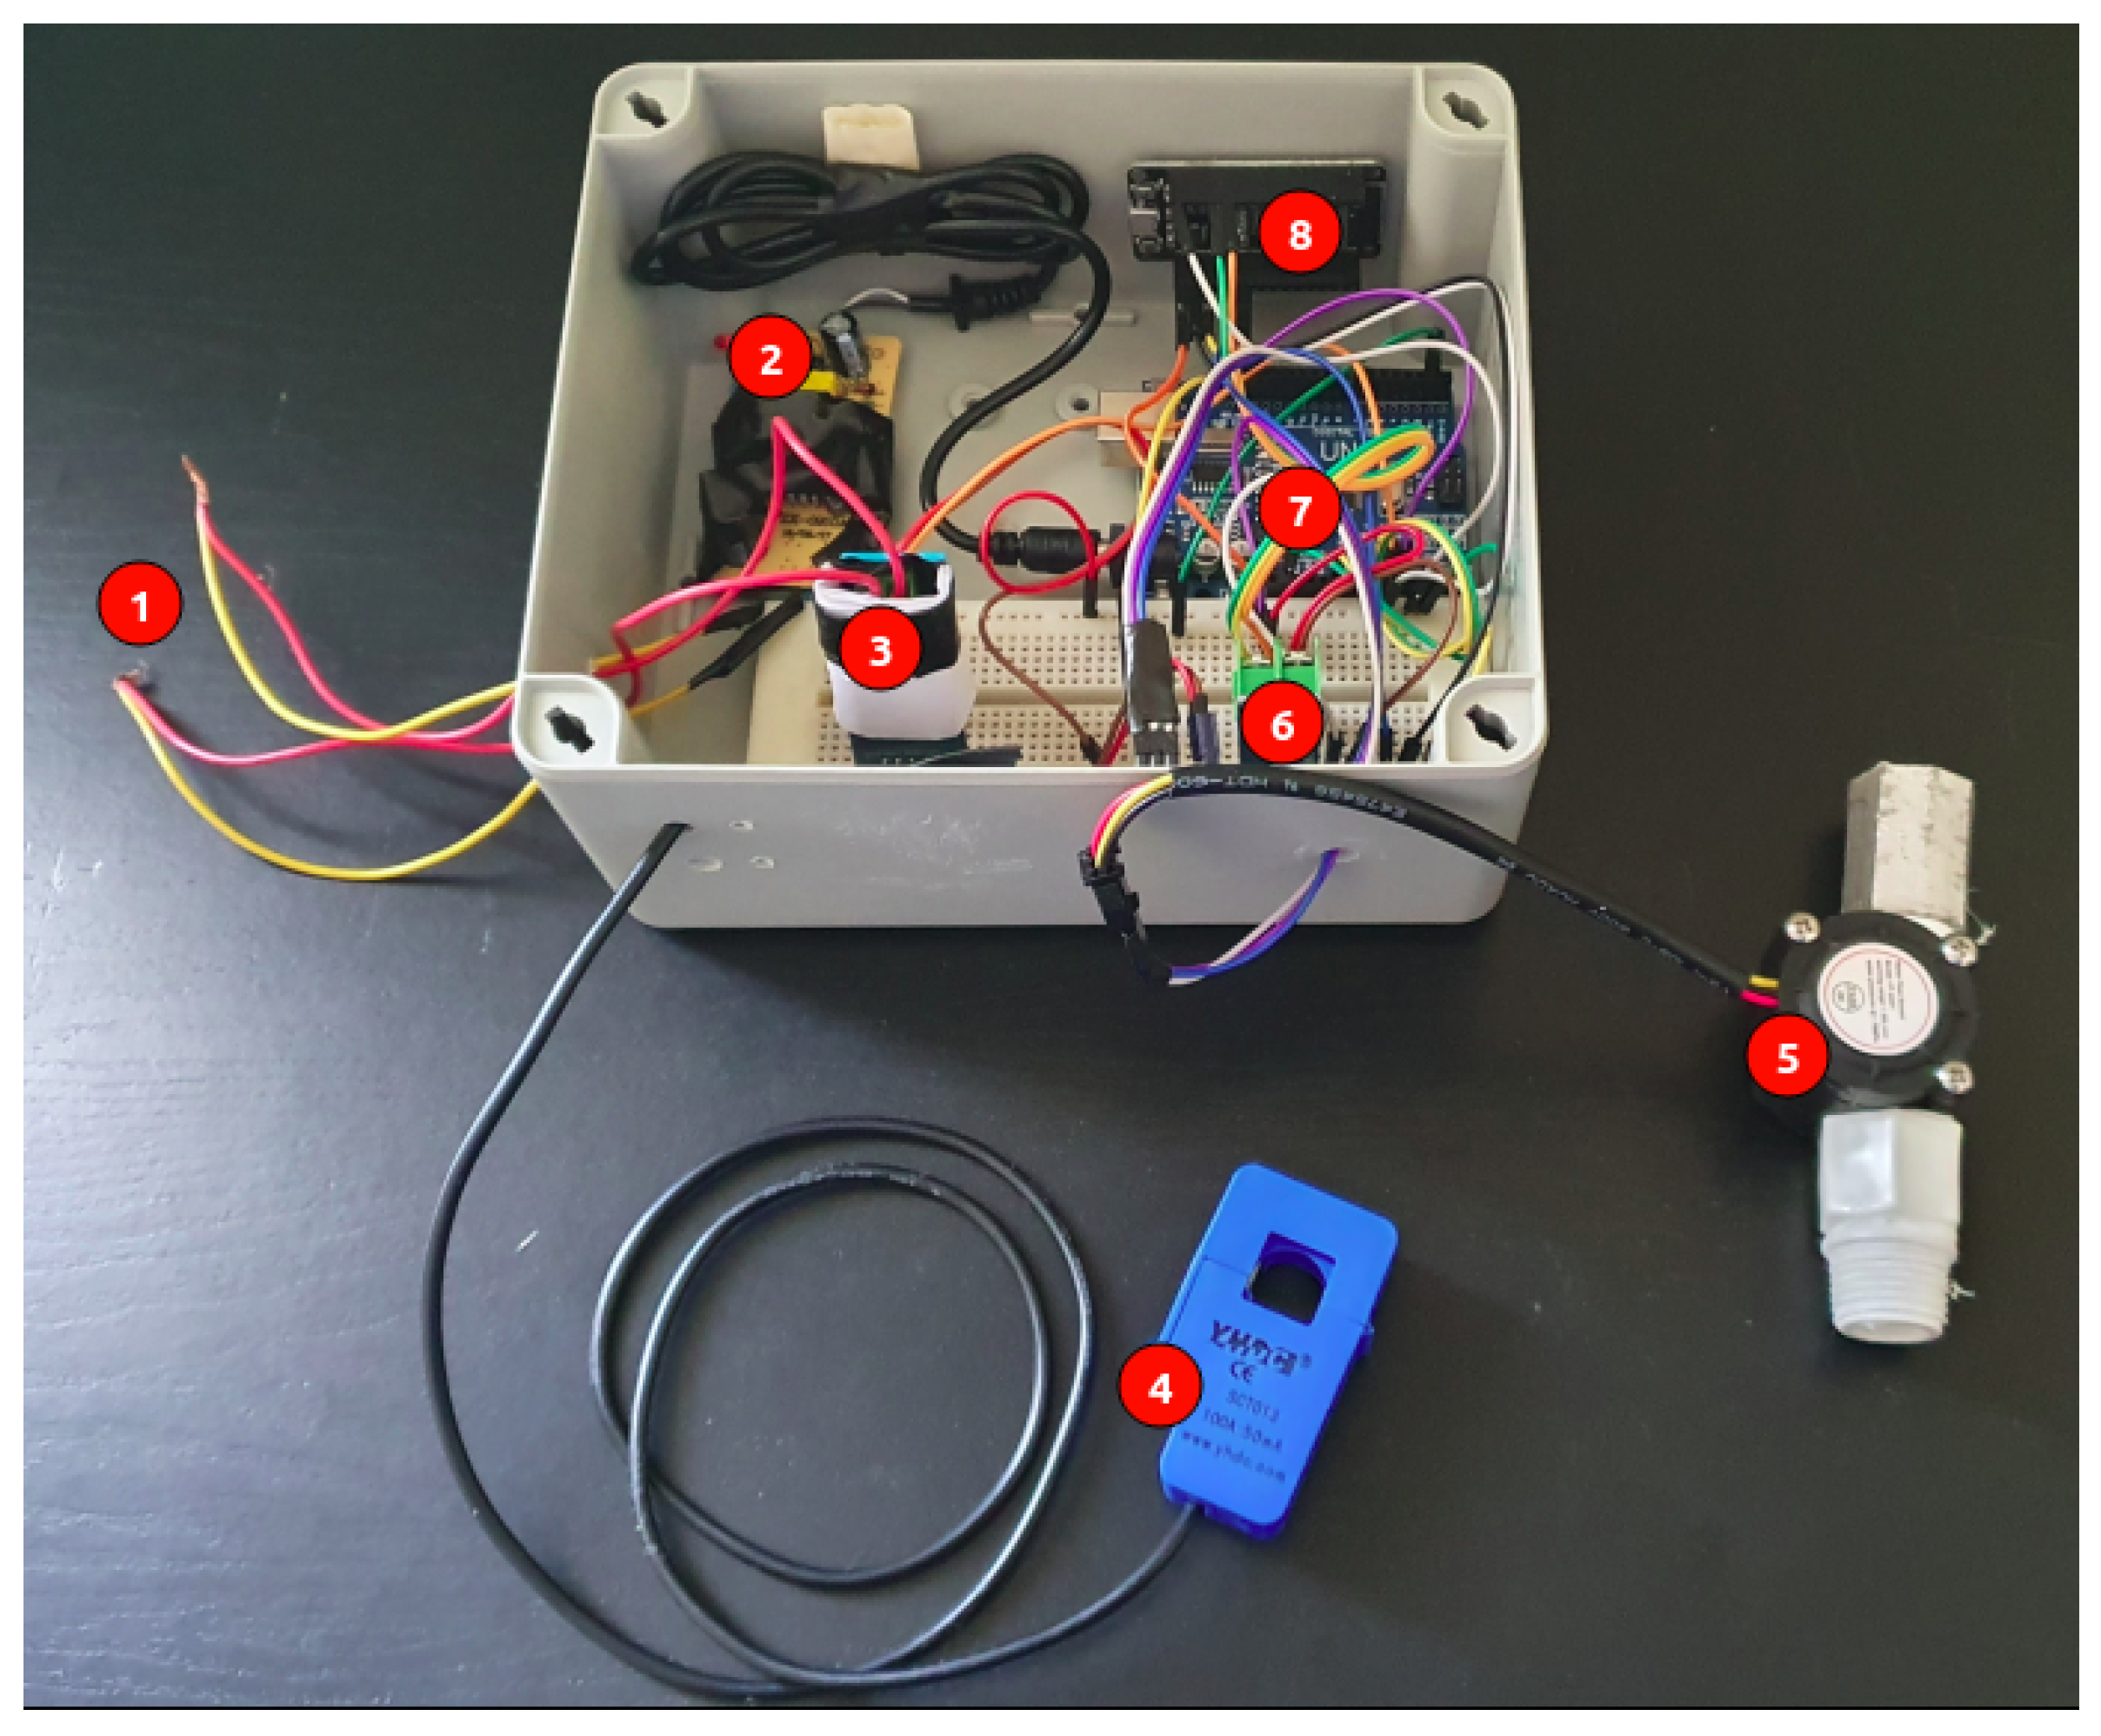
To develop the prototype (hardware), we used a plastic box with a seal on the lid, which minimizes the contact of water vapor with the electronic components; moreover, to make connections between components, we used a breadboard and wires.
Figure 12 shows the components and sensors used in prototype development.
As shown in
Figure 12, the items used were, in addition to wires (1) for the connection to the electrical network and the power supply (2), an electrical voltage sensor (ZMPT101b) (3), an electrical current sensor (SCT -013) (4), a water flow sensor (YF-s201) (5), a MAX6675 module (6), an Arduino UNO (7) and an ESP32 (8).
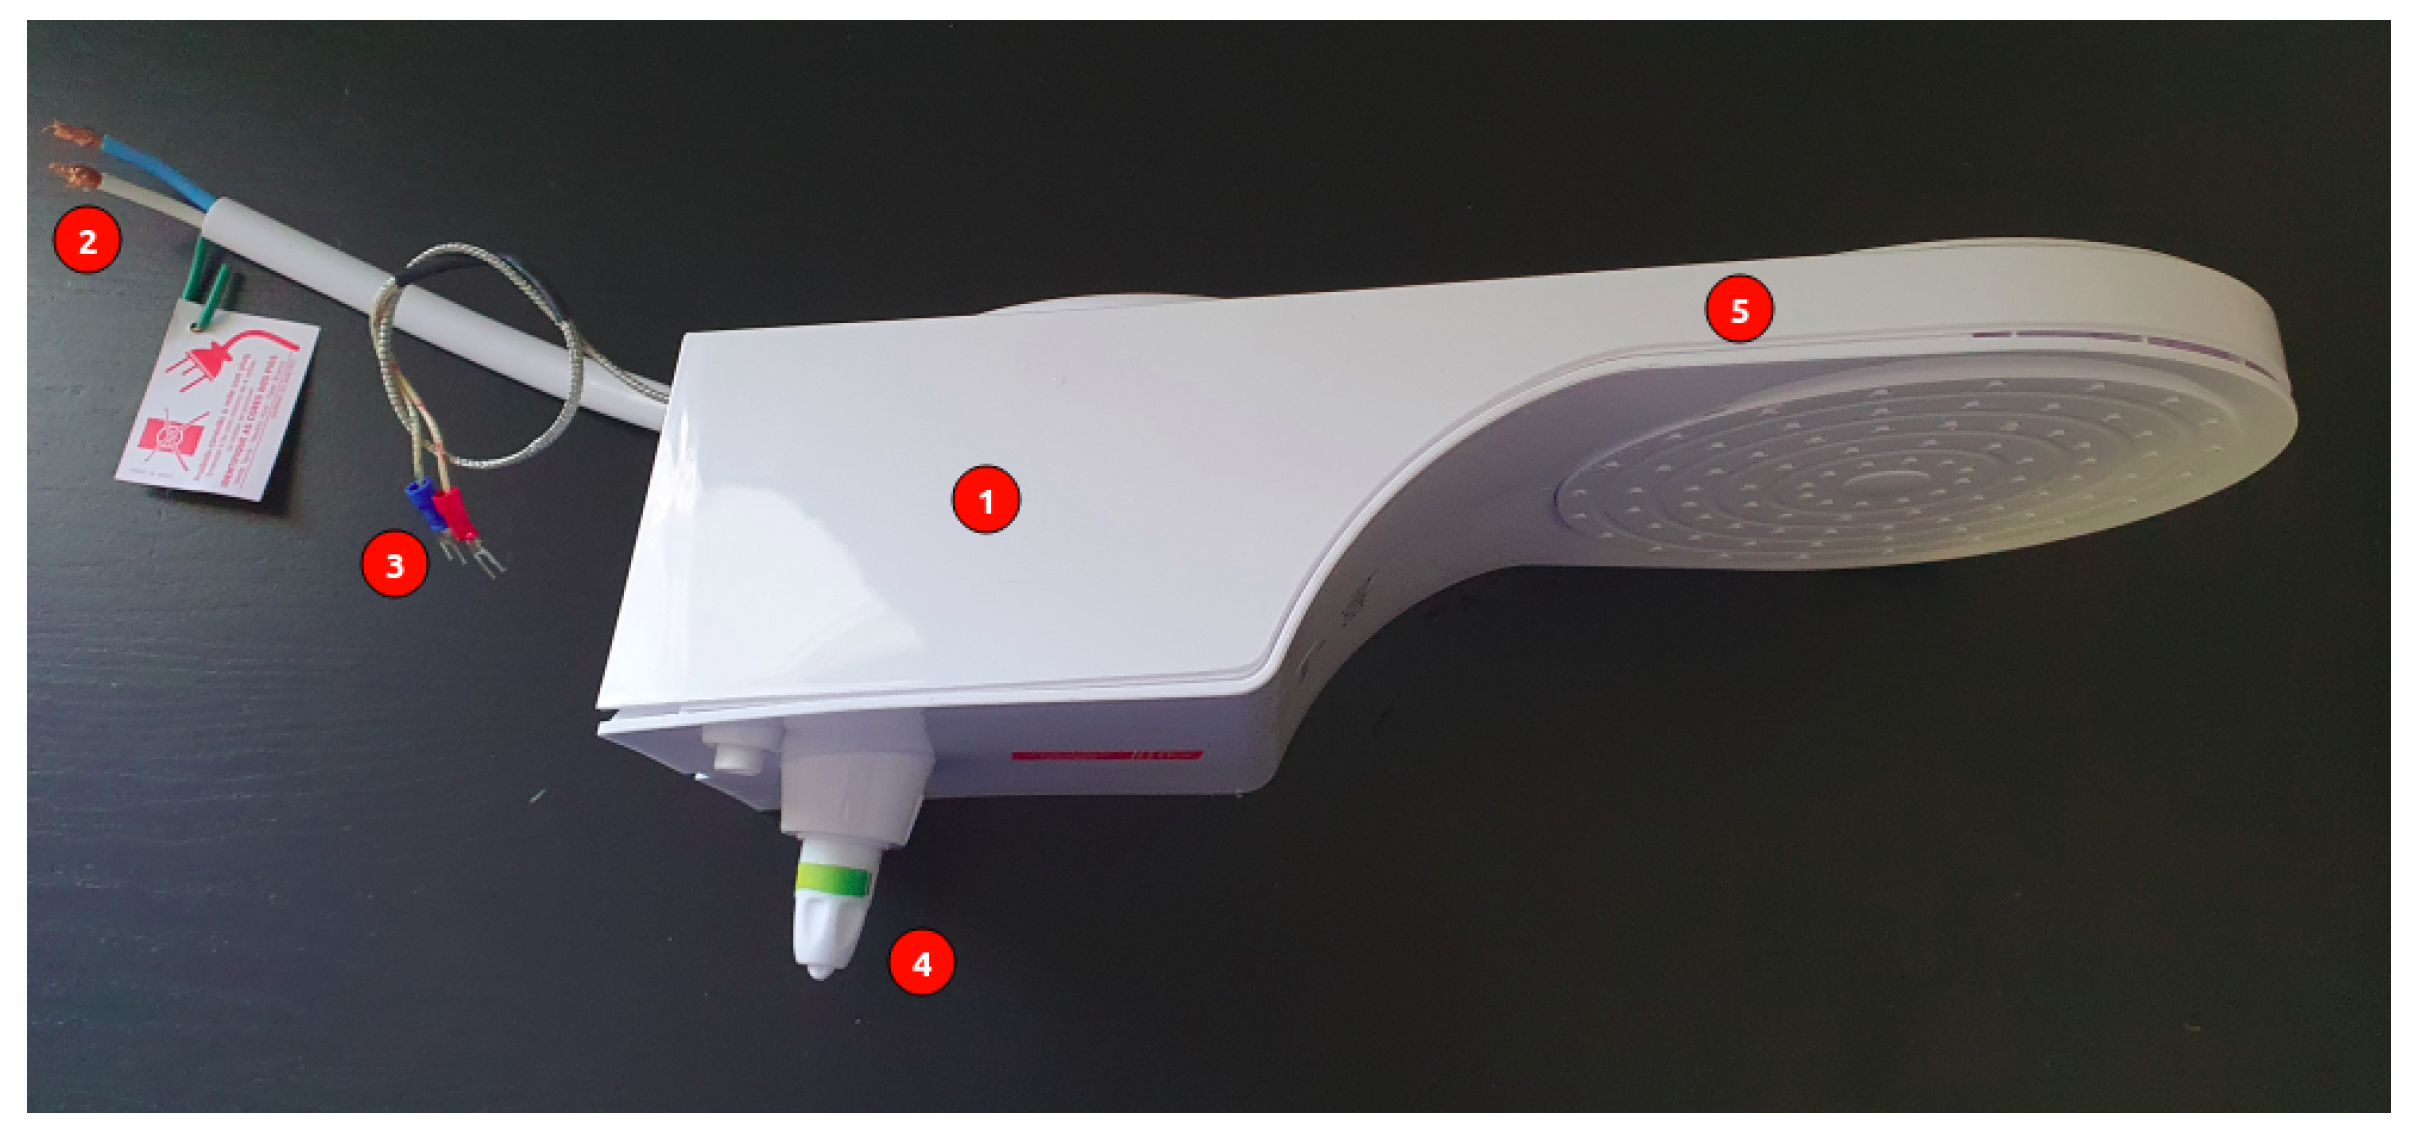
Figure 13 shows the items used: electric shower (1), mains connection wires (2), sensor terminals (3), electrical power adjustment (4), and sensor installation location (5).
To read the parameters, we used an electric shower (
Figure 13) with power adjustment, which makes it possible to change the monitored parameters, such as the applied electric current and the water temperature.
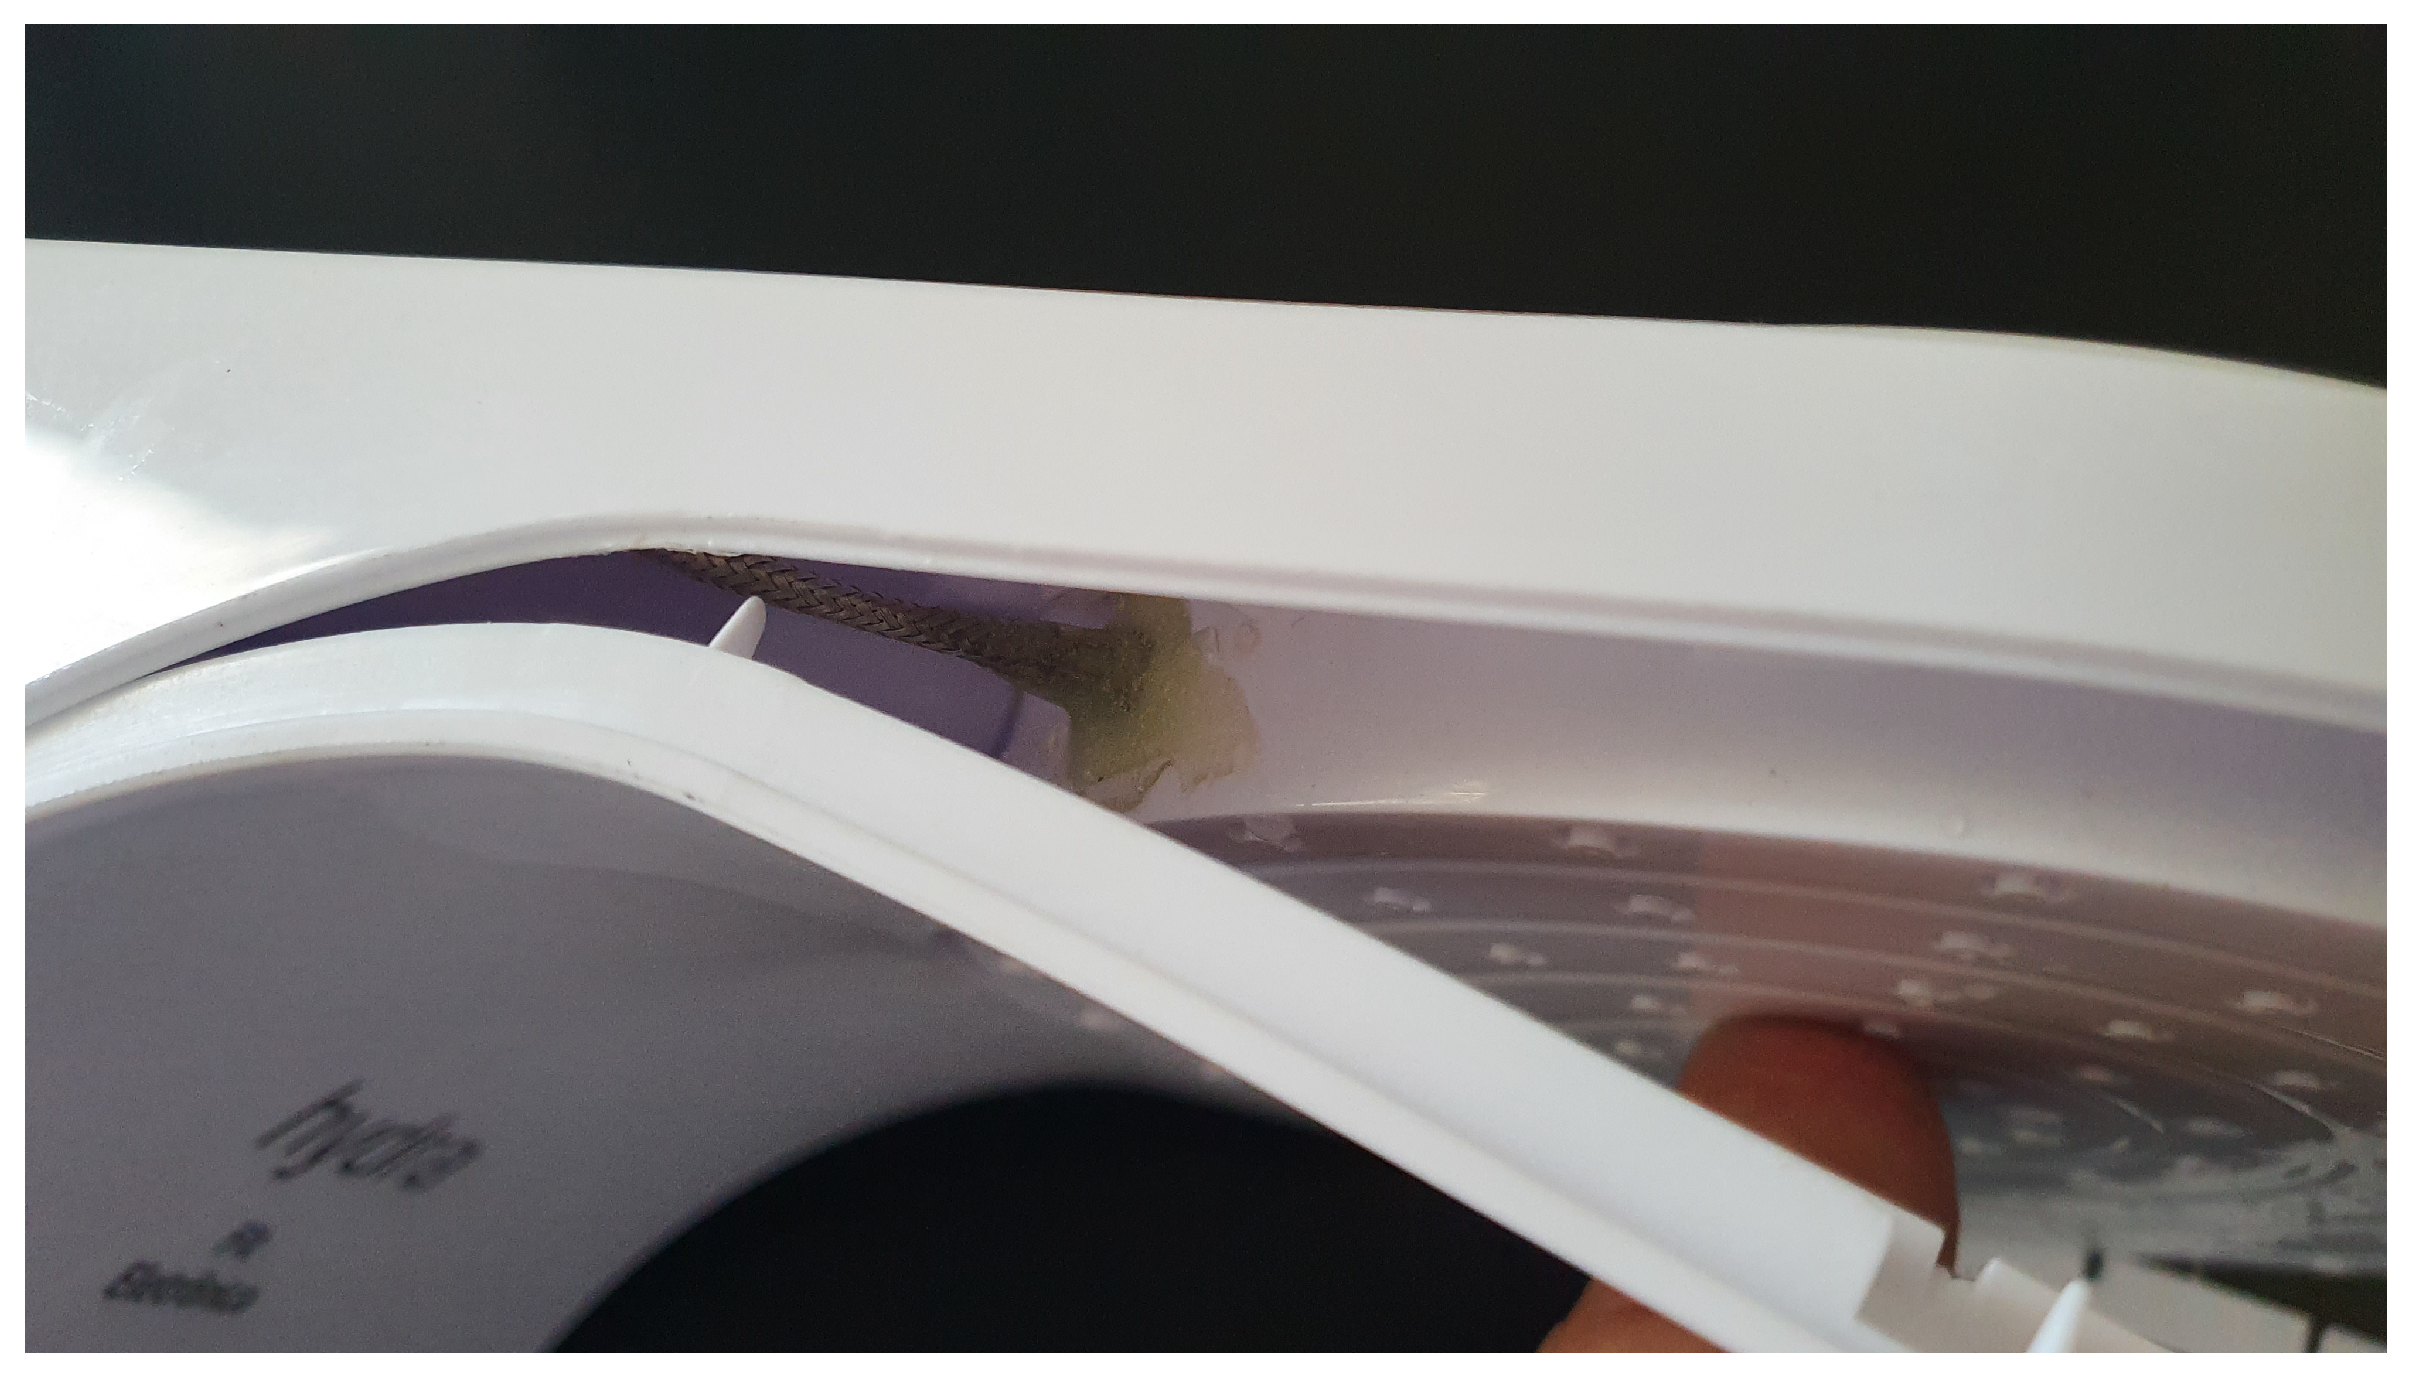
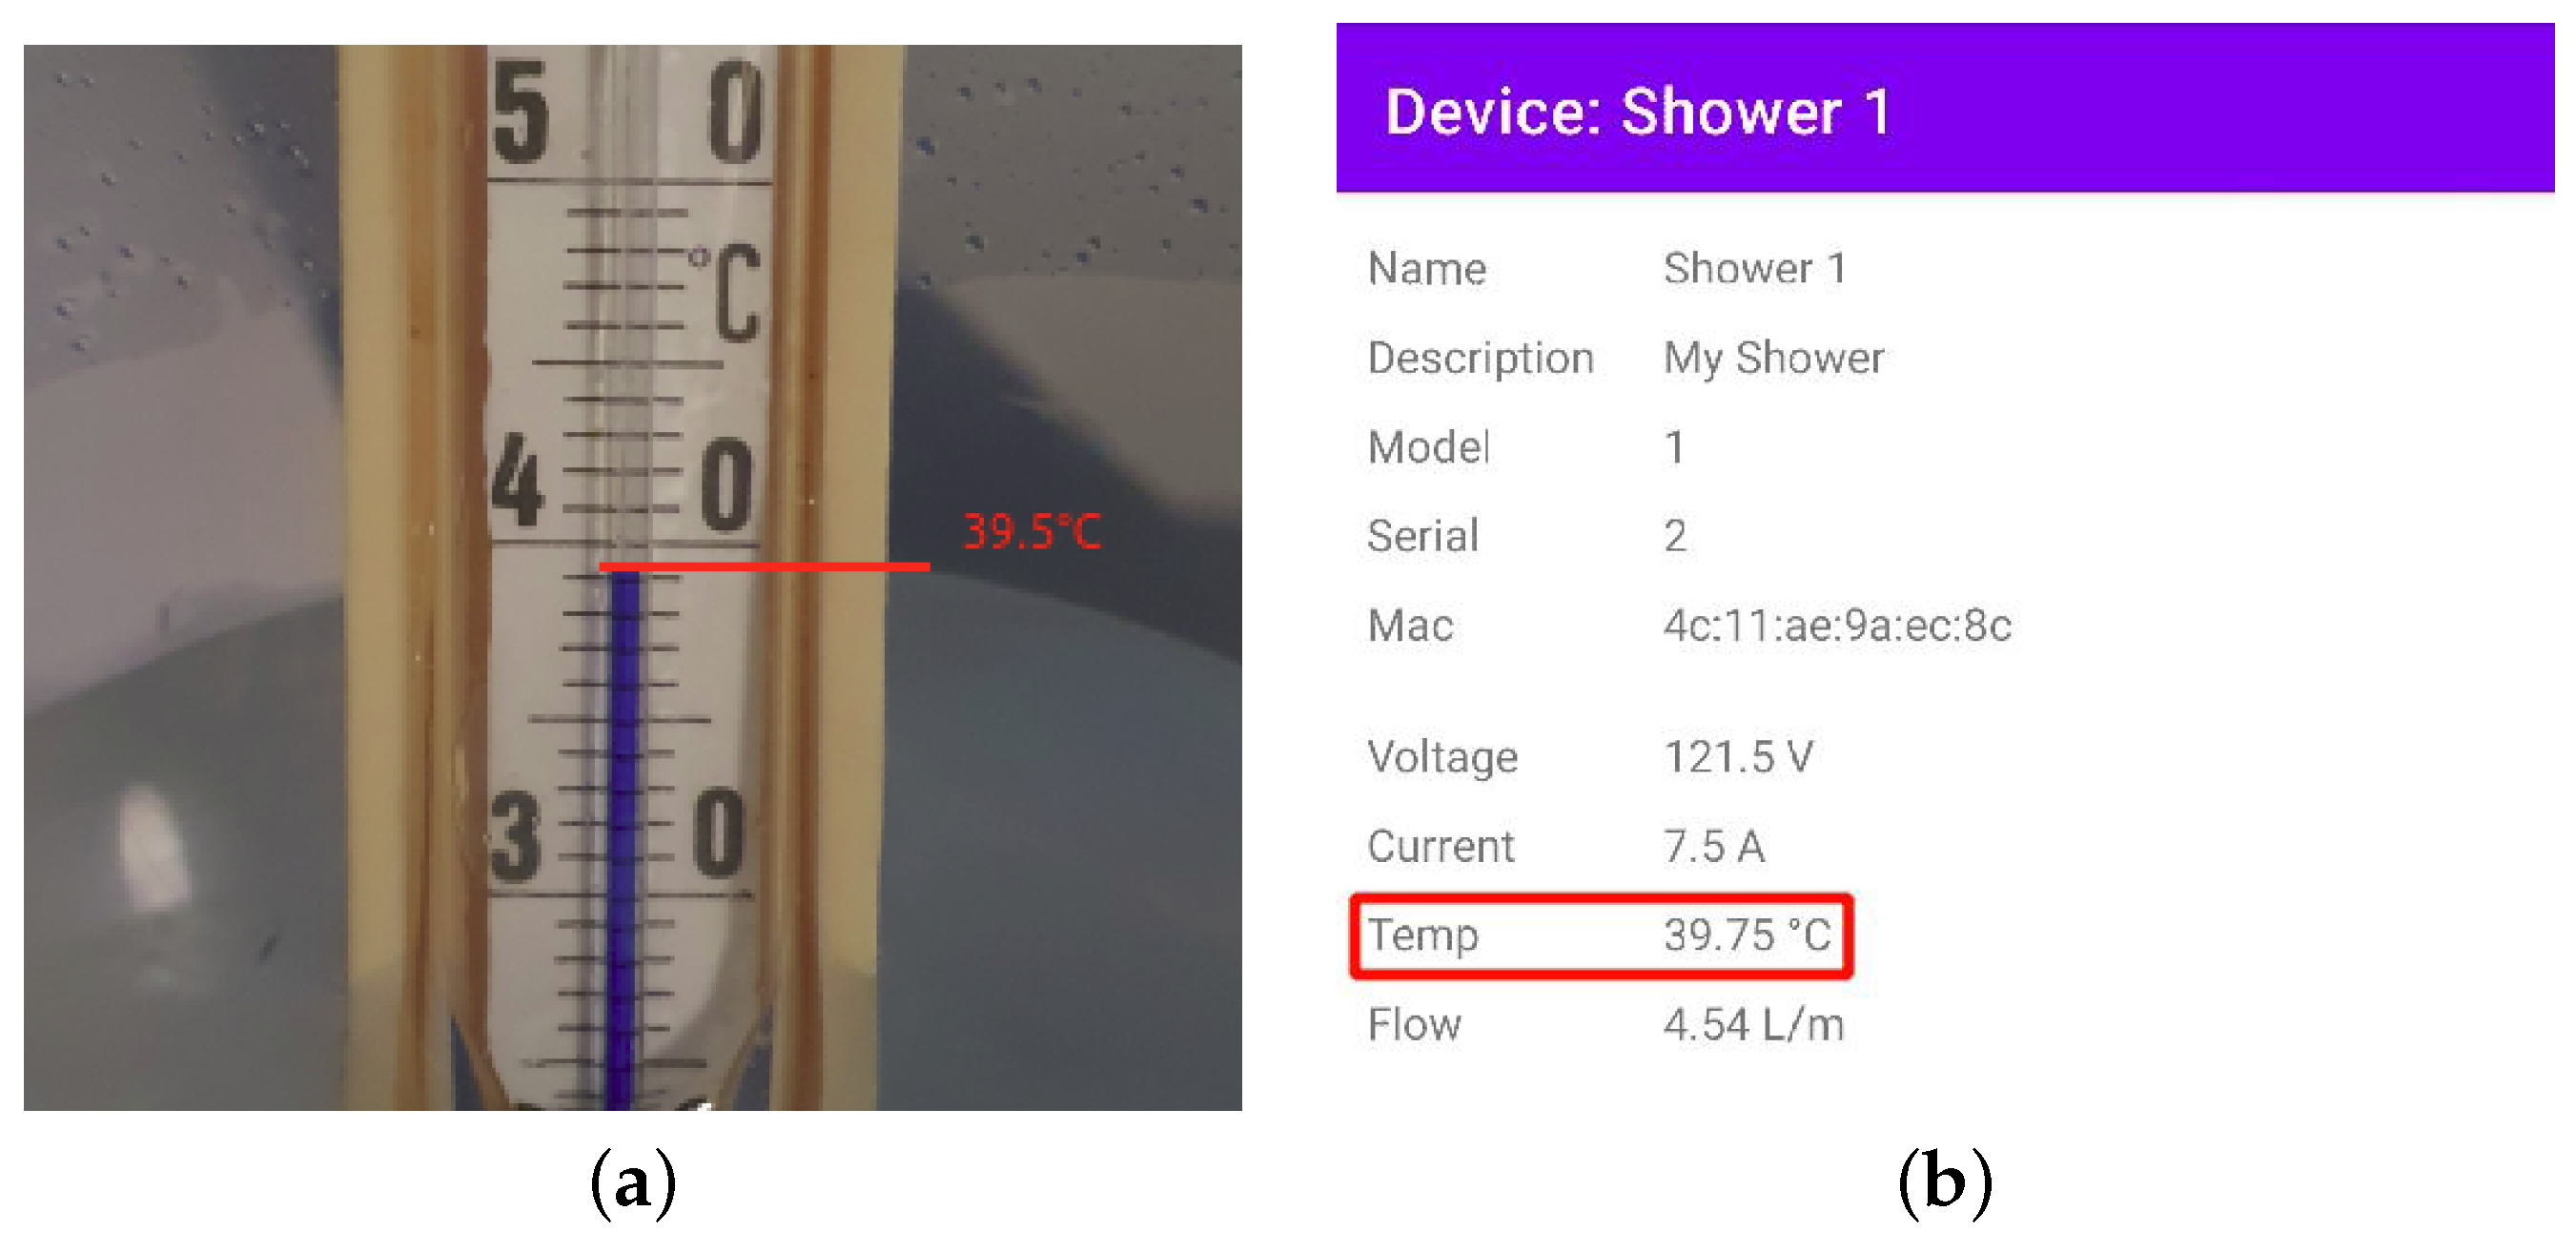
Figure 14 shows the installation of the temperature sensor in the shower water outlet, where there is an opening for the installation of the sensor and the use of epoxy resin for sealing.
As shown in
Figure 13, the items used were, in addition to the electric shower (1), the wires (2) for the connection to the electrical network, the terminals of the thermocouple sensor (3), the power adjustment mechanism (4), and the installation location of the thermocouple sensor (5).
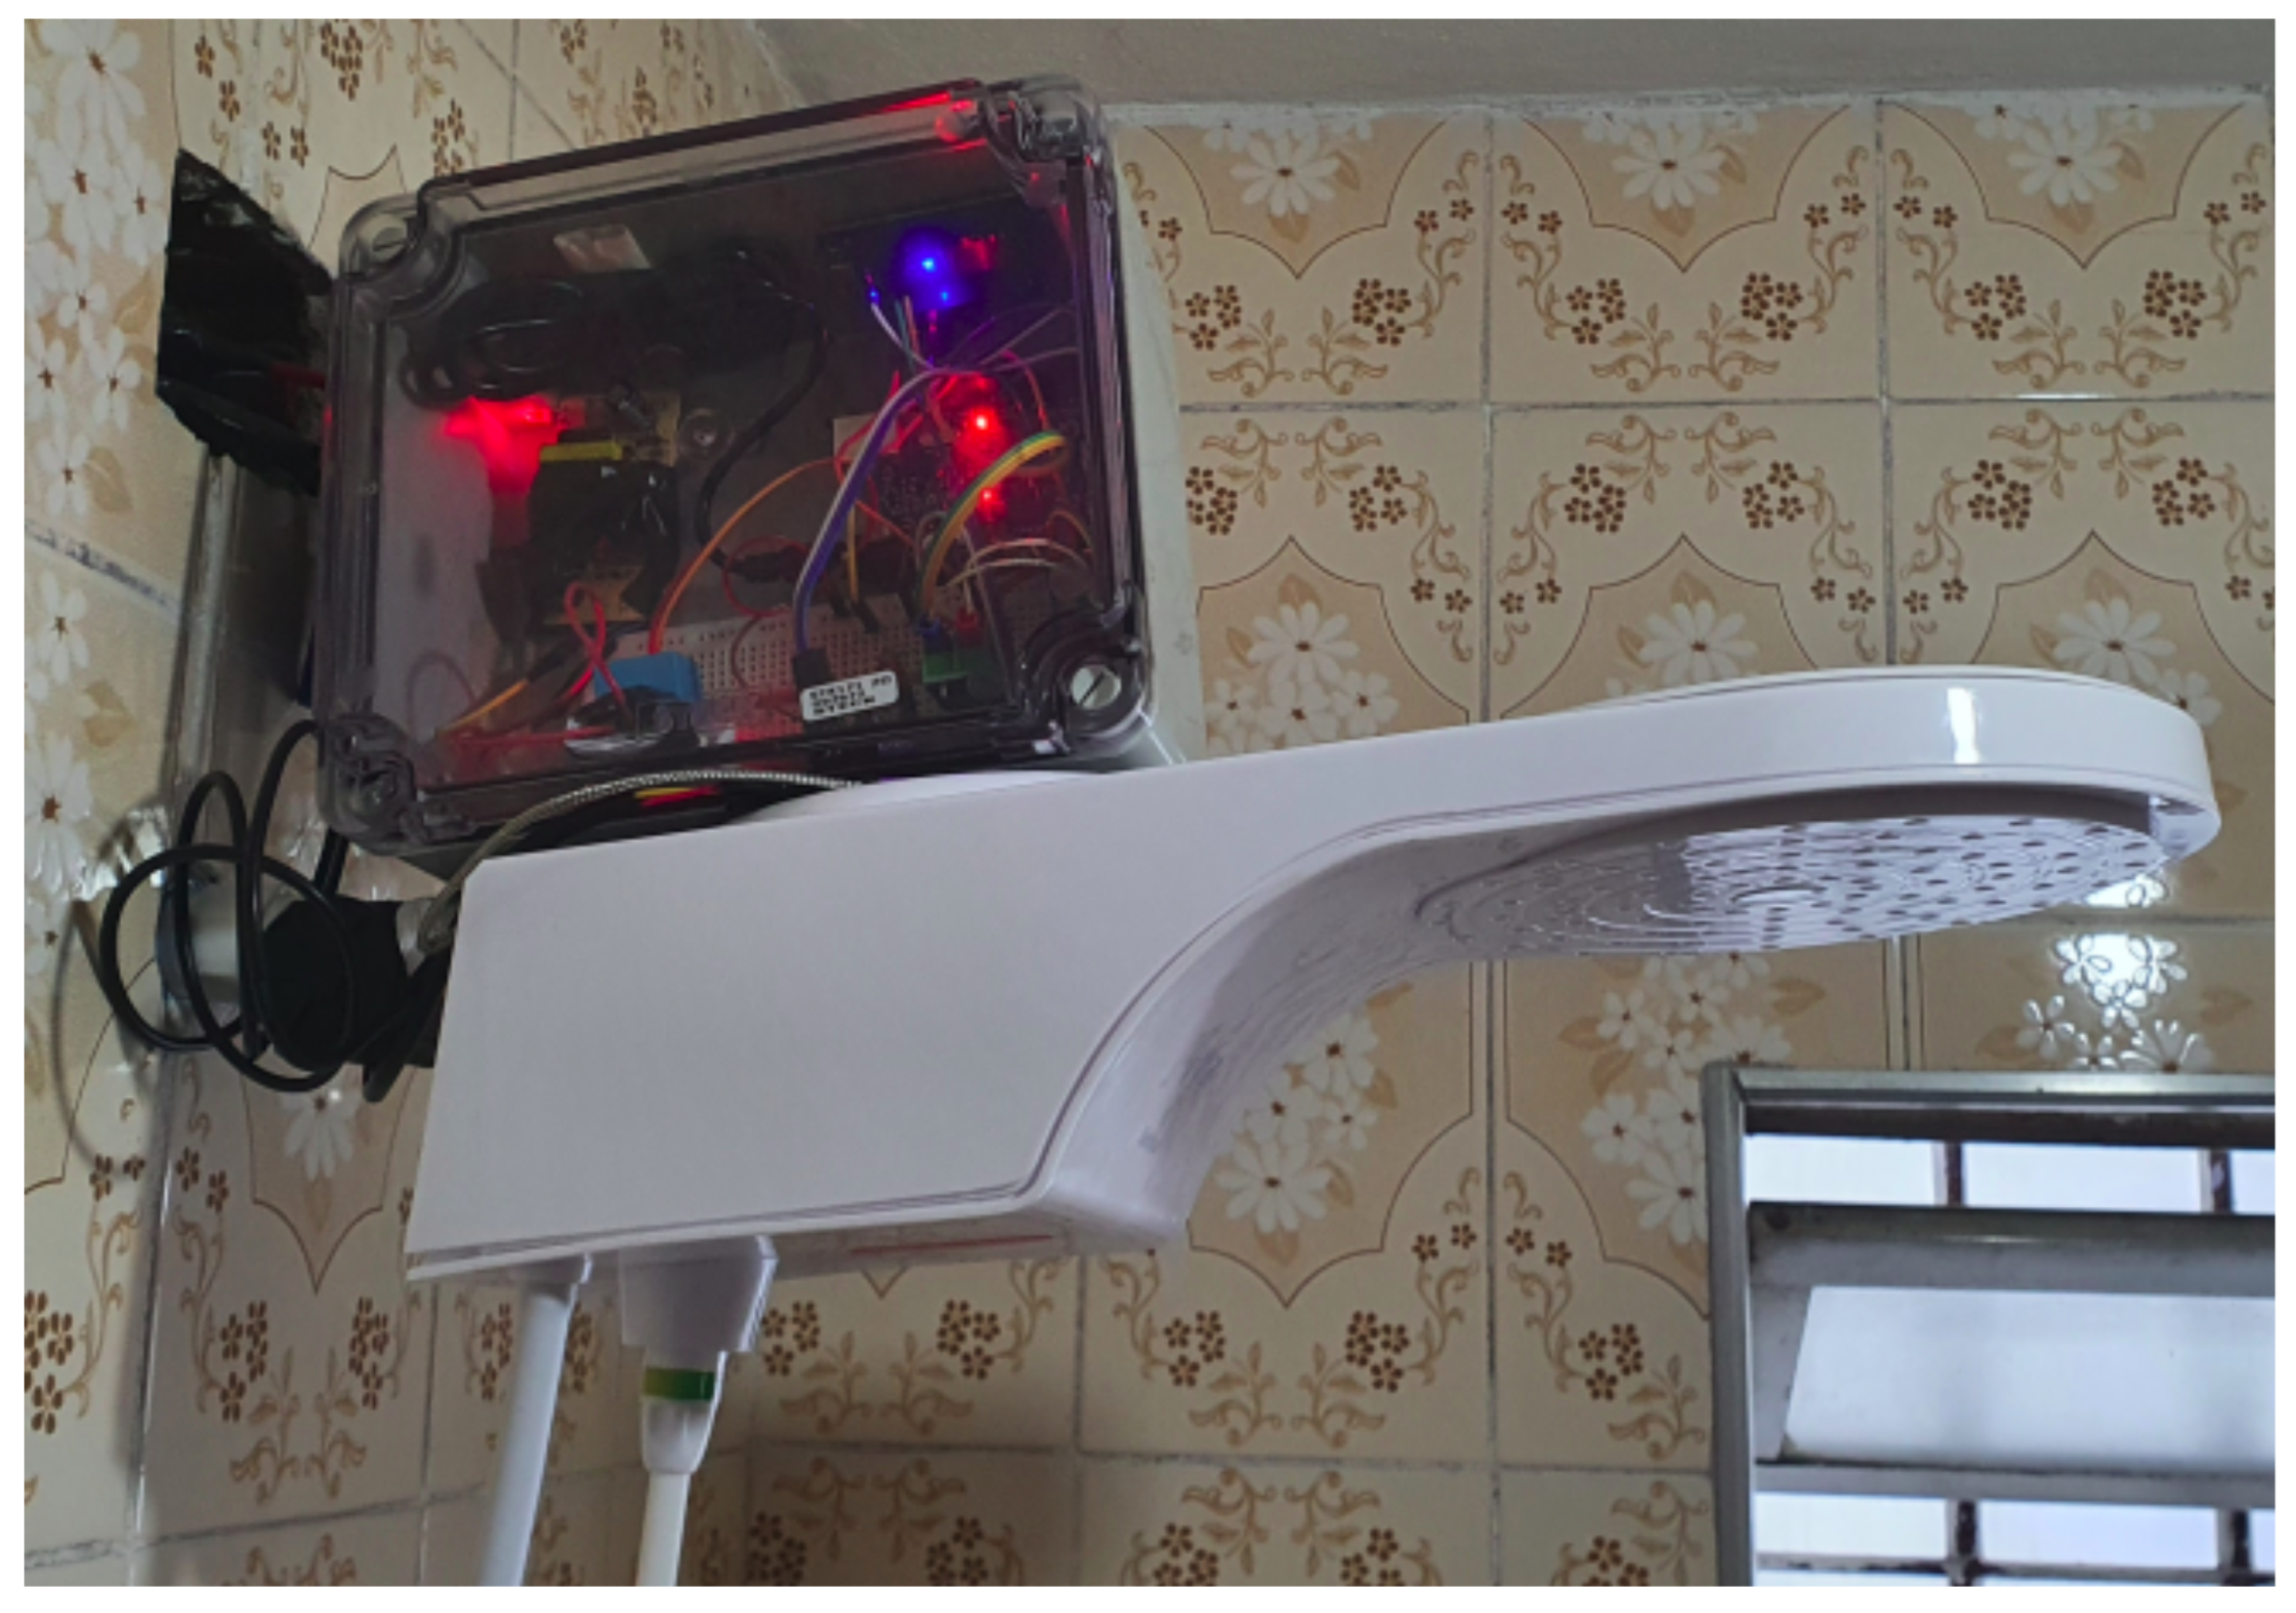
Figure 15 shows how we completed the integration of the prototype to the electric shower.
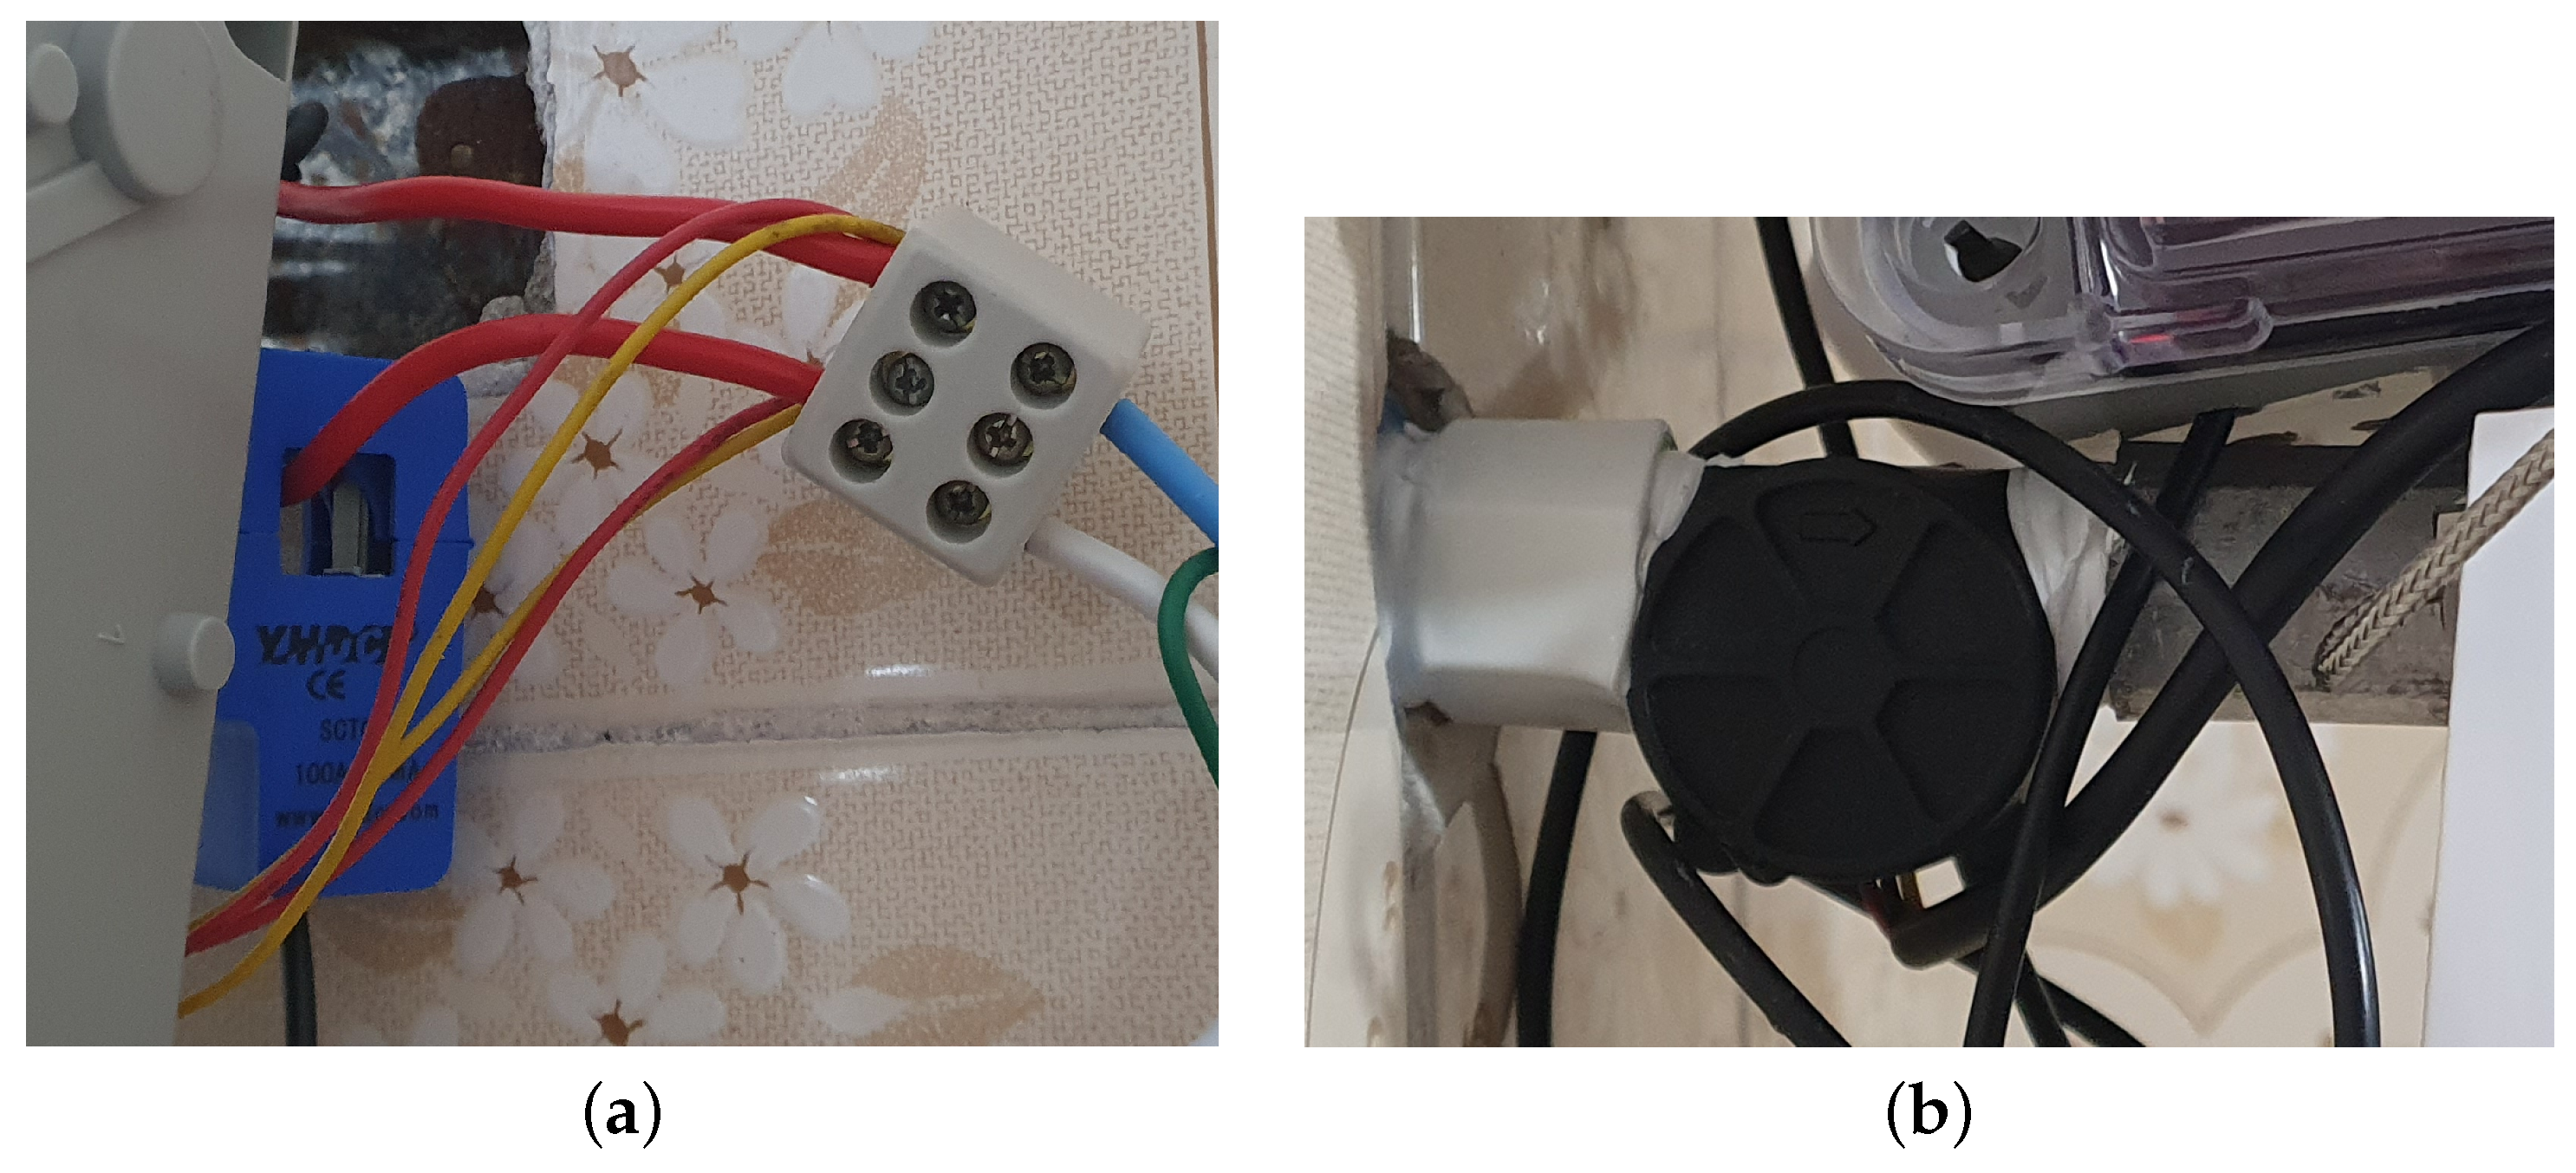
Figure 16a,b show the installation of the water flow and electrical current sensor.
3.2. Shower–IoT Application
Our application is composed of four main packages: activity, which stores the classes used to interact with the main screens; API-services, which contain the classes to interact with the API; data, which contain the classes to map the entities present in the database; and fragments, which are the classes used in the interaction with the main screen tabs. The application version is 1.0.
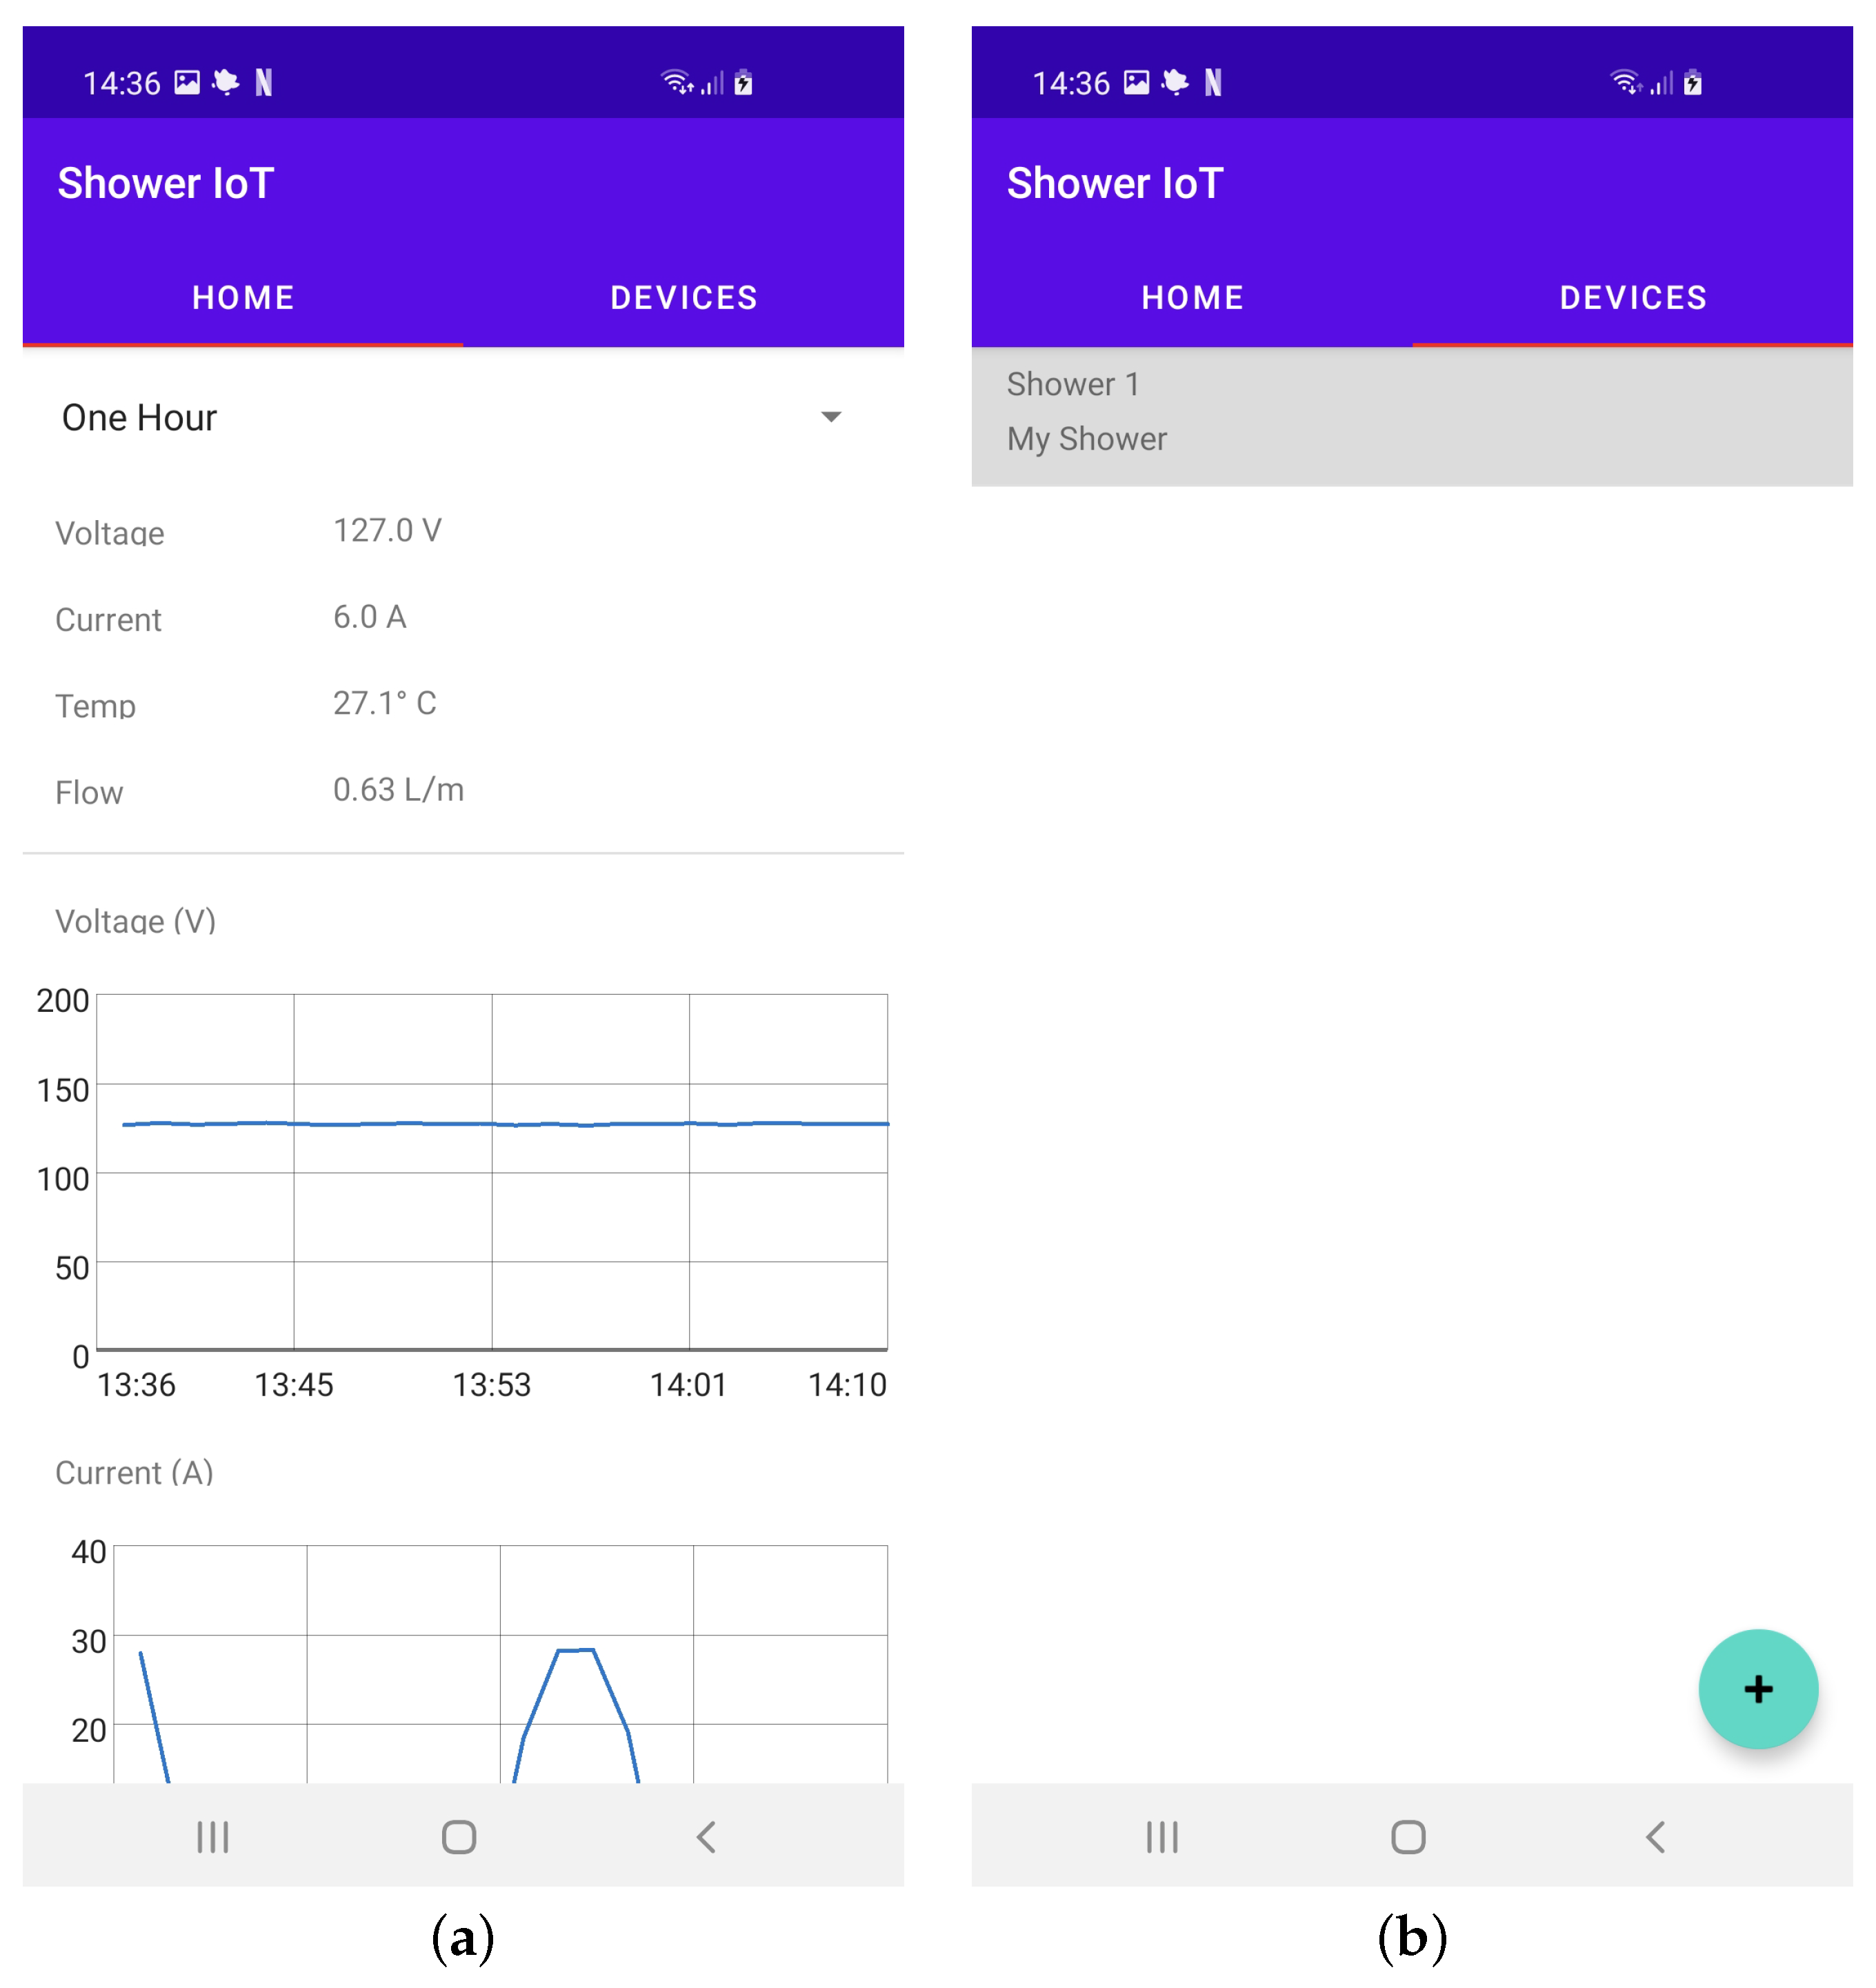
The main screen is composed of two tabs: the
Home tab (
Figure 17a), to view the summarized parameters of all devices present in the account, and the
Devices tab (
Figure 17b), showing the list with all devices registered to the user account and the icon for registering new devices. The
Home tab shows the average values at the top of the screen, followed by graphs of each parameter over time.
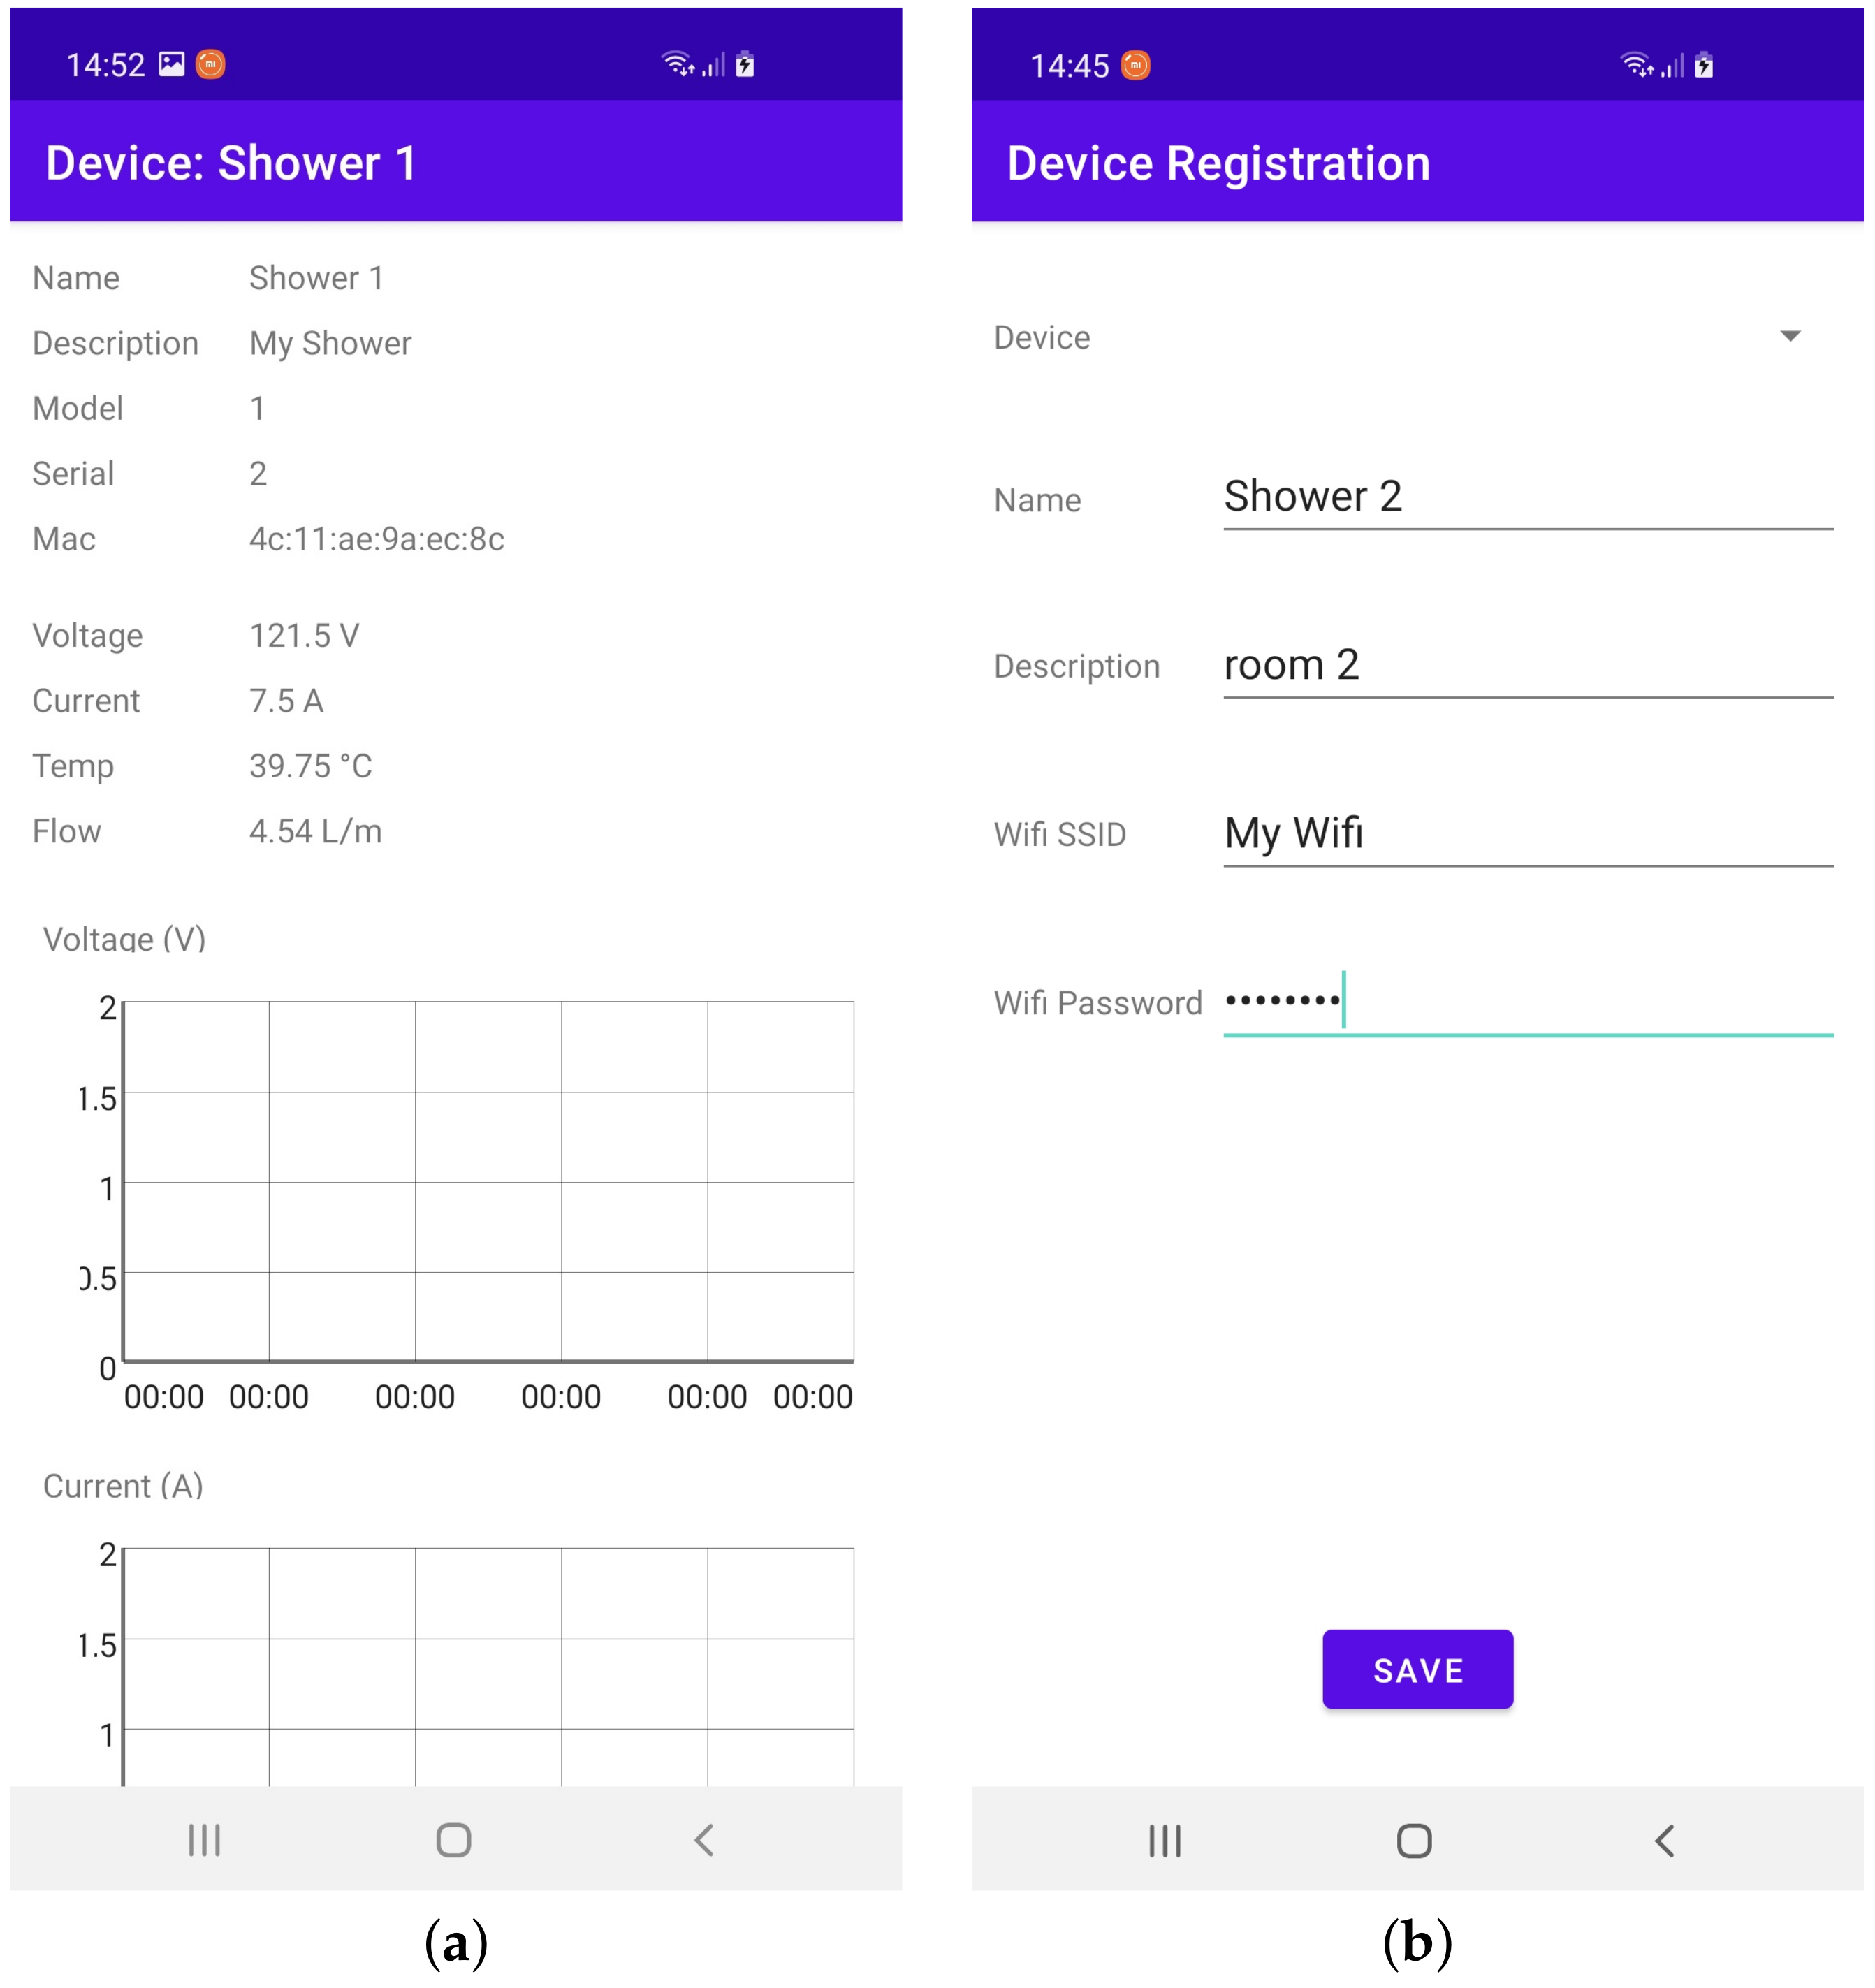
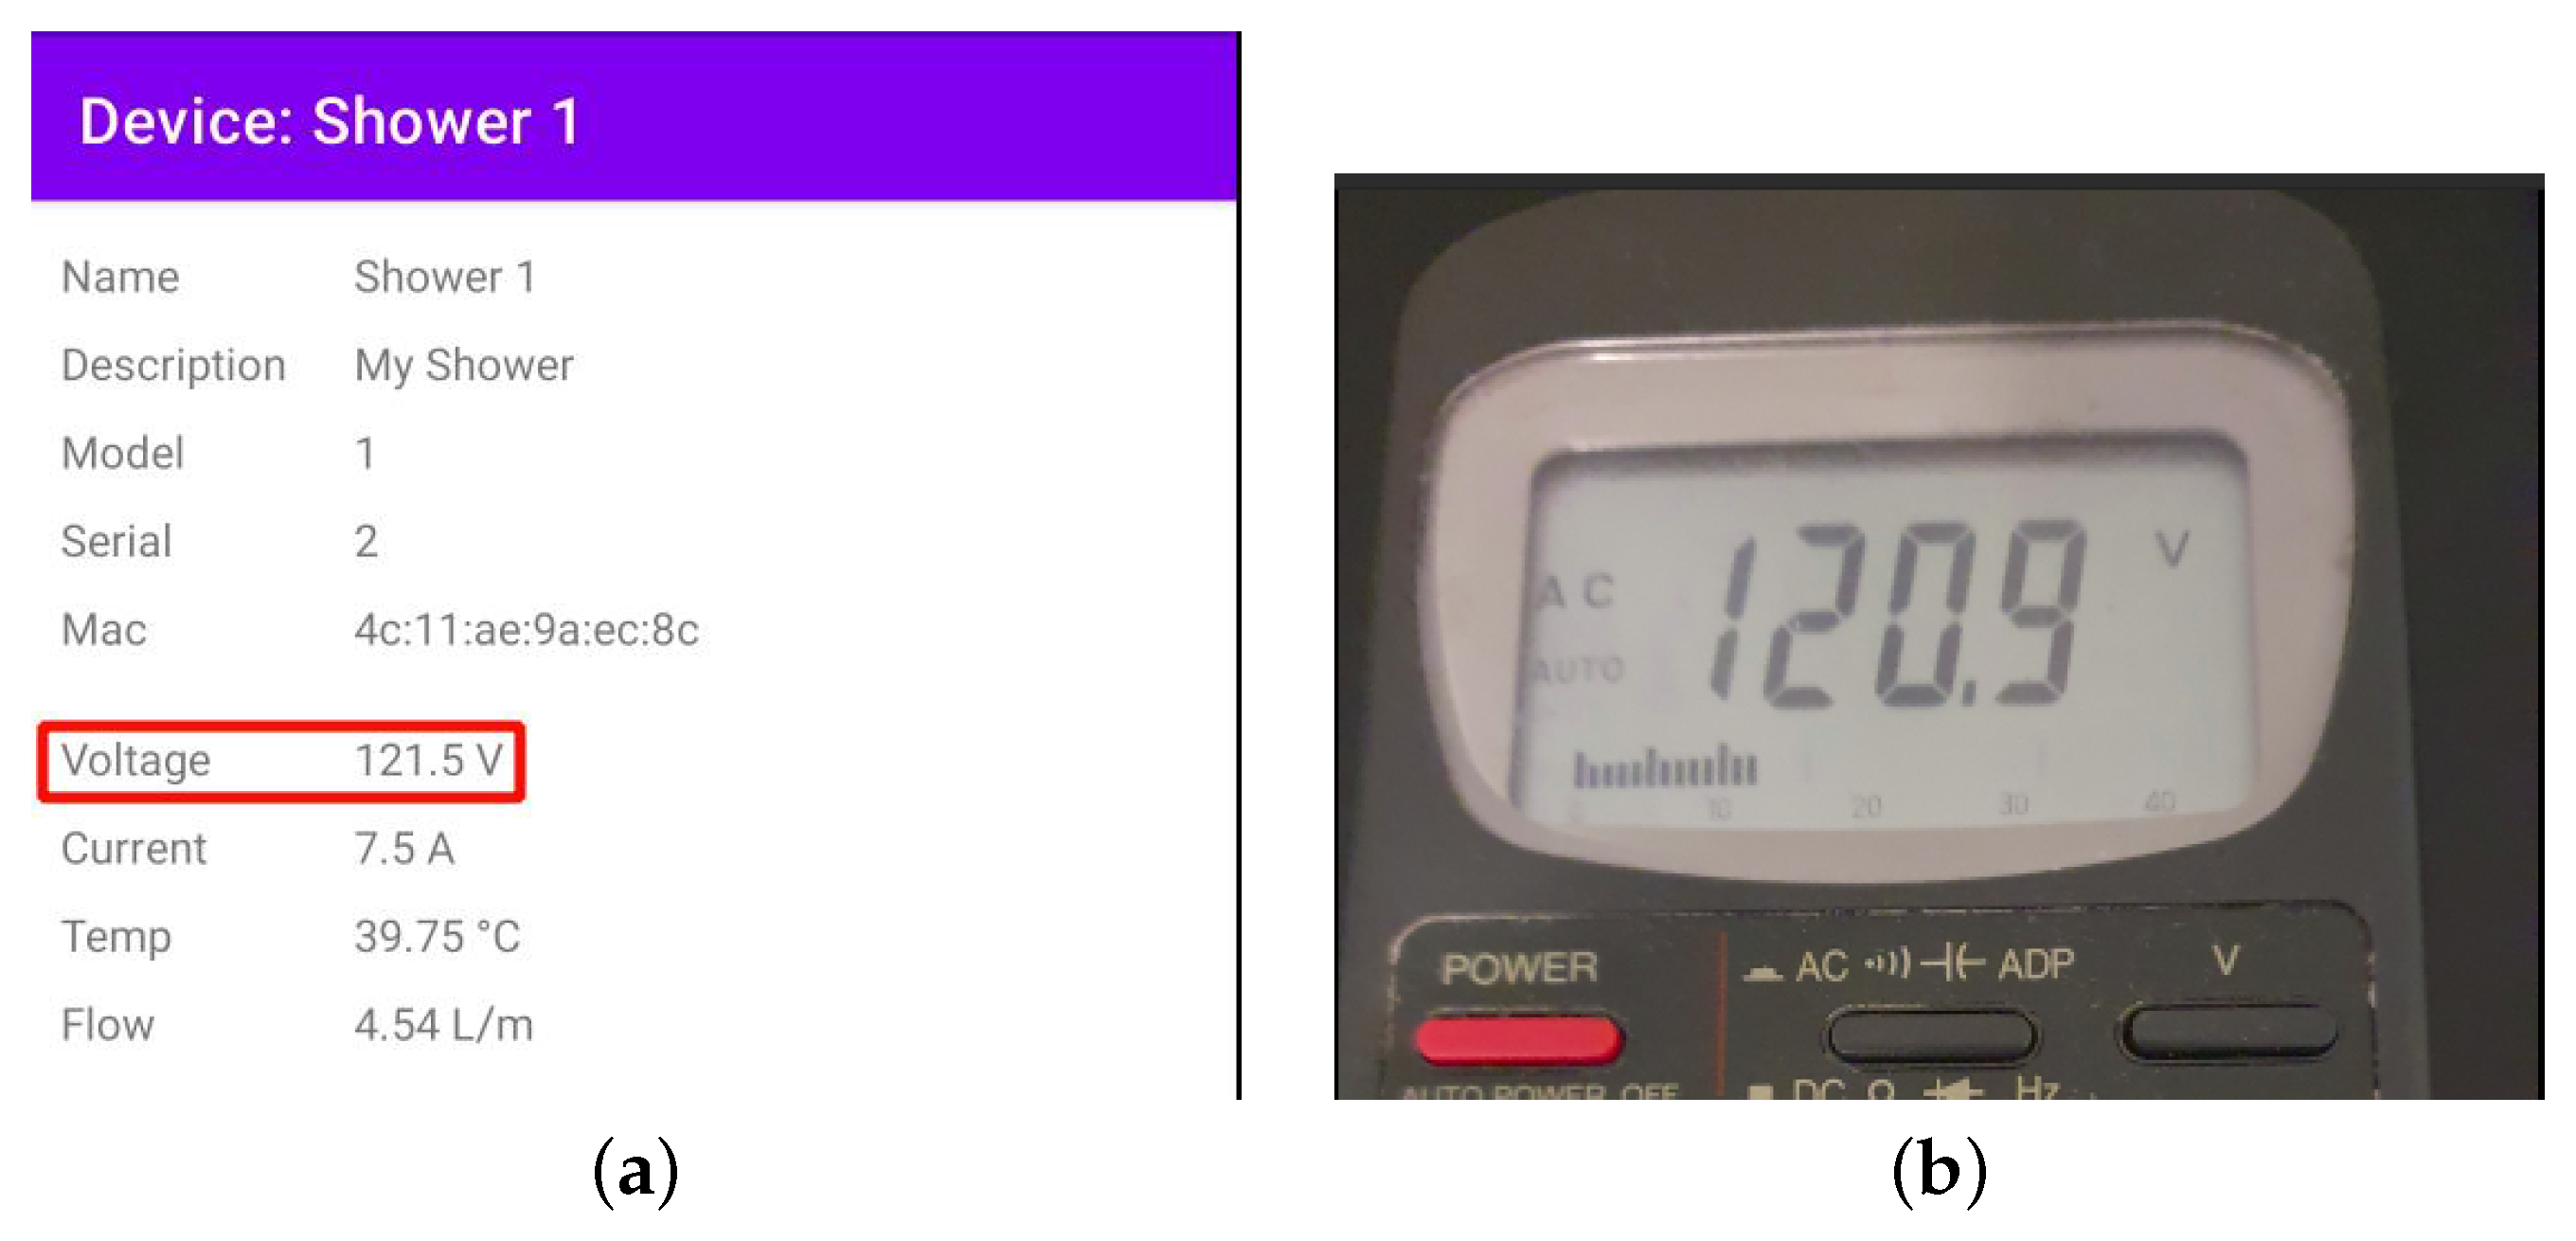
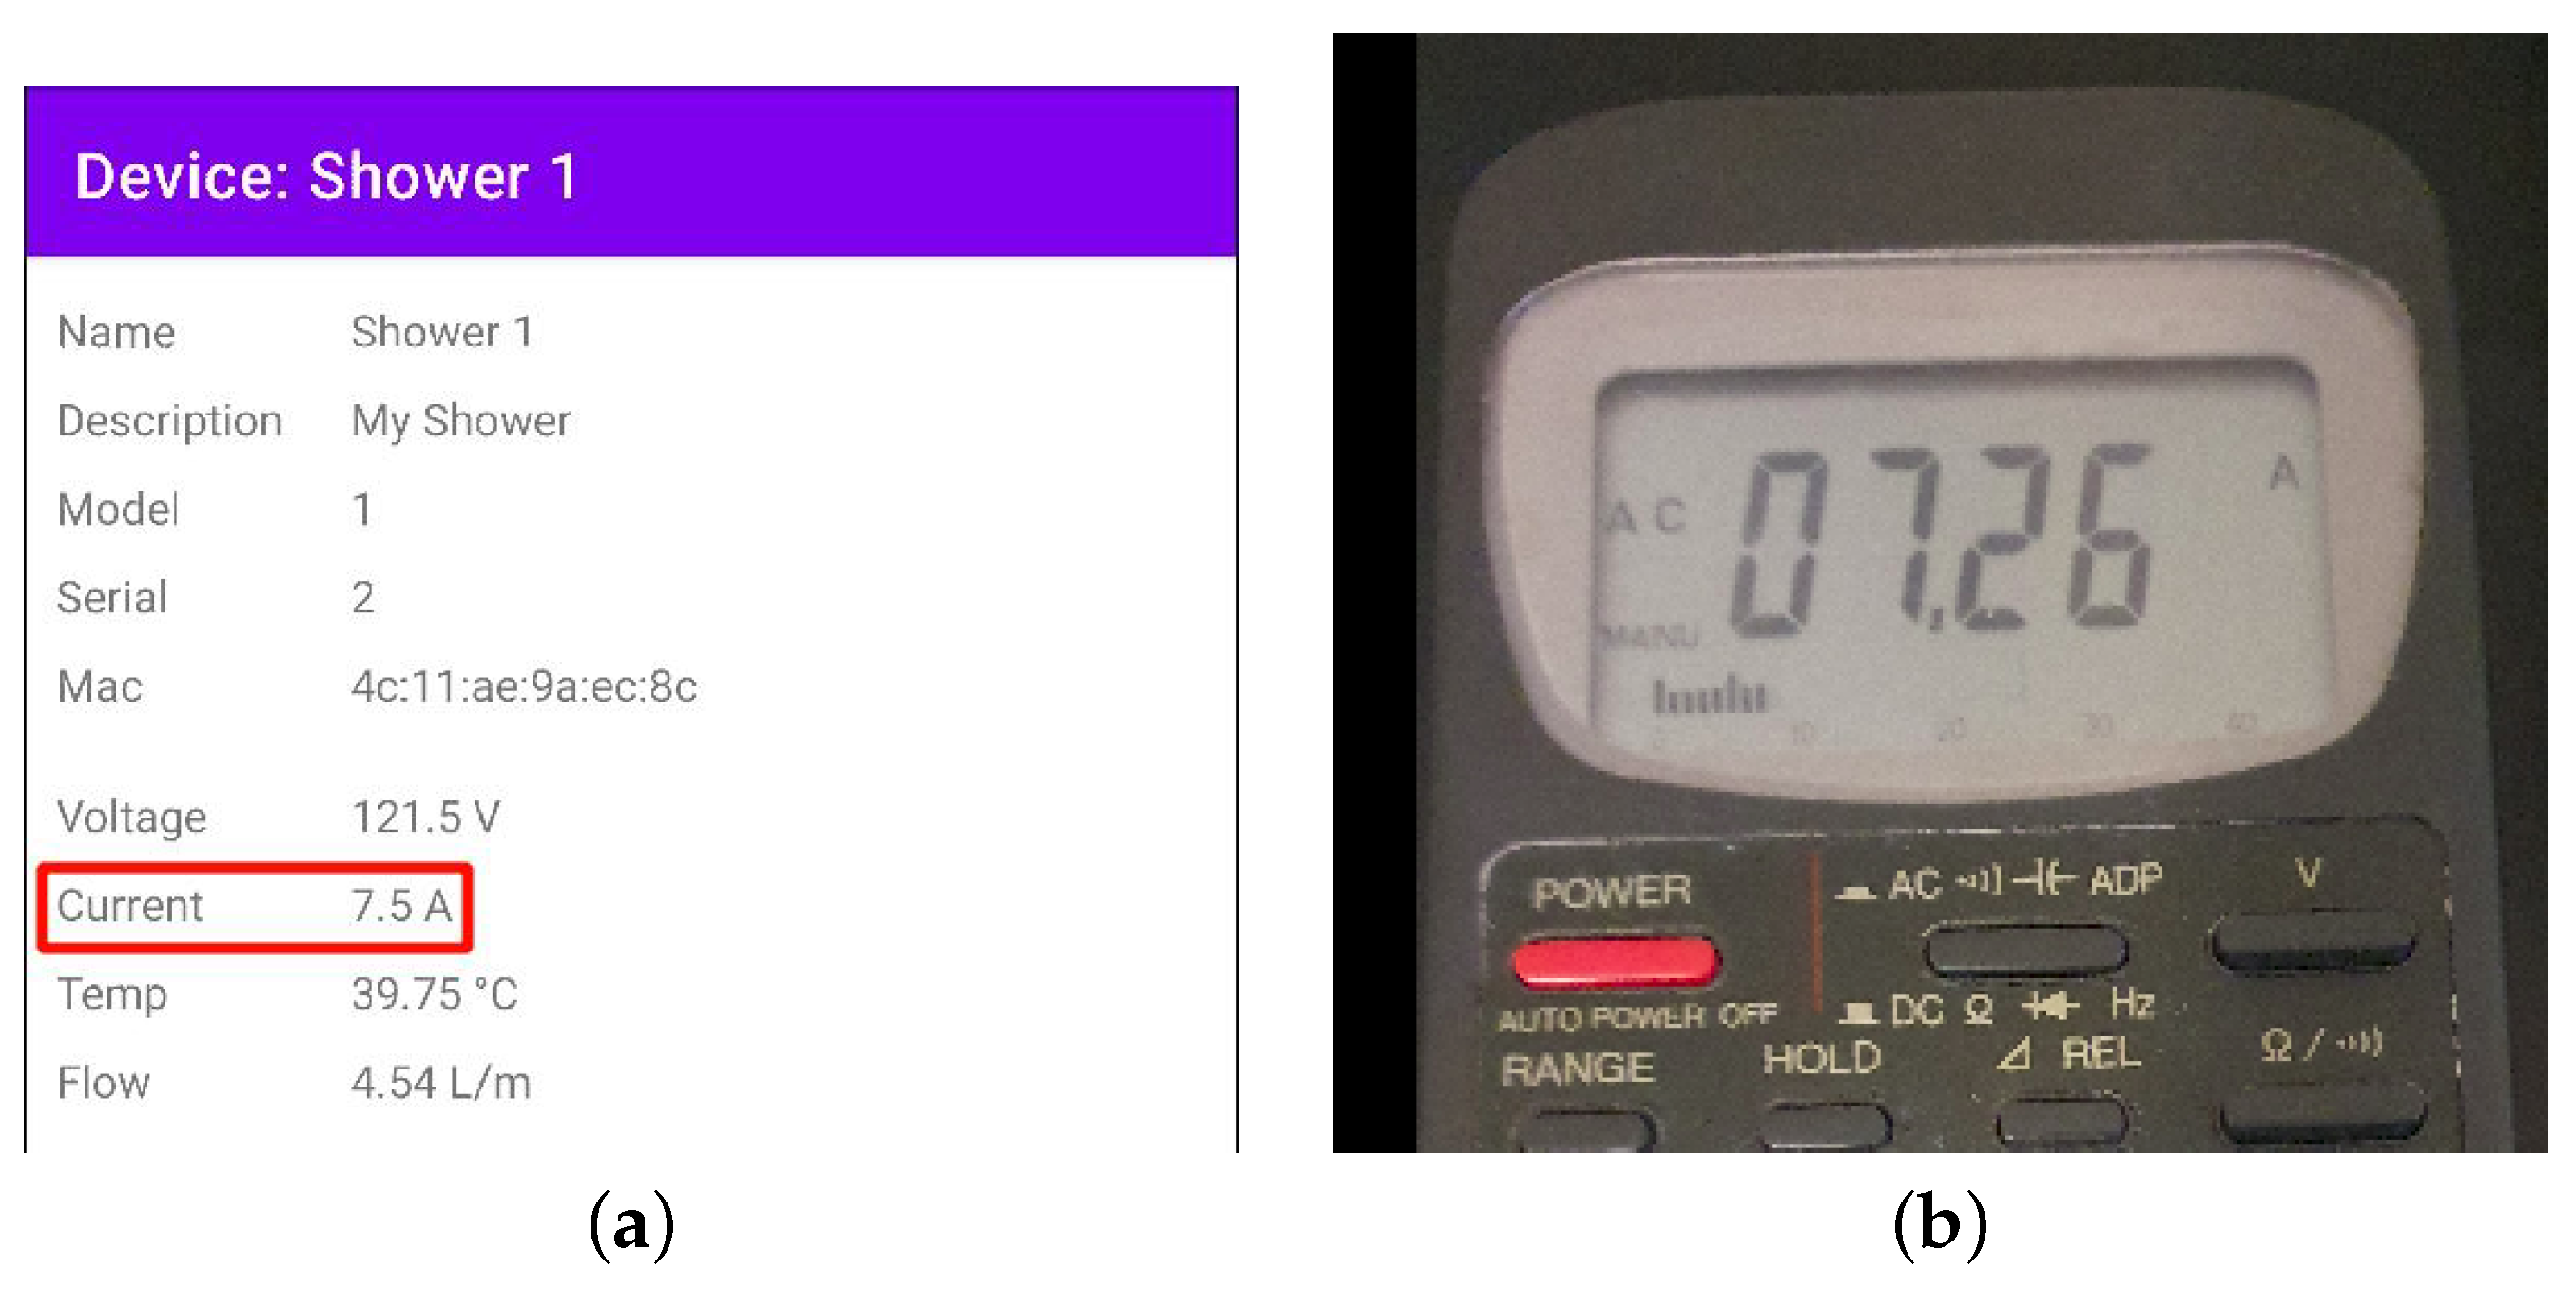
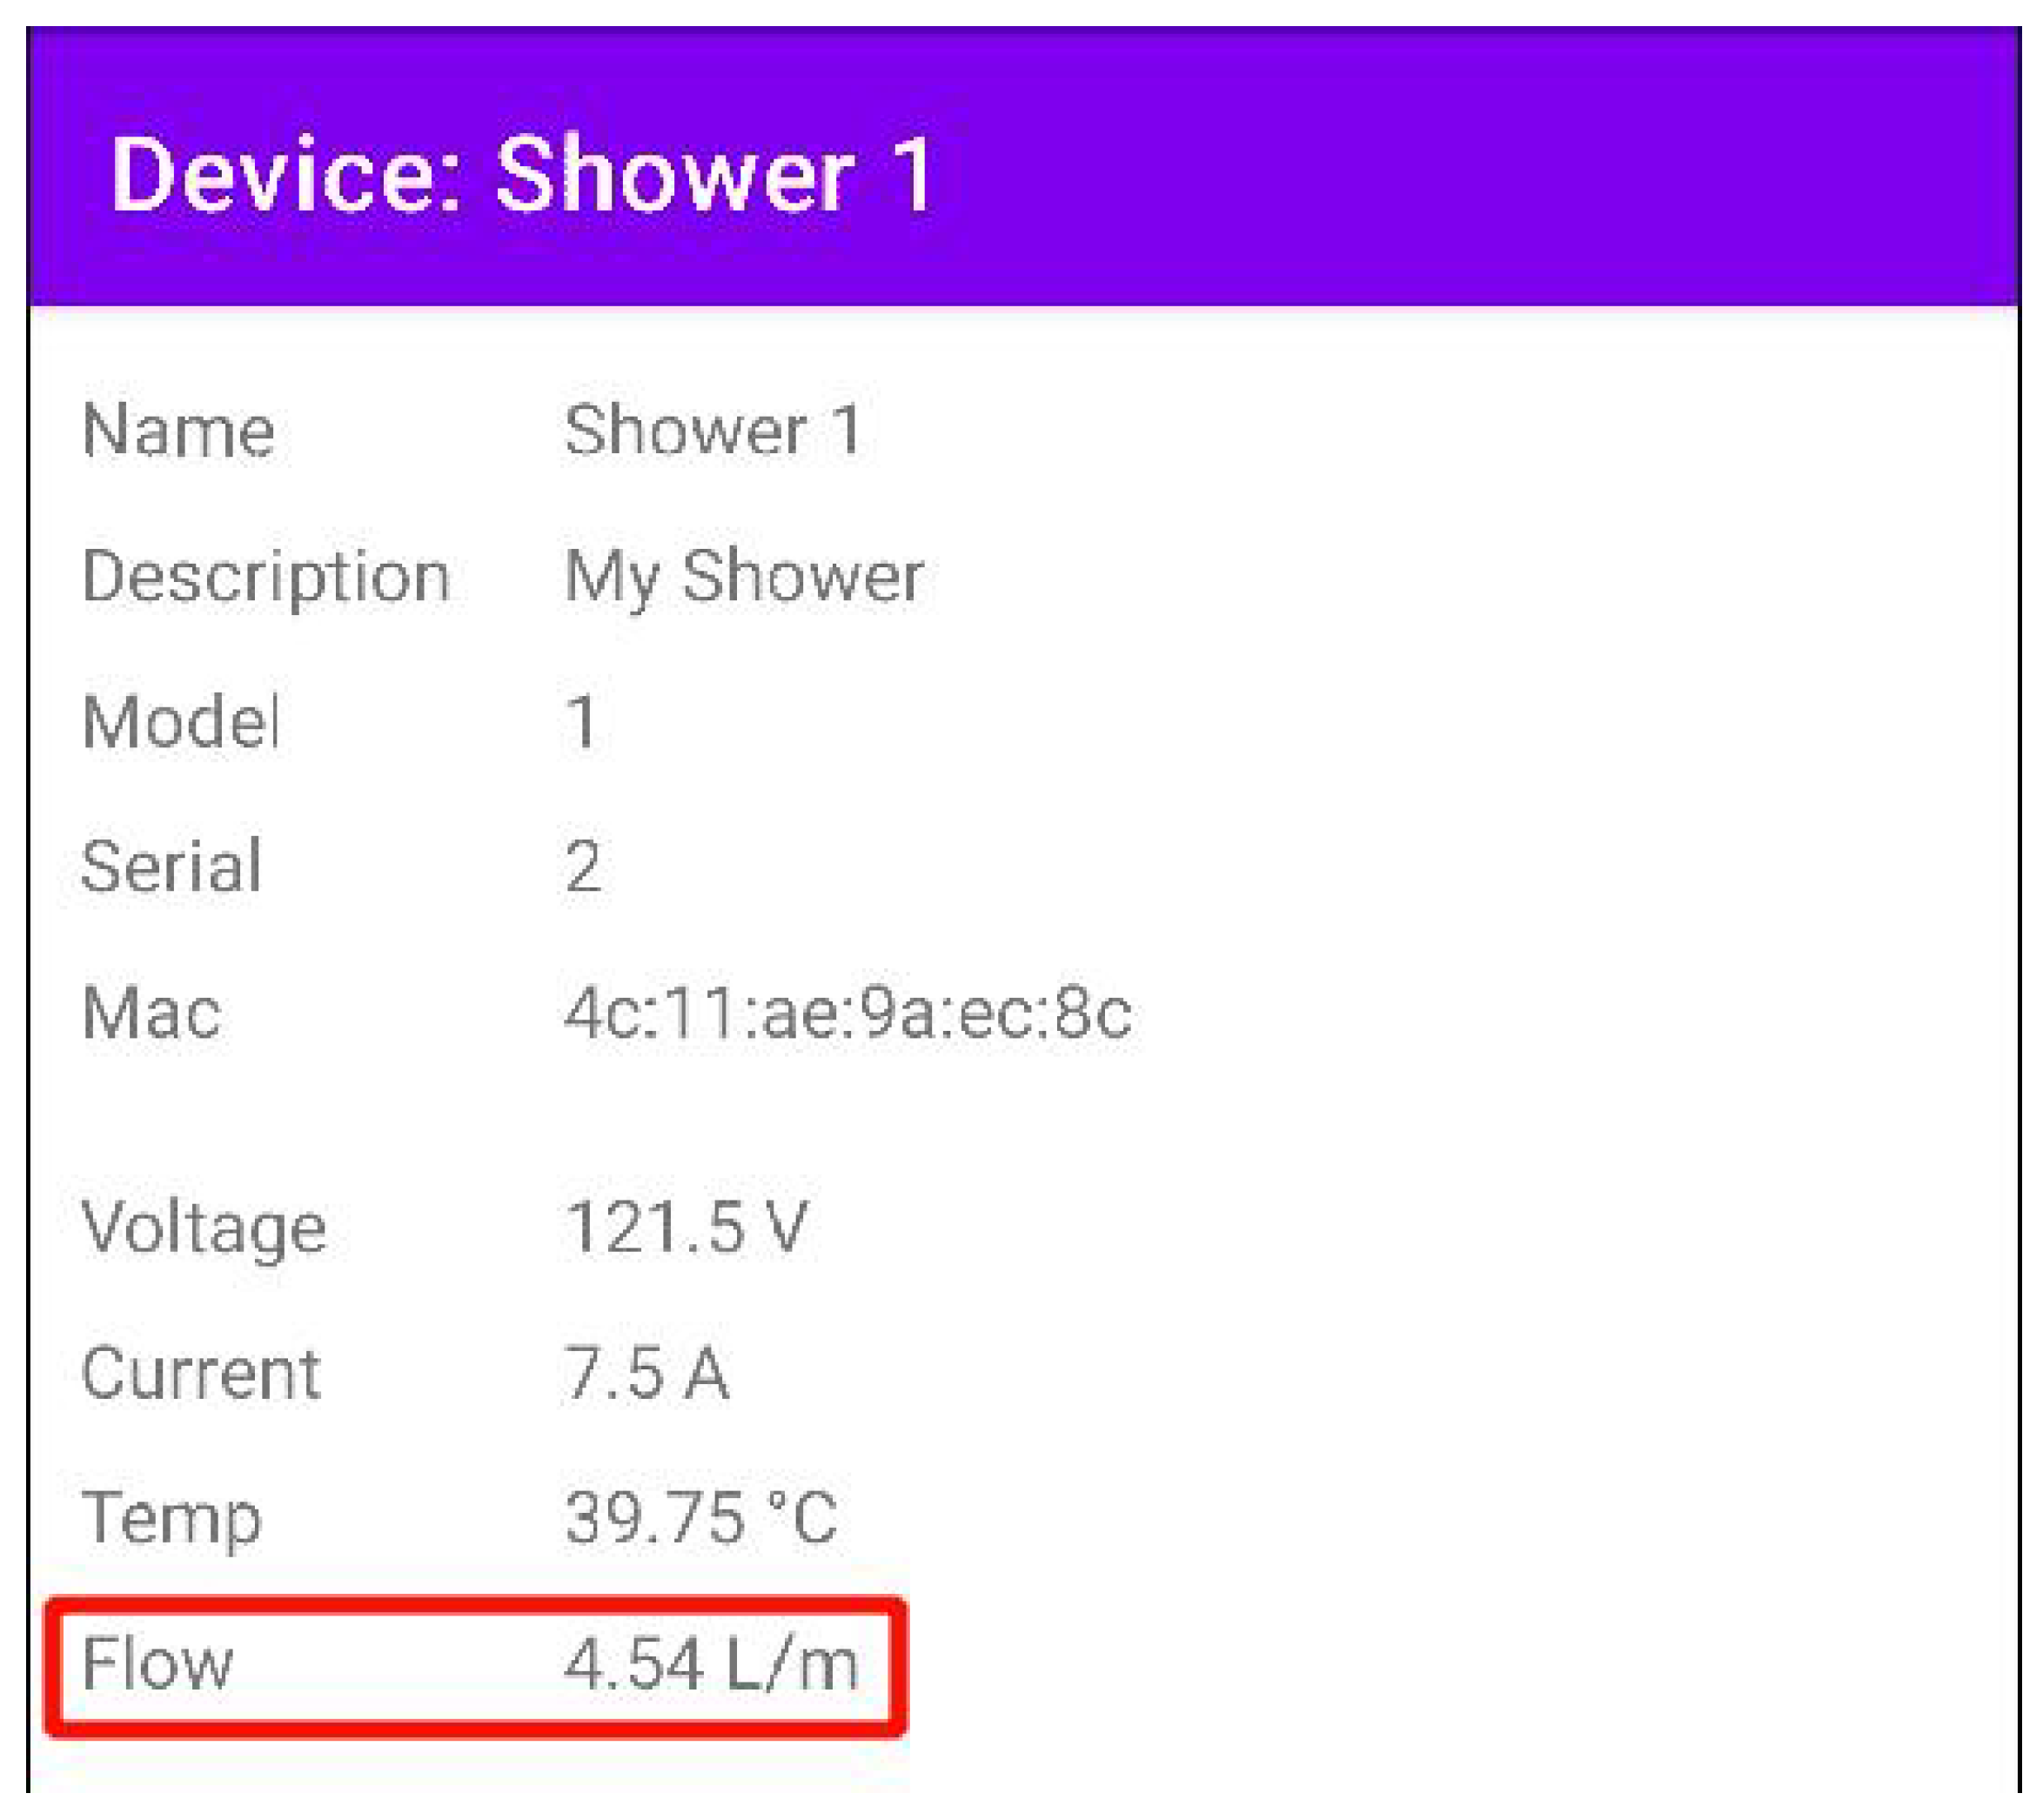
By using the list of devices shown in
Figure 17b, it is possible to access the details of a device (
Figure 18a) and its registration information, such as its real-time parameters. This screen has four graphs related to the data sent by the device.
To register new devices, the user must access the configuration screen (
Figure 18b), where he will select the device using the selector at the top of the screen and enter the name and description of the device, as well as the Wi-Fi network name and password.
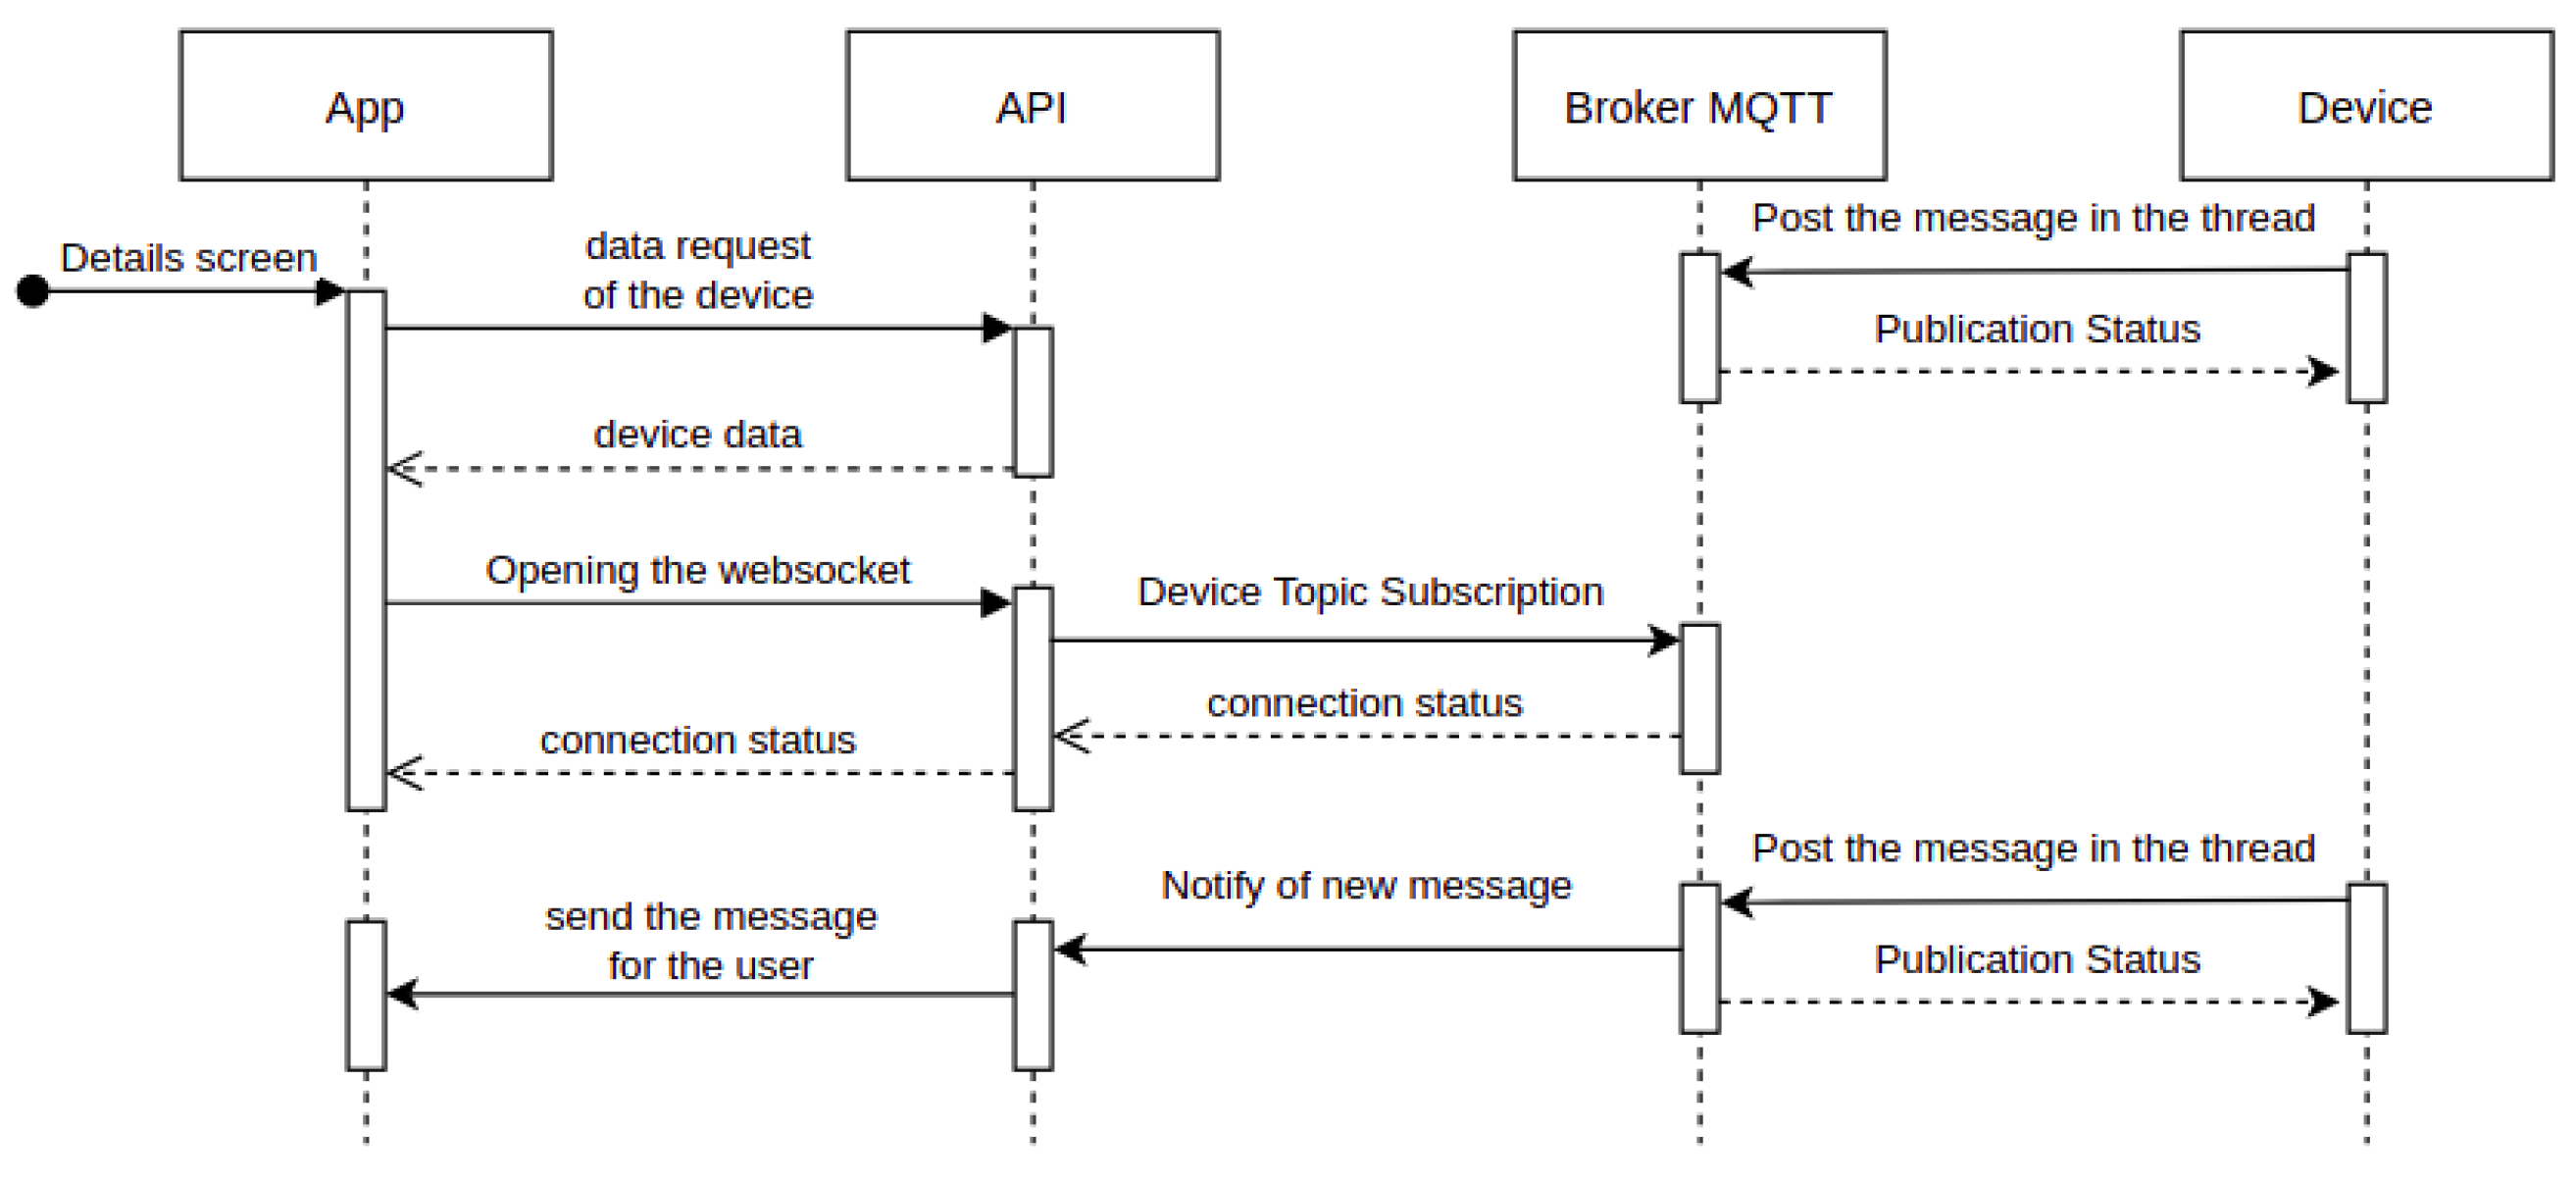
For our application, to obtain the messages generated by the device, we used a WebSocket connection. We chose this connection because it allows two-way communication between the server and the app, which allows the server to send messages from the device without requiring the app to make a request. Therefore, when the server receives a new message, it immediately sends it to the user. When the WebSocket establishes a connection, the API performs the subscription to the MQTT topic of the device. Thus, when the device publishes a new message, the API server receives a copy of this message, sending it to the application over the WebSocket connection.
Figure 19 shows the sequence diagram of this process.
The REST API is the component responsible for handling the user’s HTTP requests and registering new devices. We used the Ruby-On-Rails framework for its implementation, which is based on the Ruby language and the MVC (model-view-controller) project pattern and used to develop web applications and APIs.
We used classes called Controllers to process the requests, which are responsible for validating the requests, accessing the Models to interact with the database, and, finally, generating the requests’ responses. We developed the following Controllers to meet the needs of this project:
Api::V1::DeviceRegisterController: This class resolves requests referring to the registration of a new device to the user’s account.
Api::V1::DevicesController: This Controller is responsible for requests related to obtaining device information, such as the user device list and the details of a specific device.
Api::V1::RegistrationsController: This class is responsible for requests related to the registration of a new user, in which the user must provide an e-mail, password, password confirmation, and first and last name.
Api::V1::SessionsController: This class performs the requests in the user login and logout process in the Android application.
Api::V1::SummaryInfosController: This Controller executes the requests referring to obtaining the data used in the application’s graphics.
Api::V1::UsersController: This Controller is responsible for requests for obtaining and changing user information.
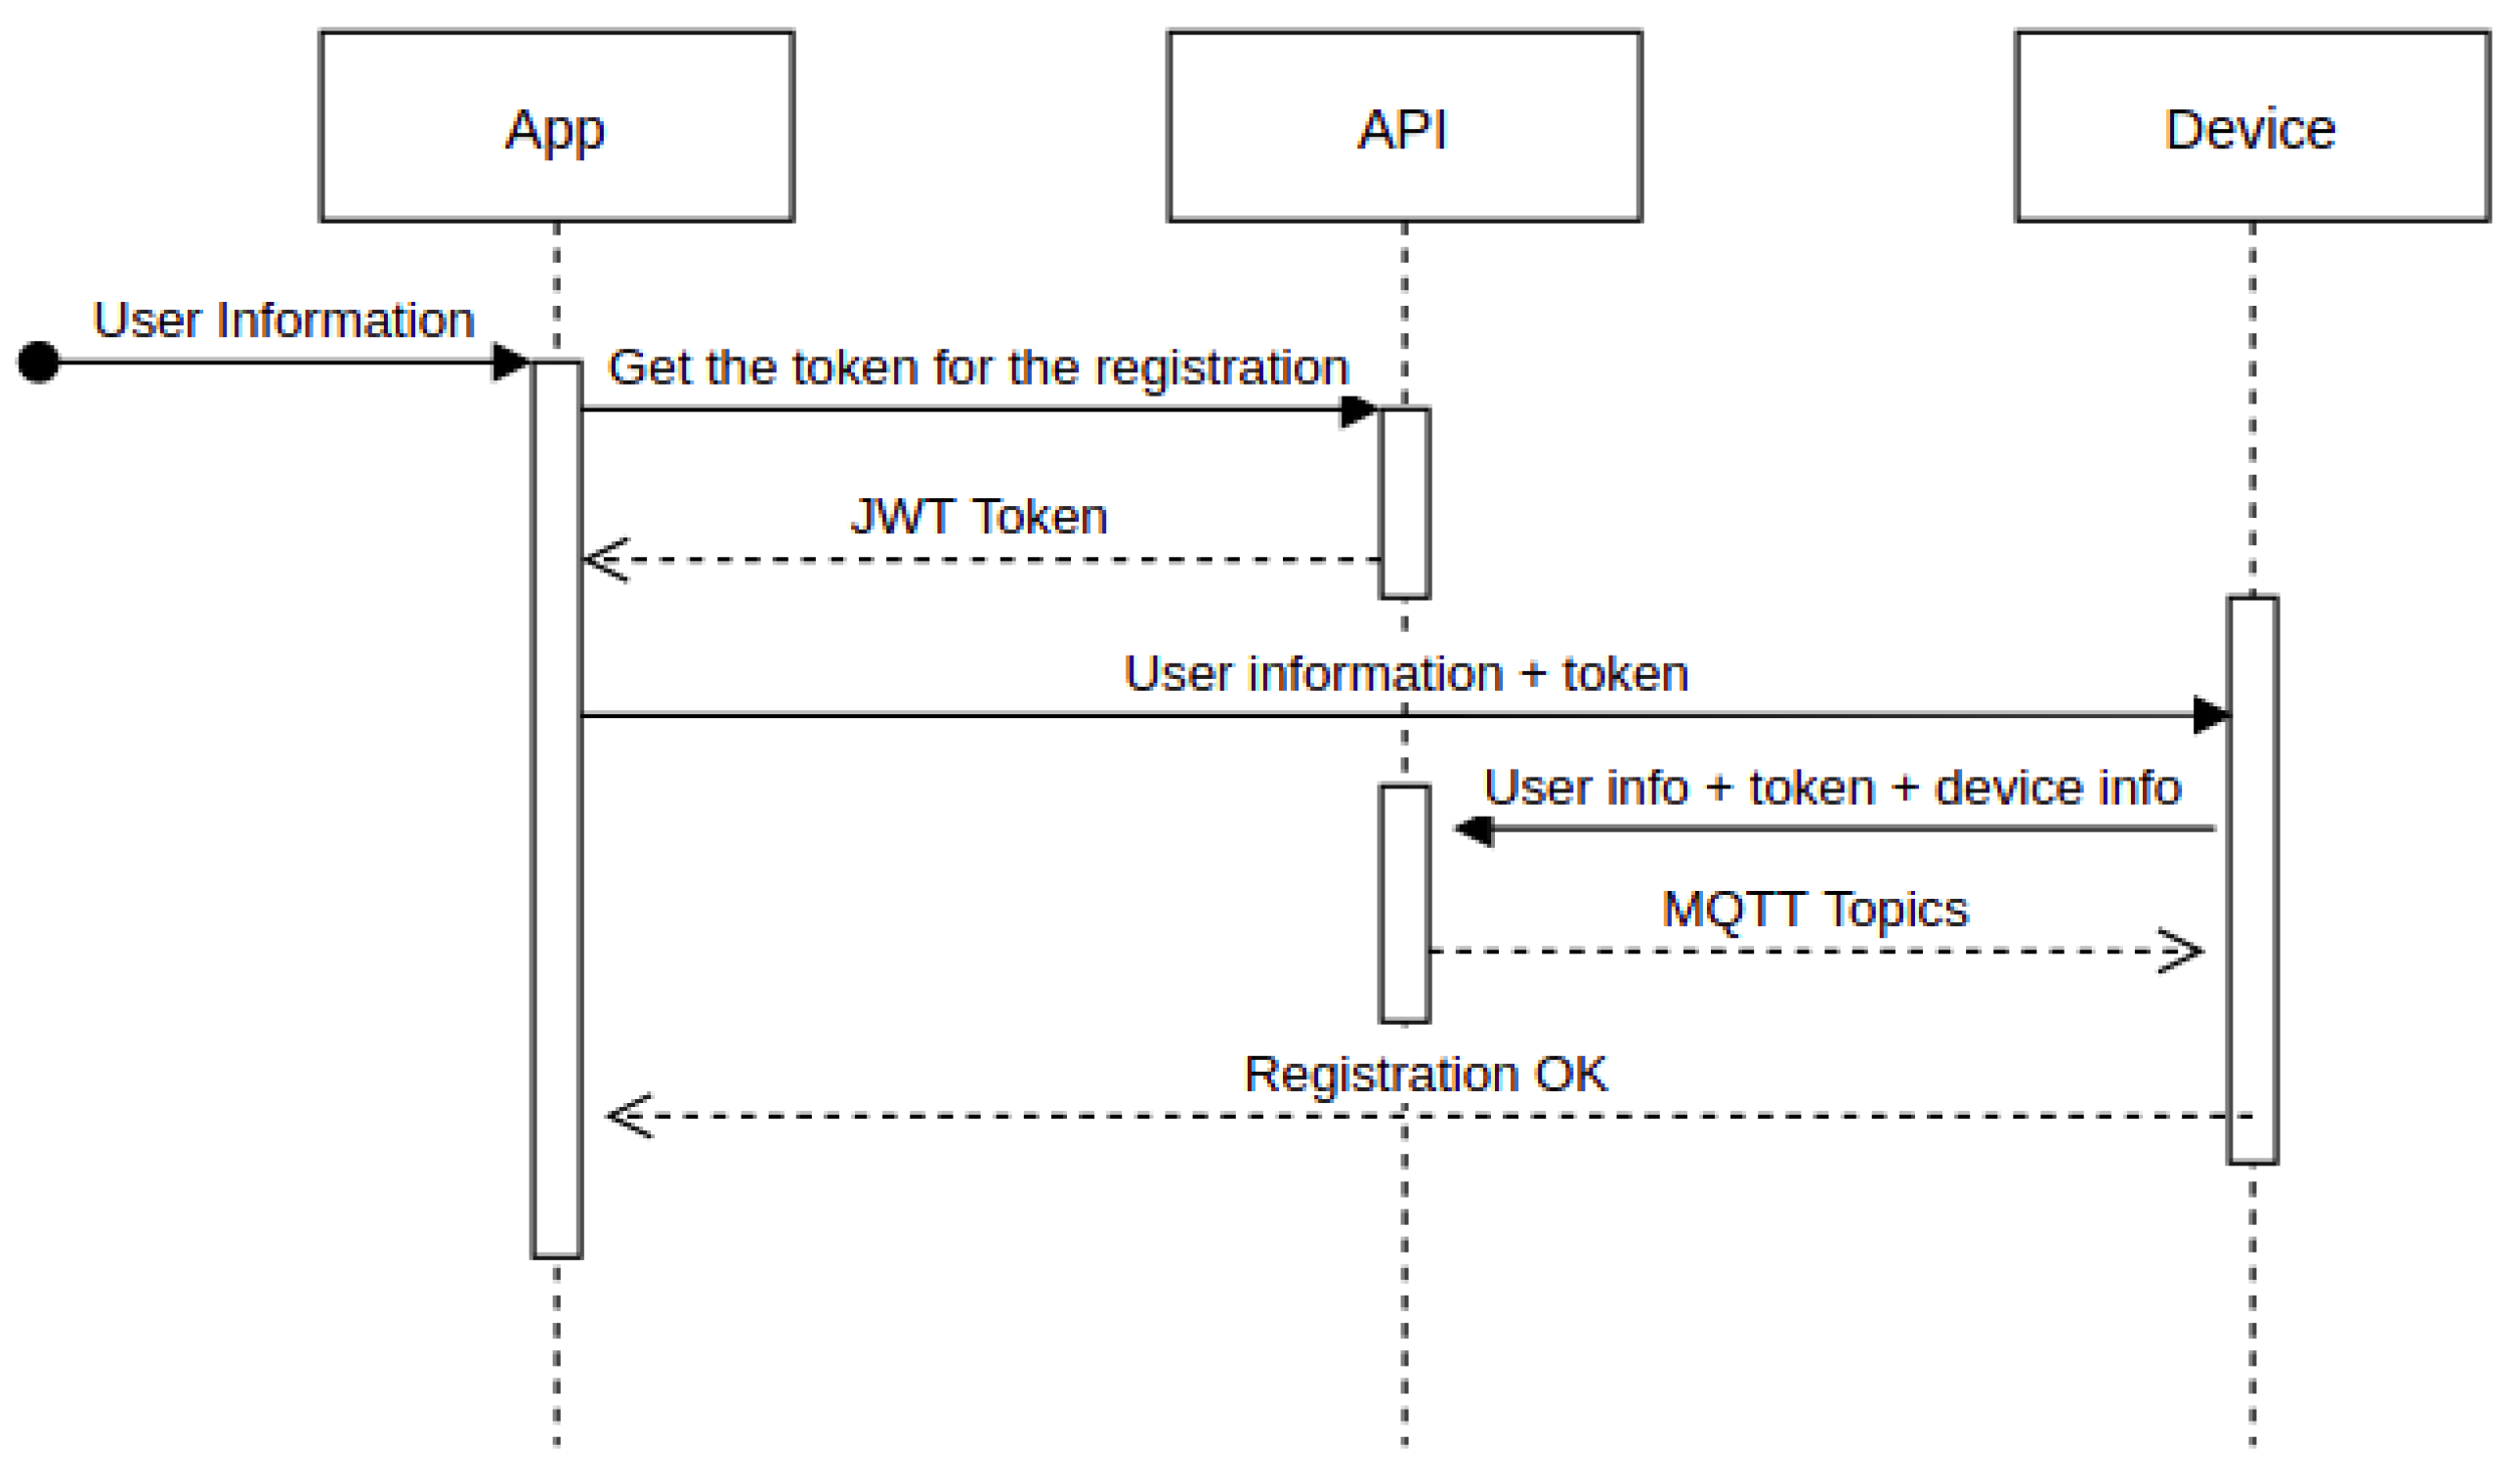
To start using a new device, users must register it in their account. To do so, the user selects the device from the list of available Bluetooth devices and provides the Wi-Fi network name, password, device name, and a description. The application then makes an API request to obtain a registration token, which is sent to the device via Bluetooth along with the user-provided information. The device connects to the Wi-Fi network and sends a registration request to the API, including the token and device information for validation. In response, the API returns the MQTT topics to which the device should connect.
Figure 20 shows this process.
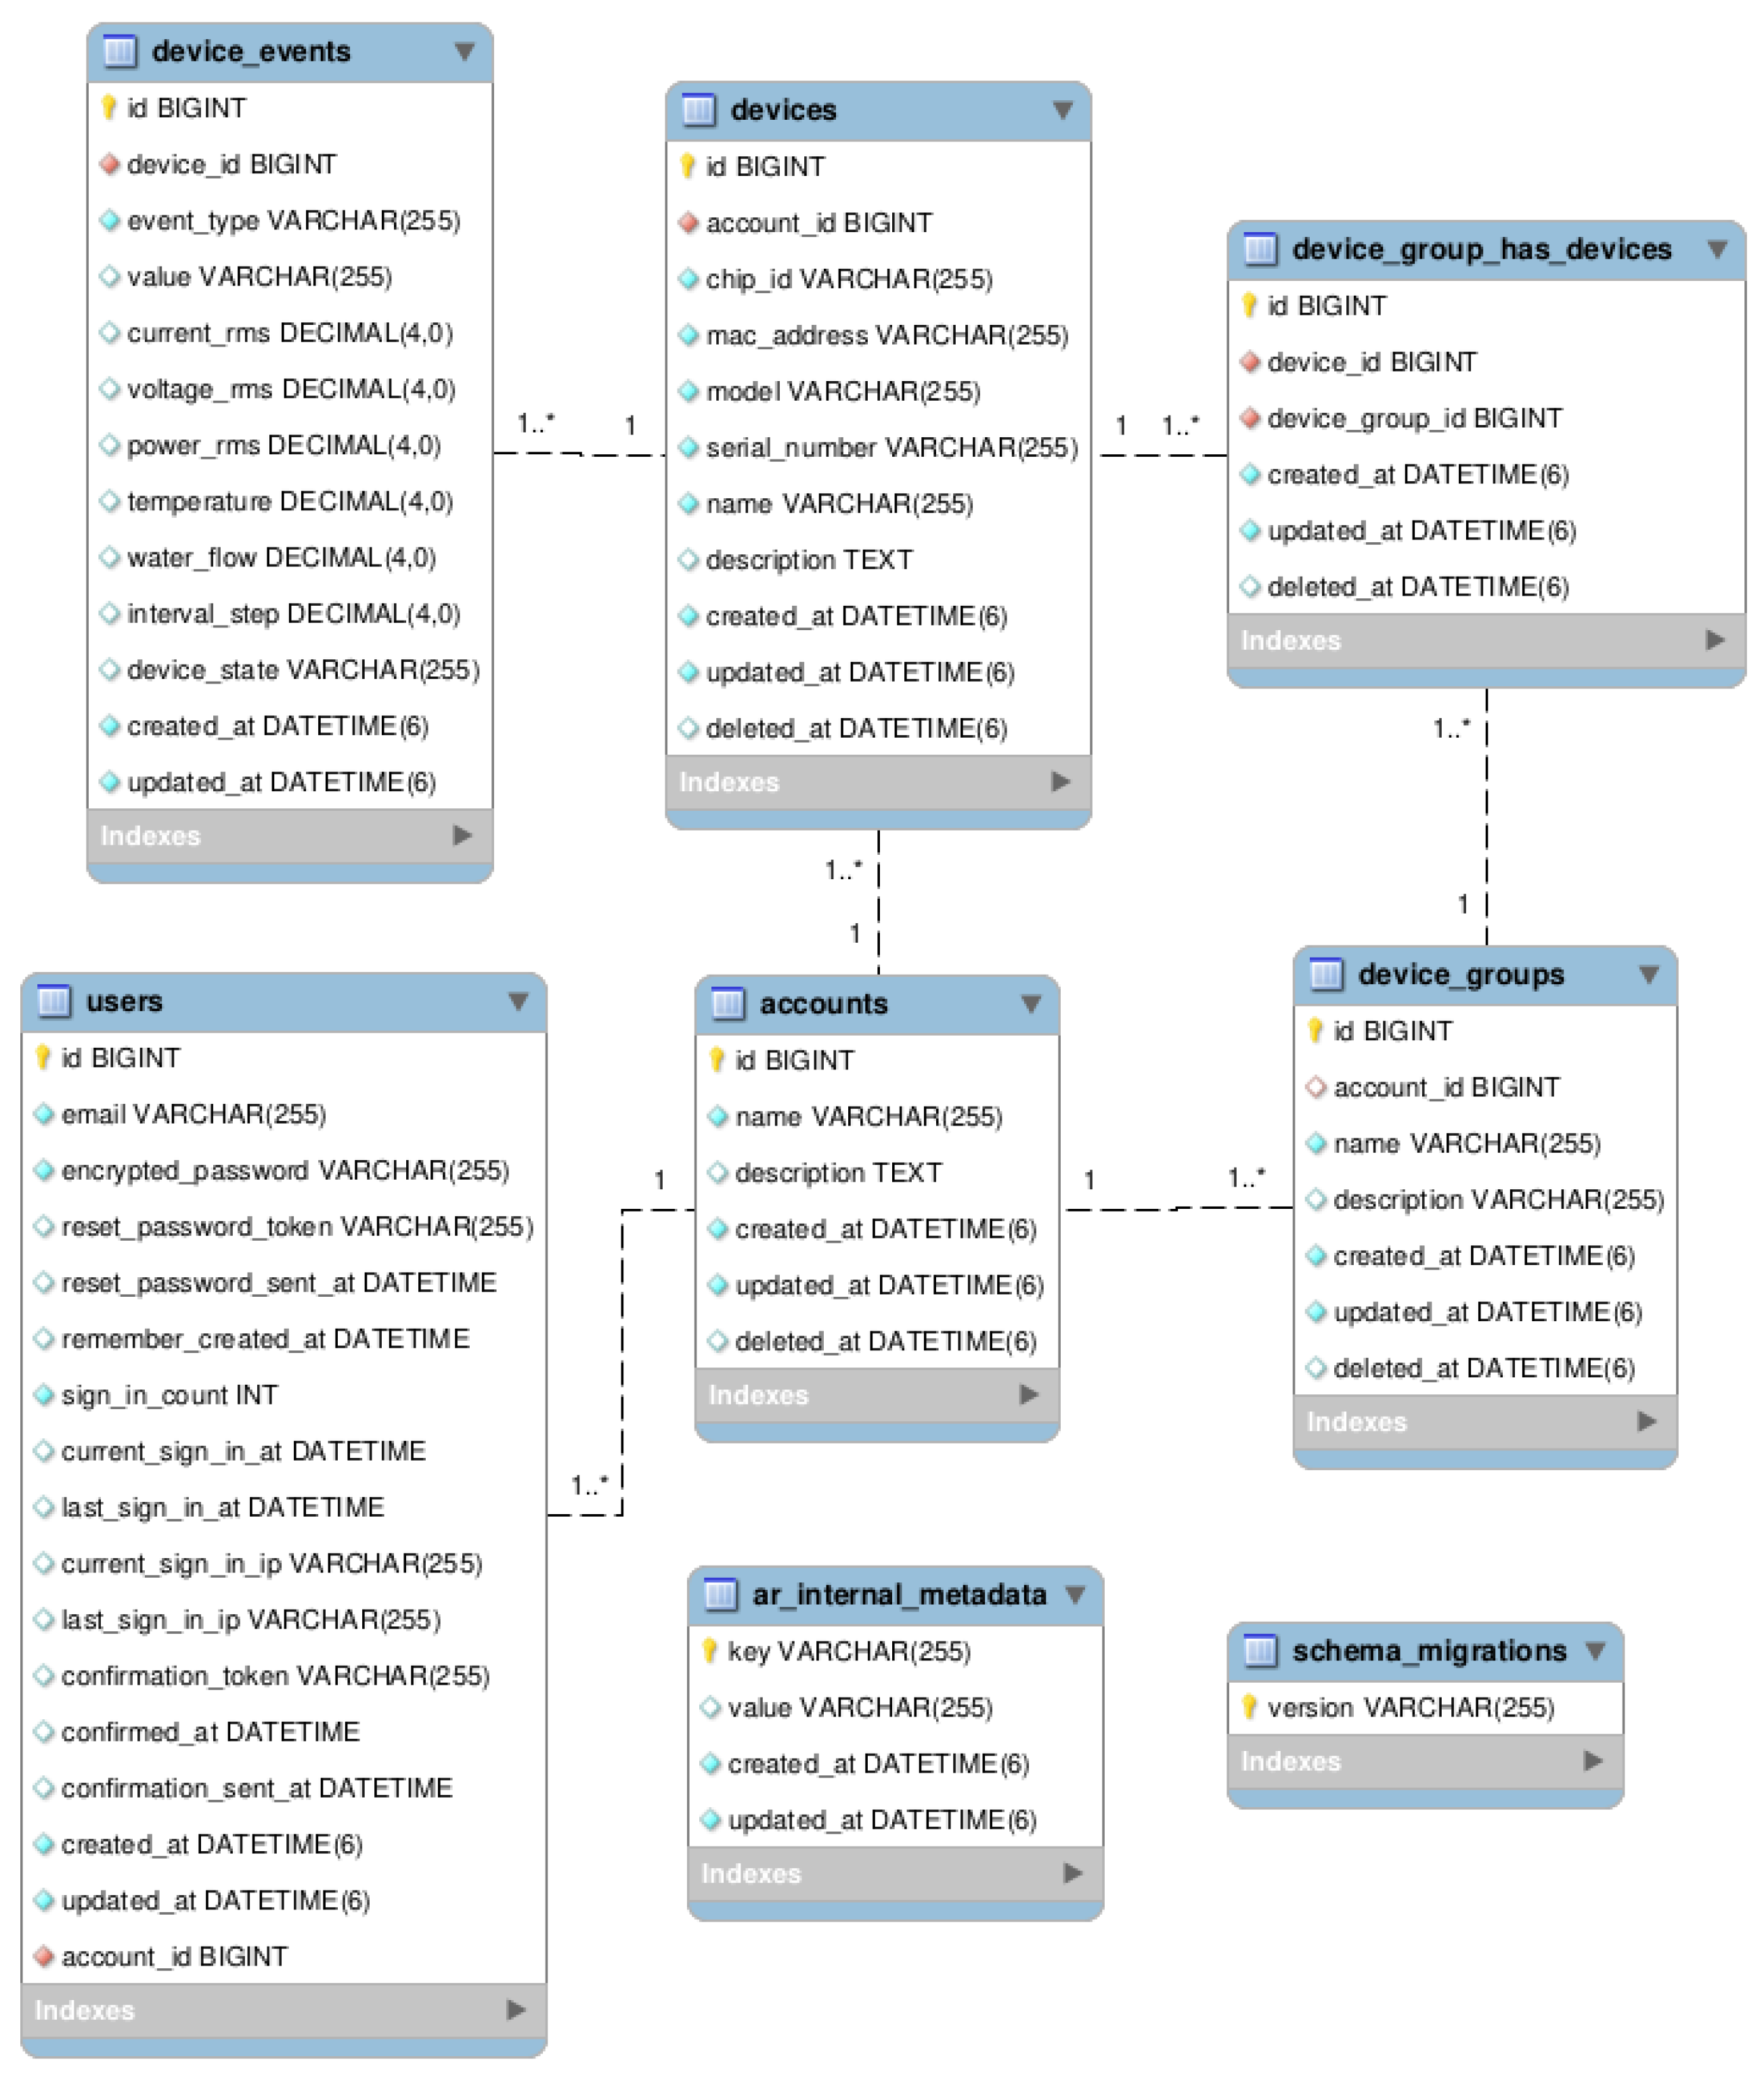
We used the MySQL relational database to store events generated on devices and data related to users and devices.
Figure 21 shows the entity relationship diagram developed for this project.
In the accounts’ table, the system’s clients are registered. It may have several associated users (users), devices (devices) and device groups (device_groups). Device events are stored in the device_events table, and the schema_migrations and ar_internal_metadata tables are used by the Ruby-On-Rails framework to control scripts database migration process.


 ,
, 
