
Utilizing an Internet of Things (IoT) Device, Intelligent Control Design, and Simulation for an Agricultural System


Abstract
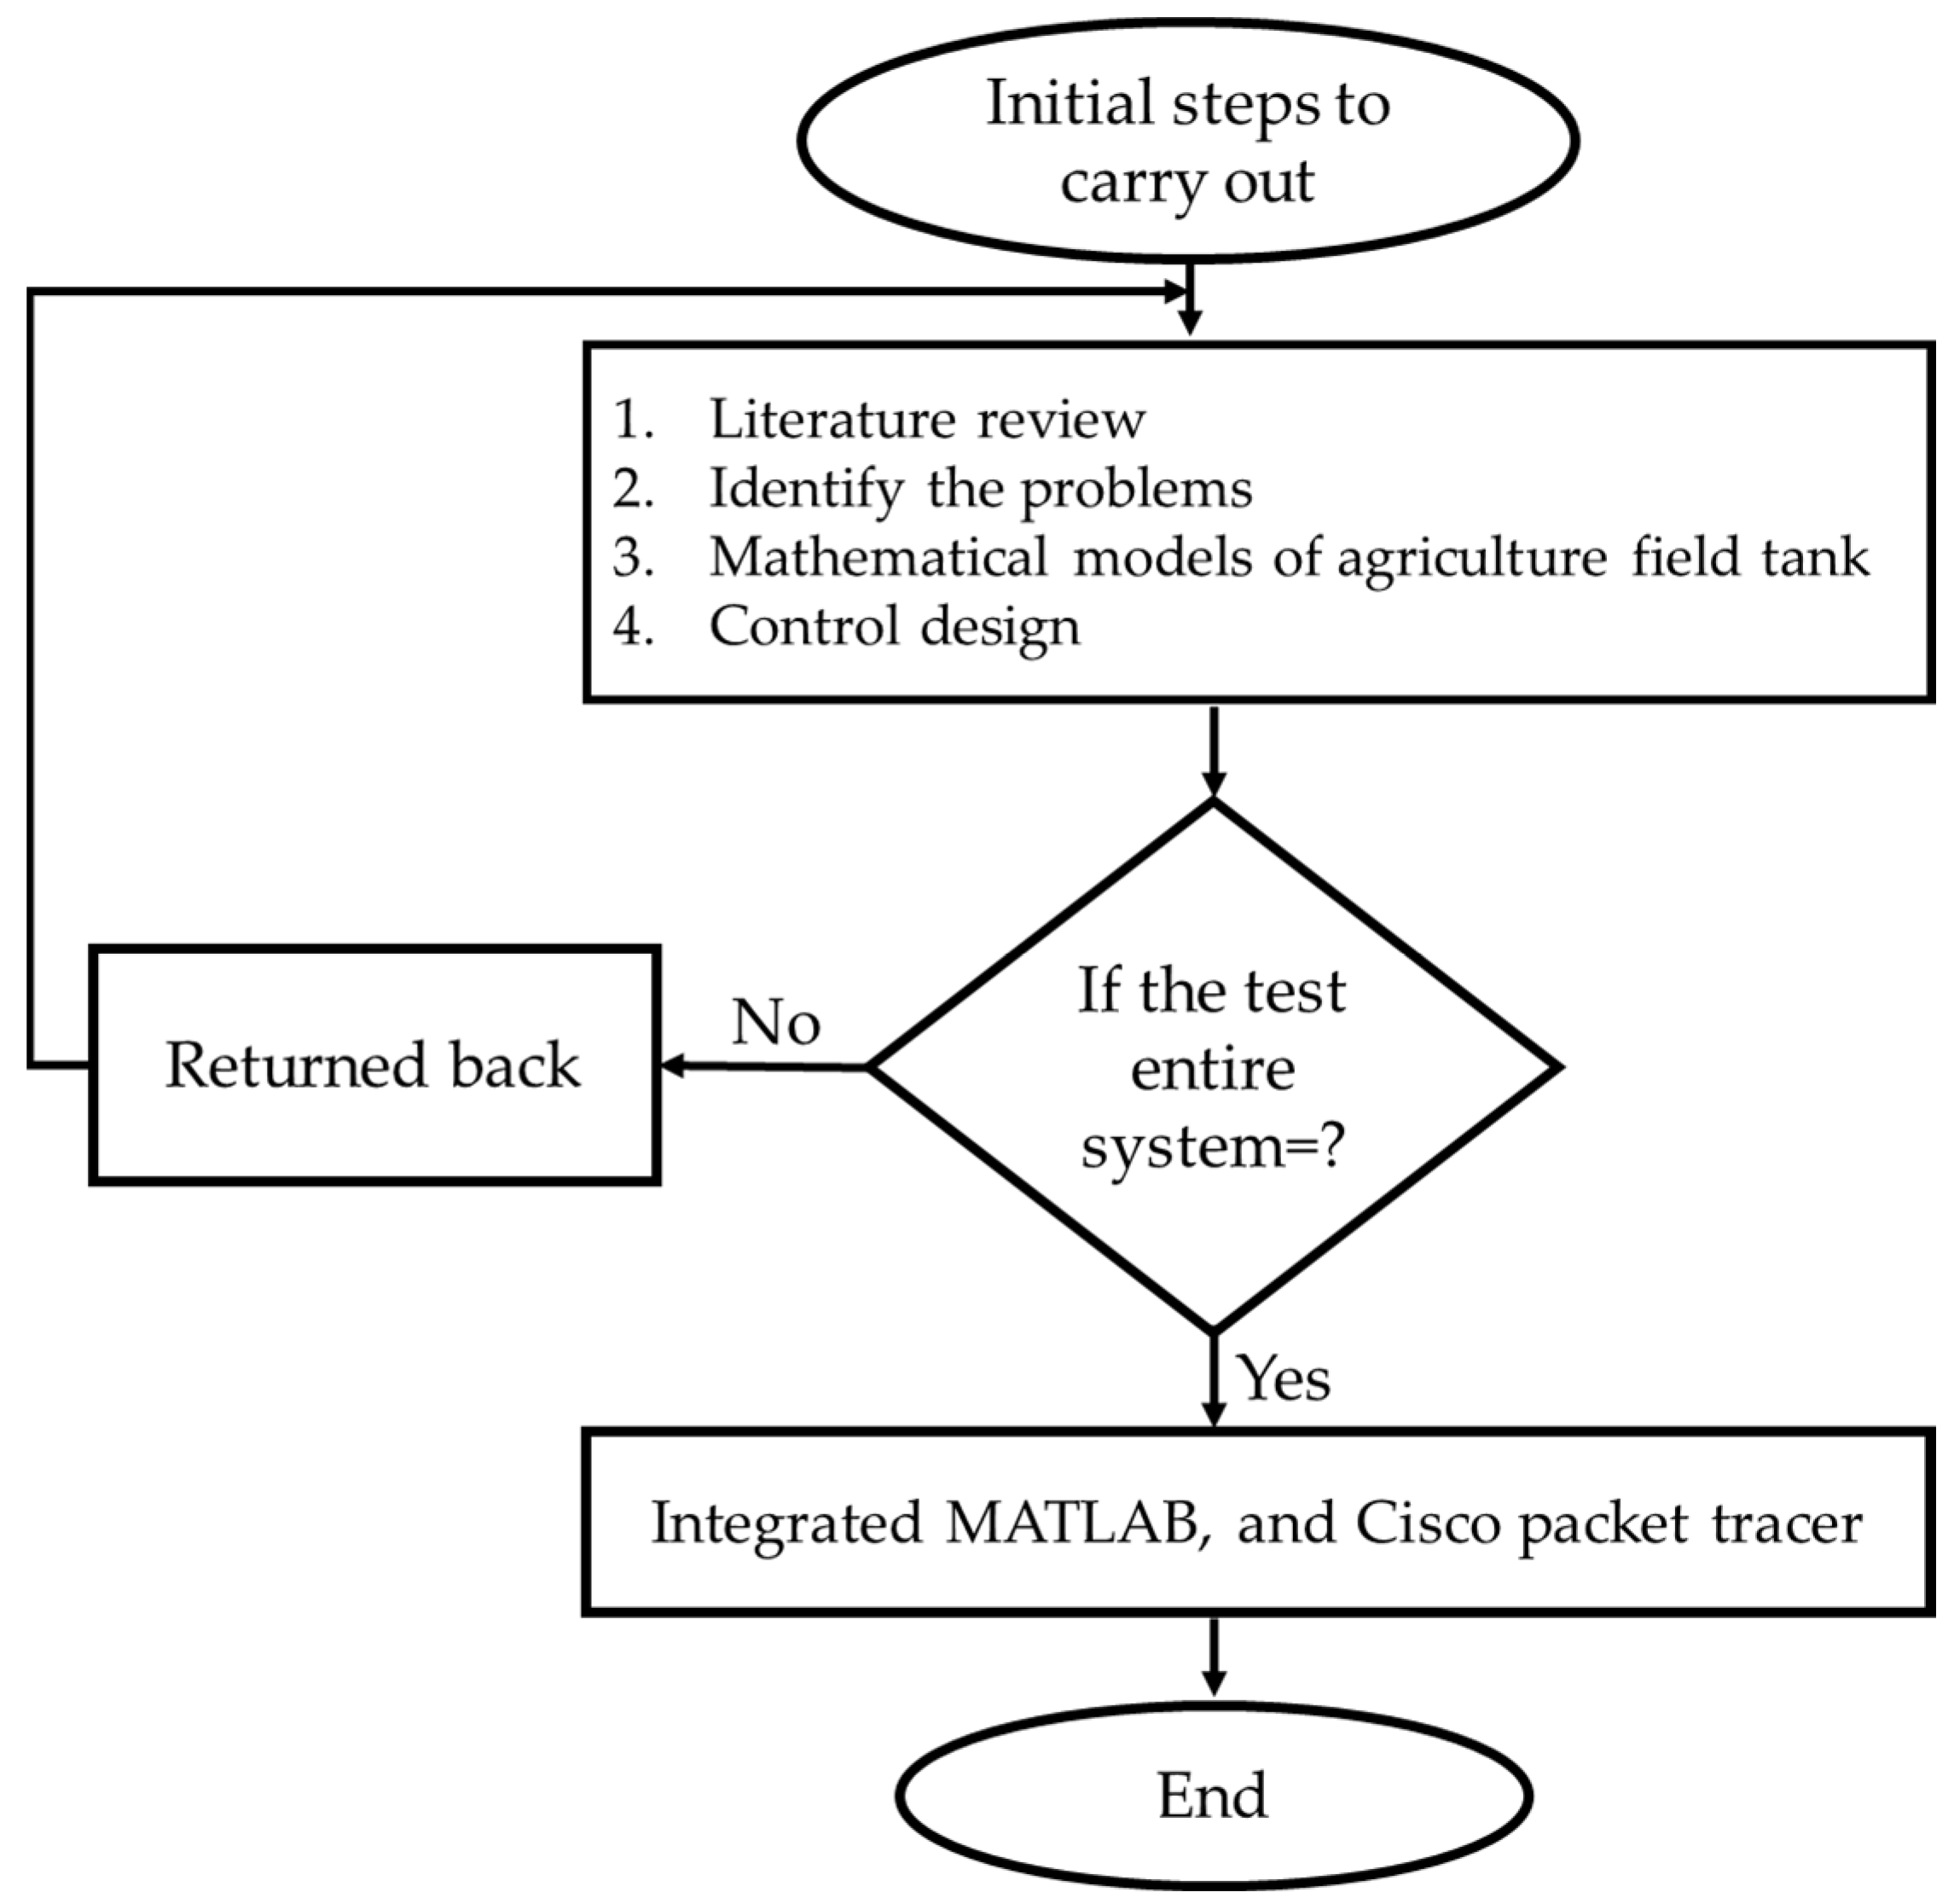
1. Introduction
2. Literature Review
3. Mathematical Models of the System
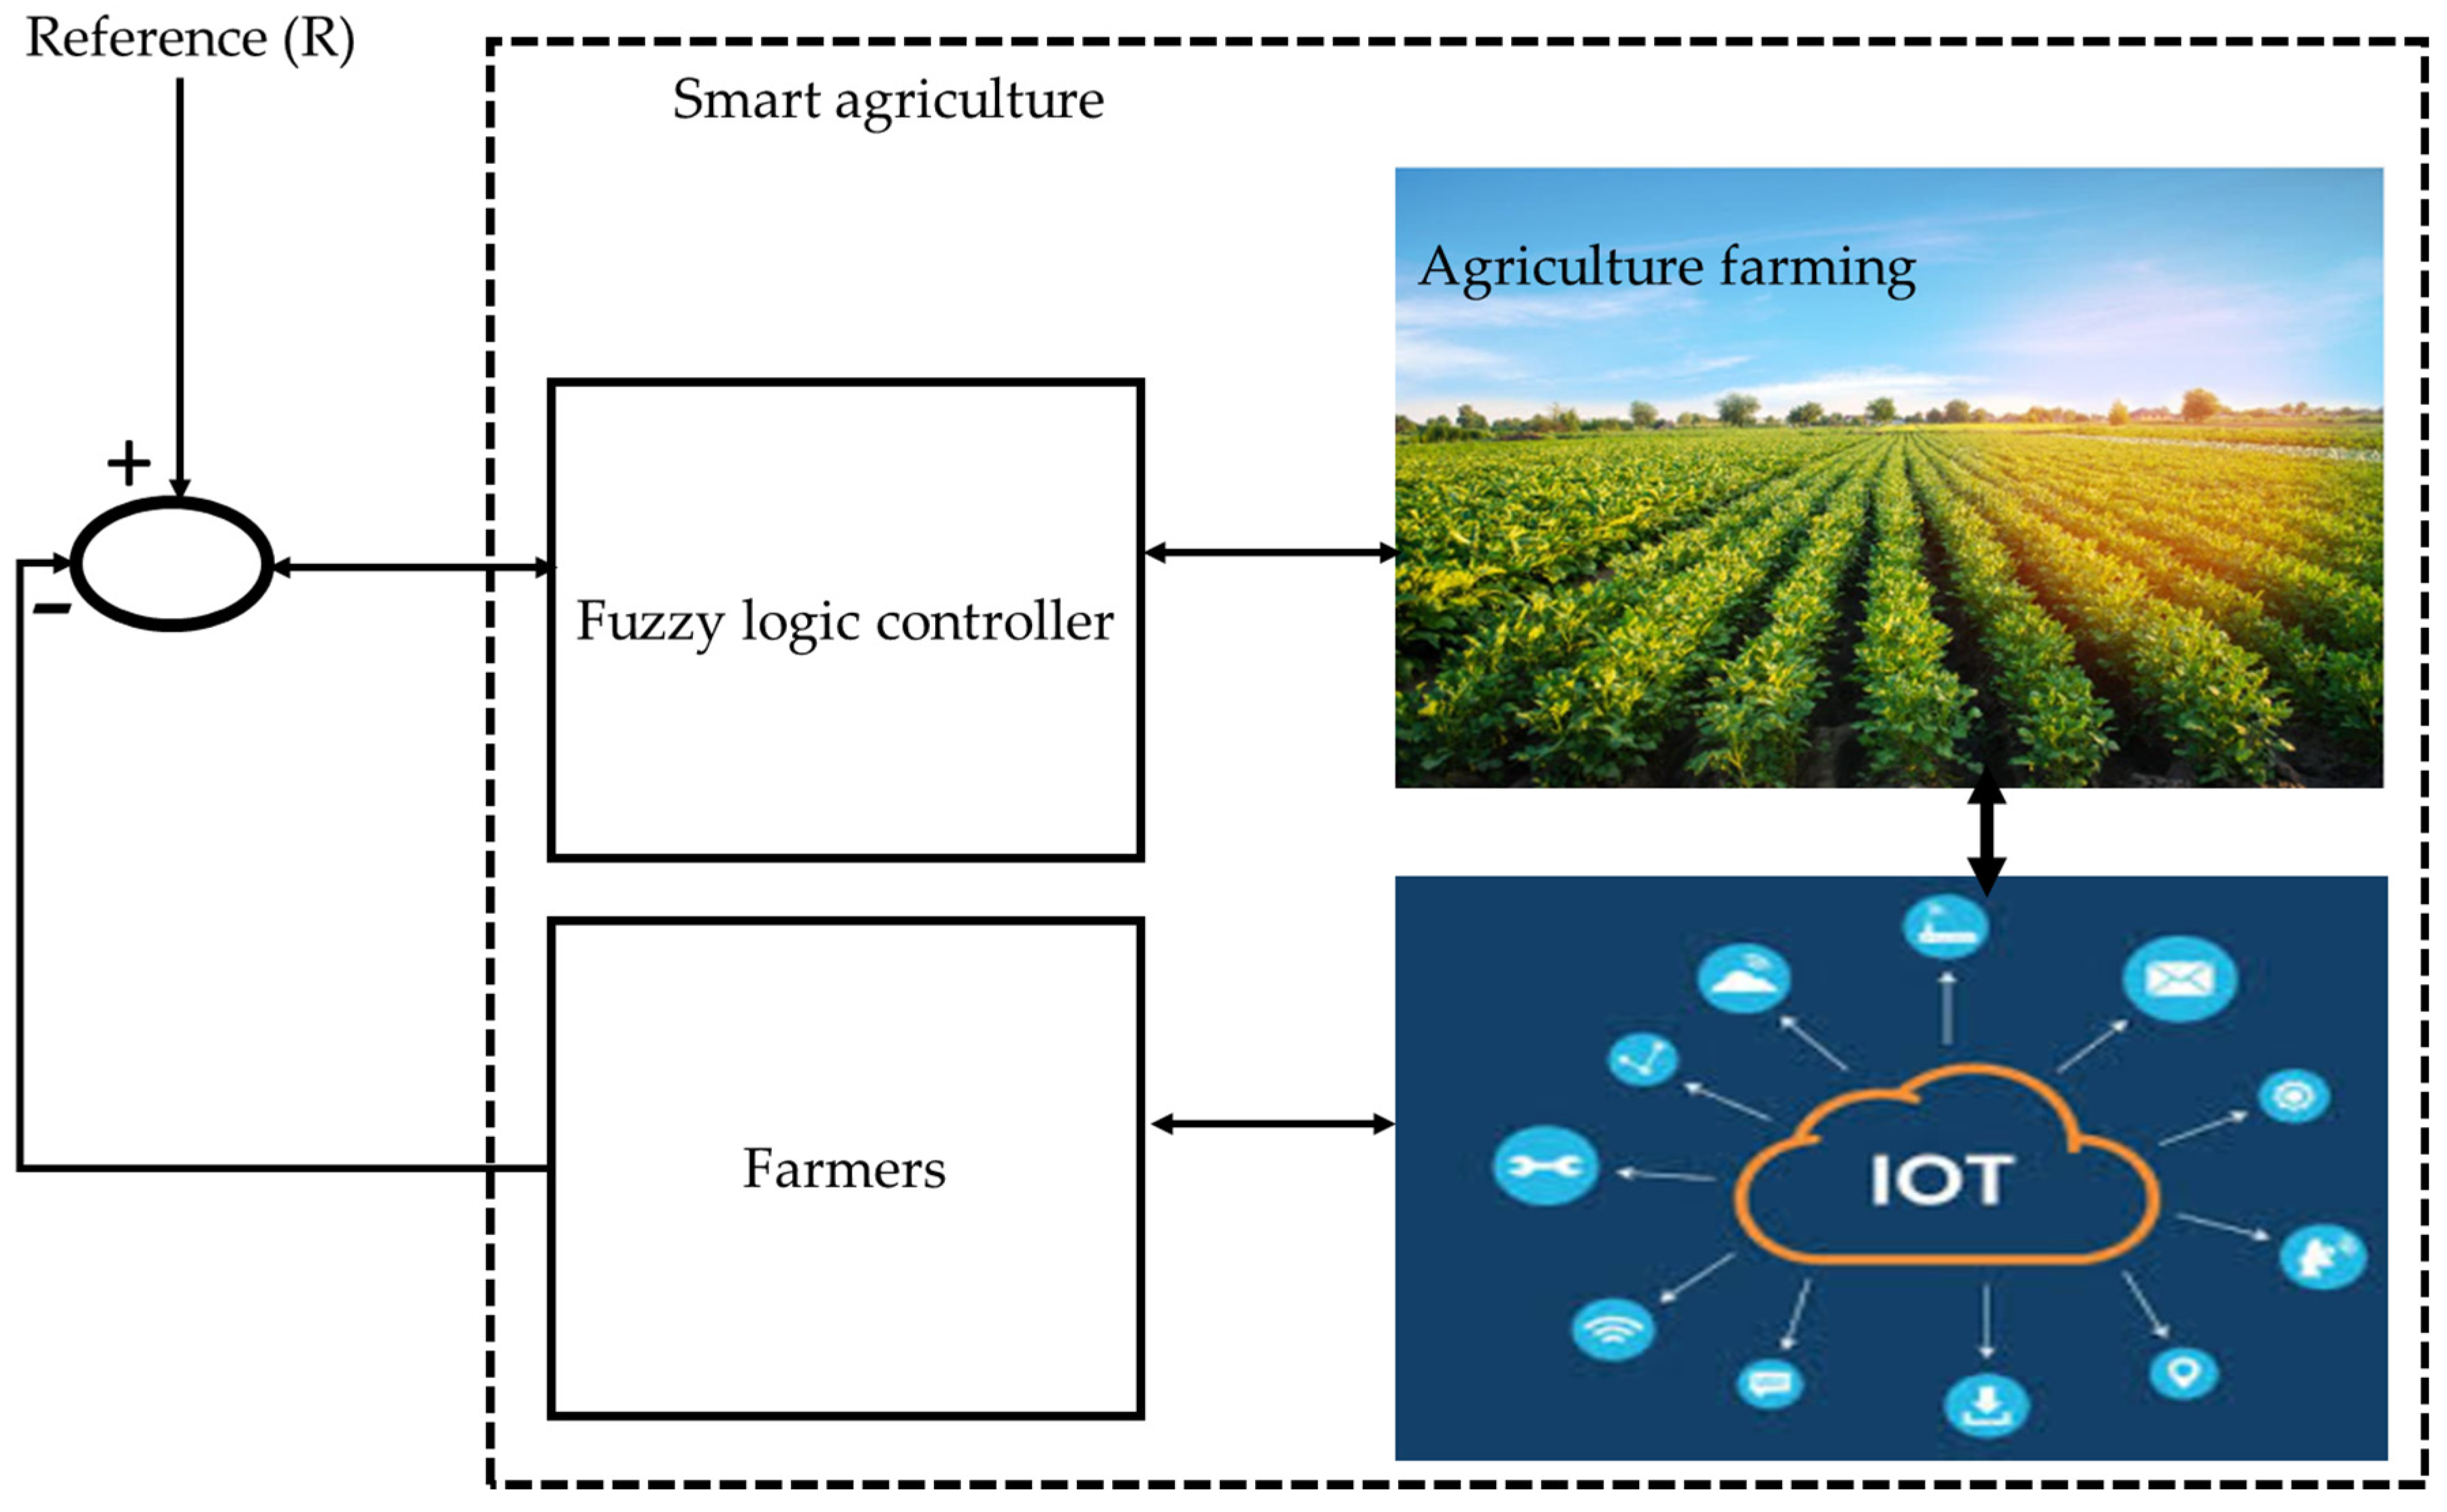
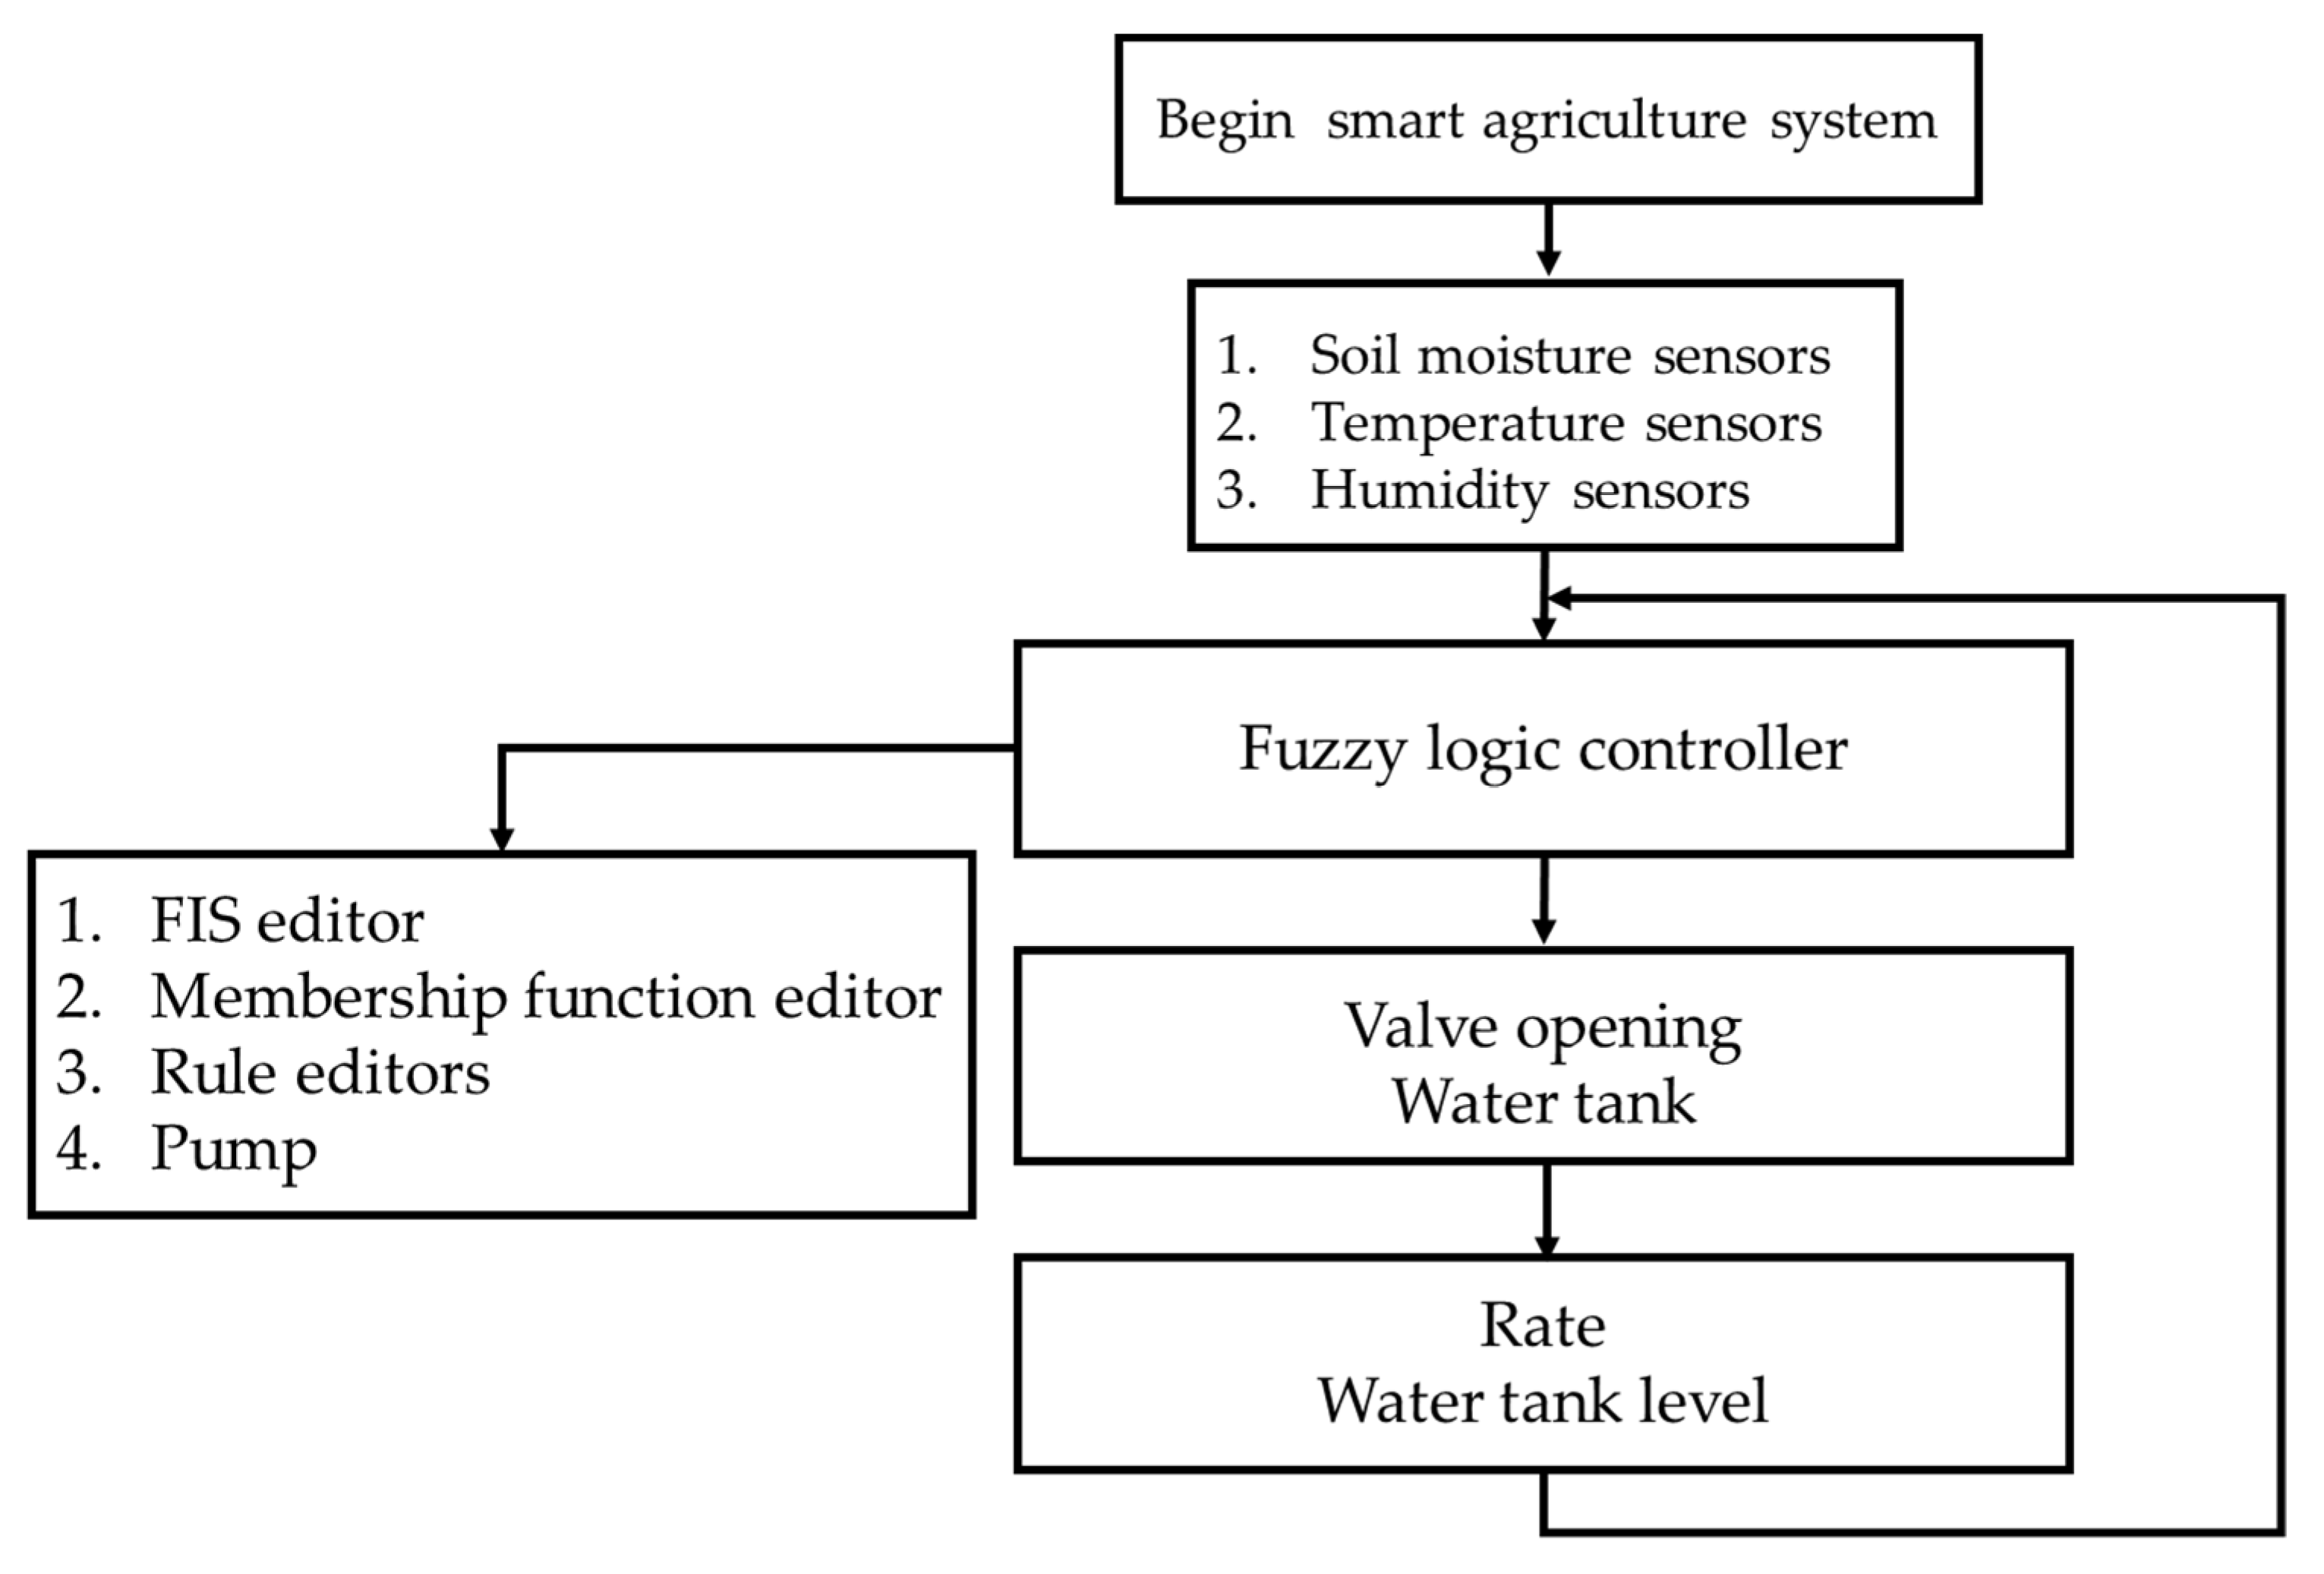
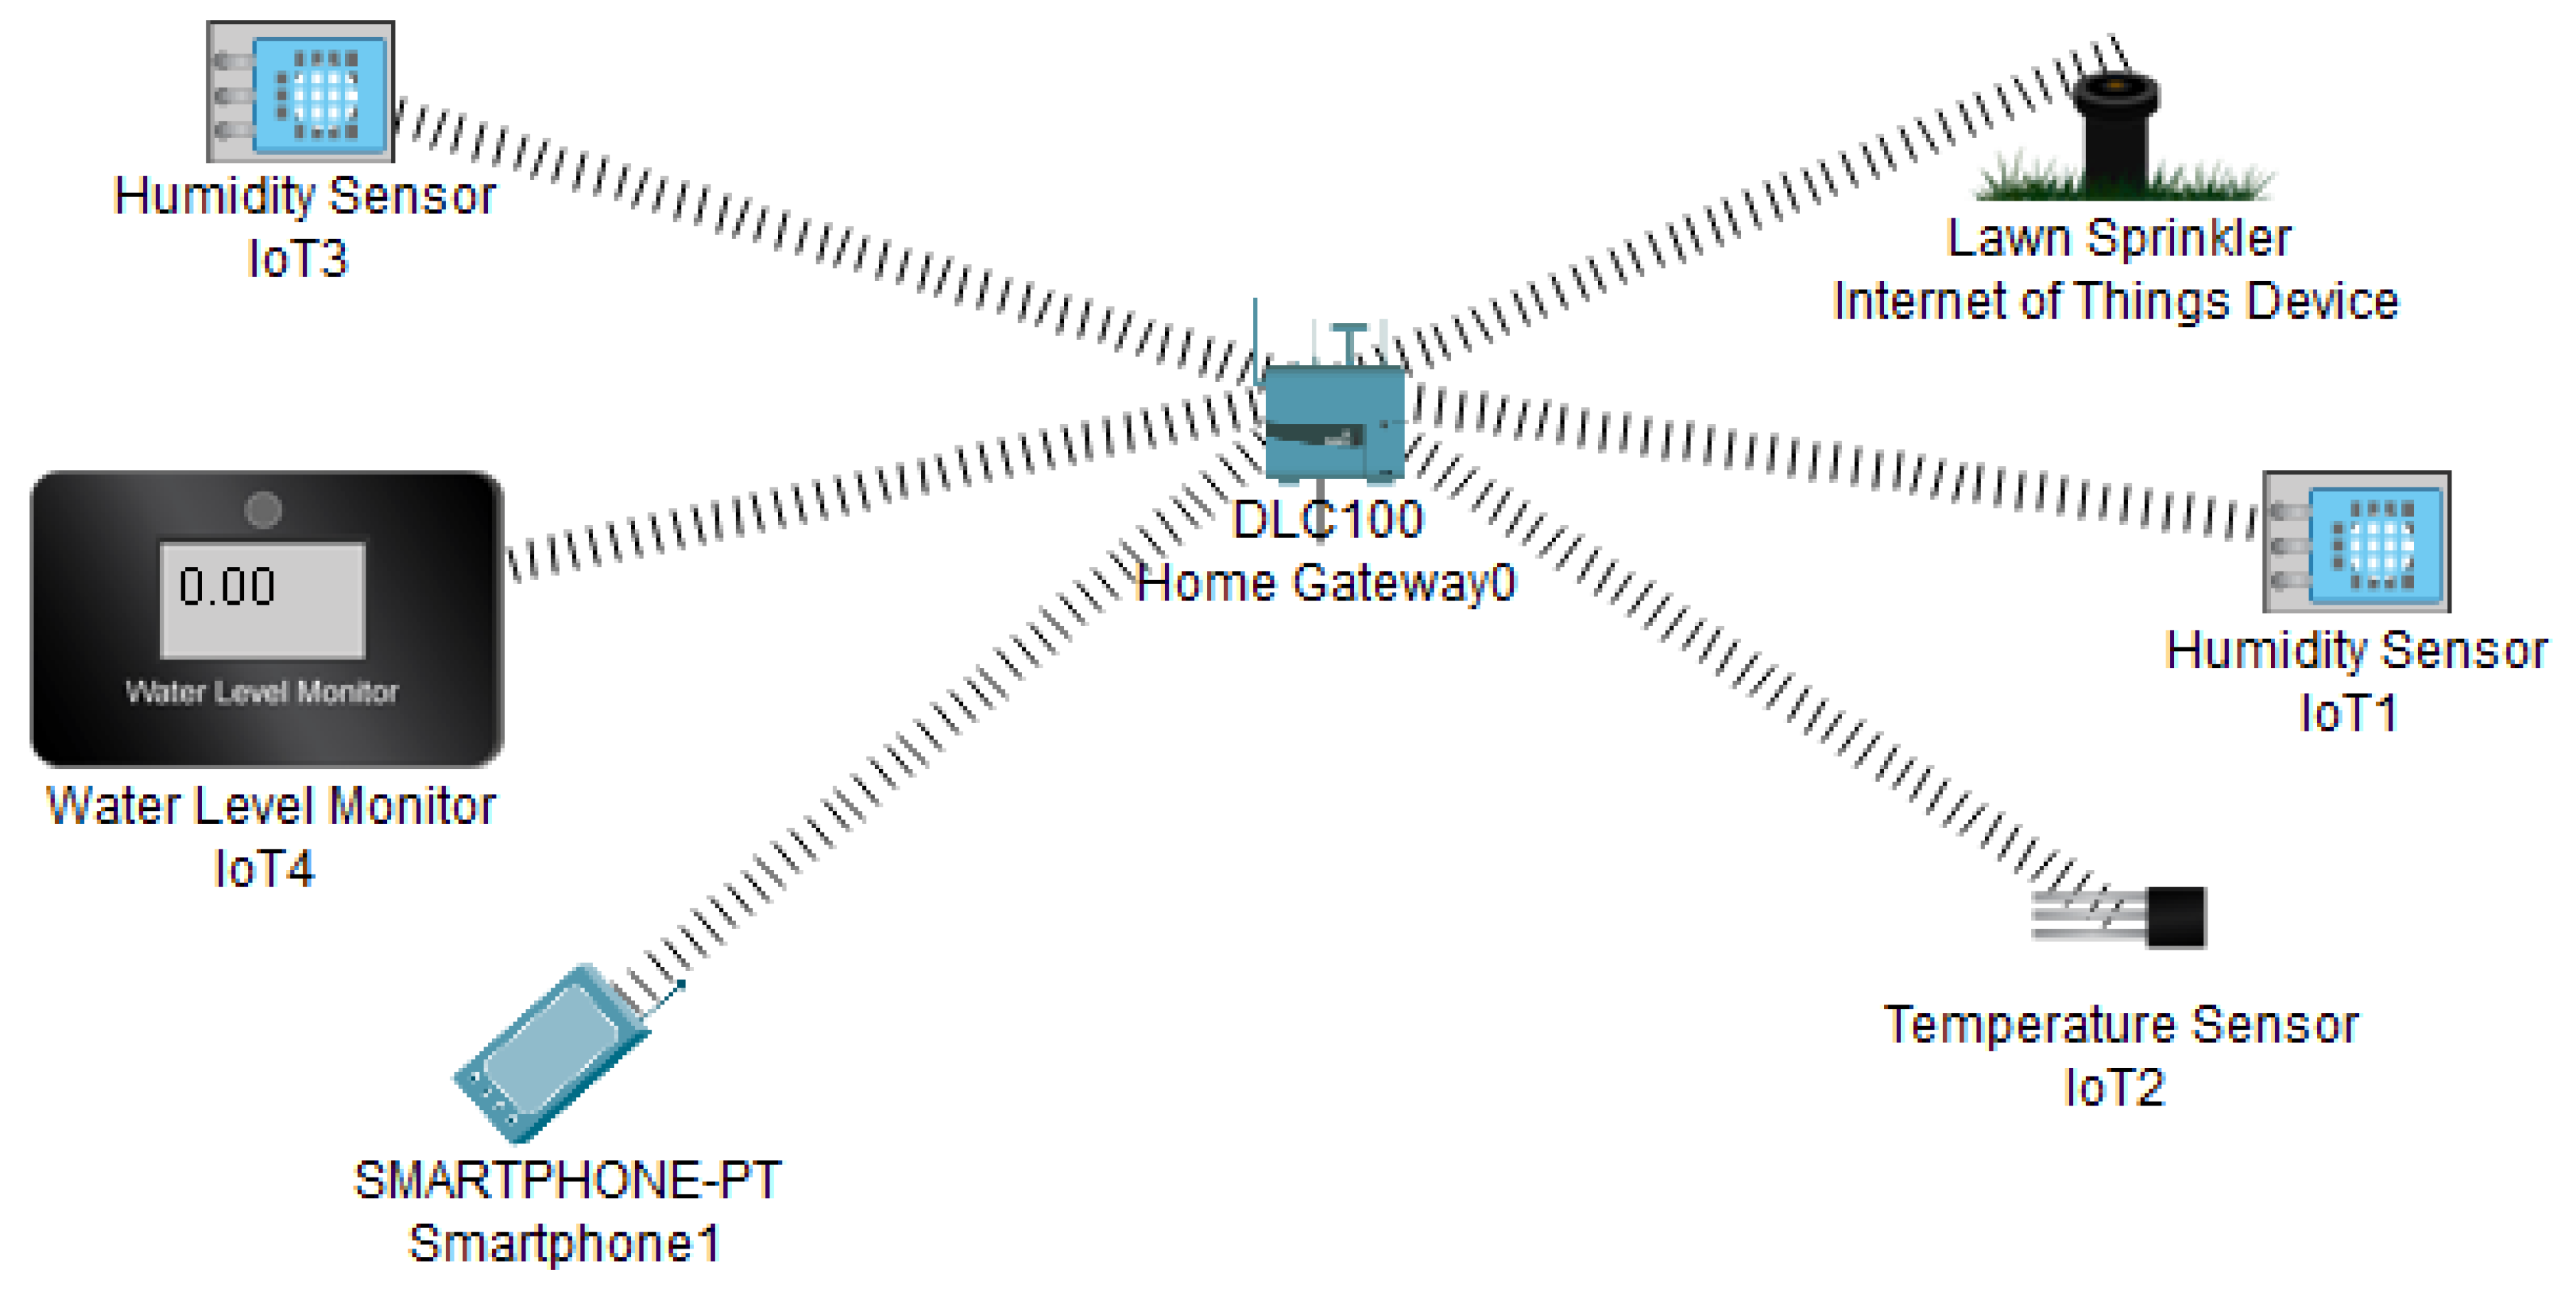
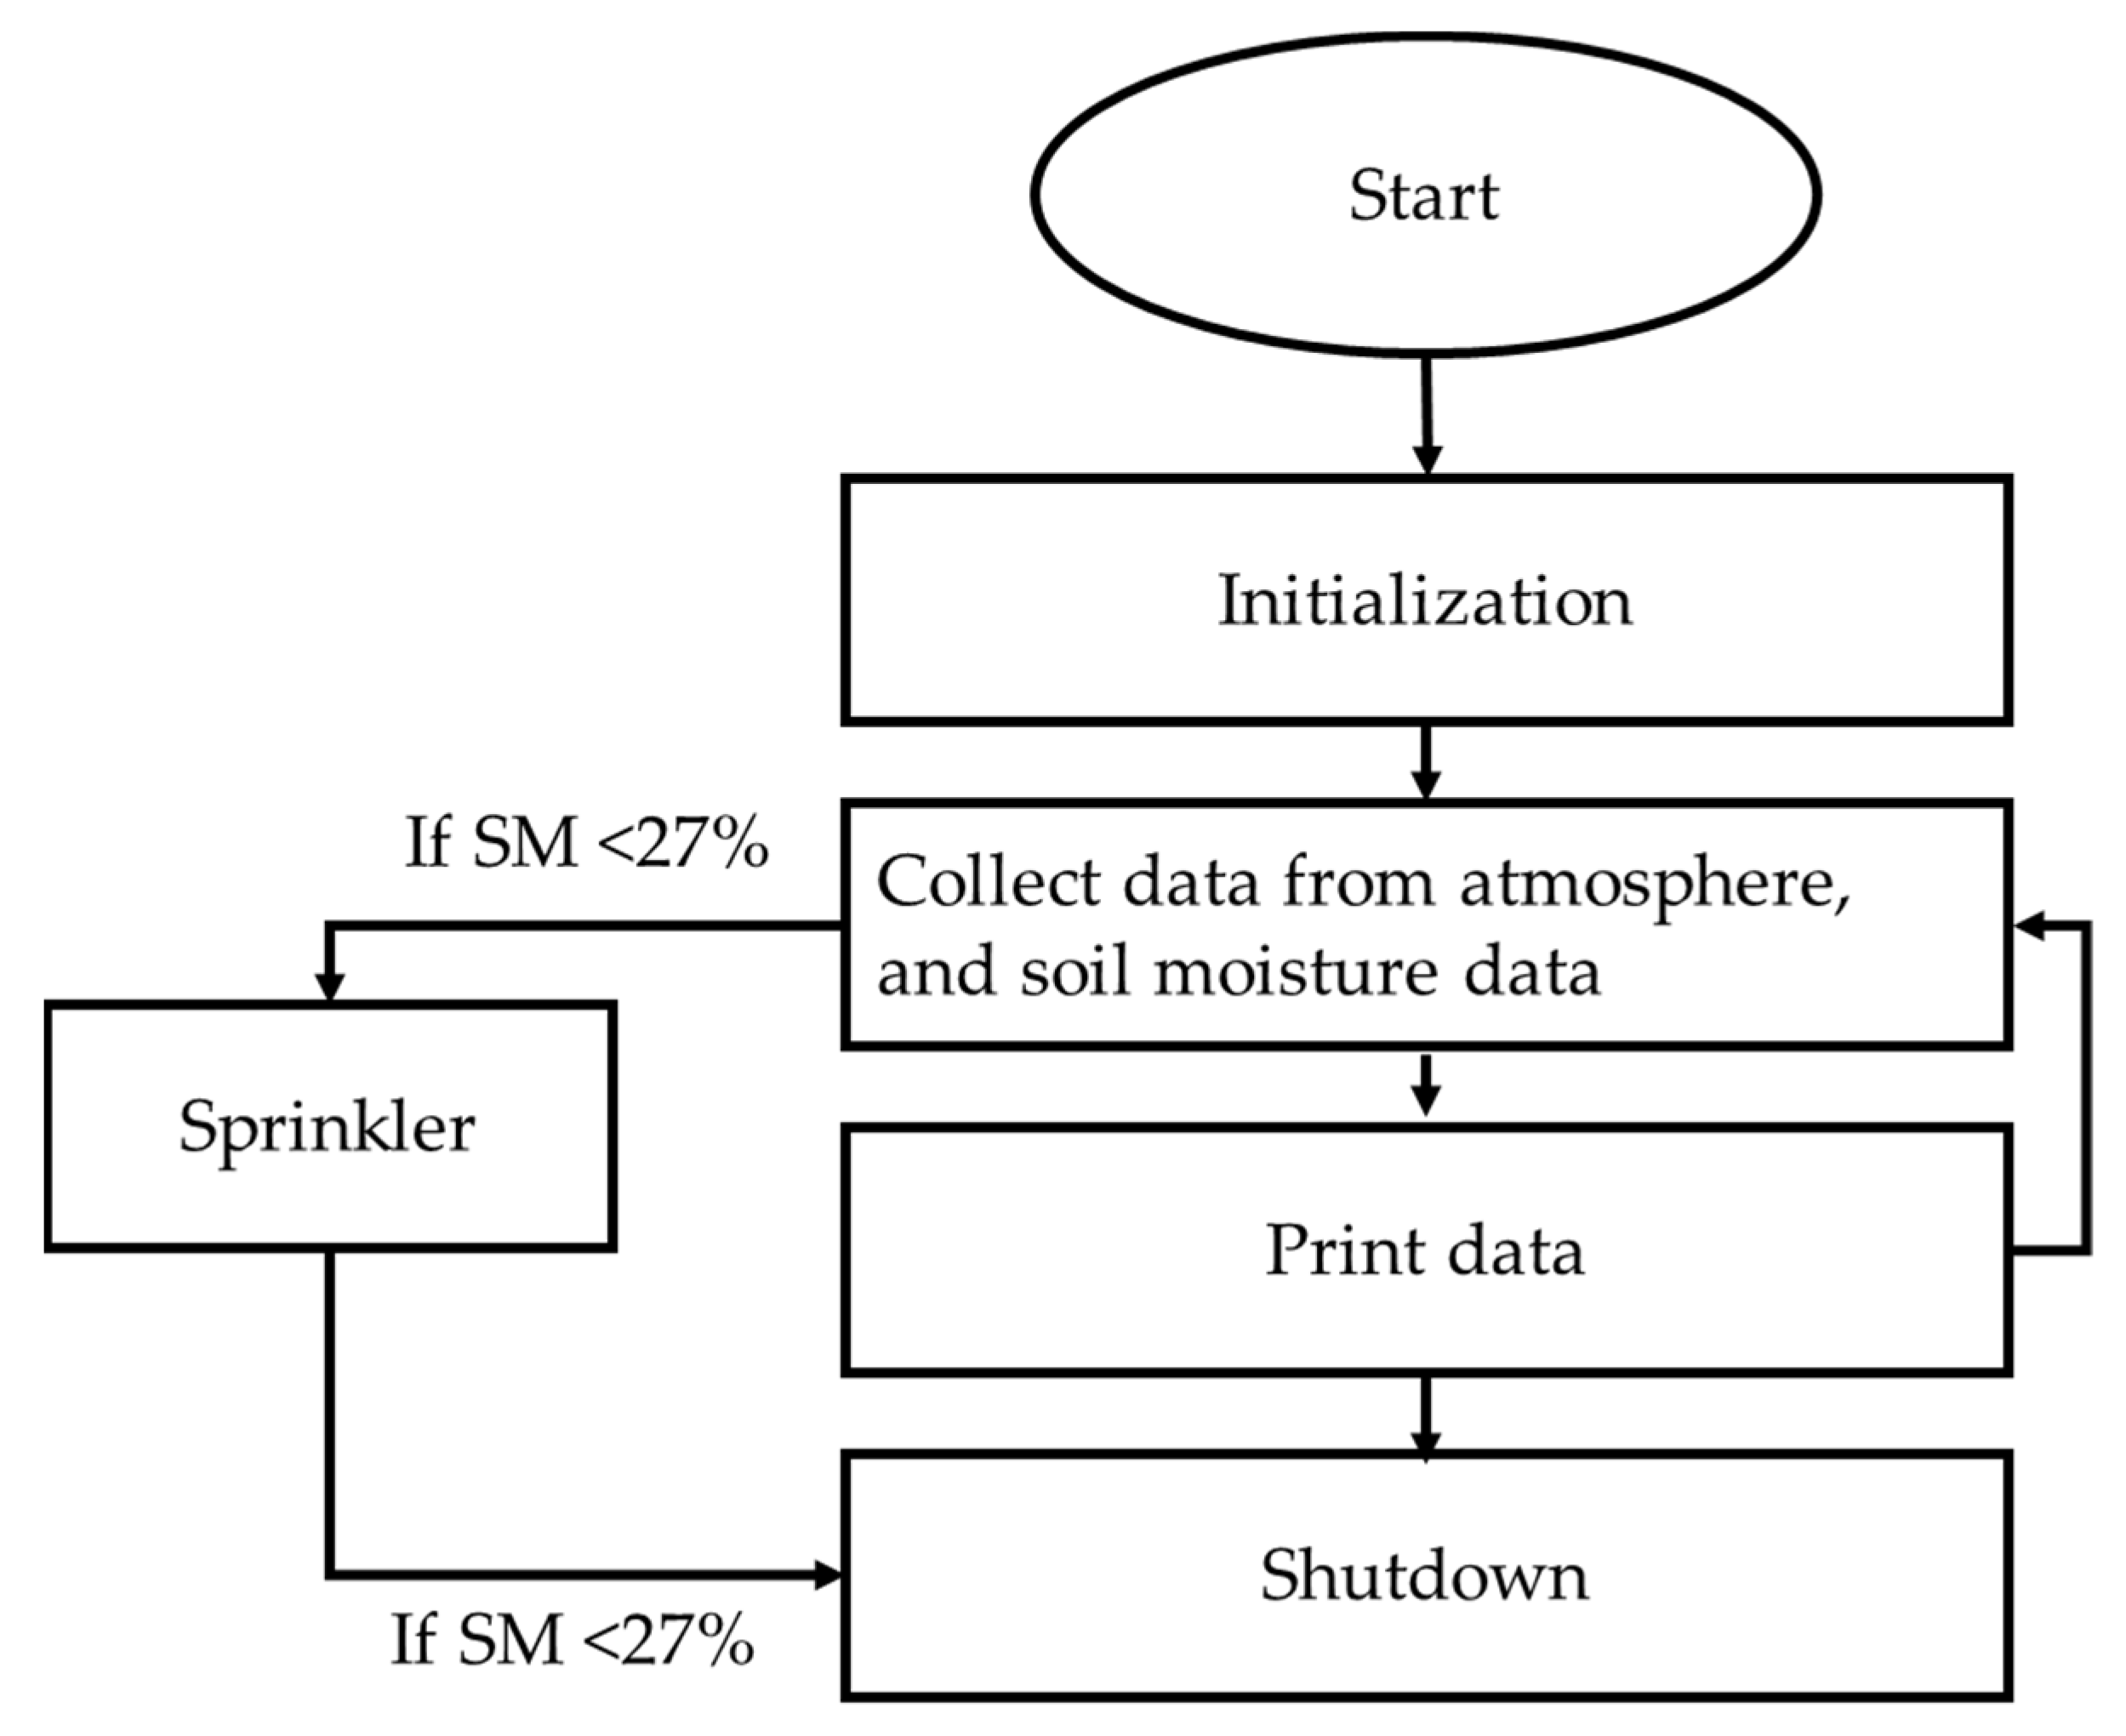
3.1. Working Principles of Smart Agriculture
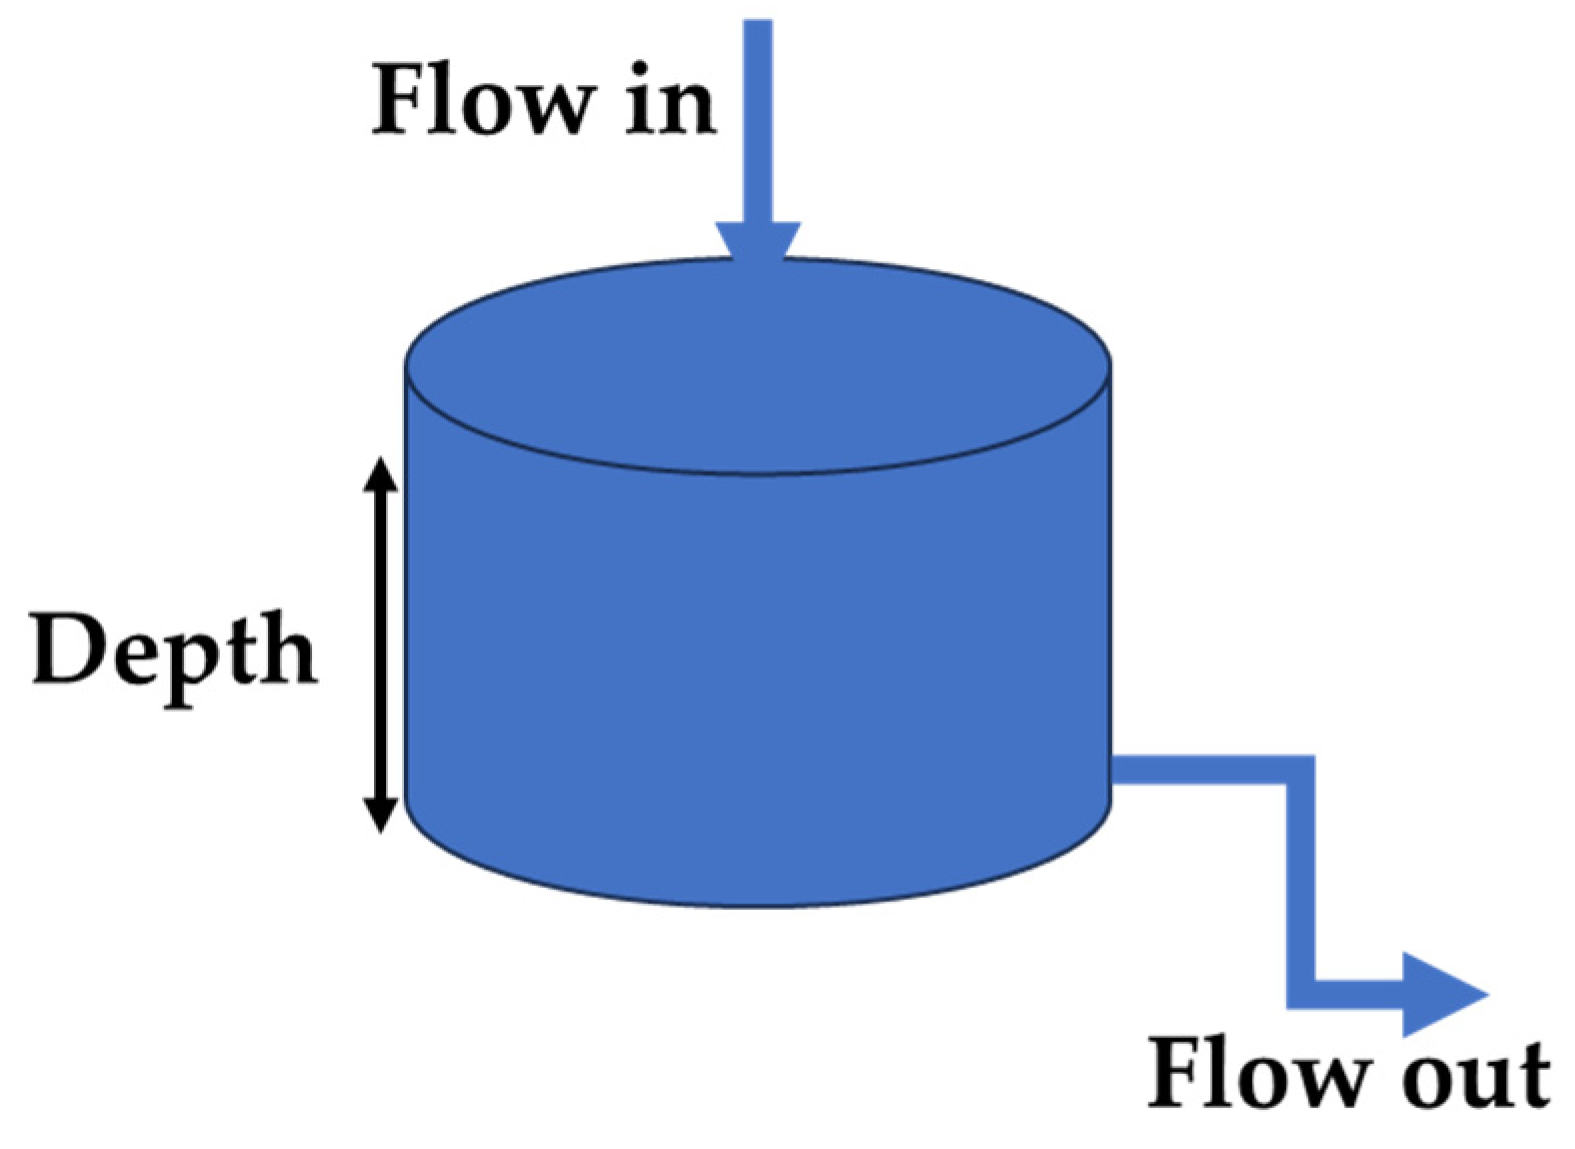
3.2. Mathematical Models of the Water Reservoir Tank Level, and Its Opening Valve
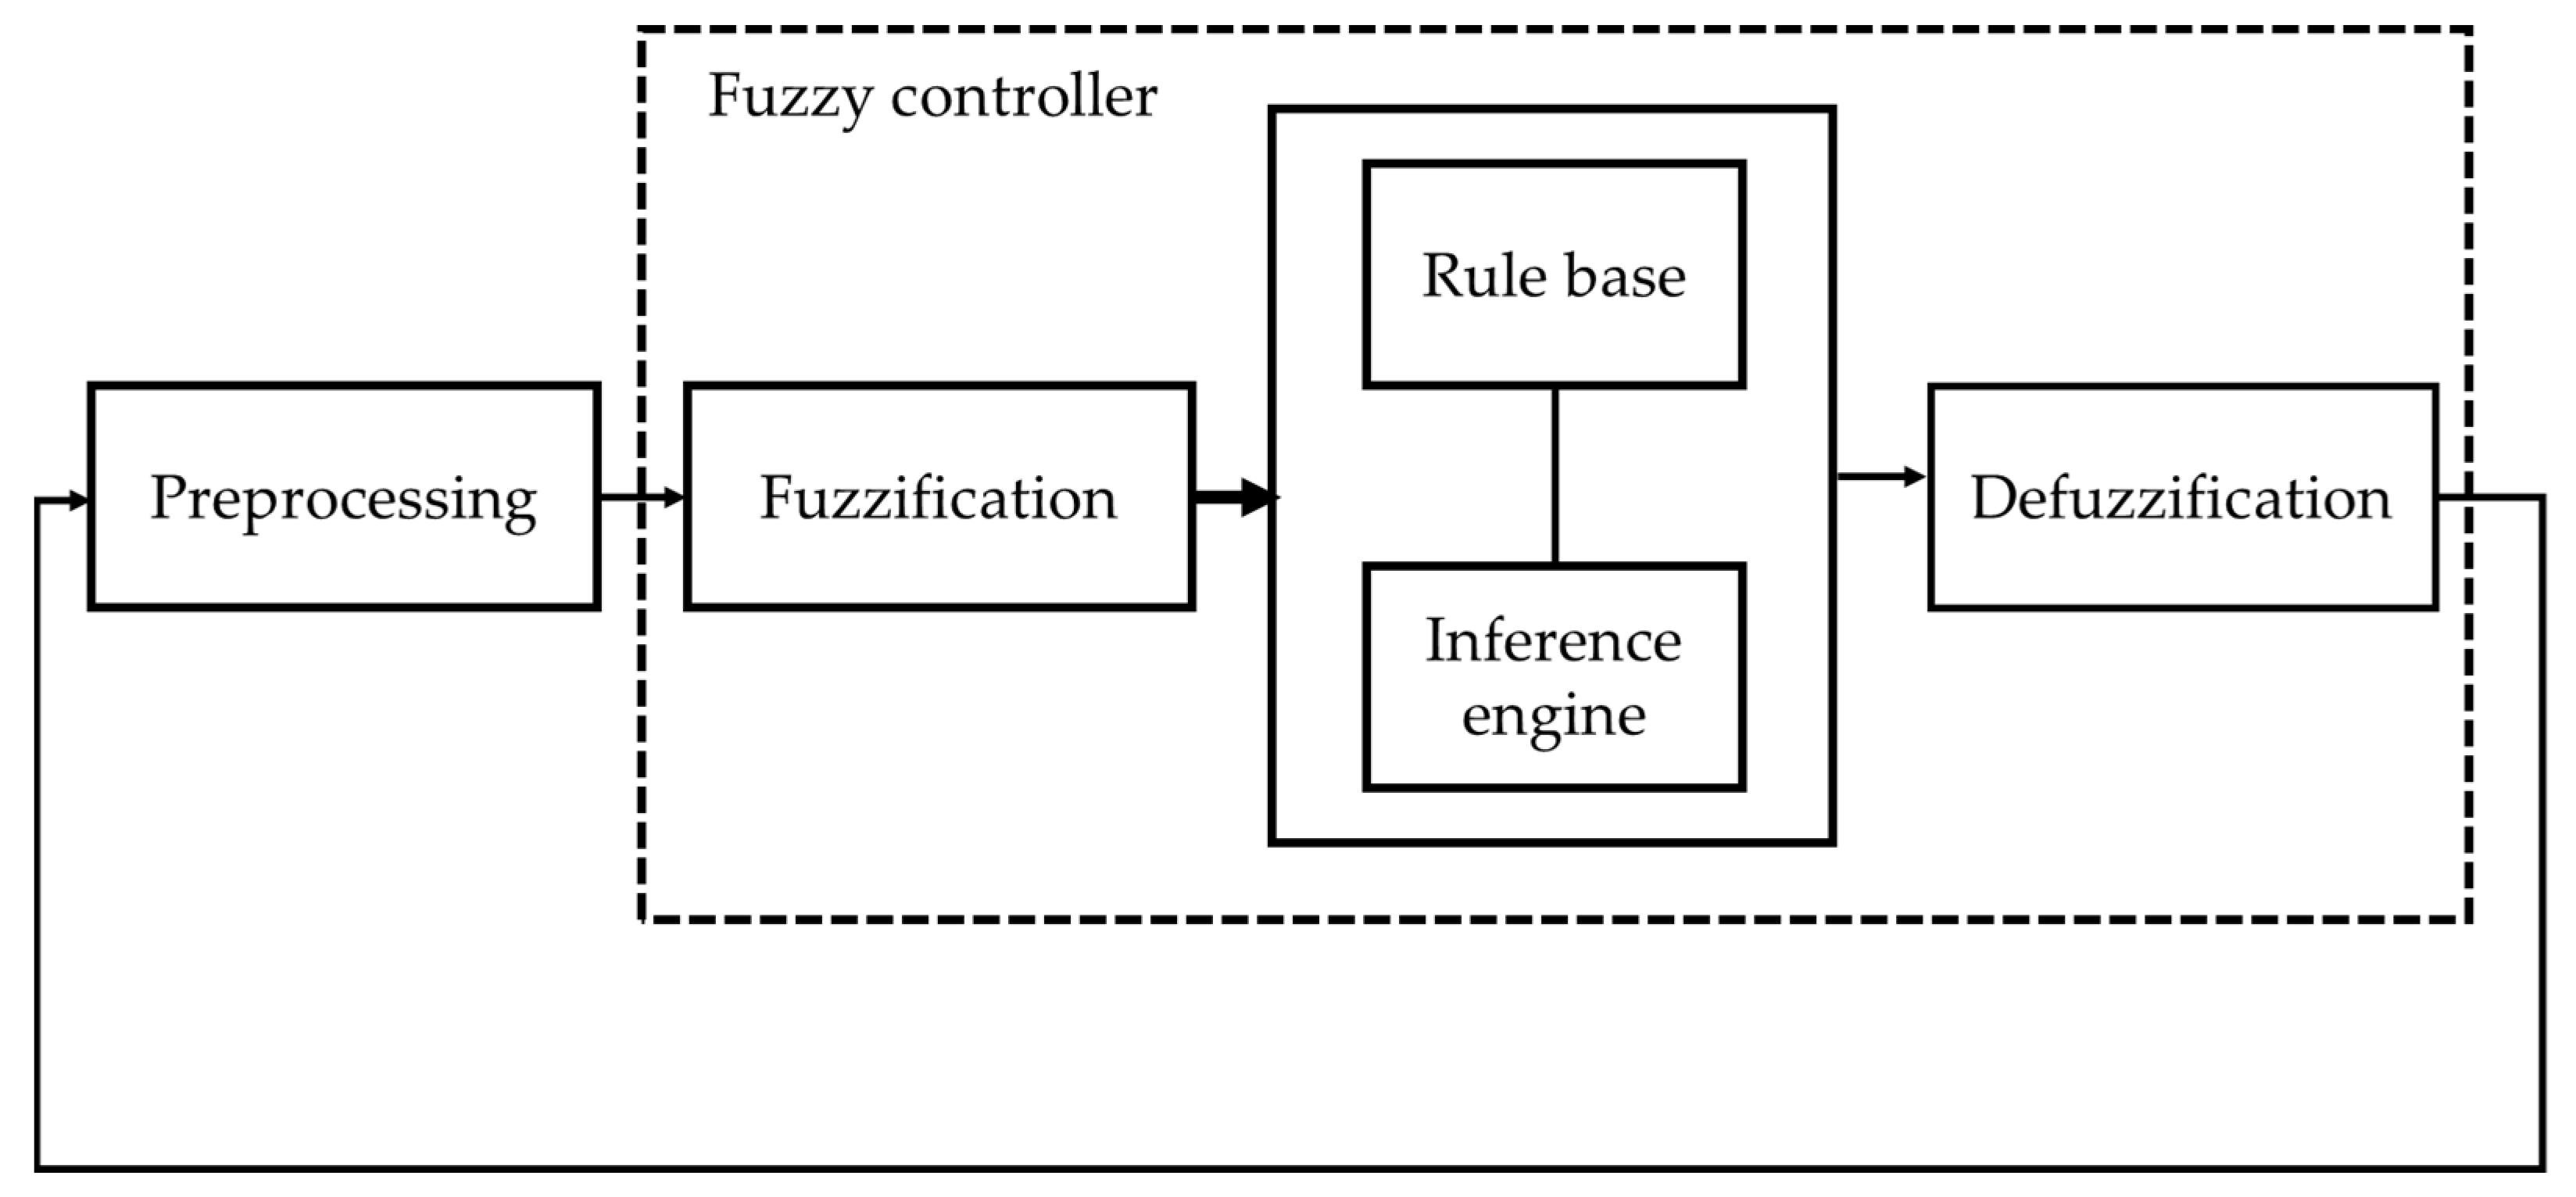
3.3. Fuzzy Logic Control Design
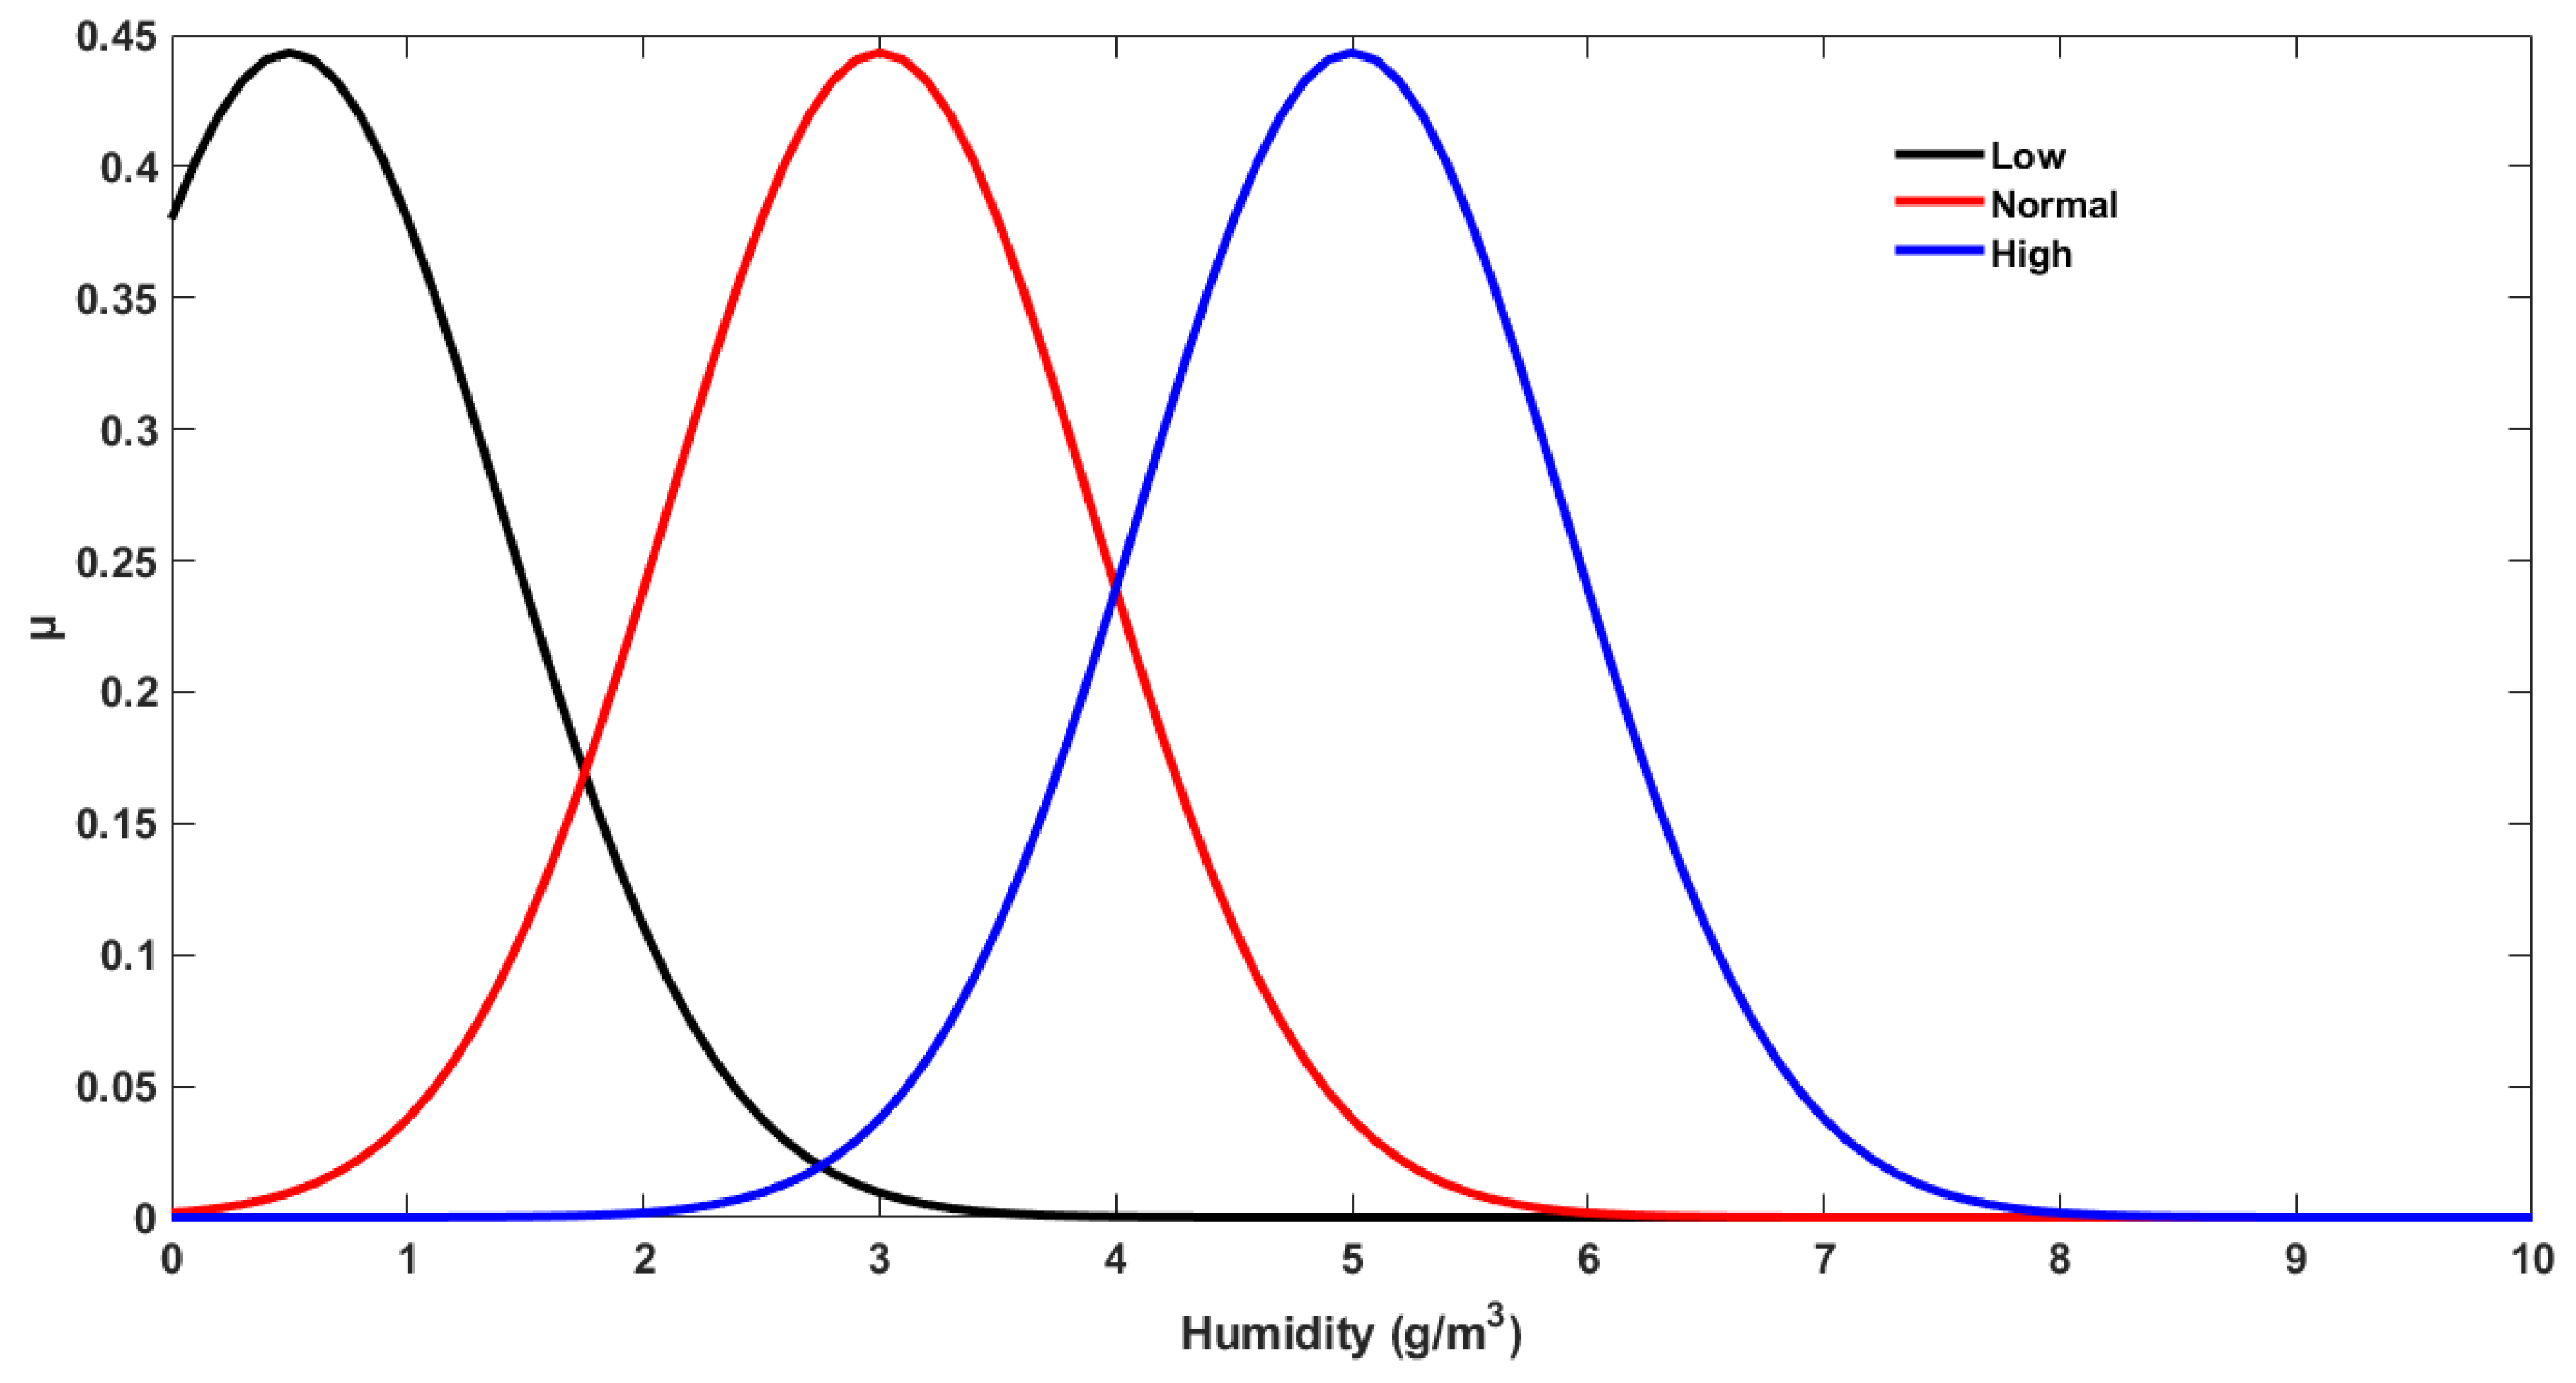
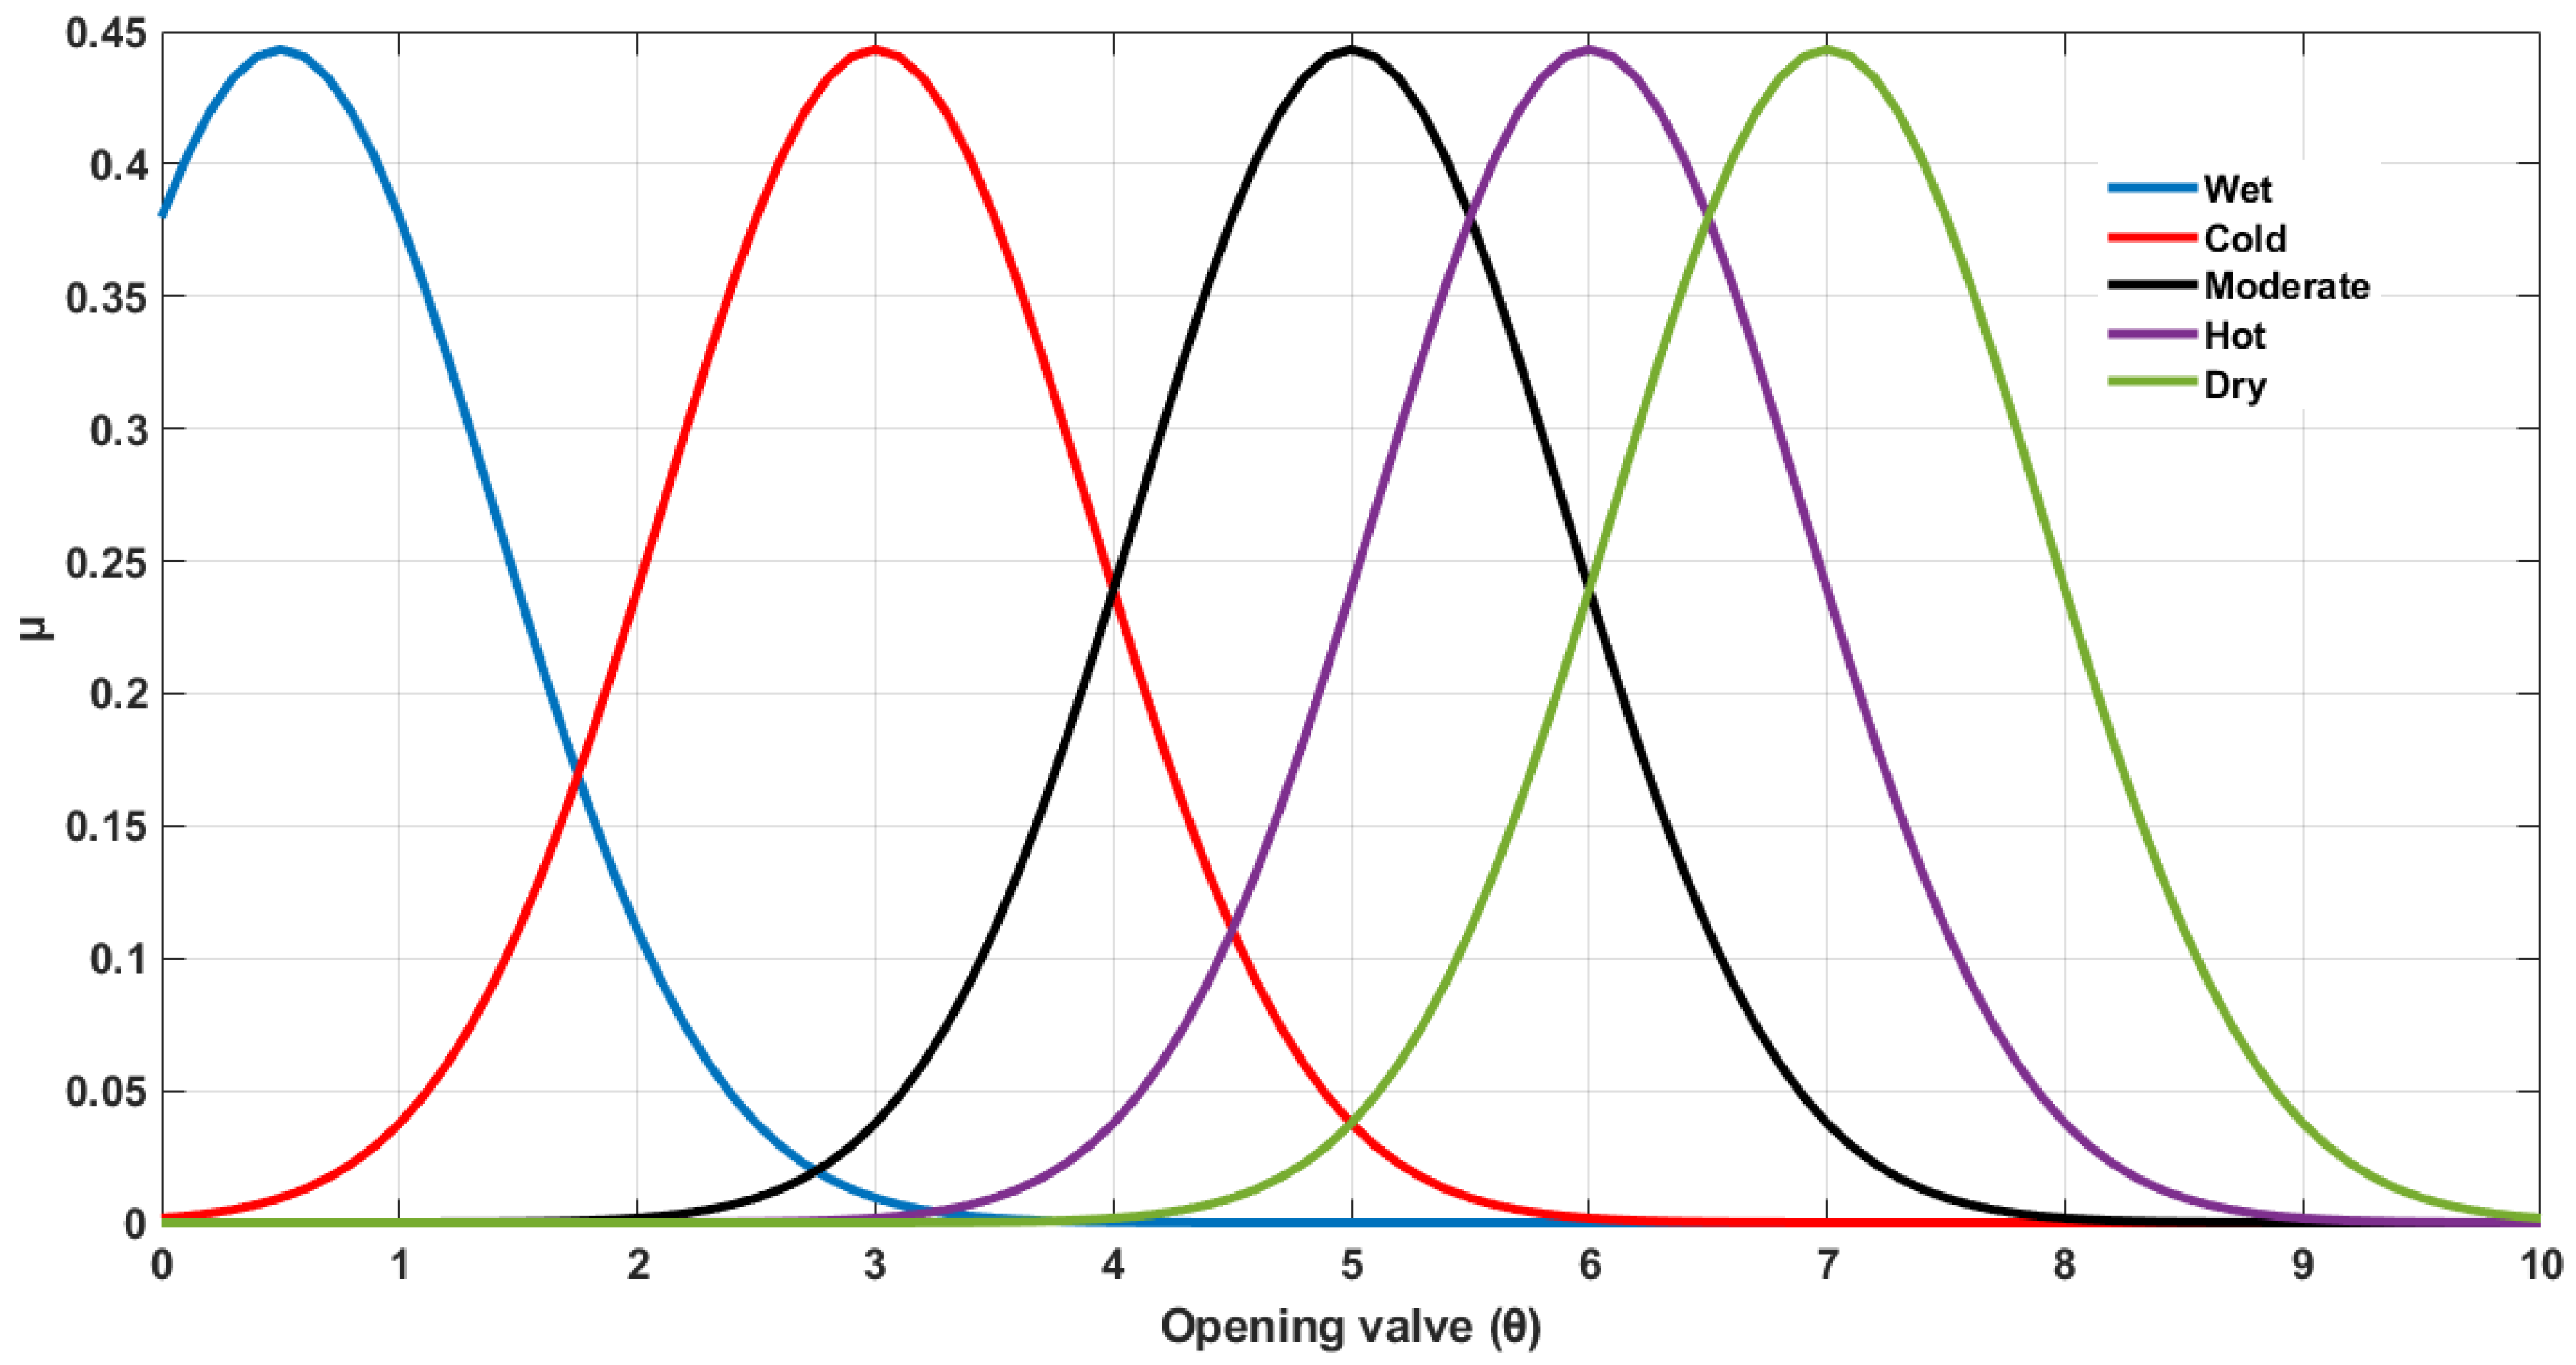
3.3.1. Membership Function Assignments
3.3.2. Case Study for the Intelligent Fuzzy Logic Model
- Temperature:
- ◦
- If the temperature is low, then the output is cold;
- ◦
- If the temperature is normal, then the output is moderate;
- ◦
- If the temperature is high, then the output is hot.
- Humidity:
- ◦
- If the humidity is low, then the output is dry;
- ◦
- If the humidity is normal, then the output is moderate;
- ◦
- If the humidity is high, then the output is wet.
- Soil Moisture:
- ◦
- If the soil moisture is low, then the output is dry;
- ◦
- If the soil moisture is normal, then the output is moderate;
- ◦
- If the soil moisture is high, then the output is wet.
- Soil Acidity:
- ◦
- If the soil acidity is low, then the output is basic;
- ◦
- If the soil acidity is normal, then the output is neutral;
- ◦
- If the soil acidity is high, then the output is acidic.
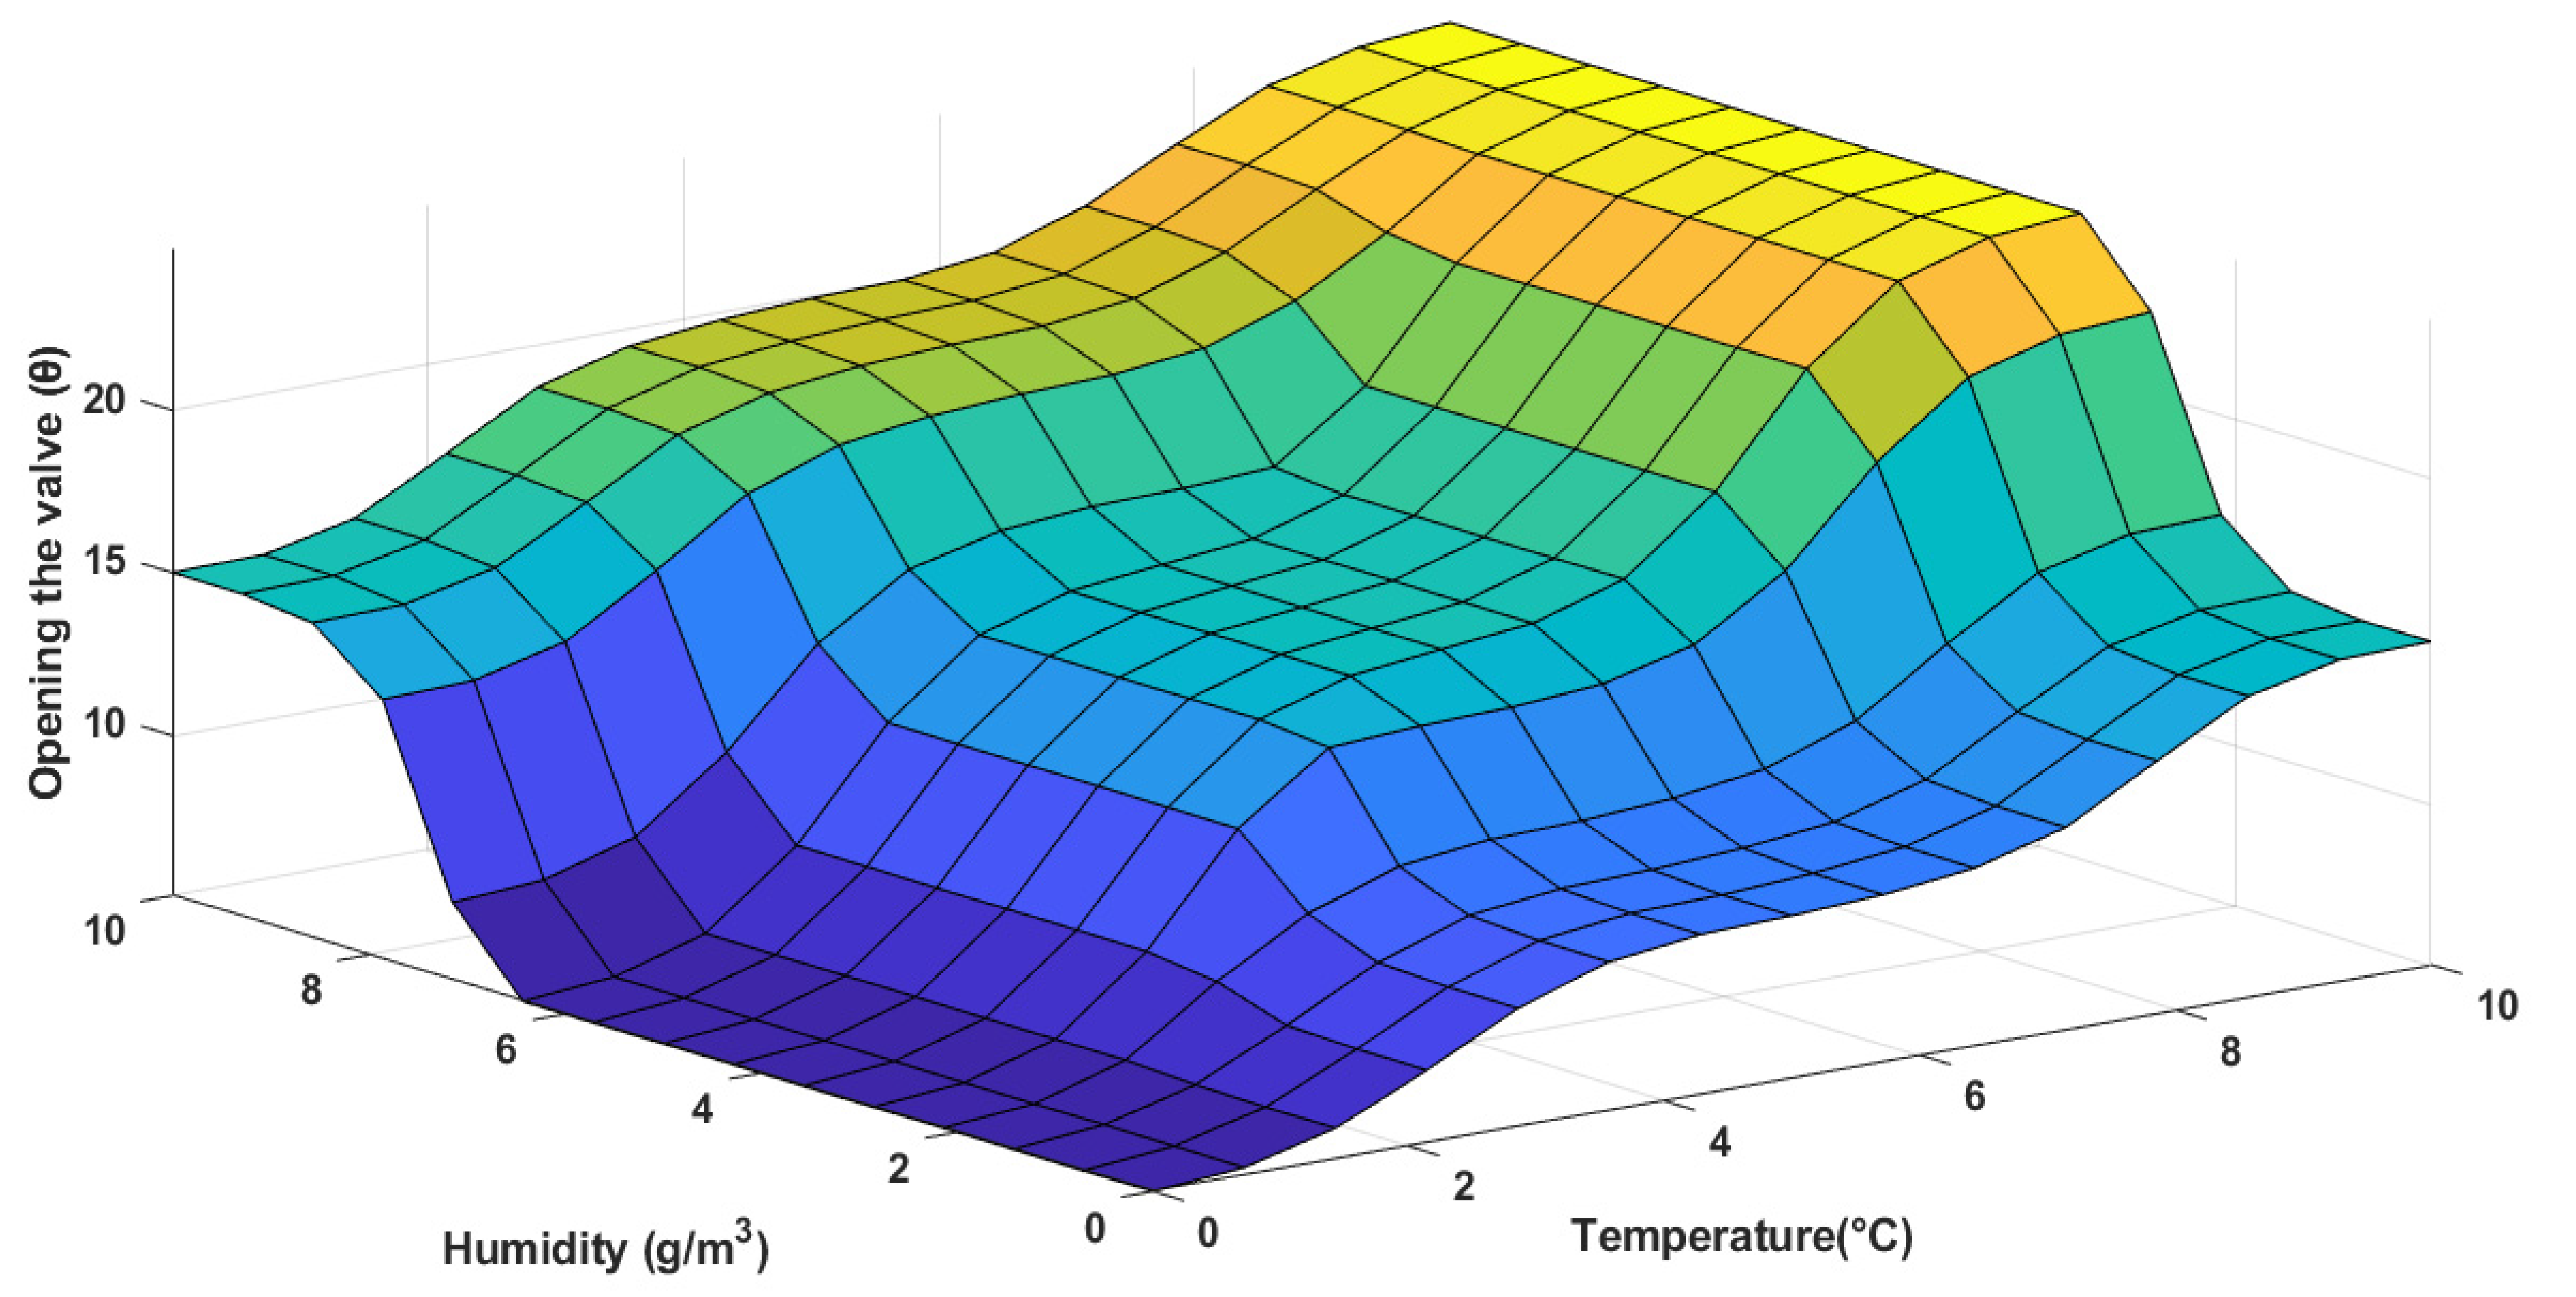
3.3.3. Formulation of the Air Properties in the Agricultural Field
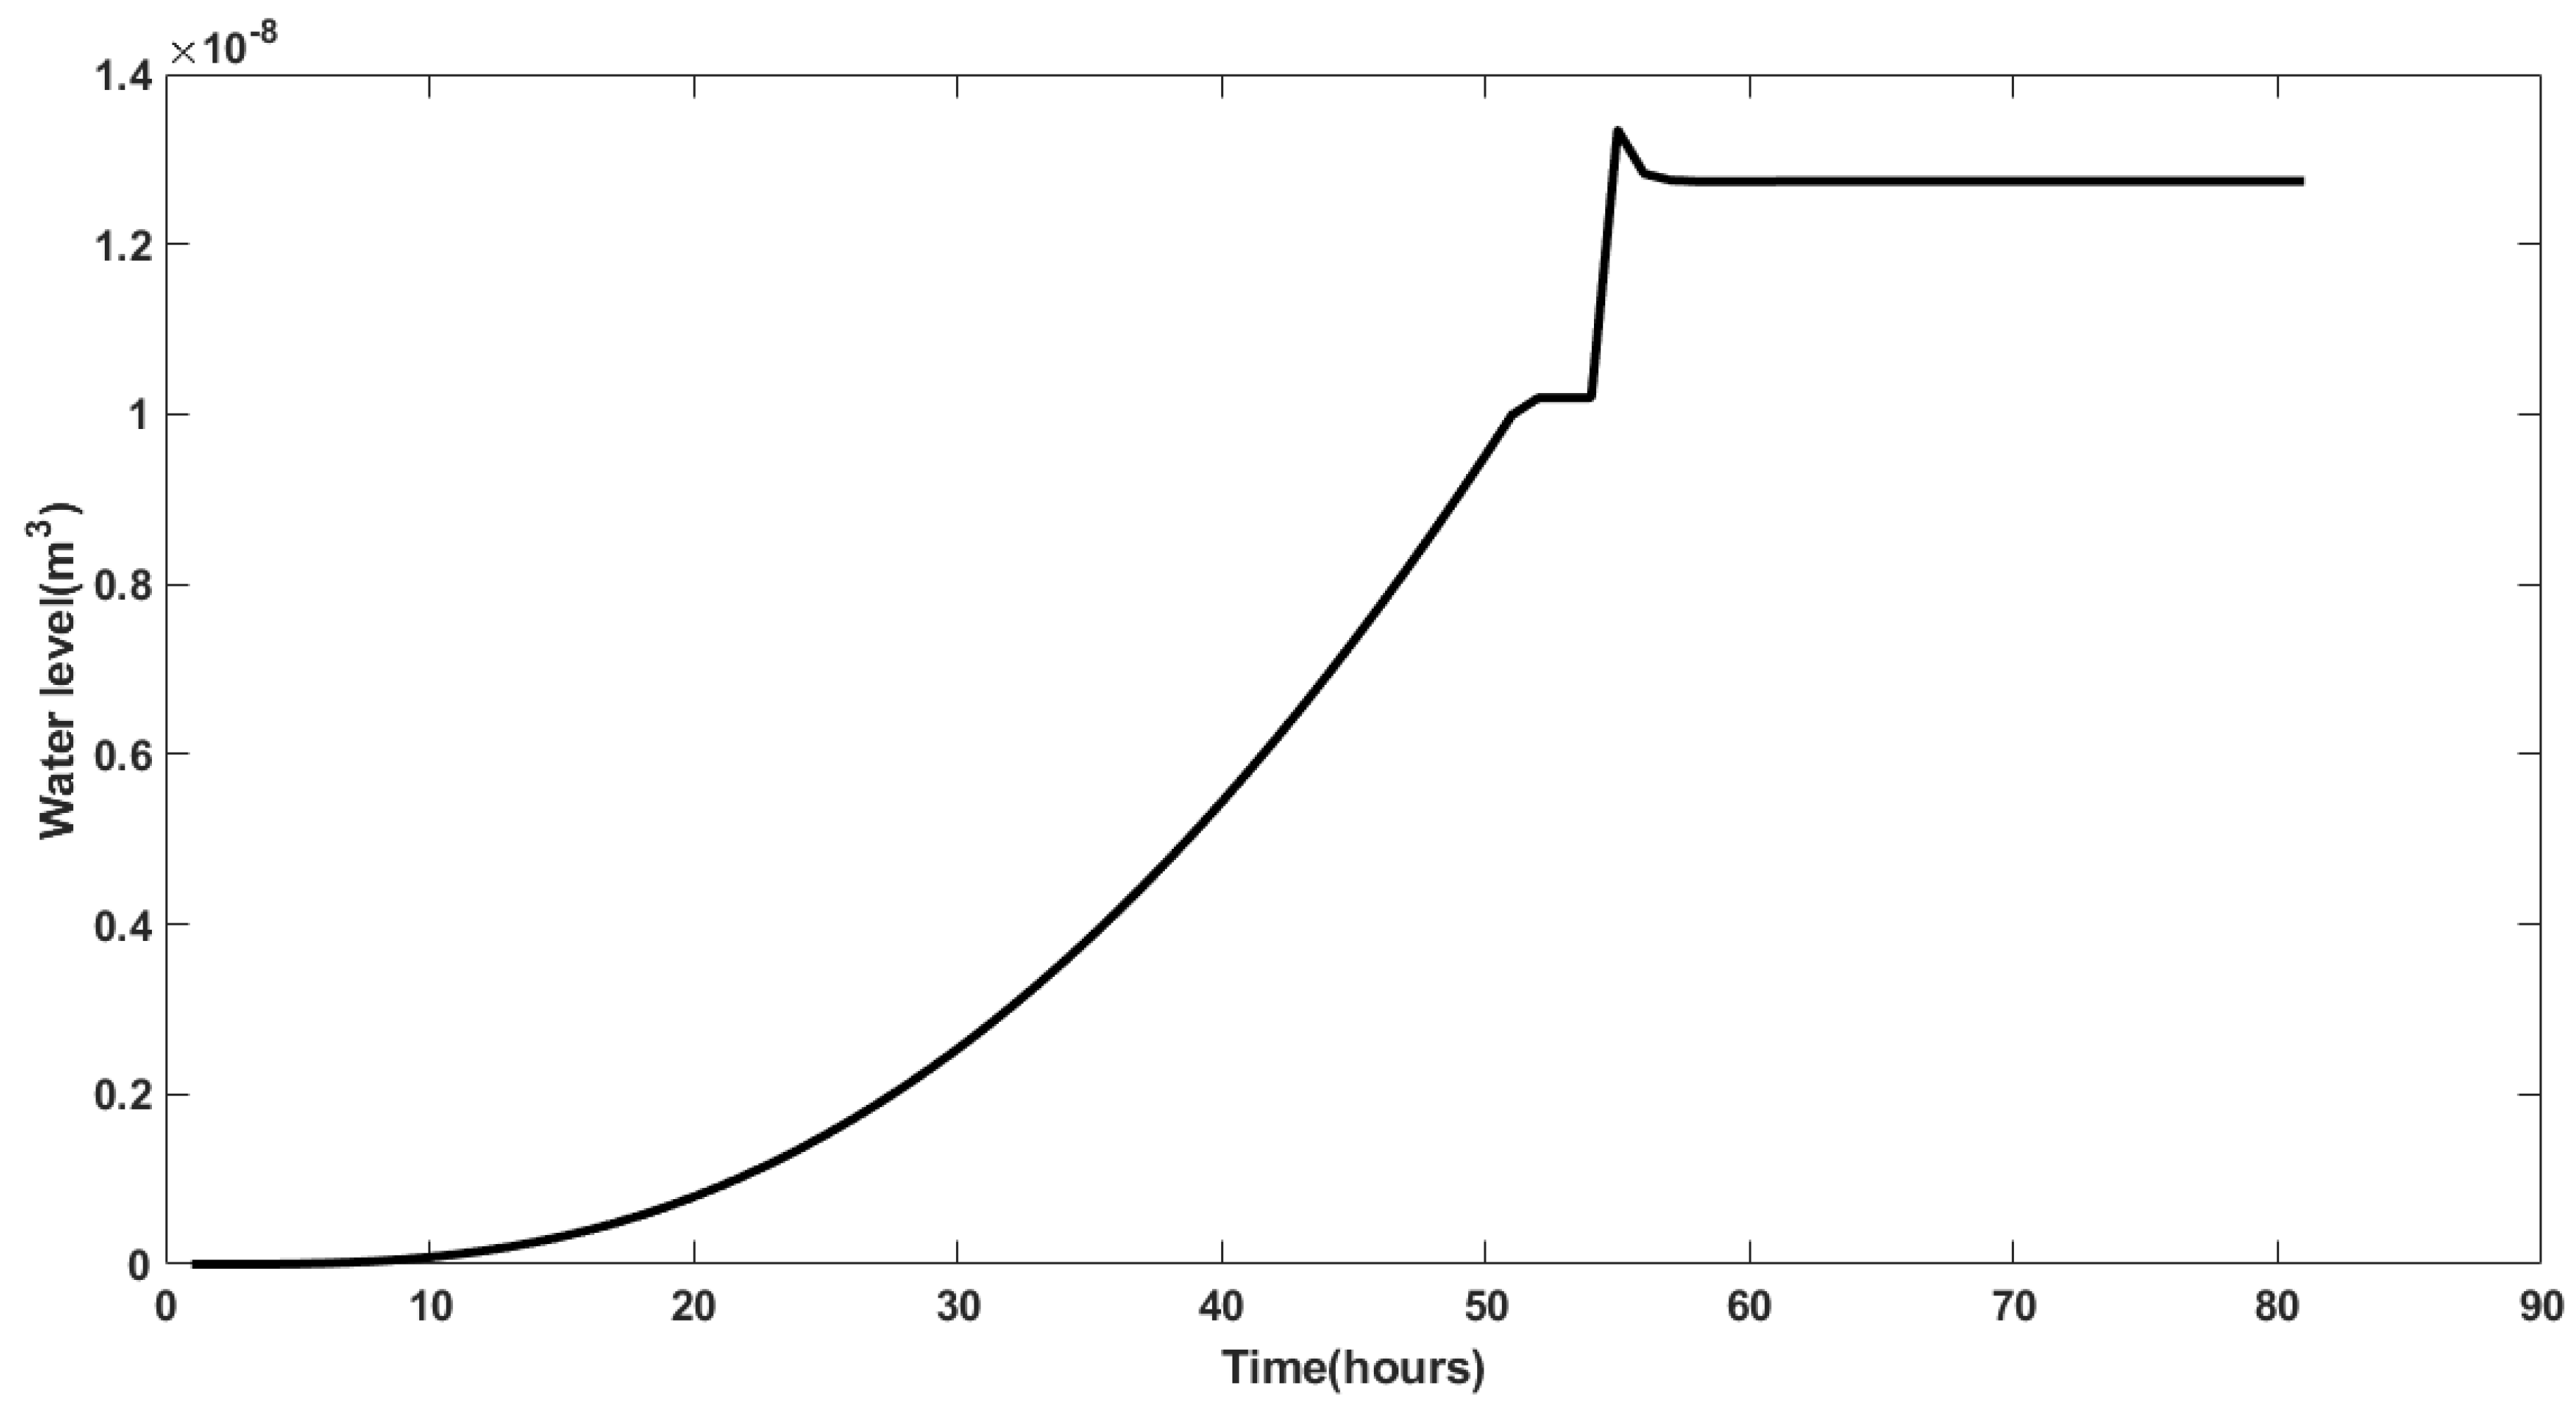
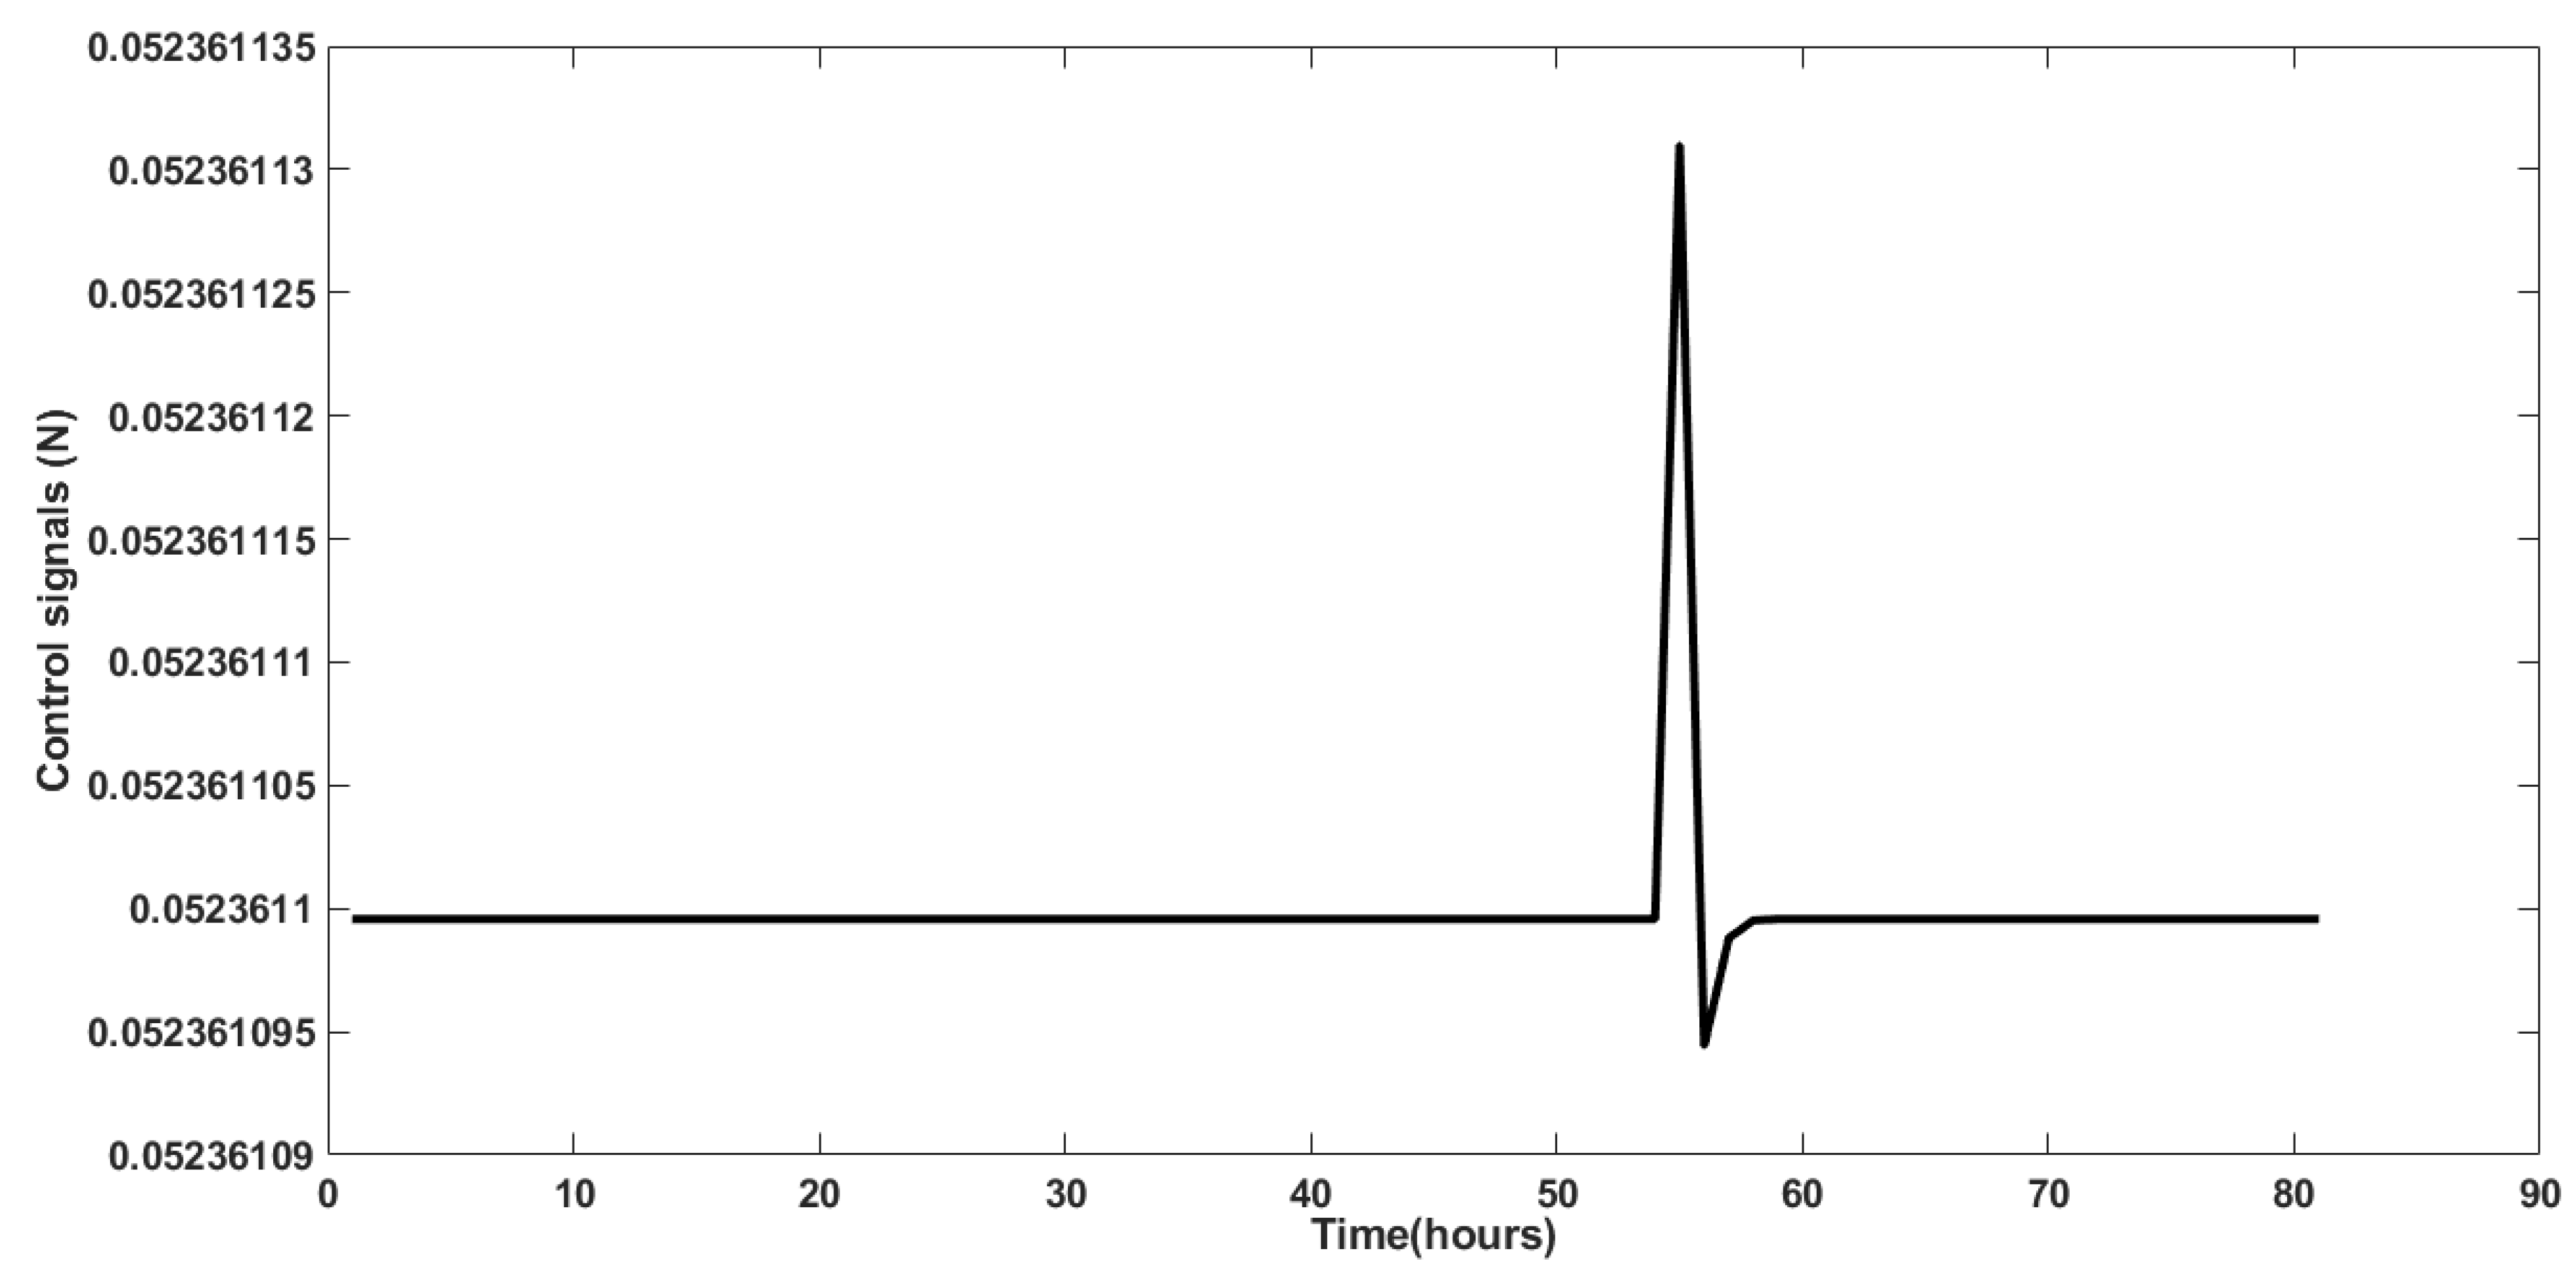
4. Results and Discussion
5. Conclusions
Author Contributions
Funding
Data Availability Statement
Conflicts of Interest
References
- FAO. The Future of Food and Agriculture: Alternative Pathways to 2050; Food and Agriculture Organization of the United Nations: Rome, Italy, 2018. [Google Scholar]
- von Braun, J.; Afsana, K.; Fresco, L.O.; Hassan, M.H.A. Science for transformation of food systems: Opportunities for the UN Food Systems Summit. In Science and Innovations for Food Systems Transformation; Springer: Berlin/Heidelberg, Germany, 2023; p. 921. [Google Scholar]
- Hopkins, I.; Farahnaky, A.; Gill, H.; Danaher, J.; Newman, L.P. Food neophobia and its association with dietary choices and willingness to eat insects. Front. Nutr. 2023, 10, 1150789. Available online: https://www.ncbi.nlm.nih.gov/pmc/articles/PMC10369065/ (accessed on 26 November 2023). [CrossRef] [PubMed]
- Tambo Tene, S.; Kohole Foffe, H.A.; Adebo, O.A.; Tantoh Ndinteh, D.; Tsopbeng Tsopzong, A.B.; Kenfack, J.O.; Kengne Kamdem, M.H.; Klang, J.M.; Womeni, H.M. Application of the response surface methodology (RSM) in the optimization of the fluidizing and sweetening capacities of sprouted flours of two maize varieties (Atp-Y and Coca-sr). Cogent Food Agric. 2023, 9, 2279724. [Google Scholar] [CrossRef]
- Lee, T.Y.; Reza, M.N.; Chung, S.O.; Kim, D.U.; Lee, S.Y.; Choi, D.H. Application of fuzzy logics for smart agriculture: A review. Precis. Agric. 2023, 5, 1. [Google Scholar]
- Sairoel, A.; Gebresenbet, G.; Alwan, H.M.; Vladmirovna, K.O. Assessment of Smart Mechatronics Applications in Agriculture: A Review. Appl. Sci. 2023, 13, 7315. [Google Scholar]
- Vijay Anand, R. Energy Efficient Cluster Head Using Modified Fuzzy Logic with WOA and Path Selection Using Enhanced CSO in IoT-Enabled Smart Agriculture Systems. Available online: https://www.researchsquare.com/article/rs-2946945/latest (accessed on 26 November 2023).
- Benyezza, H.; Bouhedda, M.; Kara, R.; Rebouh, S. Smart platform based on IoT and WSN for monitoring and control of a greenhouse in the context of precision agriculture. Internet Things 2023, 23, 100830. [Google Scholar] [CrossRef]
- Pradana, F.G.P.; Sarno, R.; Triarjo, S. Development of Smart Farming Control System based on Tsukamoto Fuzzy Algorithm. In Proceedings of the 2023 International Conference on Computer Science, Information Technology and Engineering (ICCoSITE), Jakarta, Indonesia, 16 February 2023; IEEE: Piscataway, NJ, USA, 2023; pp. 348–353. Available online: https://ieeexplore.ieee.org/abstract/document/10127754/ (accessed on 26 November 2023).
- Adli, H.K.; Remli, M.A.; Wan Salihin Wong, K.N.S.; Ismail, N.A.; González-Briones, A.; Corchado, J.M.; Mohamad, M.S. Recent Advancements and Challenges of AIoT Application in Smart Agriculture: A Review. Sensors 2023, 23, 3752. [Google Scholar] [CrossRef] [PubMed]
- Masood, F.; Khan, W.U.; Jan, S.U.; Ahmad, J. AI-enabled traffic control prioritization in software-defined IoT networks for smart agriculture. Sensors 2023, 23, 8218. [Google Scholar] [CrossRef] [PubMed]
- Obi Reddy, G.P.; Dwivedi, B.S.; Ravindra Chary, G. Applications of Geospatial and Big Data Technologies in Smart Farming. In Smart Agriculture for Developing Nations; Pakeerathan, K., Ed.; Advanced Technologies and Societal Change; Springer Nature: Singapore, 2023; pp. 15–31. [Google Scholar] [CrossRef]
- Sharma, R.P.; Dharavath, R.; Edla, D.R. IoFT-FIS: Internet of farm things based prediction for crop pest infestation using optimized fuzzy inference system. Internet Things 2023, 21, 100658. [Google Scholar] [CrossRef]
- Atheeswaran, A.; Raghavender, K.V.; Chaganti, B.L.; Maram, A.; Herencsar, N. Expert system for smart farming for diagnosis of sugarcane diseases using machine learning. Comput. Electr. Eng. 2023, 109, 108739. [Google Scholar] [CrossRef]
- Shamshiri, R.R.; Mahadi, M.R.; Ahmad, D.; Bejo, S.K.; Aziz, S.A.; Ismail, W.I.W.; Che Man, H. Controller design for an osprey drone to support precision agriculture research in oil palm plantations. In Proceedings of the 2017 ASABE Annual International Meeting, Spokane, WA, USA, 16–19 July 2017; pp. 2–13. [Google Scholar]
- Carlos, C.B.; Sendra, S.; Lloret, J.; Tomas, J. A smart decision system for digital farming. Agronomy 2019, 9, 216. [Google Scholar]
- Pati, R.K.; Paikray, H. Application of Artificial Intelligence in Fuzzy Logic for Crop Management in Agriculture. Available online: https://www.journal-dogorangsang.in/no_4_Book_21/191.pdf (accessed on 26 November 2023).
- Purwoko, J.T.; Wingardi, T.O.; Soewito, B. Smart Agriculture Water System Using Crop Water Stress Index and Weather Prediction. CommIT Commun. Inf. Technol. J. 2023, 17, 61–70. [Google Scholar] [CrossRef]
- Umam, F.; Dafid, A.; Cahyani, A.D. Implementation of Fuzzy Logic Control Method on Chilli Cultivation Technology Based Smart Drip Irrigation System. J. Ilm. Tek. Elektro Komput. Dan Inform. 2023, 9, 132–141. [Google Scholar]
- Alex, N.; Sobin, C.C.; Ali, J. A Comprehensive Study on Smart Agriculture Applications in India. Wirel. Pers. Commun. 2023, 129, 2345–2385. [Google Scholar] [CrossRef]
- Manikandan, R.; Ranganathan, G.; Bindhu, V. Deep Learning Based IoT Module for Smart Farming in Different Environmental Conditions. Wirel. Pers. Commun. 2023, 128, 1715–1732. [Google Scholar] [CrossRef]
- Karunathilake, E.; Le, A.T.; Heo, S.; Chung, Y.S.; Mansoor, S. The path to smart farming: Innovations and opportunities in precision agriculture. Agriculture 2023, 13, 1593. [Google Scholar] [CrossRef]
- Alakananda, M.; Vangipuram, S.L.T.; Bapatla, A.K.; Bathalapalli, V.K.V.; Mohanty, S.P.; Kougianos, E.; Ray, C. Everything you wanted to know about smart agriculture. arXiv 2022, arXiv:2201.04754. [Google Scholar]
- Junfang, Z.; Liu, D.; Huang, R. A Review of Climate-Smart Agriculture: Recent Advancements, Challenges, and Future Directions. Sustainability 2023, 15, 3404. [Google Scholar]
- Gupta, A.; Nahar, P. Sandpiper optimization algorithm with cosine similarity based cross-layer routing protocol for smart agriculture in wireless sensor network assisted internet of things systems. Int. J. Commun. Syst. 2023, 36, e5514. [Google Scholar] [CrossRef]


| Technologies | Goals | Business Processing Module | Alarm Notification Module | Data Control | Communication Protocol | Posting On Social Networks and Public Data |
|---|---|---|---|---|---|---|
| APOLLO | Controlling crop growth and conditions | Applicable, VRI estimation module | Applicable | Applicable, crop growth monitoring and crop yield estimation | Not applicable | Not applicable |
| SMART AKIS | Management Information | Not applicable | Not applicable | Applicable, flexible and adaptive platform of smart farming technologies | Not applicable | Applicable |
| SIG AGRO ASESOR | Crop SIG Manager | Applicable, VRF and VRI modules | Applicable | Applicable | Not applicable | Applicable |
| Agrivi | Applicable, Plan, monitor and analyze crop activities | Applicable, crop seasons and pest monitor alert | Applicable | Applicable, crop data and inputs cost management | Not applicable | Not applicable |
| Smart Water-Saving | Intelligent irrigation programmer with sensory connectivity | Not applicable | Not applicable | Applicable, soil moisture data acquisition | Applicable, private protocol | Not applicable |
| PLATEM PA | Applicable, Management Information with an intelligent VRF and VRI Open Data, Farmers/Providers and Social network | Applicable, business rule engine based on data acquisition and historical data | Applicable, notification module in multimedia platform | Applicable, historical data acquisition is represented in graphs and downloaded files | Communication protocol Implemented based on open standard protocol in VRF and VRI devices | Farmers and providers access on-line forums to post results, crop failures, alerts, crop yield, |
| Controller Algorithms | Advantages | Disadvantages | Applicable in Smart Agriculture? |
|---|---|---|---|
| PID | Simplicity, applicability, and reliability | Long tuning time | Yes, recommended |
| P | Easy to implement | Long settling time, steady state error | Partially, recommended |
| PD | Easy to stabilize, faster response than just P controller | Can amplify high frequency noise | Partially, recommended |
| PI | No steady state error | Narrower range of stability | Partially, recommended |
| MPC | Works effectively within constraints of the real actuator which are relatively narrow | Depends on complex algorithm that needs longer time than the other controller | Recommended |
| LQR | Simplicity, robustness, and flexibility | Only requires the knowledge of the system dynamics and the desired cost function. It does not depend on the initial conditions, disturbances, or uncertainties of the system | Recommended |
| Fuzzy logic | Flexibility, ease of implementation, robustness, and interpretability | Dependence on human expertise, difficulty in tuning, limited accuracy and computational complexity | Best recommended |
| Slide mode | Fast dynamic response, insensitivity to variations in plant parameters and external disturbance. | Chattering, which is a very high-frequency oscillation of the sliding variable around the sliding manifold | Recommended |
| Backstepping | Can accurately track the desired trajectory or setpoint, ensuring that the system behaves as intended | The high gain observed is needed to avoid full state measurement | Recommended |
| Adaptive | Improves performance and robustness | High cost is produced and the process is very complex. | Recommended |
| Machine learning | Improved accuracy, cost reduction, scalability, increased efficiency, data dependency, computational resources, sampling | Needs high training | Recommended |
| Specification of the Membership | Comparisons of the Memberships | Level of Estimating Probability |
|---|---|---|
| Singleton membership function | This assigns a membership value of 1 to a specific value of x. It is useful when the set has a single element [15]. | Good |
| Triangular membership function | This is one of the most widely used membership functions. It is used to model sets that have a triangular shape. The membership value increases linearly from 0 to 1 and then decreases linearly from 1 to 0 [16]. | Better |
| Trapezoidal membership function | This is similar to the triangular membership function, but it has a flat top. It is used to model sets that have a trapezoidal shape [17]. | Better |
| Gaussian membership function | This is used to model sets that have a bell-shaped curve. It is often used in statistics to model normal distributions [18]. | Excellent |
| Sigmoidal membership function | This is used to model sets that have an S-shaped curve. It is often used in artificial neural networks [19]. | Better |
| Generalized bell membership function | This is a generalization of the Gaussian membership function. It is used to model sets that have a bell-shaped curve, but with more flexibility [17]. | Best |
| Z-shaped membership function | This is used to model sets that have a Z-shaped curve. It is often used in control systems [18] | Better |
| Temperature | Opening Valve | |||
|---|---|---|---|---|
| Wet | Cold | Moderate | Dry | |
| Low | N2 | Z | P1 | P2 |
| Normal | Z | Z | P1 | P2 |
| High | P2 | P1 | Z | P2 |
| Input Parameters | Output Parameters | ||||||
|---|---|---|---|---|---|---|---|
| Temperature (Celsius) | Water Vapor per Kg | ADH Values | Water Level Sensors (cm3) | Moisture in Sounding (%) | Pump Flow (%) | Outflow (Q/s) | Valve Opening (rad/s) |
| 27 | 10 | 750 | 73.31 | 34.72 | 4.494 | 0.025 | 0.5 |
| 20 | 10 | 500 | 48.88 | 45.87 | 3.275 | 0.025 | 0.5 |
| 10 | 10 | 300 | 29.33 | 84.75 | 1.424 | 0.025 | 0.5 |
| 0 | 0 | 50 | 4.888 | 555.5 | 6.718 | 0.025 | 0.5 |
| 0 | 20 | 50 | 4.888 | 1111 | 6.718 | 0.03082 | 0.5 |
| 40 | 10 | 1000 | 97.75 | 23.92 | 4.008 | 0.025 | 0.5 |
| Specification Parameters | Current Work | Previous Work [2,3,4] | Change (%) (Current Work over Previous Work) |
|---|---|---|---|
| Rise time (s) | 0.8 | 1.2 | 33.3 |
| Settling time (s) | 0.012 | 1.04 | 98.8 |
| Peak time (s) | 0.13 | 1.2 | 89.2 |
| Temperature (Celsius) | 27 | 27 | 0 |
| ADH values | 750 | 750 | 0 |
| Moisture in sounding (%) | 34.72 | 30 | 15.7 |
| Pump flow (%) | 4.494 | 3.5 | 28.4 |
| Outflow (Q/s) | 0.025 | 0.025 | 0 |
| Valve opening (rad/s) | 0.5 | 0.33 | 51.51 |
Disclaimer/Publisher’s Note: The statements, opinions and data contained in all publications are solely those of the individual author(s) and contributor(s) and not of MDPI and/or the editor(s). MDPI and/or the editor(s) disclaim responsibility for any injury to people or property resulting from any ideas, methods, instructions or products referred to in the content. |
© 2024 by the authors. Licensee MDPI, Basel, Switzerland. This article is an open access article distributed under the terms and conditions of the Creative Commons Attribution (CC BY) license (https://creativecommons.org/licenses/by/4.0/).
Share and Cite
Amertet Finecomess, S.; Gebresenbet, G.; Alwan, H.M. Utilizing an Internet of Things (IoT) Device, Intelligent Control Design, and Simulation for an Agricultural System. IoT 2024, 5, 58-78. https://doi.org/10.3390/iot5010004
Amertet Finecomess S, Gebresenbet G, Alwan HM. Utilizing an Internet of Things (IoT) Device, Intelligent Control Design, and Simulation for an Agricultural System. IoT. 2024; 5(1):58-78. https://doi.org/10.3390/iot5010004
Chicago/Turabian StyleAmertet Finecomess, Sairoel, Girma Gebresenbet, and Hassan Mohammed Alwan. 2024. "Utilizing an Internet of Things (IoT) Device, Intelligent Control Design, and Simulation for an Agricultural System" IoT 5, no. 1: 58-78. https://doi.org/10.3390/iot5010004
APA StyleAmertet Finecomess, S., Gebresenbet, G., & Alwan, H. M. (2024). Utilizing an Internet of Things (IoT) Device, Intelligent Control Design, and Simulation for an Agricultural System. IoT, 5(1), 58-78. https://doi.org/10.3390/iot5010004